
Dynamic Response of Phase Change Heat Exchange Unit with Layered Porous Media for Pulsed Electronic Equipment

1
College of Energy and Power Engineering, Nanjing University of Aeronautics and Astronautics, Nanjing 210016, China
2
College of Astronautics, Nanjing University of Aeronautics and Astronautics, Nanjing 210016, China
*
Author to whom correspondence should be addressed.
Aerospace 2024, 11(5), 331; https://doi.org/10.3390/aerospace11050331
Submission received: 11 February 2024
/
Revised: 15 April 2024
/
Accepted: 17 April 2024
/
Published: 23 April 2024
(This article belongs to the Section Aeronautics)
Abstract
:Effective heat dissipation challenges transient high-power electronic devices in hypersonic vehicle cabins. This study introduces a Phase Change Heat Exchange Unit with Layered Porous Media (PCHEU–LPM) employing pulsed heat flow at the top and forced convection at the bottom. The primary aim was a comparative parametric study analyzing the thermal response of the heating surface under pulsed heat flow conditions. The geometric model was generated using electron microscopy images of manufactured objects and the numerical model was established based on the enthalpy–porosity method. Numerical simulations explored amplitude and frequency effects on pulsed thermal excitation, evaluating temperature and phase fields. A comprehensive time-frequency transformation assessed the temperature response. The results indicated an initial decrease and subsequent increase in interface temperature fluctuation with pulse heat flux amplitude growth. Temperature field uniformity correlated with natural convection strength in two-phase and liquid-phase regions. At mid and low frequencies, the phase change process increasingly suppressed interface temperature fluctuations. Optimal pulse thermal excitation selection was crucial for minimizing temperature fluctuations while maintaining the interface temperature within the expected phase transition range. In conclusion, a novel design concept is posited herein, aiming to enhance surface temperature uniformity and broaden the applicability of electronic devices through the manipulation of porosity rates.
1. Introduction
Electronic devices, such as chips or semiconductors, showcase remarkable performance attributes, encompassing speed, flexibility, accuracy, and resistance to electromagnetic interference. These qualities render them essential components in the onboard electronic systems of hypersonic aircraft. Nevertheless, at high Mach numbers, substantial aerodynamic heating is encountered by hypersonic aircraft on their surfaces, creating a more formidable thermal dissipation challenge within compartments. The inadequacy of the thermal sink introduces novel complexities in the cooling and heat dissipation of pulsed electronic devices [1].
The primary focus of traditional heat sink design processes is the maintenance of the heat source within a safe temperature range, often overlooking the importance of temperature stability. In response to this context, PCM heat sinks have emerged as a viable solution [1]. With their nearly isothermal properties during the phase change process, temperature fluctuations in electronic equipment can be effectively mitigated through careful design [2,3,4,5,6]. They can be specifically tailored to suppress temperature fluctuations in electronic devices.
In the past, low-temperature PCMs were unsuitable for cooling electronic equipment due to their low thermal conductivity. Consequently, research on phase change heat transfer predominantly focused on the thermal enclosure of buildings [7,8,9], refrigeration and cooling [10,11,12,13], and aerospace battery heat storage [14,15]. However, the recent development of innovative PCM fabrication technology has significantly improved the thermal conductivity of these materials [16,17]. This advancement has led to investigations of phase change heat transfer under more intense transient conditions.
In this context, Casano et al. [18] have investigated phase change heat transfer problems in scenarios where transient effects are more intense. The findings reveal that, for relatively small Fourier (Fo) numbers, the heat flow absorbed by the phase change material remains nearly constant, independent of the Stefan (Ste) number, and does not oscillate due to excitation. However, for larger Fo numbers, the phase change material oscillates periodically with pulsed thermal excitation, with the amplitude of oscillation increasing with the Ste number. In another study, Kalbasi et al. [19] conducted numerical research on a two-dimensional phase change material heat sink structure with fins. The authors focused on optimizing the geometrical parameters of the heat sink and demonstrated that a larger aspect ratio of the phase change material heat sink structure results in lower temperature oscillations under thermal excitation, thus facilitating temperature control. Moreover, the effectiveness of thermal control devices in regulating temperature depends on the phase change temperature range of the phase change material and the fluctuation range of outdoor temperature. When the phase change temperature range was proportional to the outdoor temperature fluctuation range, the phase change material could effectively reduce energy consumption and enhance temperature control performance. The authors also used the heat balance integration method to establish an approximate analytical relationship between the phase interface position and thermal parameters under specific conditions [20]. The results indicated that the evolution of the phase interface was a highly nonlinear problem influenced by the combined effects of the amplitude of the periodic temperature boundary, the phase change material’s temperature response amplitude and frequency, the Bekele (Pe) number, and the equivalent thermal conductivity corresponding to the phase change material thickness.
The cited references [15,16,17,18,19,20,21] extensively investigated the heat storage process of PCM. However, advanced high-power electronic devices demand significantly enhanced heat dissipation capabilities. Consequently, heat sinks often necessitate active cooling techniques, such as forced convection, to mitigate heat buildup and subsequent temperature elevations. The amalgamation of phase change heat sinks with active cooling methods has garnered limited research attention, particularly when confronted with intricate transient pulse heat excitation scenarios. An exploration of the optimal conditions for PCM concerning varying pulse amplitudes and frequencies remains outstanding. In complement to these research endeavors, the primary objective of this study was to conduct an exhaustive parametric analysis concerning the impacts of pulse heat flux amplitude and frequency variations on temperature fields, phase fields, and interface temperature responses.
In this study, a mathematical model for the three-dimensional heat transfer structure of PCHEU–LPM was constructed. The configuration was designed to absorb transient pulse heat flux at one extremity while mitigating it through forced convection cooling at the opposing end. A parameter study was then undertaken to analyze the impact of variations in pulsed heat flux amplitude and frequency on the temperature and phase fields within the PCHEU–LPM system. These insights were employed to establish a correlation between the amplitude and frequency of external thermal excitation applied to the PCM. The correlation was determined by examining the resulting temperature response at the heating surface through time–frequency transformation methodologies. Through these investigations, this paper aims to elucidate the thermal response characteristics of PCMs under intricate boundary conditions and determine the optimal amplitude and frequency ranges for the design of heat sink systems incorporating high thermal conductivity PCMs.
2. Methodology
2.1. Physical Model
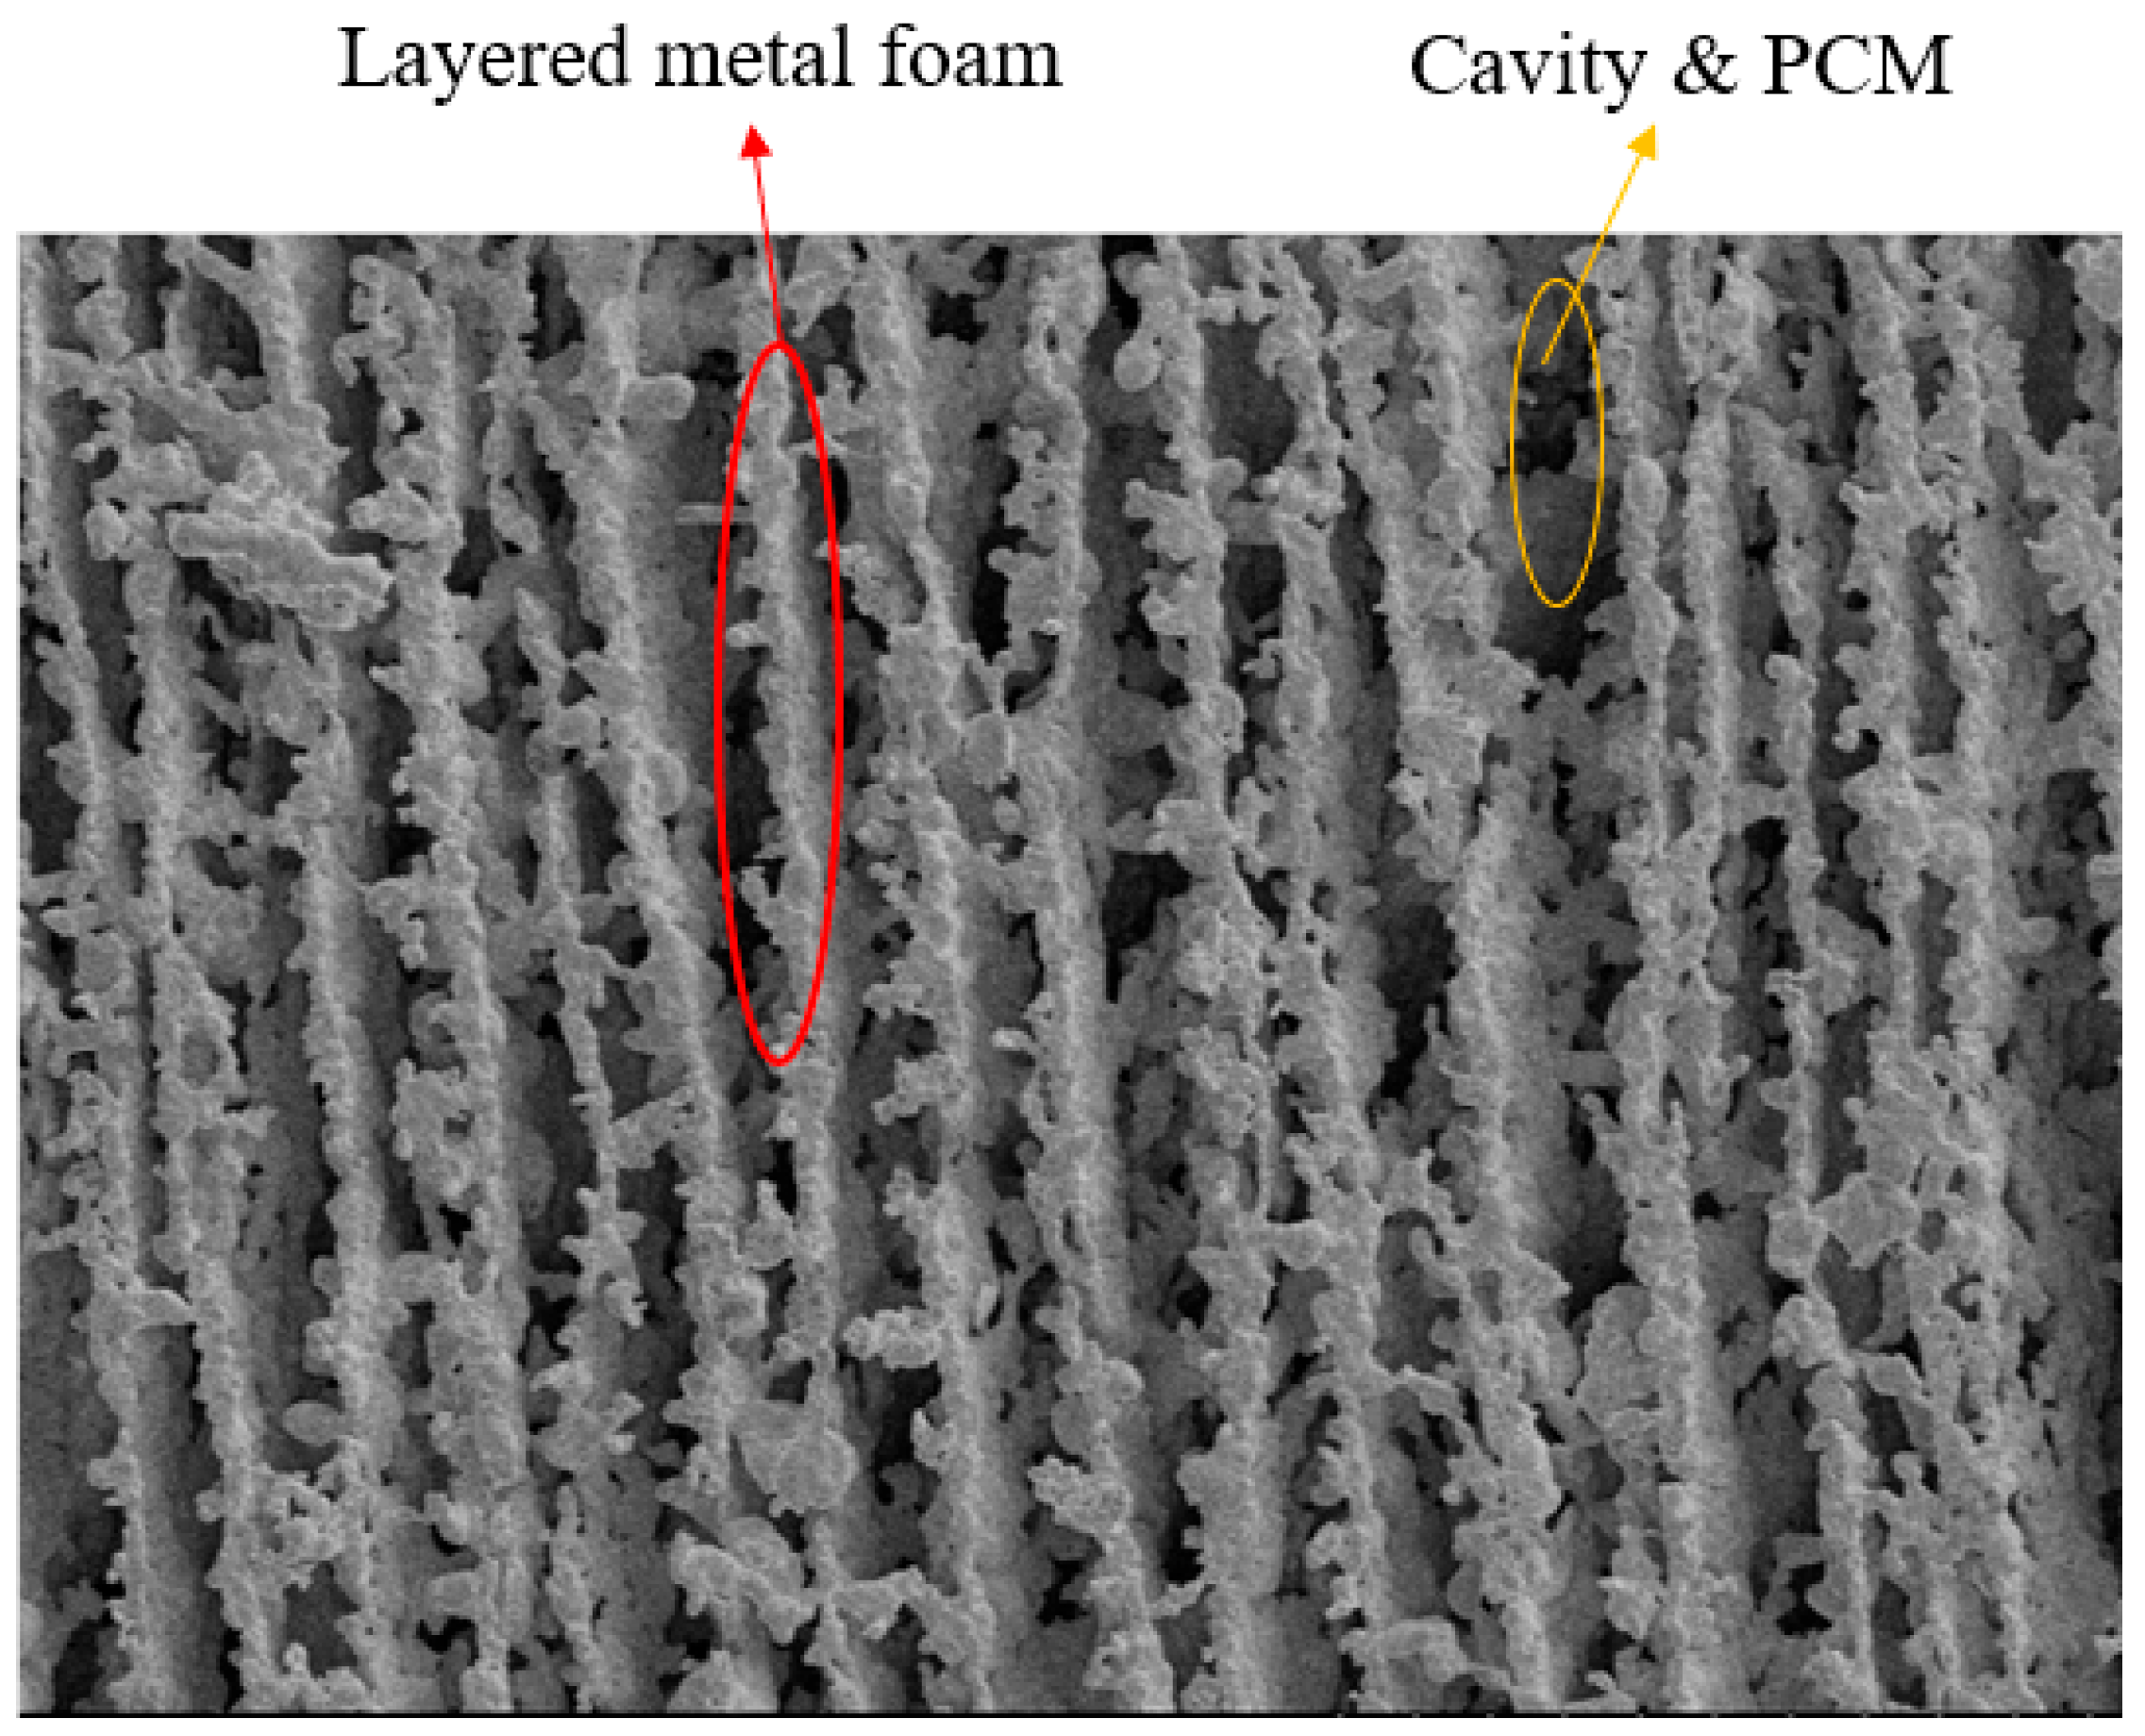
Solidification casting, also known as cryogenic casting or ice templating, represents a controlled biomimetic porous material fabrication technique. Through this methodology, the directed generation of specific morphologies in porous structures is achieved, thereby enabling the realization of composite phase change materials with commendable thermal conductivity and latent heat performance [21]. In this study, a lamellar porous medium structure was employed, and microphotographs illustrating the specific morphological features are depicted in Figure 1. The copper-based metal framework was aligned parallel to the heat transfer direction, maximizing thermal conduction. Cavity interstices between layers were filled with paraffin, characterized by high latent heat and a low phase transition temperature, serving as the phase change material. Figure 2 illustrates the processed and shaped PCHEU–LPM, constituting a rectangular prism with dimensions of 40 mm × 12 mm × 7 mm. The top surface was subjected to pulsed thermal flux loading while forced convection heat dissipation was applied to the bottom surface, with specific parameters outlined in Table 1.
2.2. Governing Equations
2.2.1. Governing Equations for the Porous Medium Framework
The thermal process necessitated the formulation of certain assumptions prior to constructing the heat transfer model. These assumptions are enumerated as follows:
- (1)
- The framework material is copper.
- (2)
- The porous medium exhibits isotropy in all directions.
- (3)
- Uniform pore density and constant porosity. The heat transfer within the copper framework is mathematically articulated through the energy control equation, as denoted by Equation (1).
In the aforementioned equation, the subscript g denotes the physical properties pertaining to the framework, while the subscript p denotes the physical properties associated with the phase change material.
2.2.2. Governing Equations for the PCM
Before constructing the heat and mass transfer model for phase change materials, the following assumptions were made:
- (1)
- The phase change material is pure paraffin.
- (2)
- The internal structure of the phase change material is isotropic.
- (3)
- The post-melting flow of the phase change material is laminar, incompressible, and includes a mushy zone during the phase transition.
- (4)
- The physical properties of paraffin remain constant in the solid and liquid phases, independent of temperature, while linearly varying in the mushy zone.
- (5)
- Post-melting paraffin adheres to the Boussinesq assumption, wherein density changes only affect the volume force term in the momentum equation.
- (6)
- The influence of surface tension is neglected.
Based on these assumptions, continuity, momentum, and energy equations were established to elucidate the heat and mass transfer processes of the phase change material. The continuity equation is expressed as follows:
Momentum equation:
In the aforementioned equation, the buoyancy force influenced by gravity only varies in the v-direction. Here, represents the viscosity of the PCM, represents the unit vector, denotes the phase change temperature of the PCM, and denotes the body force terms in the momentum equation, defined as follows:
The parameter was introduced to ensure the meaningfulness of the definition when the PCM was in the solid phase. Typically assigned a minute value, such as 10−10, this parameter preserves the integrity of the expression under such conditions. Additionally, serves as a damping parameter, ensuring the continuity of the momentum equation across the two-phase region. It uniformly varied from 107 to 104 as the liquid fraction ε ranged from 0 to 1.
Energy equation:
In the aforementioned equation, represents the latent heat of phase transition from solid to liquid.
2.3. Mesh Model
Based on the microphotograph in Figure 1, a simplified geometric model was established, as illustrated in Figure 3. Based on the simplified geometric model, a thermal model was established in Comsol 5.6 software and grid divisions were performed. The grid was divided according to the solid domain and fluid domain, as shown in Figure 4a,b. The grid elements were triangular with a maximum size of 0.774 mm and a minimum size of 0.0157 mm. Mesh refinement was applied at the fluid–solid coupling interface with a boundary layer grid refinement of 5 layers and a growth rate of 1.2, with the first layer thickness set to 0.311 mm. When grid division was performed for the thermal model, grid refinement was applied at the fluid–solid coupling interface, with a minimum thickness of the boundary layer of 0.311 mm, resulting in a total of 113,981 grid elements. The average grid quality was 0.758 and the minimum element area was 0.223 mm2. Grid independence was assessed by controlling the maximum value of different grid sizes and evaluating the average liquefaction rate based on different grid sizes. The results of the grid independence test are shown in Figure 5. From Figure 5, it can be observed that when the maximum grid length was ≤0.3 μm, the average liquefaction rate φav no longer changed; thus, this value was selected as the maximum length of the grid model.
2.4. Model Validation
To validate the effectiveness of the thermal model’s computational approach, this study first configured the thermal model according to the materials, physical parameters, and boundary conditions outlined in reference [22]. The average melting rate calculated using the methodology employed in this study was compared with the experimental results from reference [22], as shown in Figure 6. Furthermore, the evolution of the dimensionless position of the phase interface over time, obtained from the computational results, was compared with the simulation results from reference [22], as depicted in Figure 7. From the results presented in Figure 6 and Figure 7, it is evident that the computational outcomes obtained using the model established in this study, along with the corresponding computational methods, exhibited good agreement with the simulation and experimental results in the reference, with discrepancies not exceeding 5%. Consequently, the model developed in this study, along with its associated computational methods, is considered to be effective.
Furthermore, practical experimental measurements of the effective thermal conductivity for PCHEU–LPM were conducted, as illustrated in Figure 8. The experimentally determined effective thermal conductivity was found to be 12.9 W/(m·K), with a deviation of 15.6% compared to the simulation results, as shown in Figure 9. The experimental results indicate that the thermal model slightly overestimated the effective thermal conductivity compared to the actual value. This discrepancy arose from the presence of a certain thermal contact resistance between the metal framework and PCM in reality that was neglected in the simulation.
3. Simulation Results and Discussion
The rectangular prism-shaped PCHEU–LPM, as described in Section 2.1, was selected as the object of this study. The porosity of the PCM and porous composite material was set at 70%, with the porous matrix having a density of 7093 kg/m3 and constant pressure heat capacity of 385 J/(kg·K) and the PCM-filled pores having a reference density of 910 kg/m3. Adhering to the Boussinesq assumption, the density variation rate with temperature was 0.011, the constant pressure heat capacity was 2130 J/(kg·K), and the latent heat was 220 kJ/kg. The inlet temperature of the cooling agent at the bottom of the PCHEU–LPM was 293 K, with an inlet velocity of 0.4 m/s. At the top, a pulsating heat flux was applied with a pulse period of 50 s and a duty cycle of 0.5. Through simulation calculations, varying the amplitude and frequency of the heat flux applied at the top of the PCHEU-LPM yielded temperature responses at the heated interface. This enabled the identification of thermal boundary conditions corresponding to minimized temperature fluctuations.
3.1. Variation in Heat Flow Amplitude
The applied external heat flux amplitude, denoted as , varied in the range of 6 × 10⁵ W/m2 to 1.4 × 10⁶ W/m2 at the top of the PCHEU–LPM. To explore the correlation between damping properties in the two-phase region and pulse heat excitation, we utilized the Fast Fourier Transform (FFT) method to analyze the amplitude–frequency and phase–frequency characteristics of the PCM heat transfer process. This facilitated a comprehensive understanding of the frequency–domain features of the PCM heat transfer system under intricate boundary conditions. Employing Fourier transforms on the input signal (χ(N)) and output signal (ζ(N)), the frequency–domain characteristics (σ(N) = ζ(N)/χ(N)) of the PCM heat transfer system are depicted in Figure 10. Additionally, the phase–frequency characteristics are presented as σ(N), with the phase angle difference between χ(N) and σ(N) denoted as Angle(σ(N)) − Angle(χ(N)). Figure 10a showcases the baseline temperature response at 0 Hz, which escalated with increasing heat excitation amplitude. In Figure 10b, within the low-frequency sampling range of 0 to 0.05 Hz, the surface temperature transformed into a series of superimposed waves with varying amplitudes. Notably, the amplitude–frequency characteristics prominently dominated around 0.01 Hz, closely aligning with the 0.01 Hz pulse heat flow frequency at the top of the heat sink. Amplitude comparisons at this frequency revealed an initial decrease followed by an increase, mirroring the interface temperature response. This suggests that the phase change process attenuated the amplitude of external heat flow, with the damping effect gradually weakening as phase change saturation progressed. Turning to Figure 10c, representing the high-frequency sampling range from 0.05 to 0.5 Hz, amplitudes gradually diminished to negligible levels, indicating minimal influence on the final results and they were thus disregarded.
Figure 11 presents the phase–frequency characteristics of the thermal response of the heat transfer system, indicating the phase angle difference between the pulse heat input and the corresponding temperature response in the phase change heat transfer system. The phase–frequency curve corresponding to the 1 × 10⁶ W/m2 heat excitation serves as a reference for comparison. The results demonstrate that increasing the amplitude of external heat excitation led to more frequent oscillations in the phase–frequency characteristics, transforming the system into a higher-order phase change heat transfer system, with the system’s damping characteristics gradually diminishing.
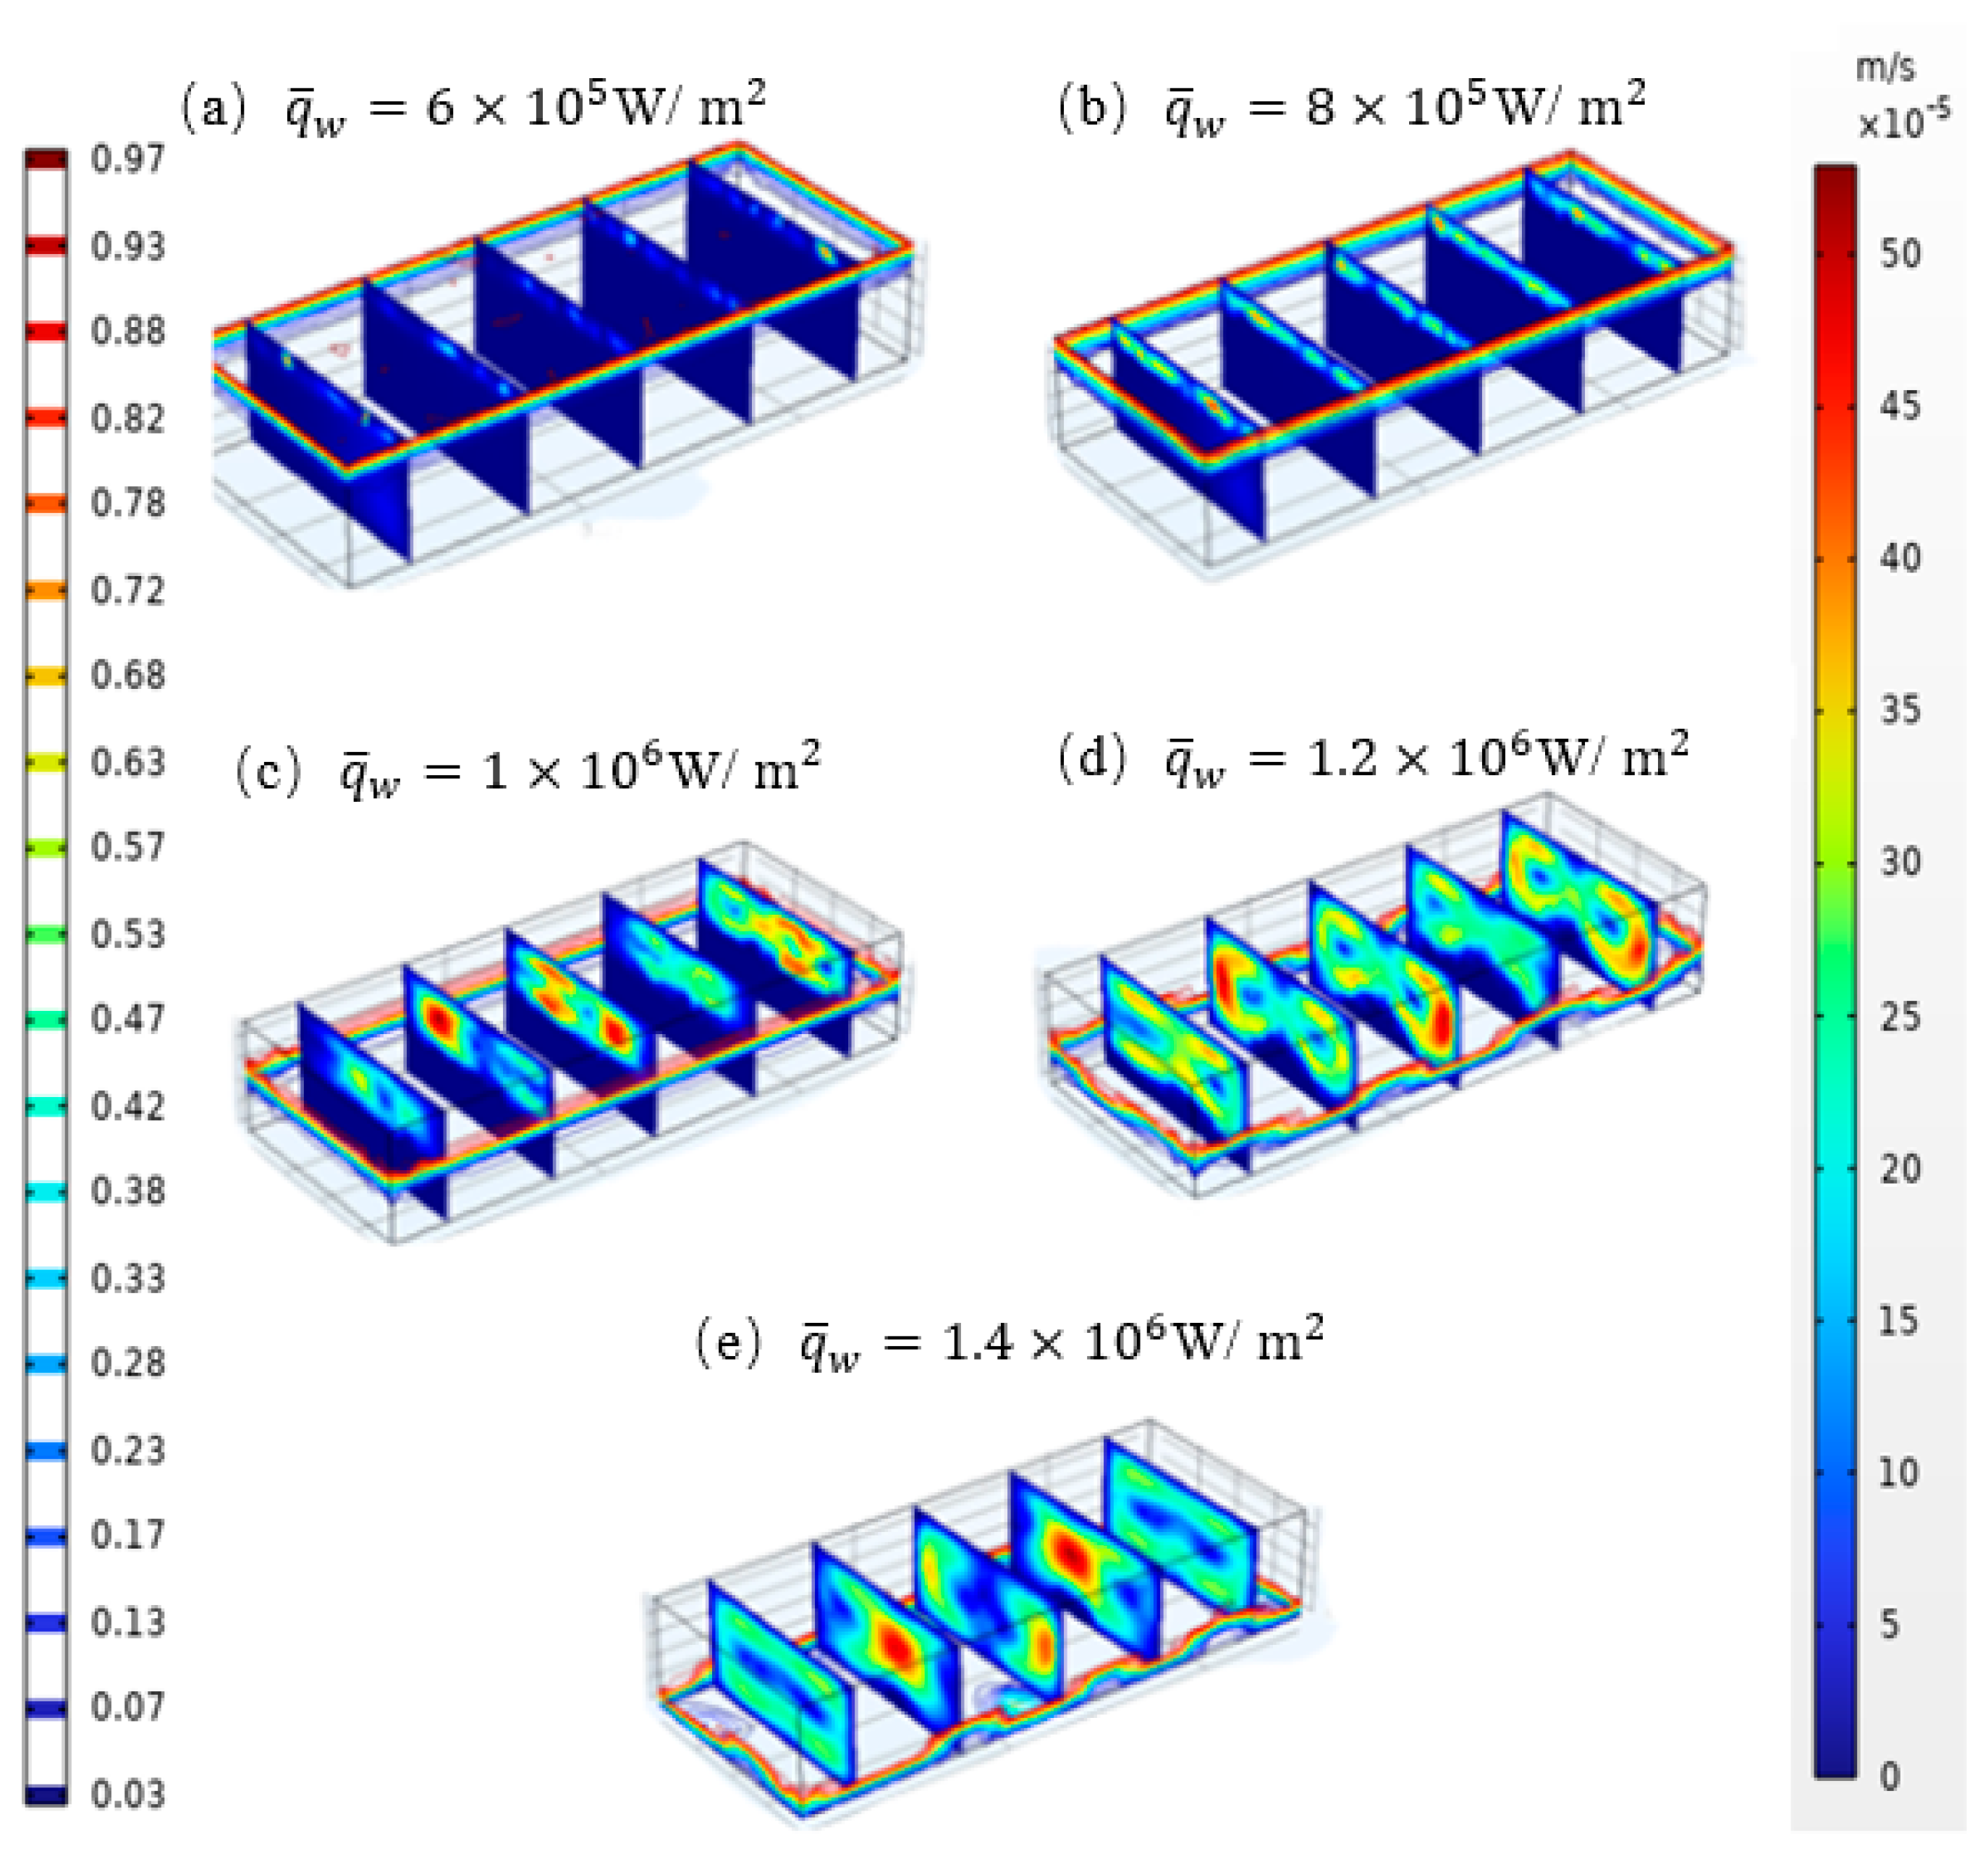
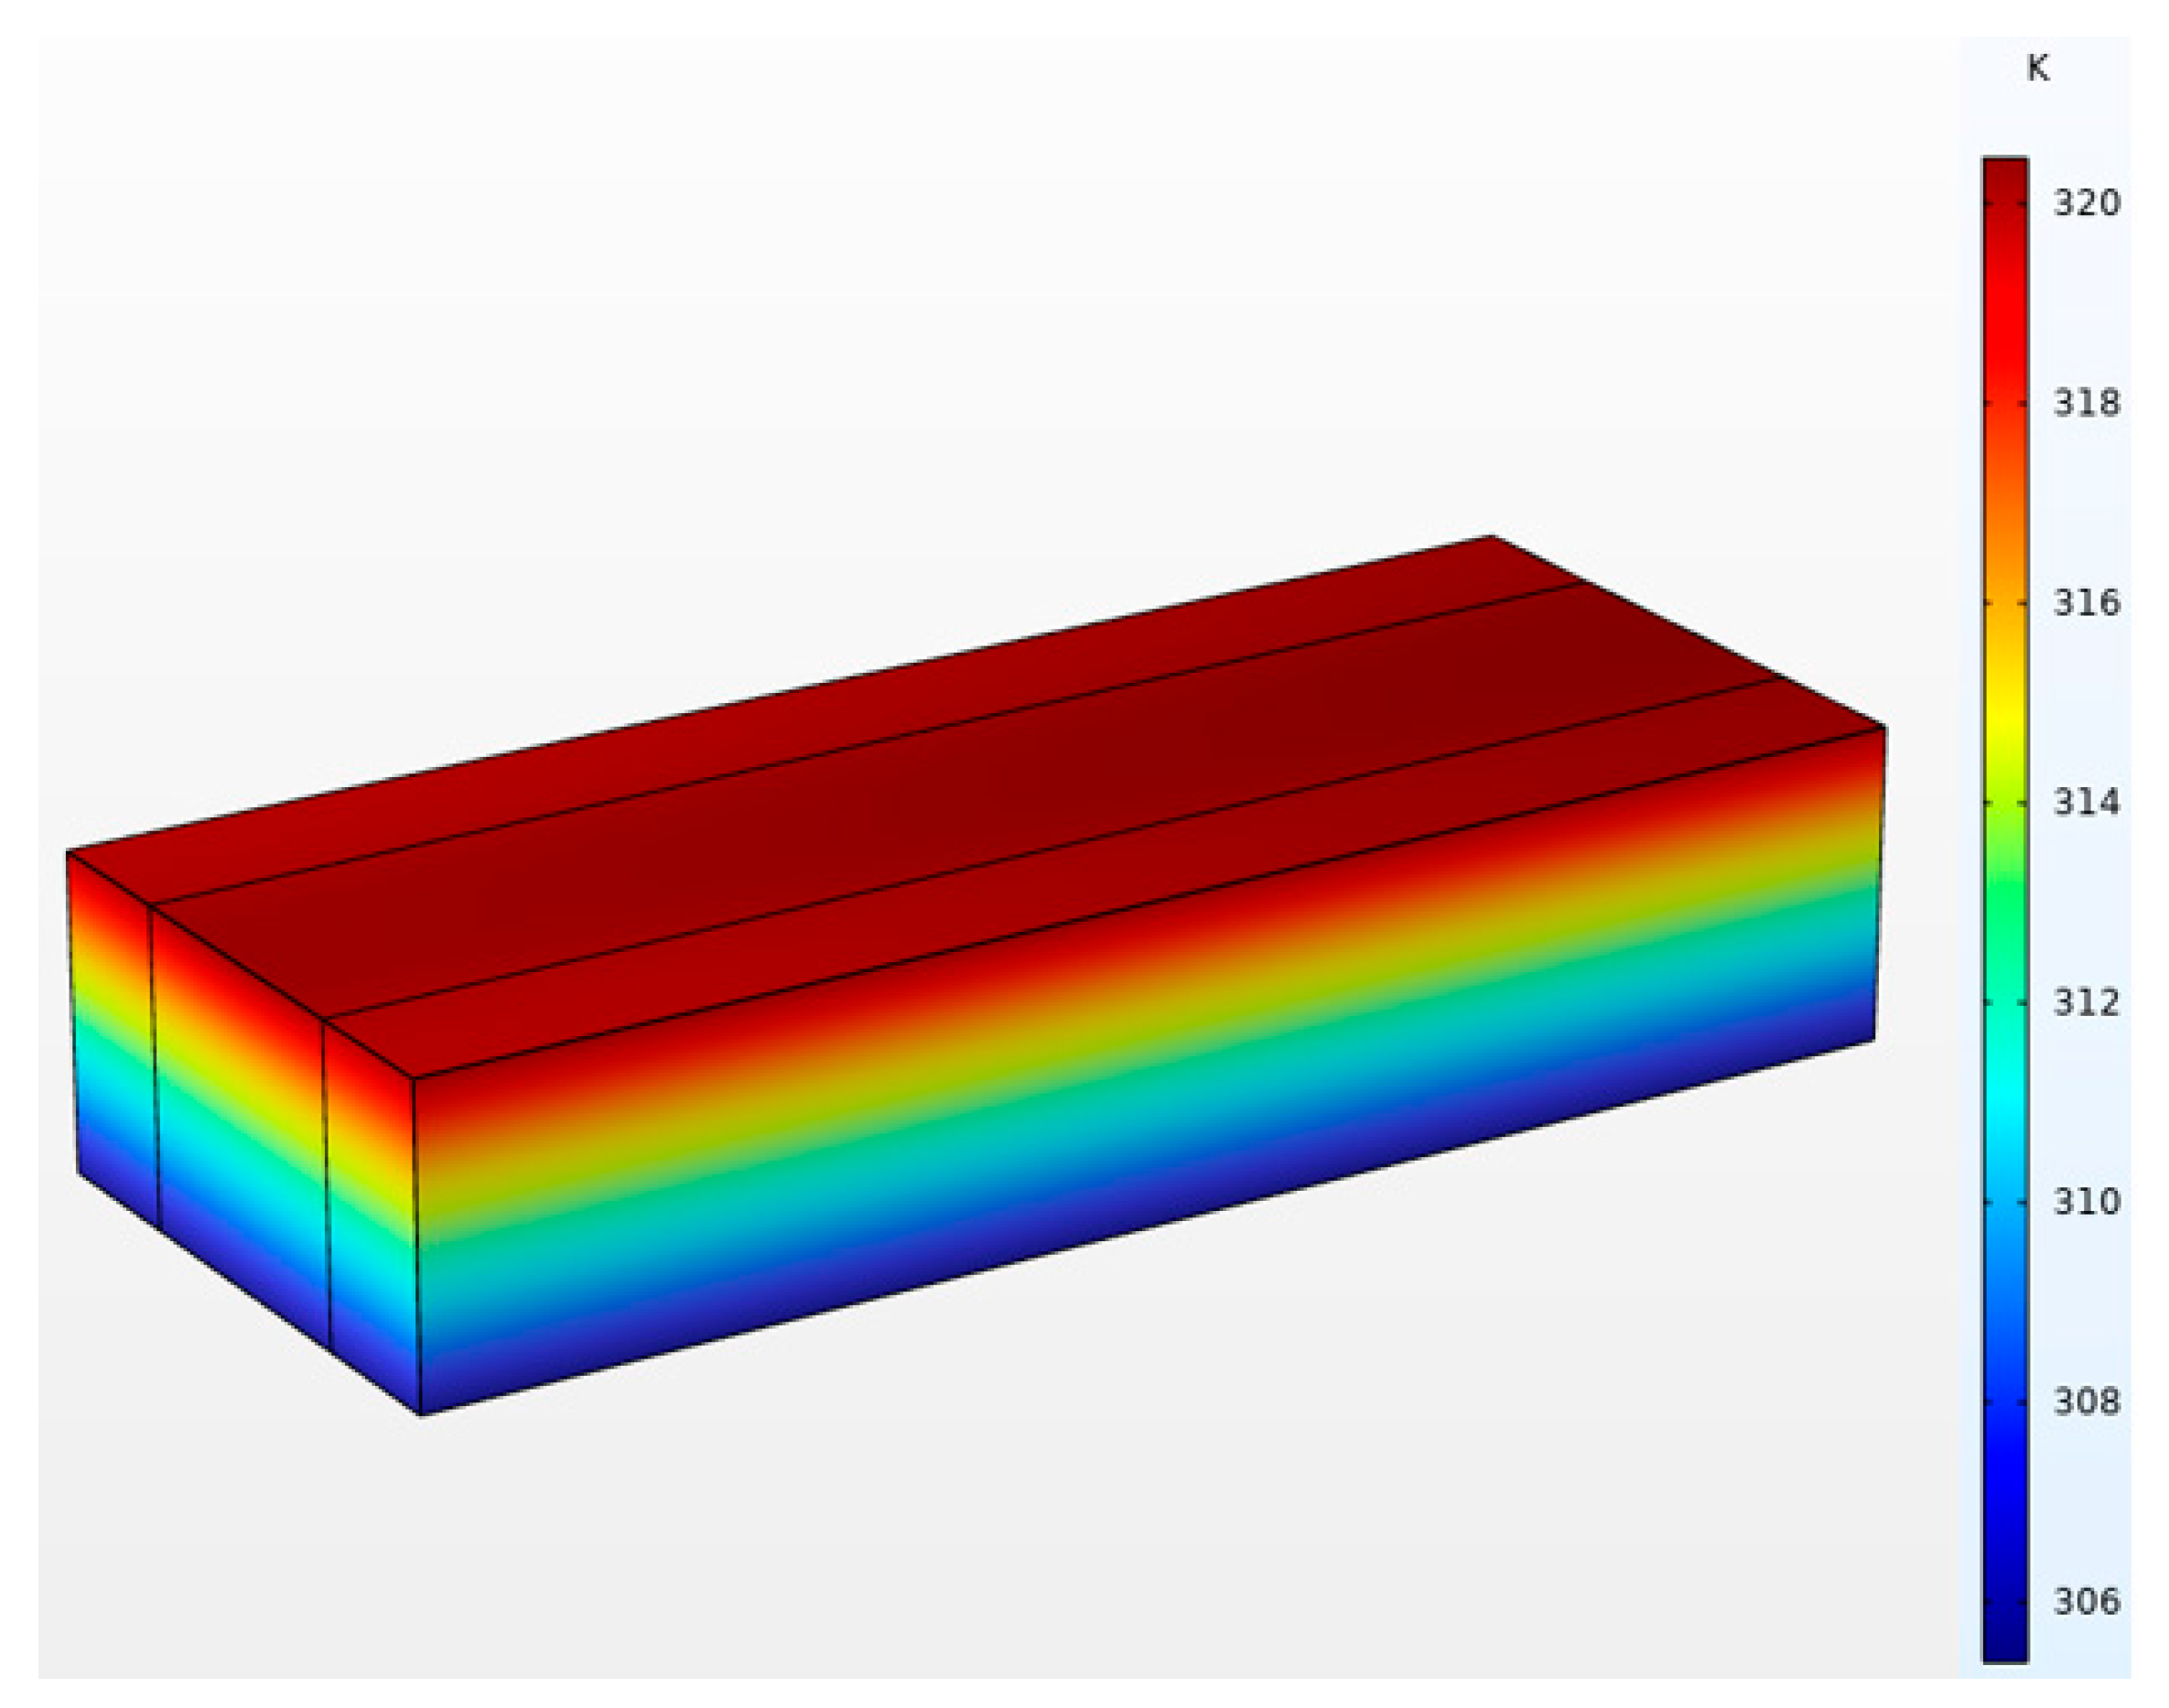
Figure 12 depicts the three-dimensional temperature field nephogram of the PCHEU–LPM at 450 s, corresponding to the peak moment of the last pulse heat excitation. Figure 13 presents the velocity field nephogram and phase field contour map of the PCHEU–LPM at 450 s. Combining Figure 12 and Figure 13, it is evident that when the phase change heat transfer system exhibited low-order damping characteristics, the relationship between the temperature field as the output of the heat transfer system and the input pulse heat excitation became more linear. In such instances, the heat transfer system displayed lower complexity, resulting in a more uniform temperature field distribution, as illustrated in Figure 12a,b. Conversely, when the phase change heat transfer system exhibited high-order damping characteristics, the system became more complex, with enhanced nonlinearity between input and output. This was reflected in a more uneven temperature field, as shown in Figure 12c–e. From Figure 13, it is observed that with an increase in the amplitude of the pulse heat flux, the liquid-phase and two-phase regions gradually transitioned from the upper to the lower region of the radiator. Simultaneously, the maximum flow velocity steadily increased and low-speed vortices gradually formed, with the vortex position shifting from near the top of the radiator to the middle. This phenomenon indicates that greater amplitude external heat excitation drives the phase interface forward in the direction of heat flow. The fully molten liquid-phase region expands, and natural convection heat transfer within the liquid-phase region intensifies. Therefore, the observed uneven temperature distribution in the PCHEU–LPM shown in Figure 12 is directly attributable to the natural convection phenomena within the liquid-phase region.
The above results indicate that as the amplitude of the pulse heat excitation increased, the peak temperature response at the heated surface also increased, while the temperature fluctuation values initially decreased and then increased. The primary reason for this behavior was the damping effect of the two-phase region within the heat transfer system. When the pulse amplitude was relatively small, the temperature field inside the PCHEU–LPM exhibited spatial uniformity. However, at larger amplitudes of pulse heat flux, the temperature field became non-uniform, depending on the strength of natural convection in the two-phase and liquid-phase regions. When utilizing the PCHEU–LPM in pulse electronic thermal control systems, matching the heat source with the amplitude of the pulse heat flux is crucial. In addition, in order to reduce the surface temperature gradient generated by natural convection and meet the spatial temperature uniformity requirements of heating devices, measures to suppress the intensity of natural convection need to be taken, such as using a PCHEU–LPM with smaller porosity.
3.2. Variation in Heat Flow Frequency
Figure 14 presents a schematic of the pulsed thermal excitation applied to the PCM heat sink during the 450 s study period, featuring different frequencies. To mitigate the scattering of finite element calculations caused by continuously oscillating boundary conditions over a short duration, we implemented a buffering technique. This involved blunting the sharp transitions of the square wave thermal excitation to suppress high-frequency variations.
The frequency of the thermal excitation, denoted as , varied in the range of 5 Hz to 0.008 Hz. Figure 15 illustrates the amplitude–frequency characteristics of the PCM heat transfer system, categorizing the temperature response on the heating surface into various frequency ranges. Notably, at 0 Hz, the baseline temperature amplitude was observed to randomly fluctuate between 313 K and 315 K, irrespective of external pulse excitation frequency. Within the low-frequency sampling range of 0 to 0.05 Hz, the interface temperature response exhibited significant variations in response to low-frequency heat excitation, with the magnitude decreasing as the heat excitation frequency gradually increased. When the heat excitation frequency surpassed 1 Hz, no discernible amplitude was observed, indicating that the temperature response on the heating surface was unaffected by heat excitation oscillations. Figure 16 presents the phase–frequency characteristics of the PCM heat transfer system under different heat excitation frequencies. As the frequency decreased from high to low, the fluctuation in the phase–frequency curve initially increased and then decreased. This pattern implied that the complexity and nonlinearity of the phase change heat transfer system first intensified and then diminished with varying frequencies. This behavior was attributed to the extremely high oscillation frequency of (>1 Hz), which was smaller than the system’s thermal response characteristic time, resembling a nearly continuous and constant heat flux to the system. Consequently, at such frequencies, no temperature fluctuations occurred. Conversely, at very low oscillation frequencies of (<0.008 Hz), where the heat flux changed slowly, the temperature variation followed Fourier’s heat conduction law. The nonlinearity introduced by phase change was evident only at the onset and conclusion of the phase transition, corresponding to the middle section of the red line in Figure 16d.
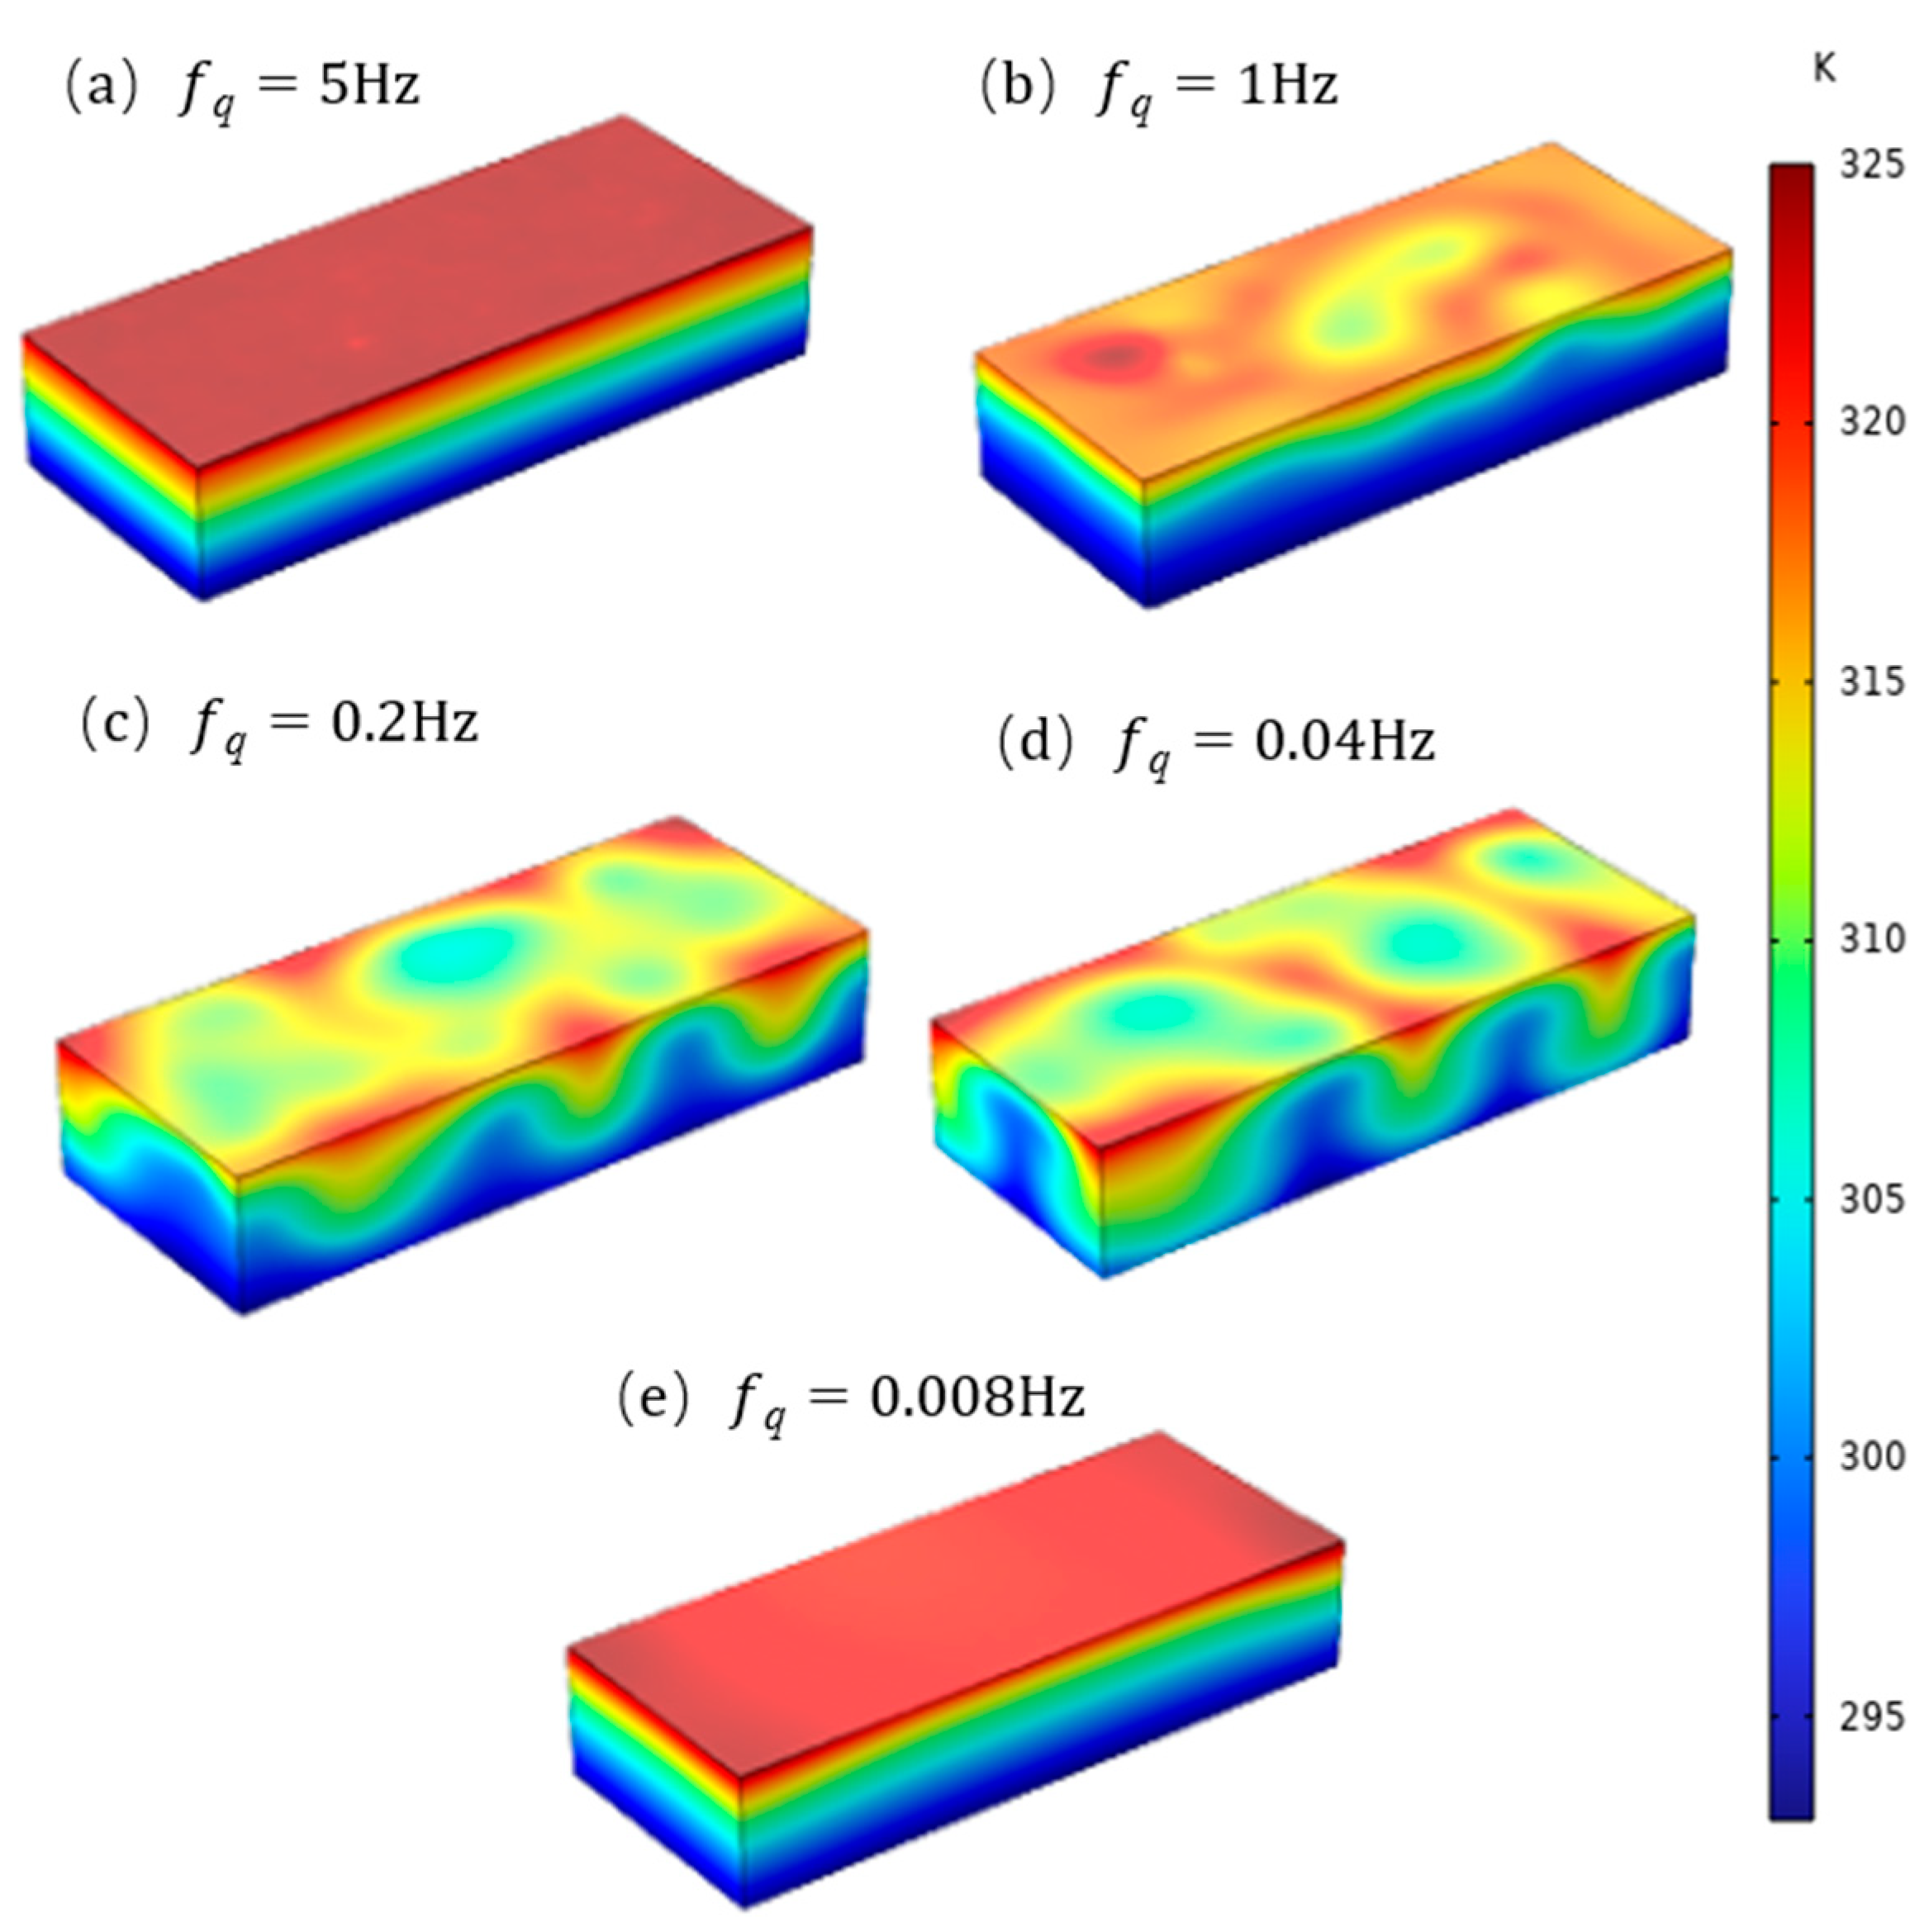
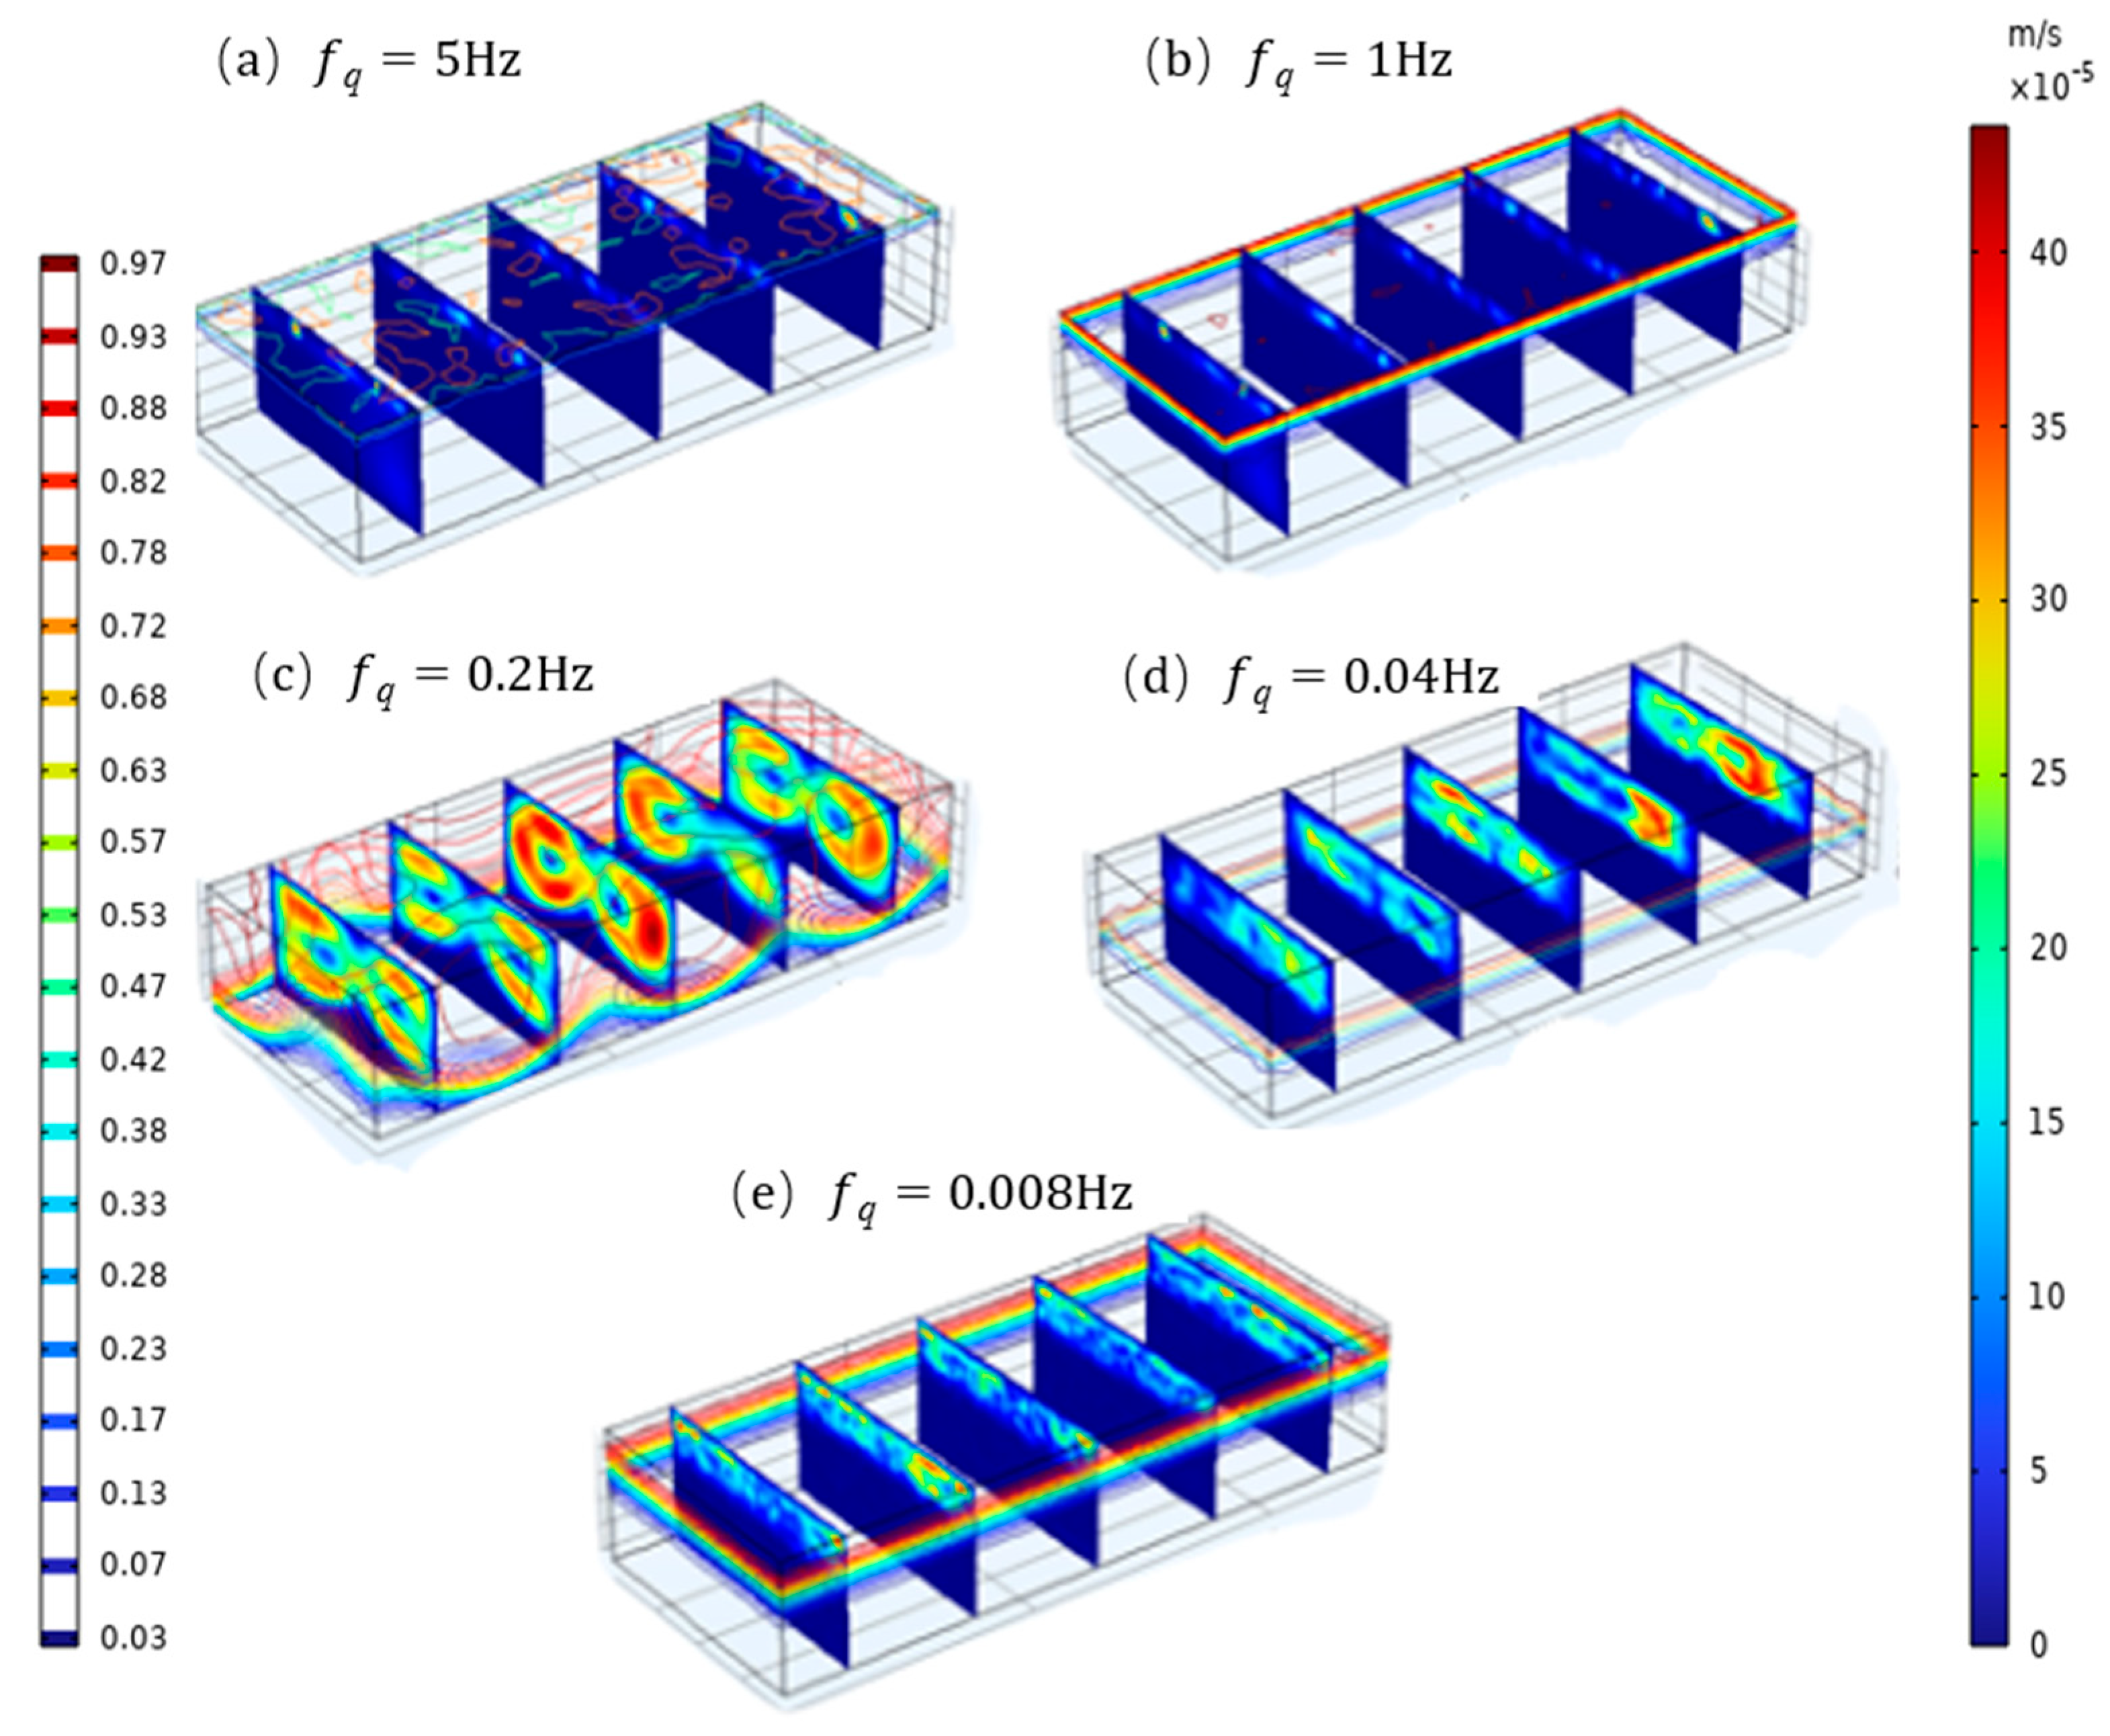
Figure 17 illustrates the three-dimensional temperature field nephogram of the PCHEU–LPM at the moment corresponding to the last peak of the different frequency pulse heat excitations shown in Figure 14. Figure 18 displays the velocity field nephogram and phase field contour map of the PCHEU–LPM at the corresponding moment. Combining Figure 16 and Figure 17 reveals a direct correlation between the uniformity of the temperature field and its phase–frequency characteristics. When the phase–frequency curve exhibited significant fluctuations, indicating a higher-order nonlinearity in the heat transfer system, the surface temperature gradient of the PCHEU–LPM was pronounced. Conversely, when the phase–frequency curve showed minimal fluctuations, indicating a lower-order nonlinearity, the surface temperature of the PCHEU–LPM was uniform. Observing Figure 18, when > 1 Hz or < 0.008 Hz, the phase field uniformly changed along the direction of heat flow, and natural convection at the bottom of the PCHEU was inhibited. In the mid-frequency range between 1 Hz and 0.008 Hz, the phase field extended to the bottom of the PCHEU, and natural convection in the liquid-phase region became more intense. Combining Figure 17 and Figure 18 indicates that the spatial temperature distribution’s non-uniformity originated from natural convection, with more intense natural convection occurring when the heat excitation was in the mid-frequency range. During this period, the surface temperature gradient of the PCHEU–LPM was more pronounced.
The aforementioned findings indicate that variations in pulse frequency did not impact the temporal average of the interface temperature within each cycle. However, the amplitude of temperature fluctuations throughout the cycle increased with a decrease in frequency. Moreover, frequency exhibited a close correlation with the uniformity of spatial temperature distribution. For thermal excitations at higher or lower frequencies, the phase change heat transfer system tended to be a low-order damping system, resulting in better temperature uniformity. In contrast, at intermediate frequencies, the phase change heat transfer system behaved as a high-order damping system, leading to larger spatial temperature gradients. Therefore, an alternative approach to promoting temperature uniformity is to preferentially employ thermal sources oscillating at higher or lower frequencies.
3.3. Variable Porosity Structure
Based on the results from Section 3.1 and Section 3.2, the non-uniformity in the distribution of the temperature field was attributed to the uneven intensity of natural convection induced by specific thermal boundary conditions. As evident from Figure 12d, Figure 13d, Figure 17d and Figure 18d, the highest natural convection intensity occurred in the central region of the PCHEU–LPM, where the maximum surface temperature difference exceeded 11 K. To expand the application range of the PCHEU–LPM under high-amplitude or medium-frequency pulsed heat flux and enhance its temperature uniformity, a variable porosity structure was introduced, as illustrated in Figure 19. In this configuration, the porosity in the central part was set at 70% while the porosity on the sides was set at 45%. This configuration was strategically advantageous as it increased the thermal conductivity on the initially local high-temperature sides, thereby improving heat dissipation and reducing temperatures, ultimately enhancing overall temperature uniformity. Simultaneously, the higher porosity in the central part maximally preserved latent heat. The temperature field and velocity field results for the PCHEU–LPM with variable porosity under a pulsed heat flux amplitude of 1.2 × 10⁶ W/m2 and a duty cycle of 0.04 are presented in Figure 20 and Figure 21, respectively. A comparison between the temperature field results of Figure 12d, Figure 17d and Figure 20 reveals a reduction in the maximum surface temperature difference from 8.5 K and 11.3 K to 4.6 K, indicating a significant improvement in surface temperature uniformity. The velocity field distribution in Figure 21 shows a decrease in vortex speed on the sides of the PCHEU–LPM with variable porosity, resulting in a closer approximation to natural convection at various locations. This was a direct contributing factor to the enhanced uniformity in the temperature field.
The above results show that the design featuring high porosity in the central region and low porosity on the sides holds promise for enhancing the surface temperature uniformity of the PCHEU–LPM. This configuration can enable electronic devices within the payload bay of hypersonic aircraft to operate in pulsed mode at higher amplitude ranges and broader frequency spectrums. In practical applications, the fabrication of a PCHEU–LPM with variable porosity entails the casting of a porous medium using a thermoelectric cooler with temperature variation capabilities in a specific region. This allows for the modulation of porosity through distinct cooling temperatures. However, the realization of highly precise and regionally variable thermoelectric coolers necessitates further development.
4. Conclusions
This paper presented a numerical investigation into the interface temperature response of the heating surface in a three-dimensional PCHEU–LPM model. The model incorporated combined boundary conditions of pulsed heating and forced convection heat dissipation, allowing for an analysis of the impact of changing pulsed heat flow conditions. The effects of variations in heat flow amplitude and frequency on the temperature and phase fields were examined, leading to the following conclusions:
- (1)
- It is crucial for the PCHEU–LPM to work within an appropriate amplitude of the pulse heat flow generated by the heat source. When the heat flow amplitude is excessively large, the heating surface and the surrounding PCM enter a superheated state. Conversely, when the amplitude is excessively small, they remain in a supercooled state. Neither extreme allows for the optimal utilization of latent heat during phase change, leading to the inadequate suppression of temperature fluctuations at the interface.
- (2)
- Natural convection in the liquid-phase region is attenuated when the PCHEU–LPM handles either high-frequency or low-frequency pulsed heat generation. As a result, the interface temperature exhibits a more uniform distribution. Specifically, when dealing with high-frequency heat flow (>1 Hz), the interface temperature fluctuation remains below 1 K. For medium-frequency heat flow (0.2 Hz to 0.04 Hz), the fluctuation ranges from approximately 4.5 K to 10 K, while low-frequency heat flow (<0.008 Hz) leads to fluctuations exceeding 14.5 K. Nevertheless, compared to heat sinks made of single-phase metal materials, the PCHEU–LPM still demonstrates superior suppression of temperature fluctuations when handling medium- and low-frequency heat flows.
- (3)
- If the thermal control of electronic devices inside cabins needs to further enhance the uniformity of spatial temperature distribution, one method is that a PCHEU–LPM with lower porosity can be used to suppress natural convection intensity. Another method is to make the pulse working mode of electronic devices ≥ 1 Hz or ≤0.008 Hz.
- (4)
- The design featuring high porosity in the central region and low porosity on the sides holds promise for enhancing the surface temperature uniformity of the PCHEU–LPM. Compared to the PCHEU–LPM with a porosity of 70%, which maintains a 70% porosity in the central region and reduces it to 45% on both sides to enhance thermal conductivity, this design improves surface temperature uniformity, reducing the maximum surface temperature difference from 11.3 K to 4.6 K. This configuration enables electronic devices within the payload bay of hypersonic aircraft to operate in pulsed mode at higher amplitude ranges and broader frequency spectrums.
Author Contributions
Writing—original draft, R.Z.; Writing—review & editing, J.Z. (Jingyang Zhang); Project administration, J.Z. (Jingzhou Zhang). All authors have read and agreed to the published version of the manuscript.
Funding
The authors gratefully acknowledge the financial supports from the National Natural Science Foundation of China (Nos. 51776097 and 52206091), the Aeronautical Science Foundation of China (No. 201928052008), the Natural Science Foundation of Jiangsu Province, China (No. BK20210303), Advanced Jet Propulsion Innovation (Grant No.: HKCX2022-01-001).
Data Availability Statement
The raw data supporting the conclusions of this article will be made available by the authors on request.
Conflicts of Interest
The authors declare no conflict of interest.
Nomenclatures
| Parameter Name | ||
| L | Length | mm |
| Width | mm | |
| Height | mm | |
| Heat flow | W/m2 | |
| Temperature | K | |
| X-direction speed | m/s | |
| Y-direction speed | m/s | |
| Z-direction speed | m/s | |
| Body force | N/m3 | |
| s | Phase interface location | m |
| Convective heat transfer coefficient | W/m2-K | |
| Δh | Latent heat of phase change | KJ/kg |
| A | Area | m2 |
| Greek alphabet | ||
| Time | s | |
| Porosity or liquid phase ratio | ||
| Sport viscosity | Pa-s | |
| Density | kg/m3 | |
| Thermal conductivity | W/m-K | |
| Latent heat of phase change | KJ/kg | |
| Thermal diffusion coefficient | m2/s | |
| Permeability | m2 | |
| Subscript | ||
| l | Liquid phase | |
| Solid phase | ||
| Directional vector at the phase interface | ||
| w | External thermal excitation | |
| m | Phase change state | |
| c | Cold fluids | |
| 0 | Initial state | |
| ss | Steady-state, time-averaged value of transient temperature fluctuations | |
| h | Hot end | |
| c | Cold end |
References
- Sahoo, S.K.; Das, M.K.; Rath, P. Application of TCE-PCM Based Heat Sinks for Cooling of Electronic Components: A Review. Renew. Sustain. Energy Rev. 2016, 59, 550–582. [Google Scholar] [CrossRef]
- Gharbi, S.; Harmand, S.; Jabrallah, S.B. Experimental Study of the Cooling Performance of Phase Change Material with Discrete Heat Sources—Continuous and Intermittent Regimes. Appl. Therm. Eng. 2017, 111, 103–111. [Google Scholar] [CrossRef]
- Alshaer, W.G.; Nada, S.A.; Rady, M.A.; Del Barrio, E.P.; Sommier, A. Thermal Management of Electronic Devices Using Carbon Foam and PCM/Nano-Composite. Int. J. Therm. Sci. 2015, 89, 79–86. [Google Scholar] [CrossRef]
- Alimohammadi, M.; Aghli, Y.; Alavi, E.S.; Sardarabadi, M.; Passandideh-Fard, M. Experimental Investigation of the Effects of Using Nano/Phase Change Materials (NPCM) as Coolant of Electronic Chipsets, under Free and Forced Convection. Appl. Therm. Eng. 2017, 111, 271–279. [Google Scholar] [CrossRef]
- Chang, T.-C.; Lee, S.; Fuh, Y.-K.; Peng, Y.-C.; Lin, Z.-Y. PCM Based Heat Sinks of Paraffin/Nanoplatelet Graphite Composite for Thermal Management of IGBT. Appl. Therm. Eng. 2017, 112, 1129–1136. [Google Scholar] [CrossRef]
- Liu, L.; Su, D.; Tang, Y.; Fang, G. Thermal Conductivity Enhancement of Phase Change Materials for Thermal Energy Storage: A Review. Renew. Sustain. Energy Rev. 2016, 62, 305–317. [Google Scholar] [CrossRef]
- Rout, C.; Sharma, A. Recent Advancement in Phase Change Materials for Thermal Applications: A Review. In Proceedings of the AICTE Sponsored National Conference on RTEC, Bahal, India, 25–26 October 2013; p. 6. [Google Scholar]
- Asgharian, H.; Baniasadi, E. A Review on Modeling and Simulation of Solar Energy Storage Systems Based on Phase Change Materials. J. Energy Storage 2019, 21, 186–201. [Google Scholar] [CrossRef]
- Vargas-López, R.; Xamán, J.; Hernández-Pérez, I.; Arce, J.; Zavala-Guillén, I.; Jiménez, M.J.; Heras, M.R. Mathematical Models of Solar Chimneys with a Phase Change Material for Ventilation of Buildings: A Review Using Global Energy Balance. Energy 2019, 170, 683–708. [Google Scholar] [CrossRef]
- Cheng, W.-L.; Mei, B.-J.; Liu, Y.-N.; Huang, Y.-H.; Yuan, X.-D. A Novel Household Refrigerator with Shape-Stabilized PCM (Phase Change Material) Heat Storage Condensers: An Experimental Investigation. Energy 2011, 36, 5797–5804. [Google Scholar] [CrossRef]
- Abhilash, A.; Adarsh Murali Menon; Anirudh, K.; Aby Kurian, M. Nehru College of Engineering and Research Centre Comparison of a Conventional Domestic Refrigerator with a PCM Encapsulated Refrigerator. Int. J. Eng. Res. Technol. 2015, V4, IJERTV4IS100585. [Google Scholar] [CrossRef]
- Elarem, R.; Mellouli, S.; Abhilash, E.; Jemni, A. Performance Analysis of a Household Refrigerator Integrating a PCM Heat Exchanger. Appl. Therm. Eng. 2017, 125, 1320–1333. [Google Scholar] [CrossRef]
- Abdolmaleki, L.; Sadrameli, S.M.; Pirvaram, A. Application of Environmental Friendly and Eutectic Phase Change Materials for the Efficiency Enhancement of Household Freezers. Renew. Energy 2020, 145, 233–241. [Google Scholar] [CrossRef]
- Wang, J.-X.; Li, Y.-Z.; Zhang, H.-S.; Wang, S.-N.; Liang, Y.-H.; Guo, W.; Liu, Y.; Tian, S.-P. A Highly Self-Adaptive Cold Plate for the Single-Phase Mechanically Pumped Fluid Loop for Spacecraft Thermal Management. Energy Convers. Manag. 2016, 111, 57–66. [Google Scholar] [CrossRef]
- Zhong, M.-L.; Li, Y.-Z.; Guo, W.; Wang, S.-N.; Mao, Y.-F. Dynamic In-Loop Performance Investigation and Efficiency-Cost Analysis of Dual Heat Sink Thermal Control System (DHS-TCS) with a Sublimator for Aerospace Vehicles. Appl. Therm. Eng. 2017, 121, 562–575. [Google Scholar] [CrossRef]
- Lin, Y.; Jia, Y.; Alva, G.; Fang, G. Review on Thermal Conductivity Enhancement, Thermal Properties and Applications of Phase Change Materials in Thermal Energy Storage. Renew. Sustain. Energy Rev. 2018, 82, 2730–2742. [Google Scholar] [CrossRef]
- Zalba, B.; Marín, J.M.; Cabeza, L.F.; Mehling, H. Review on Thermal Energy Storage with Phase Change: Materials, Heat Transfer Analysis and Applications. Appl. Therm. Eng. 2003, 23, 251–283. [Google Scholar] [CrossRef]
- Casano, G.; Piva, S. Experimental and Numerical Investigation of the Steady Periodic Solid–Liquid Phase-Change Heat Transfer. Int. J. Heat Mass Transf. 2002, 45, 4181–4190. [Google Scholar] [CrossRef]
- Kalbasi, R.; Salimpour, M.R. Constructal Design of Phase Change Material Enclosures Used for Cooling Electronic Devices. Appl. Therm. Eng. 2015, 84, 339–349. [Google Scholar] [CrossRef]
- Ye, H.; Wang, Z.; Wang, L. Effects of PCM on Power Consumption and Temperature Control Performance of a Thermal Control System Subject to Periodic Ambient Conditions. Appl. Energy 2017, 190, 213–221. [Google Scholar] [CrossRef]
- Shao, G.; Hanaor, D.A.H.; Shen, X.; Gurlo, A. Freeze Casting: From Low-Dimensional Building Blocks to Aligned Porous Structures—A Review of Novel Materials, Methods, and Applications. Adv. Mater. 2020, 32, 1907176. [Google Scholar] [CrossRef]
- Nie, C.; Deng, S.; Guo, H.; Liu, J. Effects of Partially Thermally Active Walls on Simultaneous Charging and Discharging of Paraffin Wax in a Square Cavity. Energy Convers. Manag. 2019, 202, 112201. [Google Scholar] [CrossRef]
Figure 1.
Microscopic photo of the morphology and structure of PCHEU–LPM.

Figure 2.
Photo of rectangular PCHEU–LPM entity.

Figure 3.
The simplified geometric model.

Figure 4.
Schematic diagram of grid division.

Figure 5.
Grid independence test results.

Figure 6.
Comparison of the average melting rate between test results in the literature [22] and the numerical results.
Figure 6.
Comparison of the average melting rate between test results in the literature [22] and the numerical results.

Figure 7.
Comparison of the dimensionless position between test results in the literature [22] and the numerical results.
Figure 7.
Comparison of the dimensionless position between test results in the literature [22] and the numerical results.

Figure 8.
Effective thermal conductivity test.

Figure 9.
Comparison of the effective thermal conductivity between numerical and test results.

Figure 10.
Amplitude–frequency characteristic curves of the temperature response of the heating surface under different thermal excitation amplitude conditions.
Figure 10.
Amplitude–frequency characteristic curves of the temperature response of the heating surface under different thermal excitation amplitude conditions.

Figure 11.
Phase–frequency characteristic curves of the temperature response of the heating surface under different thermal excitation amplitudes.
Figure 11.
Phase–frequency characteristic curves of the temperature response of the heating surface under different thermal excitation amplitudes.

Figure 12.
PCHEU–LPM temperature field nephogram after 450 s with pulsed heat flow of different amplitudes loaded on top.
Figure 12.
PCHEU–LPM temperature field nephogram after 450 s with pulsed heat flow of different amplitudes loaded on top.

Figure 13.
Velocity field nephogram and phase field contours at 450 s for pulsed heat flow with different amplitudes loaded on top of PCHEU–LPM.
Figure 13.
Velocity field nephogram and phase field contours at 450 s for pulsed heat flow with different amplitudes loaded on top of PCHEU–LPM.

Figure 14.
Schematic diagram of pulsed thermal excitation at different frequencies.

Figure 15.
Amplitude–frequency characteristic curves of the temperature response of the heating surface under different thermal excitation frequencies.
Figure 15.
Amplitude–frequency characteristic curves of the temperature response of the heating surface under different thermal excitation frequencies.

Figure 16.
Phase–frequency characteristic curves of the temperature response of the heating surface for different thermal excitation amplitudes.
Figure 16.
Phase–frequency characteristic curves of the temperature response of the heating surface for different thermal excitation amplitudes.

Figure 17.
Temperature field nephogram at the moment corresponding to the peak surface temperature when the top of the PCHEU–LPM was loaded with pulsed heat flow of different frequencies.
Figure 17.
Temperature field nephogram at the moment corresponding to the peak surface temperature when the top of the PCHEU–LPM was loaded with pulsed heat flow of different frequencies.

Figure 18.
Velocity field nephogram and phase field contours for the moments corresponding to the peak surface temperature of the PCHEU–LPM top loaded with different frequencies of pulsed heat flow.
Figure 18.
Velocity field nephogram and phase field contours for the moments corresponding to the peak surface temperature of the PCHEU–LPM top loaded with different frequencies of pulsed heat flow.

Figure 19.
PCHEU–LPM with variable porosity.

Figure 20.
Temperature field nephogram of the PCHEU–LPM with variable porosity.

Figure 21.
Velocity field nephogram of the PCHEU–LPM with variable porosity.


Table 1.
Types of boundary conditions and parameters.
| Boundary Conditions | Location | Boundary Condition Parameters | ||
|---|---|---|---|---|
| Pulsed heat flux | Top | Heat flux 50,000 W/m2 | Pulse period 50 s | Pulse duty cycle 0.5 |
| Microchannel water cooling | Bottom | Mean flow rate 2 m/s | Refrigerant materials Water | Refrigerant incoming flow temperature 297 K |
Disclaimer/Publisher’s Note: The statements, opinions and data contained in all publications are solely those of the individual author(s) and contributor(s) and not of MDPI and/or the editor(s). MDPI and/or the editor(s) disclaim responsibility for any injury to people or property resulting from any ideas, methods, instructions or products referred to in the content. |
© 2024 by the authors. Licensee MDPI, Basel, Switzerland. This article is an open access article distributed under the terms and conditions of the Creative Commons Attribution (CC BY) license (https://creativecommons.org/licenses/by/4.0/).
Share and Cite
MDPI and ACS Style
Zhang, R.; Zhang, J.; Zhang, J. Dynamic Response of Phase Change Heat Exchange Unit with Layered Porous Media for Pulsed Electronic Equipment. Aerospace 2024, 11, 331. https://doi.org/10.3390/aerospace11050331
AMA Style
Zhang R, Zhang J, Zhang J. Dynamic Response of Phase Change Heat Exchange Unit with Layered Porous Media for Pulsed Electronic Equipment. Aerospace. 2024; 11(5):331. https://doi.org/10.3390/aerospace11050331
Chicago/Turabian StyleZhang, Ruoji, Jingyang Zhang, and Jingzhou Zhang. 2024. "Dynamic Response of Phase Change Heat Exchange Unit with Layered Porous Media for Pulsed Electronic Equipment" Aerospace 11, no. 5: 331. https://doi.org/10.3390/aerospace11050331
Note that from the first issue of 2016, this journal uses article numbers instead of page numbers. See further details here.