Article

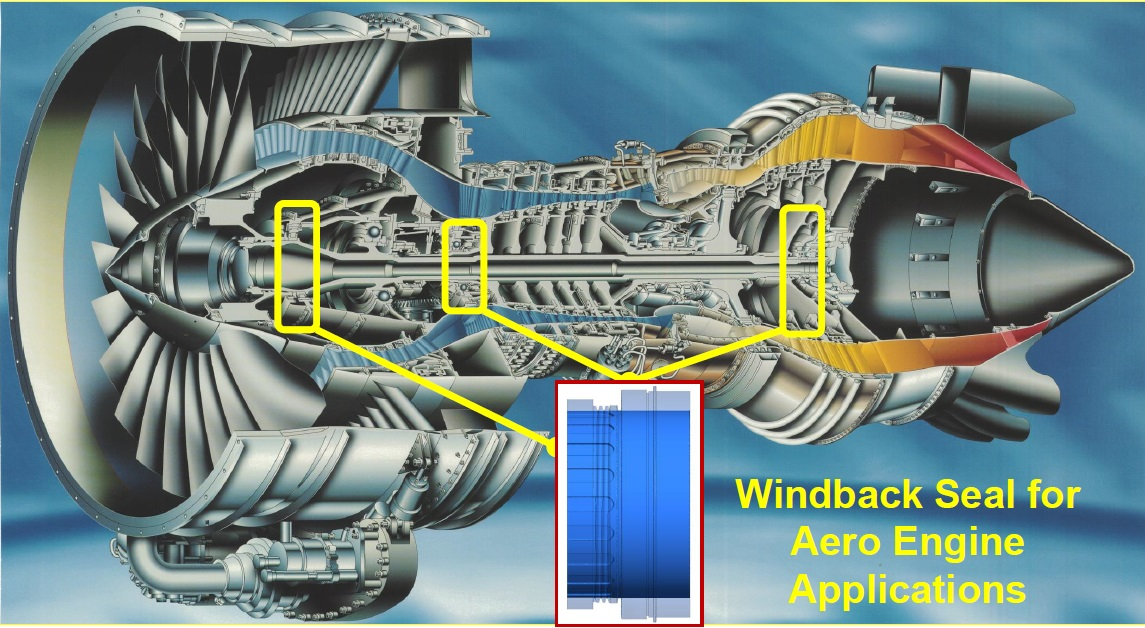
Numerical Investigation on Windback Seals Used in Aero Engines

by
Michael Flouros
1,*,
Francois Cottier
1,
Markus Hirschmann
1 and
Christina Salpingidou
2
1
MTU Aero Engines AG, Dachauer Strasse 665, 80995 Munich, Germany
2
Laboratory of Fluid Mechanics & Turbomachinery, Aristotle University of Thessaloniki, 54124 Thessaloniki, Greece
*
Author to whom correspondence should be addressed.
Aerospace 2018, 5(1), 12; https://doi.org/10.3390/aerospace5010012
Submission received: 16 November 2017 / Revised: 4 January 2018 / Accepted: 12 January 2018 / Published: 20 January 2018
(This article belongs to the Special Issue Secondary Air Systems in Gas Turbine Engines)

Abstract

:
Seals are considered one of the most important flow elements in turbomachinery applications. The most traditional and widely known seal is the labyrinth seal but in recent years other types like the brush or carbon seals were introduced since they considerably reduce the sealing air consumption. When seals are used for sealing of aero engine bearing chambers they are subjected to high “bombardment” through oil particles which are present in the bearing chamber. These particles mainly result from the bearings as a consequence of the high rotational speeds. Particularly when carbon or brush seals are used, problems with carbon formation (coking) may arise when oil gets trapped in the very tight gap of these seals. In order to prevent oil migration into the turbomachinery, particularly when the pressure difference over a seal is small or even negligible, significant improvement can be achieved through the introduction of so called windback seals. This seal has a row of static helical teeth (thread) and below this thread a scalloped or smooth shaft section is rotating. Depending on the application, a windback seal can be used alone or as a combination with another seal (carbon, brush or labyrinth seal). A CFD analysis carried out with ANSYS CFX version 11 is presented in this paper with the aim to investigate this seal type. The simulations were performed by assuming a two-phase flow of air and oil in the bearing compartment. Design parameters like seal clearance, thread size, scallop width, were investigated at different operating conditions.

Graphical Abstract

1. Introduction

In modern aero-engines, the lubrication system holds a key role due to the demand for high safety and reliability standards. An aero-engine bearing chamber contains components like bearings and gears. Oil is used for lubrication and for heat removal. In order to retain the oil in a bearing chamber, pressurized seals are used. For this reason, air is tapped from the compressor. In order to avoid over-pressurization of the bearing chamber, air/oil passages are provided in the bearing chamber. At its top, a vent pipe discharges most of the sealing air and at the bottom, a scavenge pipe is used for discharging the oil by means of a mechanically driven pump (scavenge pump). In the last 15 years aero engine development dictates even higher rotor speeds compared to former developments. The increased mechanical rotor speeds are a huge challenge to the oil system. The design should be that the rotating components are not only adequately lubricated and cooled but also the bearing chambers themselves can comply with the “attitude” requirements of the engine. These are dictated by the flight envelope of the aircraft. Whereas during take-off or during the flight the bearing chamber seals are adequately pressurized by the secondary air system, the latter occasionally fails to sustain positive delta pressure over the seals at low idle on the ground or in the air during descent or during engine start or shut down (sub-idle). As a consequence, oil from the bearing chambers may overcome the seals and migrate into the turbomachinery. Oil migration into the compressor will contaminate the cabin air whereas oil migration into the turbine may ignite and cause component failure. For this reason, additional precaution measures are considered during the design phase in order to make oil migration into the turbo machinery as remote as possible. Such measures are for example drains attached to the bearing chamber and windback seals. The latter are used as secondary seals and are placed downstream of the main (primary) bearing chamber seal. Their function is to repulse migrating oil back into the bearing chamber hence avoid oil contamination of the primary seal. Morrison and Al-Ghasem [1] have investigated windback seals for turbo machinery applications both experimentally and numerically. They also included in their work an extensive literature review particularly on windback and also labyrinth seals. The cases which were investigated in [1] are windback seals at considerable pressure differences. Pressure differences of 34.5, 68.9 and 103.4 kPa were examined. Lim, C.H. [2] has numerically and experimentally investigated in his PhD thesis the impact of different design parameters on the performance of windback seals for compressor applications. He based his work on the same operating conditions as in [1]. Nevertheless, in the aero engine technology, pressure differences of that order across bearing chamber seals are almost impossible to realize. One of the main differences of this work compared to other authors is the investigation of windback seal performance at very low-pressure differences across the seal. Additionally, the impact of scallops which may be engraved in the rotor and are running underneath of the thread was investigated. Different scallop sizes and also different rotor/stator clearances were investigated. Additionally, the impact of the thread size, of the rotor speed and of the direction of rotation were investigated. A two-phase flow of air and oil downstream of the windback seal was considered. For seal pressurization upstream of the seal, lean air flow was considered. This work has been inspired by engine projects which have involved the particular windback seal design.

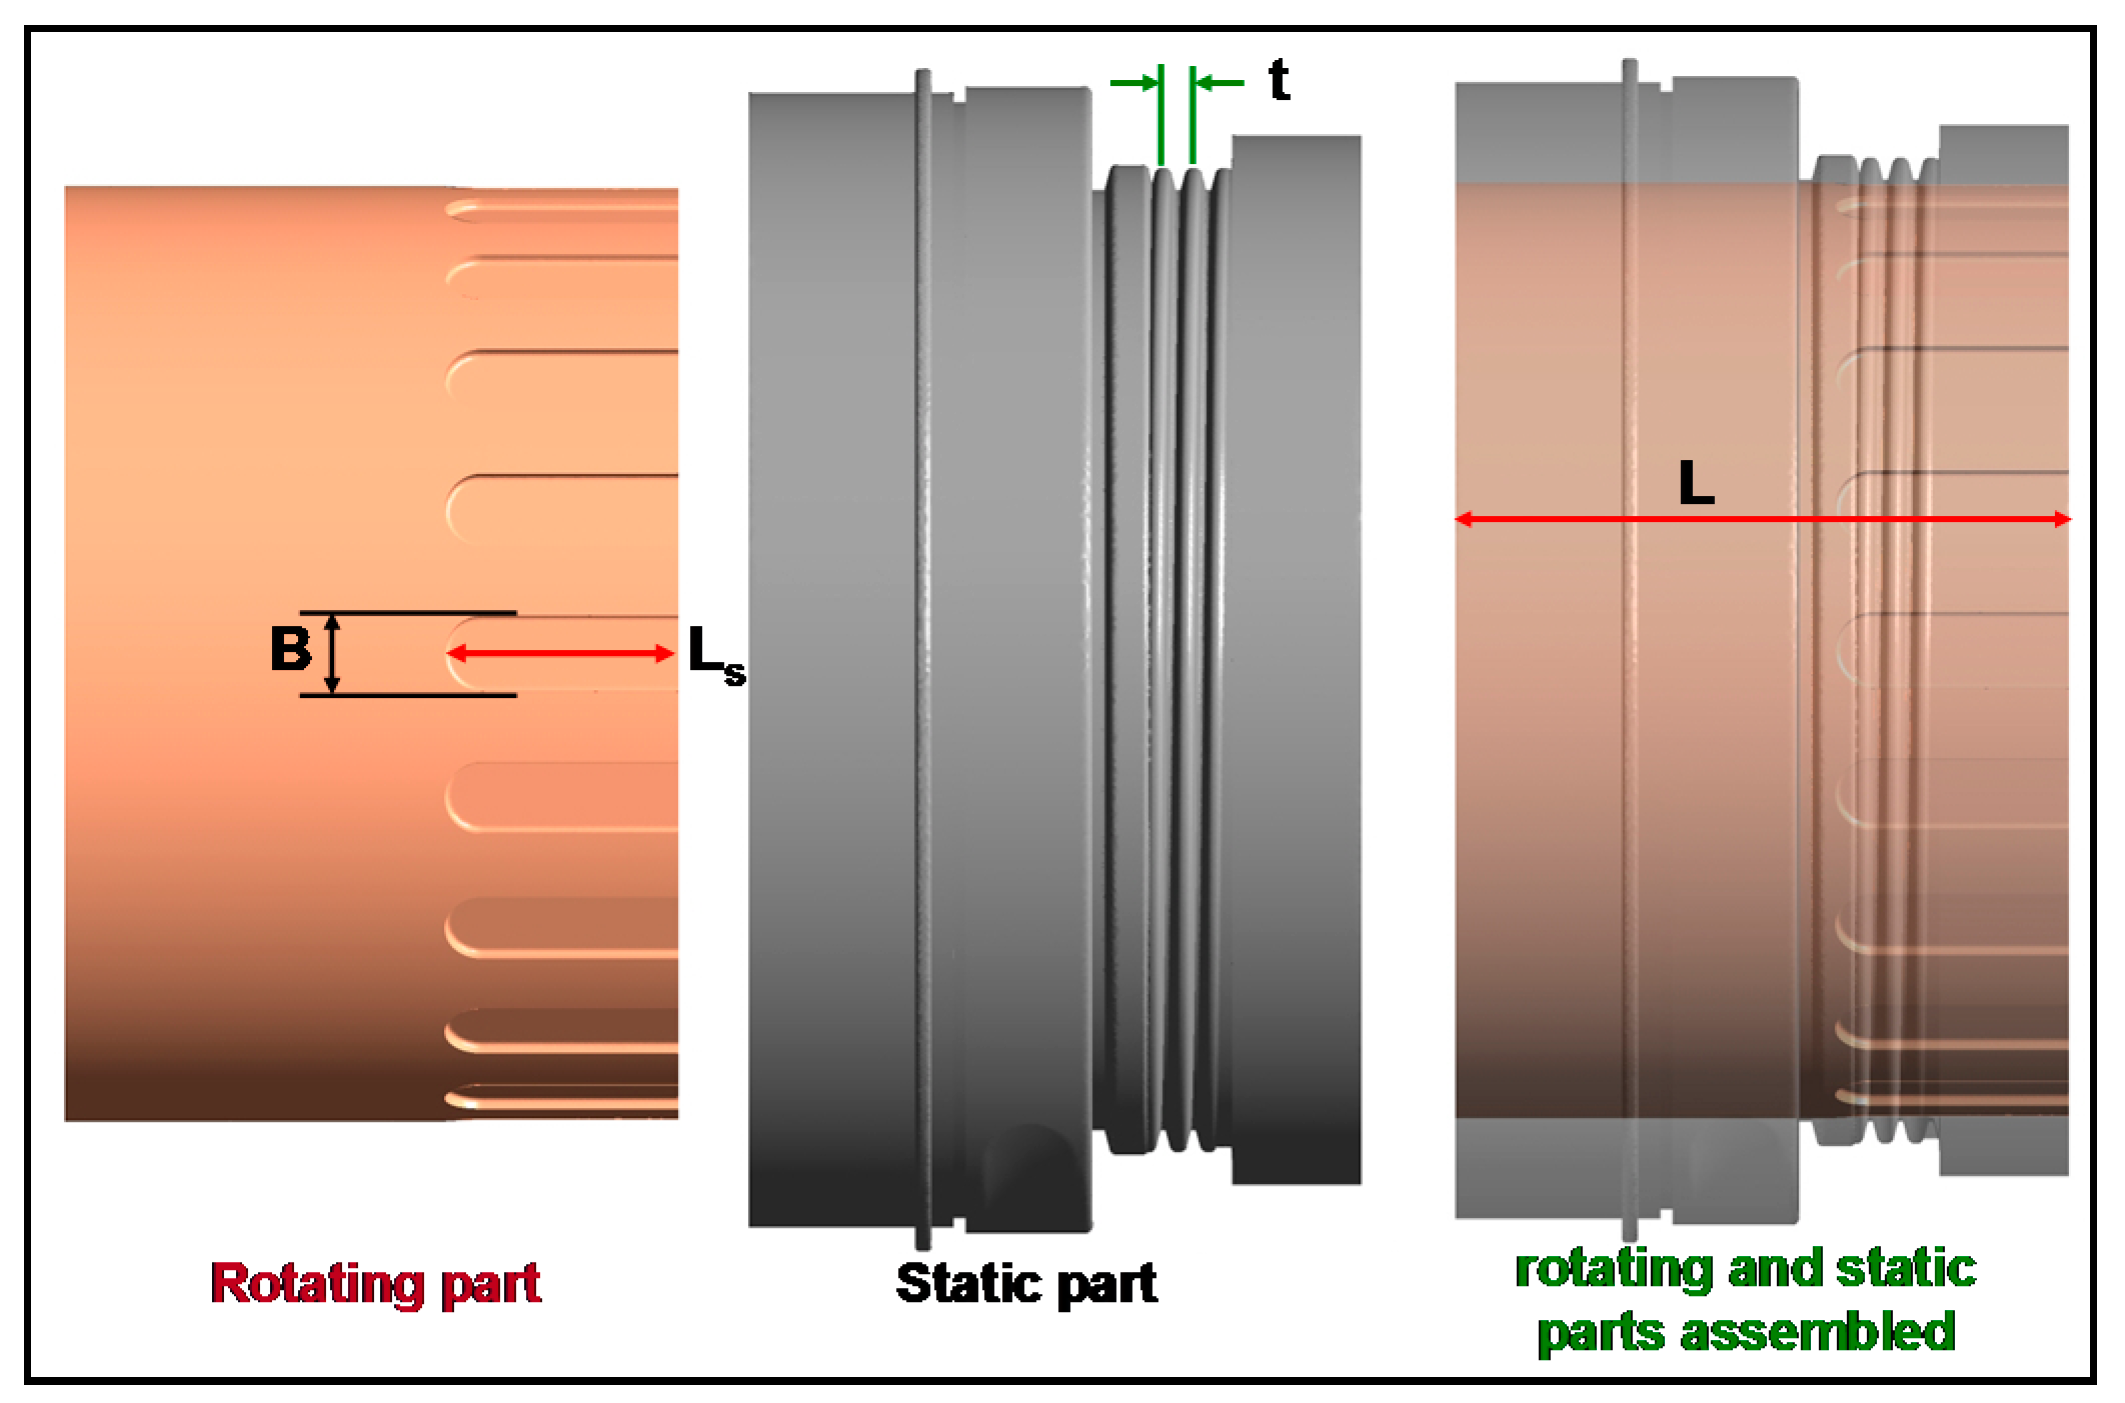
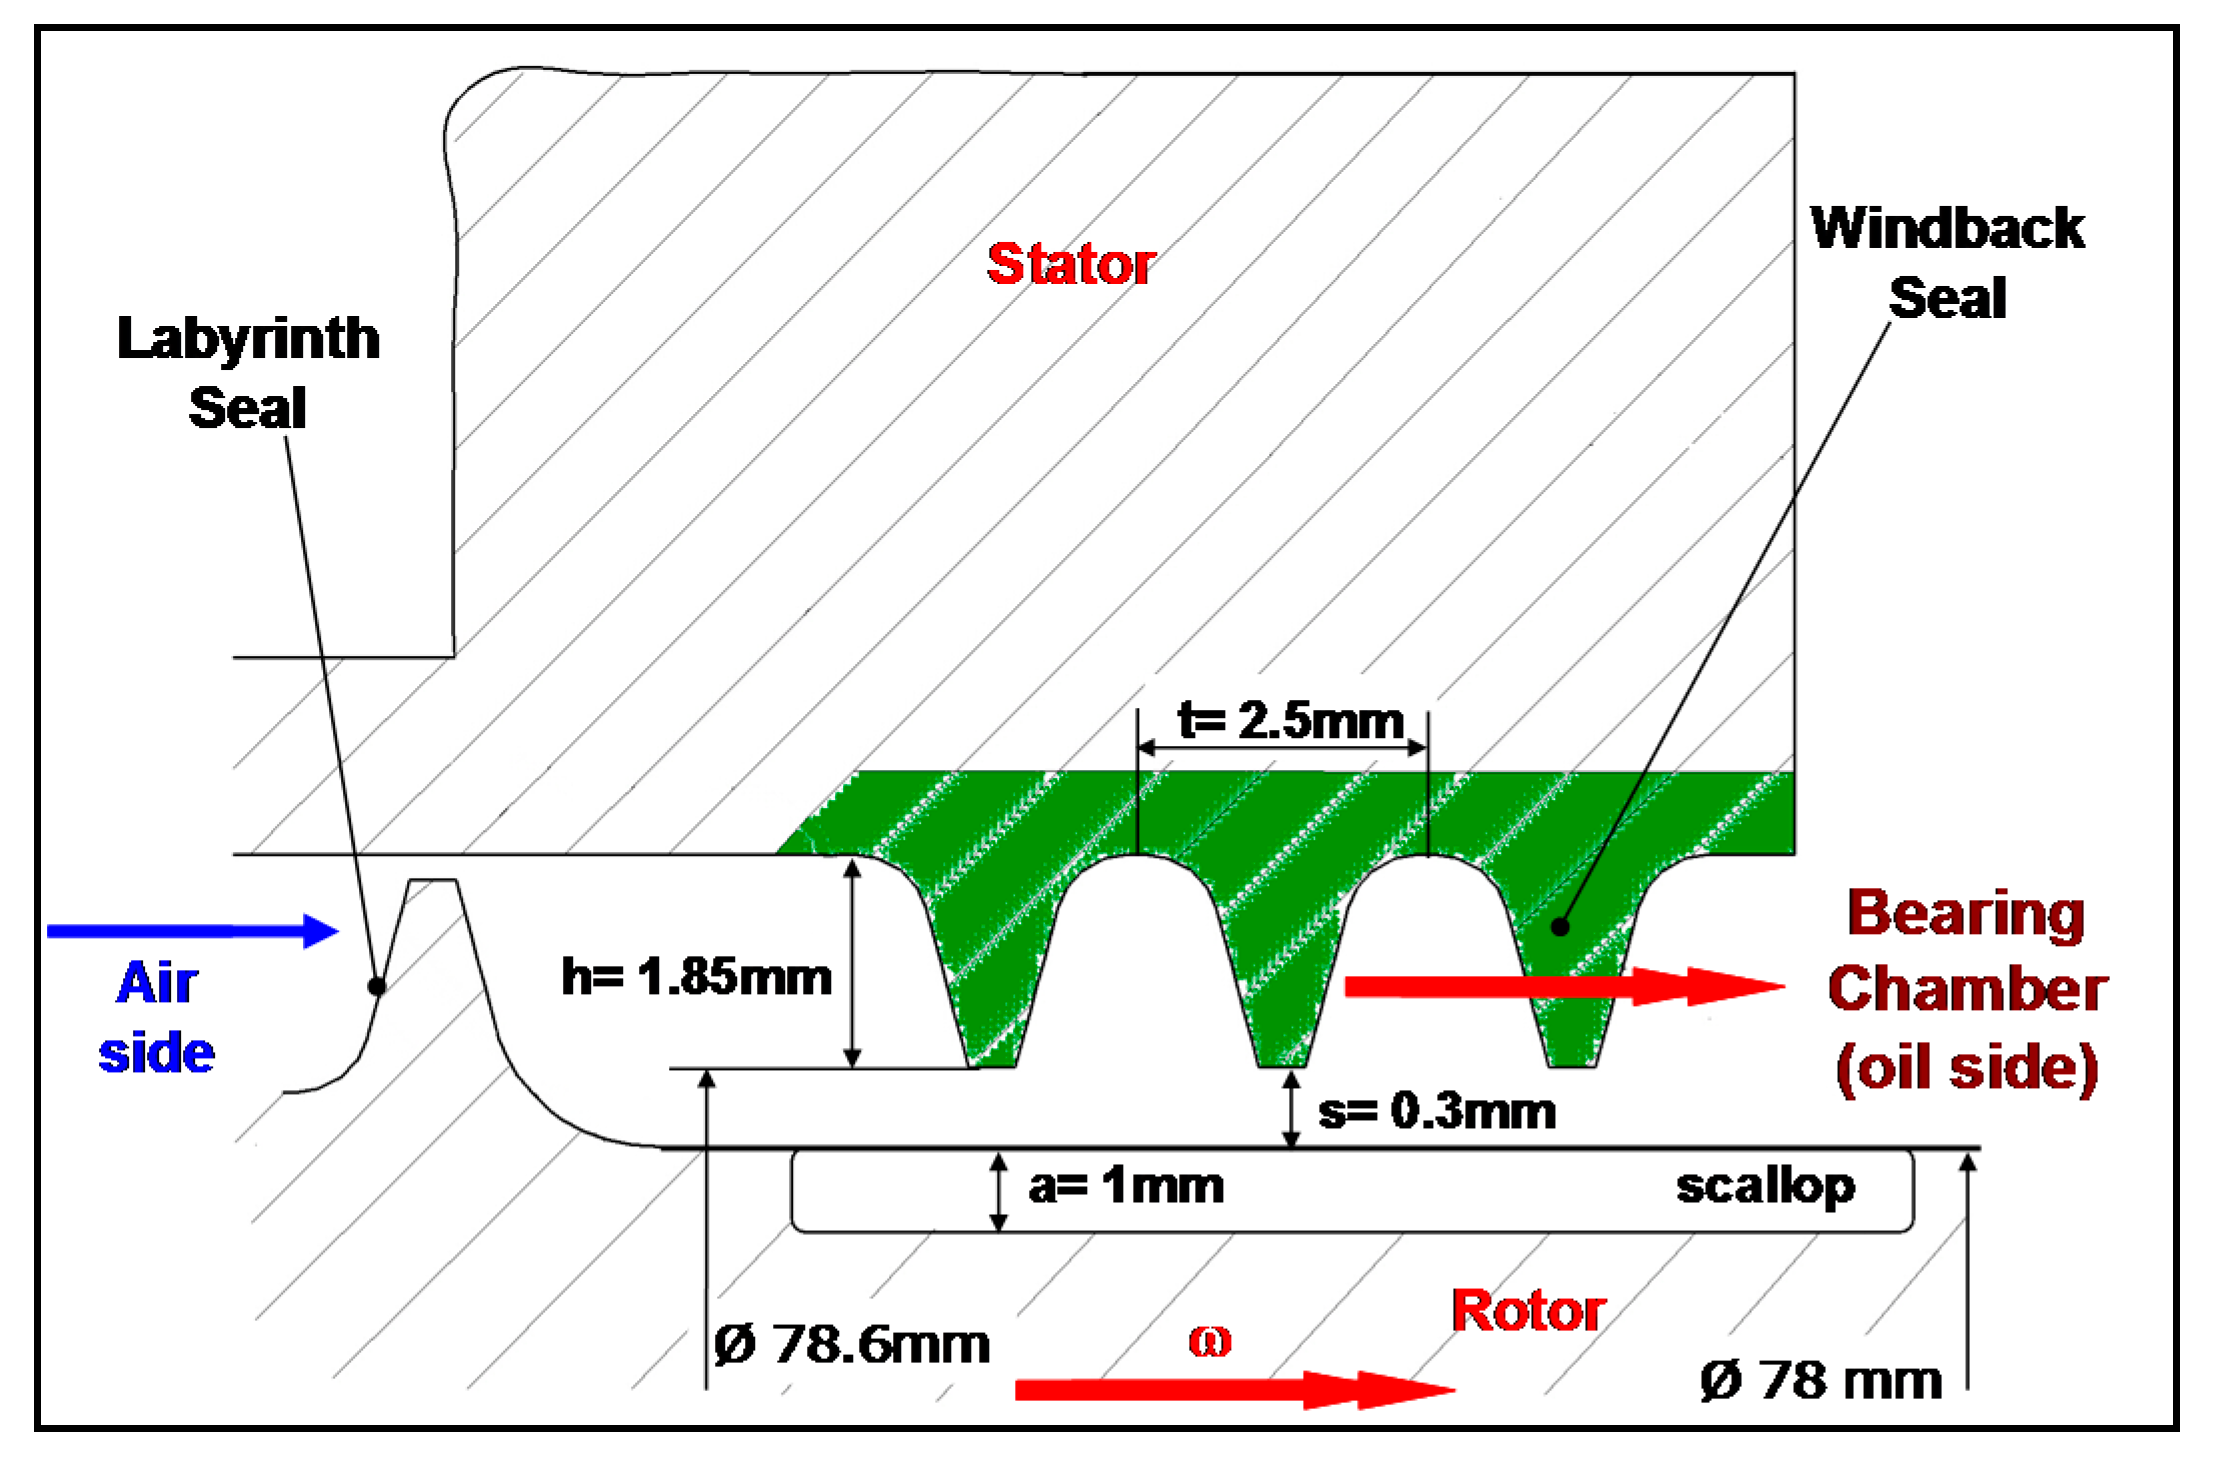
2. Seal Geometries and Operating Conditions

Figure 1 depicts the baseline architecture of the windback seal which was used in current projects. It consists of two parts, the rotating part which contains the scallops (chopper) and the static part with the helical thread (helical fin). The chopper rotates directly underneath of the thread at a certain clearance. In aero engine applications, the windback seal is used in combination to a primary seal (labyrinth, brush or carbon seal) and is placed directly adjacent to a bearing chamber. Its function is to repulse oil which might migrate from the bearing chamber hence protect the primary seal from oil contamination. Figure 2 shows the combination between a windback and a single fin labyrinth seal as this was realized in an engine project. The baseline seal dimensions are shown in this figure. The number of scallops Ns was 20, the width of the scallops B was 6.3 mm and the length of the scallops L was 19.8 mm. The tip width of the helical cut was b = 0.4 mm. The labyrinth seal was purged by compressor air. In the bearing chamber, a roller bearing was rotating. In order to keep the sealing air consumption low and therefore make possible the use of an unvented bearing chamber, the pressure difference between the labyrinth seal and the sump was limited to 5 kPa at high power and to 2 kPa at idle conditions. The bearing chamber pressure was approximately atmospheric (Pchamber = 1 bar) and the bearing chamber was scavenged by a scavenge pump. In order to investigate the potentials of the windback seal, different configurations and operating conditions were simulated. The qualification criteria were the seal’s ability to induce air flow in the direction towards the bearing chamber thus inhibit oil particles from overcoming the thread.
Oil particles with diameters between 0.01 and 2 mm were induced downstream of the windback. The permissible sealing air backflow rate was set less than 4% of the total air mass flow. The number of scallops in the shaft was varied between 0 (smooth shaft) and 24, the rotational speed was varied from 0 rpm (static) up to 45,000 rpm. The direction of shaft rotation and the direction of the helical cut (right hand thread) were initially the same. Nevertheless, opposite direction of rotation was simulated as well. The seal clearance was modified by assuming half and double the nominal clearance (0.3 mm). Finally, the number of threads was increased from 3 to 5 and also the width of the scallops was modified (half or double the size of the nominal scallop width).

3. CFD Simulation

The CFD analysis was performed with ANSYS CFX Version 11 [3]. The geometry of the model was imported from a CAD model. The meshing architecture was validated in two steps: Firstly, a comparison between a hexahedral and a tetrahedral mesh was conducted. Modelling of the helical cut using hexahedral elements was not feasible due to the increased complexity of the geometry. In order to check the possibility of using a tetrahedral mesh, a comparison was done on the basis of a labyrinth seal. The latter was modelled once using full tetrahedral and once using full hexahedral elements. Since the difference in the computed air flow rates at the same pressure conditions was negligible, the thread of the windback seal was finally modelled using a full tetrahedral mesh. Two meshes were created and compared for sensitivity reasons: a mesh with 9 million elements (1.8 million nodes) and a mesh with 12 million elements (3 million nodes). The results of the analysis with both meshes showed negligible differences. For this reason, the 1.8 million nodes mesh was used for further computations.
The non-dimensional wall distance y+ was controlled. y+ is commonly used in the boundary layer theory and is defined as the ratio of the product of the friction velocity u* at the nearest wall node and of the distance y to this node to the local kinematic viscosity ν of the fluid, y+ = u* y/ν with u* = (τw/ρ)1/2 and τw the wall shear stress.
For a good quality mesh, y+ should be less than 50 and the recommendation is for values between 20 and 30. The Shear Stress Transport (SST) model was selected using with an automatic near wall treatment. SST is an ω-based model and for y+ values over 11 scalable wall functions are used. y+ values which are much less than 11 are important when heat transfer is involved. This is not the case in this work.
Inlet and Outlet (Figure 3) were both treated as “Opening” and total pressures and temperatures were set as the boundary conditions. Both the Inlet and the Outlet were set permeable thus flow in either directions was enabled. All walls were modelled adiabatic. The Domain Motion for the shaft was set “rotating” with the angular velocity being the boundary condition.
At seal outlet, oil ingestion with particles of sizes between 0.01 and 2 mm originating from 100 circumferential positions was modelled. Oil has been assumed to be the discrete phase with air the continuous fluid. The drag force was modelled using the Schiller-Naumann equation [4] and the surface tension coefficient between air and oil was set 0.034 m/s. The CFD residual target was set 10−6. The Advection Scheme was selected High Resolution and for the Turbulence Numerics First Order was set. The computation was performed steady state on a Linux cluster with the use of 12 processors. The computation time was over 8 CPU hours.

4. State of the Art

Zimmermann and Wolf [5] have shown in their work on labyrinth seals that the mass flow rate through a multi-fin (n > 2) straight through labyrinth is a function of the “corrected” carry over factor, the discharge coefficient Cd and the ideal mass flow rate mid. mid is defined as:
m id = A P t T t 1 / 2 [ ( 1 (   P s P t ) 2 [ n   log N   ( P S P t )   ] ] 1 / 2
The “corrected” carry over factor is the product of the factor kH proposed by Hodkinson [6] and a correction factor kc from unpublished test results:
k H = [ 1 ( 1 n1 n ) ] 1/2 [ ( s t ) ( s t +0.02 ) ] 1/2
kc = [n/(n−1)]1/2
The corrected carry over factor is given:
k2 = kH kc
with n the number of fins, s is the clearance and t the pitch.
The discharge coefficient Cd is given in [5] in terms of graphs as a function of the Reynolds number Re and of the ratio between the clearance s and the fin tip width b.
Within the scope of this paper the graphs were approximated by polynomials with an accuracy of 98%. The discharge coefficients for n < 2 and n > 2 are given below:
n < 2:
δ =   ( log ( R e 1.795699 ) + log ( s b ) 3.736003 )
C d = 10 [ 0.000751646   ( δ ) 3   0.027863   ( δ ) 2 + 0.3404445 ( δ ) 1.579305 ]
and for n > 2:
C d =   10 ( C 1   x 3   +   C 2   x 2   +   C 3   x   +   C 4 )
with x = Log10 Rea + Log10(s/b)b and
  • C1 = 6.22819 × 10⁻⁸
  • C2 = −5.82396 × 10⁻⁵
  • C3 = 0.017891931
  • C4 = −1.986063294
  • A = 52.4 and b = −61.94
The labyrinth mass flow rate is given by:
mLS = k2 Cd mid
Kutz and Speer [7] and Zimmermann and Wolf [5] give an overview of the correlations, which are used in secondary air systems simulations including labyrinth seals.
Morisson and Al-Gahsem [1] have developed in their work on windback seals their Cd correlation. They investigated windback seals at pressure differences of 34.5, 68.9 and 103.4 kPa. These values are much higher than the targets set in this manuscript (<5 kPa). Their Cdw correlation is strictly valid for the geometry given in [1]:
C dw =a+  b log N  ( P out P in )   + co  [ N ] 1 / 2
with
  • a = (0.06946 + 34550s1.5)0.5
  • b = (−9.09 × 10⁻⁴ + 3.569 × 10⁻¹¹/s2)
  • co = −7.475 × 10⁻⁴ − 1.372 × 10⁻⁴ × LogN(s)
and the mass flow rate through the windback is calculated using:
mwb = Cdw πD s [ρin (Pin − Pout)]1/2

5. Results

The targets set through this paper are as follows:
(1)
flow evaluation as a function of the operating conditions for different windback seal designs
(2)
oil particle ingestion downstream of the windback seal and particle tracing in order to evaluate the ability of the seal to repulse oil

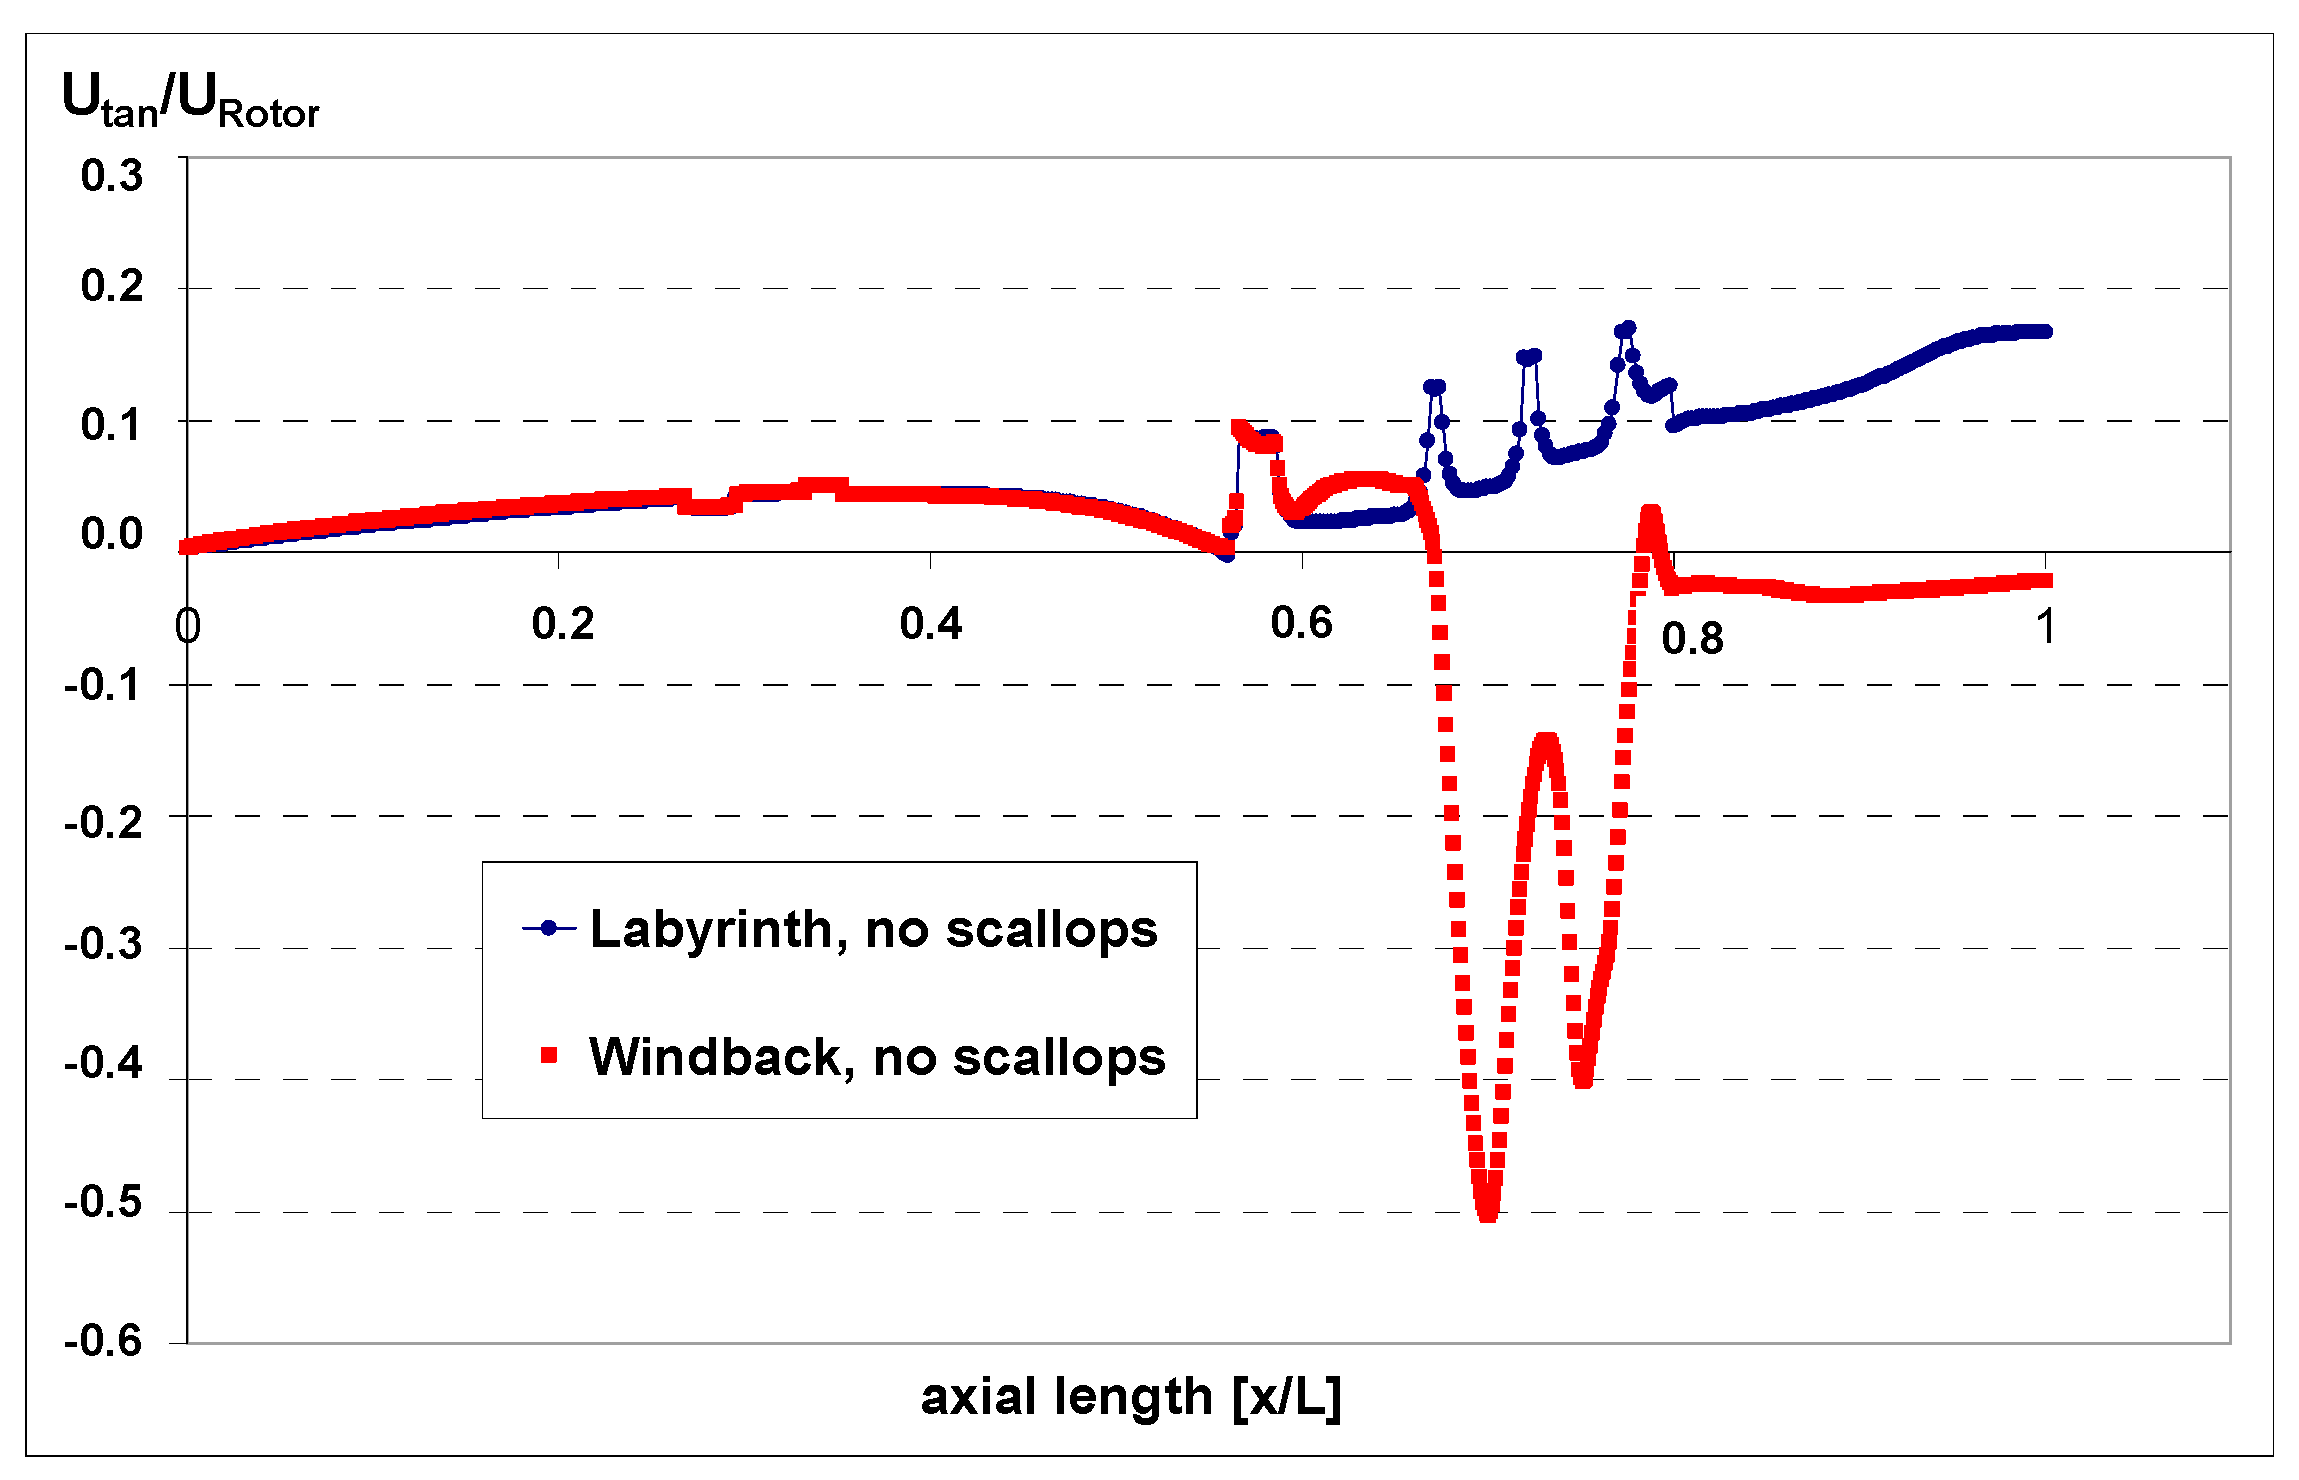
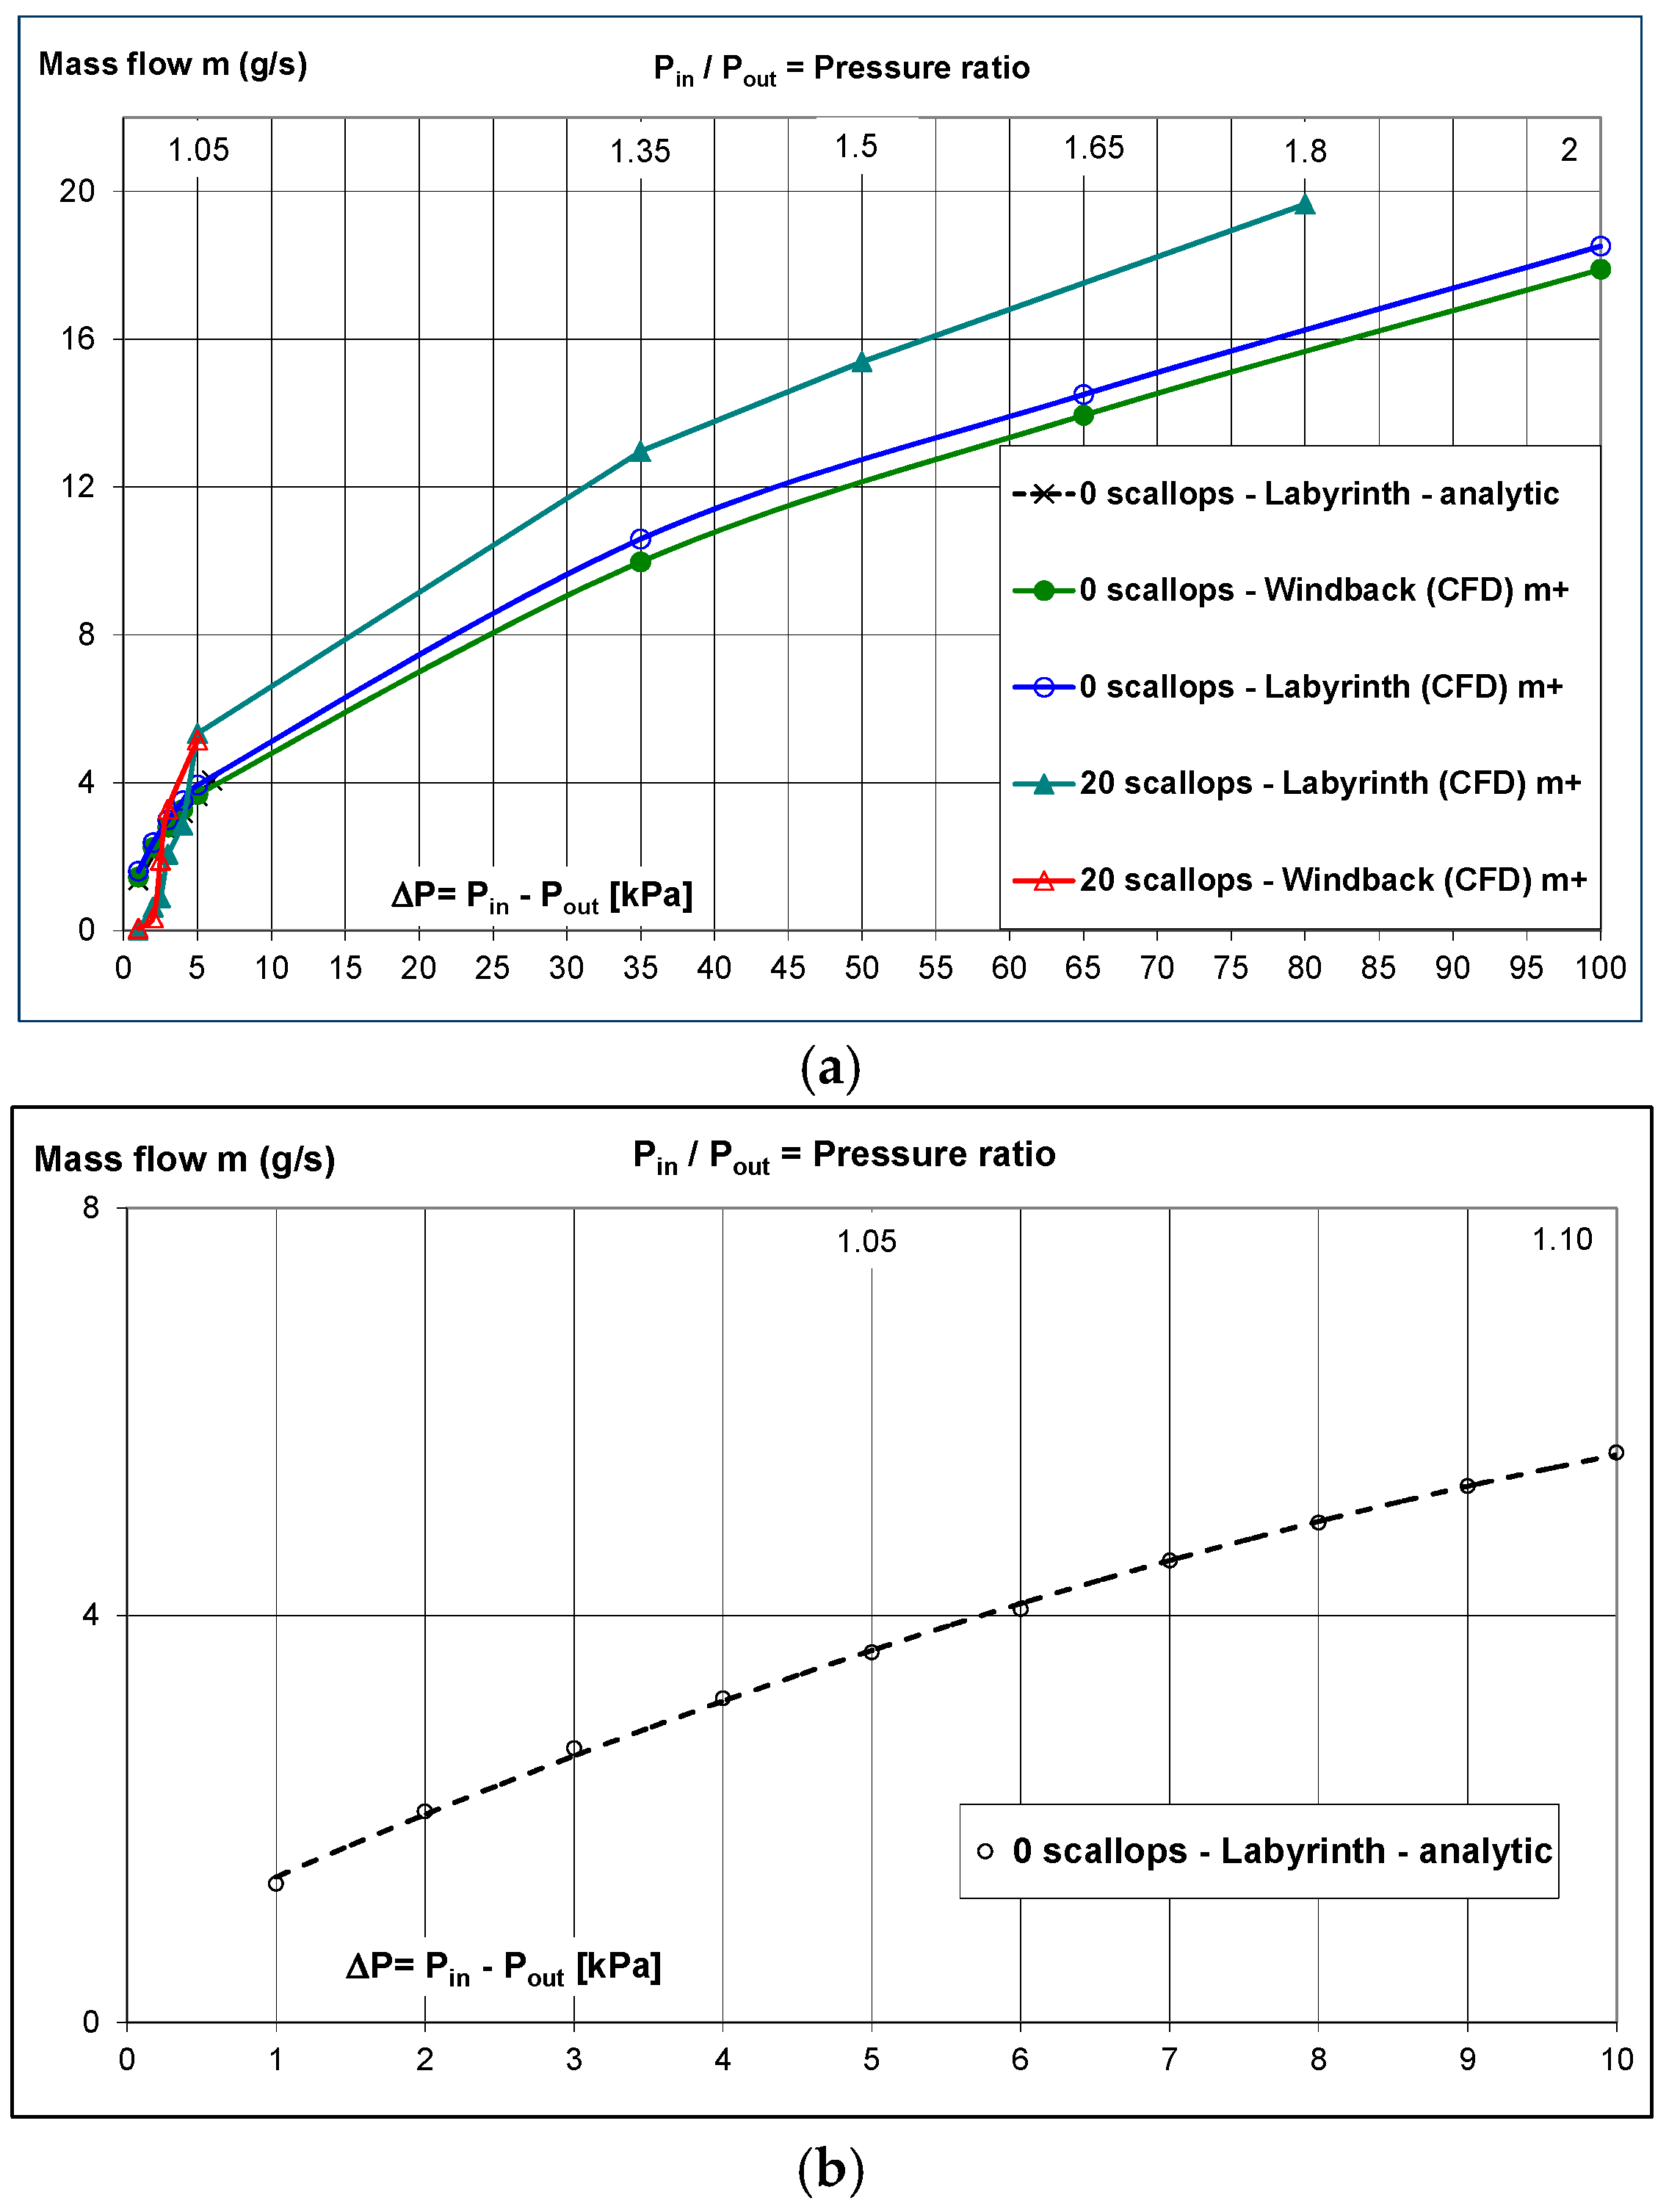
5.1. Comparison between Windback and Labyrinth Seal with a Scallop Free (Smooth) Rotor

Firstly, a three fin windback seal and a three fin labyrinth seal were compared. Both seals have had the same dimensions with the only difference the fin shapes (helical cut vs. fin tip row). Contrary to the usual labyrinths used in aero engine applications this labyrinth seal has had the fins on the static part. Also, contrary to the existing designs, the windback seal rotor was assumed “smooth,” i.e. no scallops are engraved. These simplifications were done in order to enable comparisons between the two seal types. It was assumed that the air mass flow rate at inlet was 12 g/s at 100 °C. This is a typical operating condition.
Figure 4 and Figure 5 depict the variation of the static pressure, the velocity, the static and total enthalpies in the labyrinth seal. If in Figure 5 an imaginary line is drawn connecting the points A, B, C and D the resulting curve is the Fanno curve. The corrected carry over factor is calculated 1.871 from Equation (2), the Cd is 0.536 from Equation (4), the ideal mass flow rate is 10.4 g/s from Equation (1) and the real mass flow rate is approximately 10.4 g/s as well. Thus, the mass flow deviation between the analytic and the CFD approximation is 1.6 g/s (14%). The resulting pressure difference across the labyrinth seal is 42.4 kPa (resp. PR = 1.424).
Figure 6 and Figure 7 show the static pressure, velocity and enthalpy variations in the windback seal. In this case the helical fin accelerates the flow circumferentially and the pressure drop is rather similar to that for a duct flow than that for labyrinth flow.
The numerically calculated pressure drop across the windback seal at 12 g/s is 43.4 kPa (PR = 1.43 with Pin = 1.434 bar). If the calculated inlet pressure is used in Equation (7), Cdw = 0.6947. This value is the numerically calculated discharge coefficient.
Using the inlet pressure above and also Equation (6) a discharge coefficient Cdw = 0.4699 is calculated. This value is about 44% lower than the numerically estimated value. If Cdw = 0.4699 is introduced into Equation (7) the resulting air flow rate is 8.4 g/s. This value is about 30% lower than the value derived from CFX (12 g/s). If simply the mass flow of 12 g/s is considered, Equations (6) and (7) can be solved for determining the inlet pressure and the discharge coefficient. The resulting values are Pin = 1.734 bar and Cdw = 0.4688 respectively. For the designer, Equations (6) and (7) yield the most pessimistic results whereas results using CFX are the most optimistic.
Figure 8 and Figure 9 show axial velocity contours for both seals.
The helical cut forces the flow to move more circumferentially thus the carry over effect is lower compared to the labyrinth seal. For this reason, the windback seal produces higher pressure drop. In order to verify this assumption, the ratio of the tangential velocities in the cavities to the rotor velocity were plotted against the axial length of the seals. This is depicted in Figure 10. In the case of the windback seal the flow is accelerated in the direction opposite to the direction of rotation. This is not the case in the case of the labyrinth seal. The authors believe that the flow in the windback seal is ‘choked’, thus higher flow resistance and higher pressure drop result.

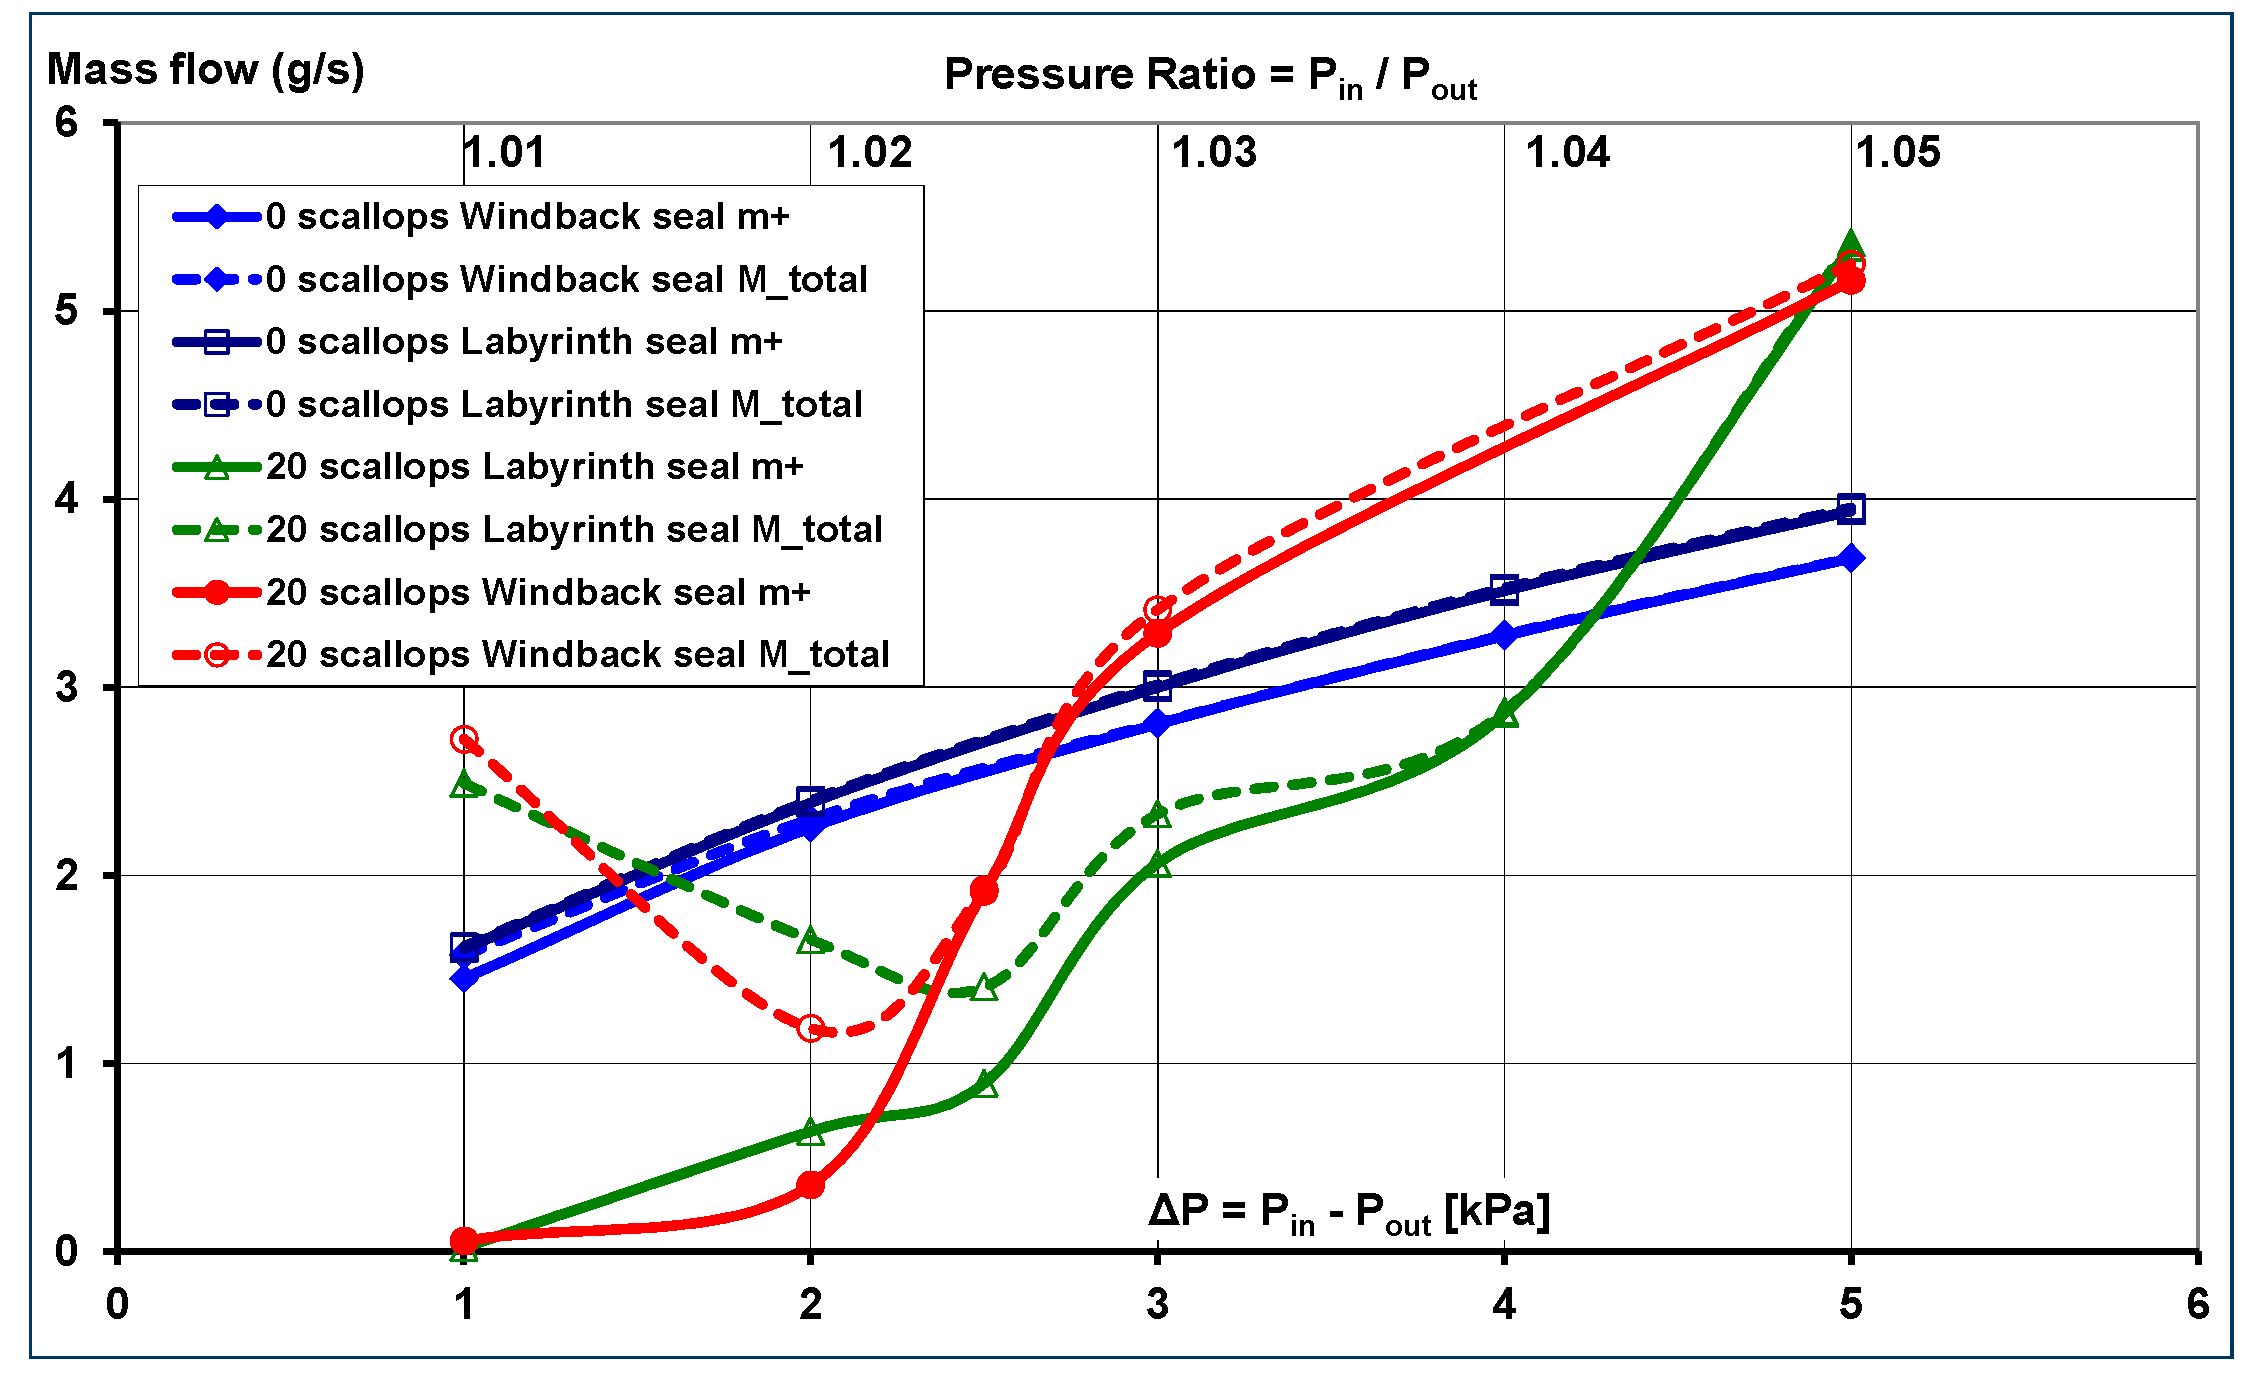
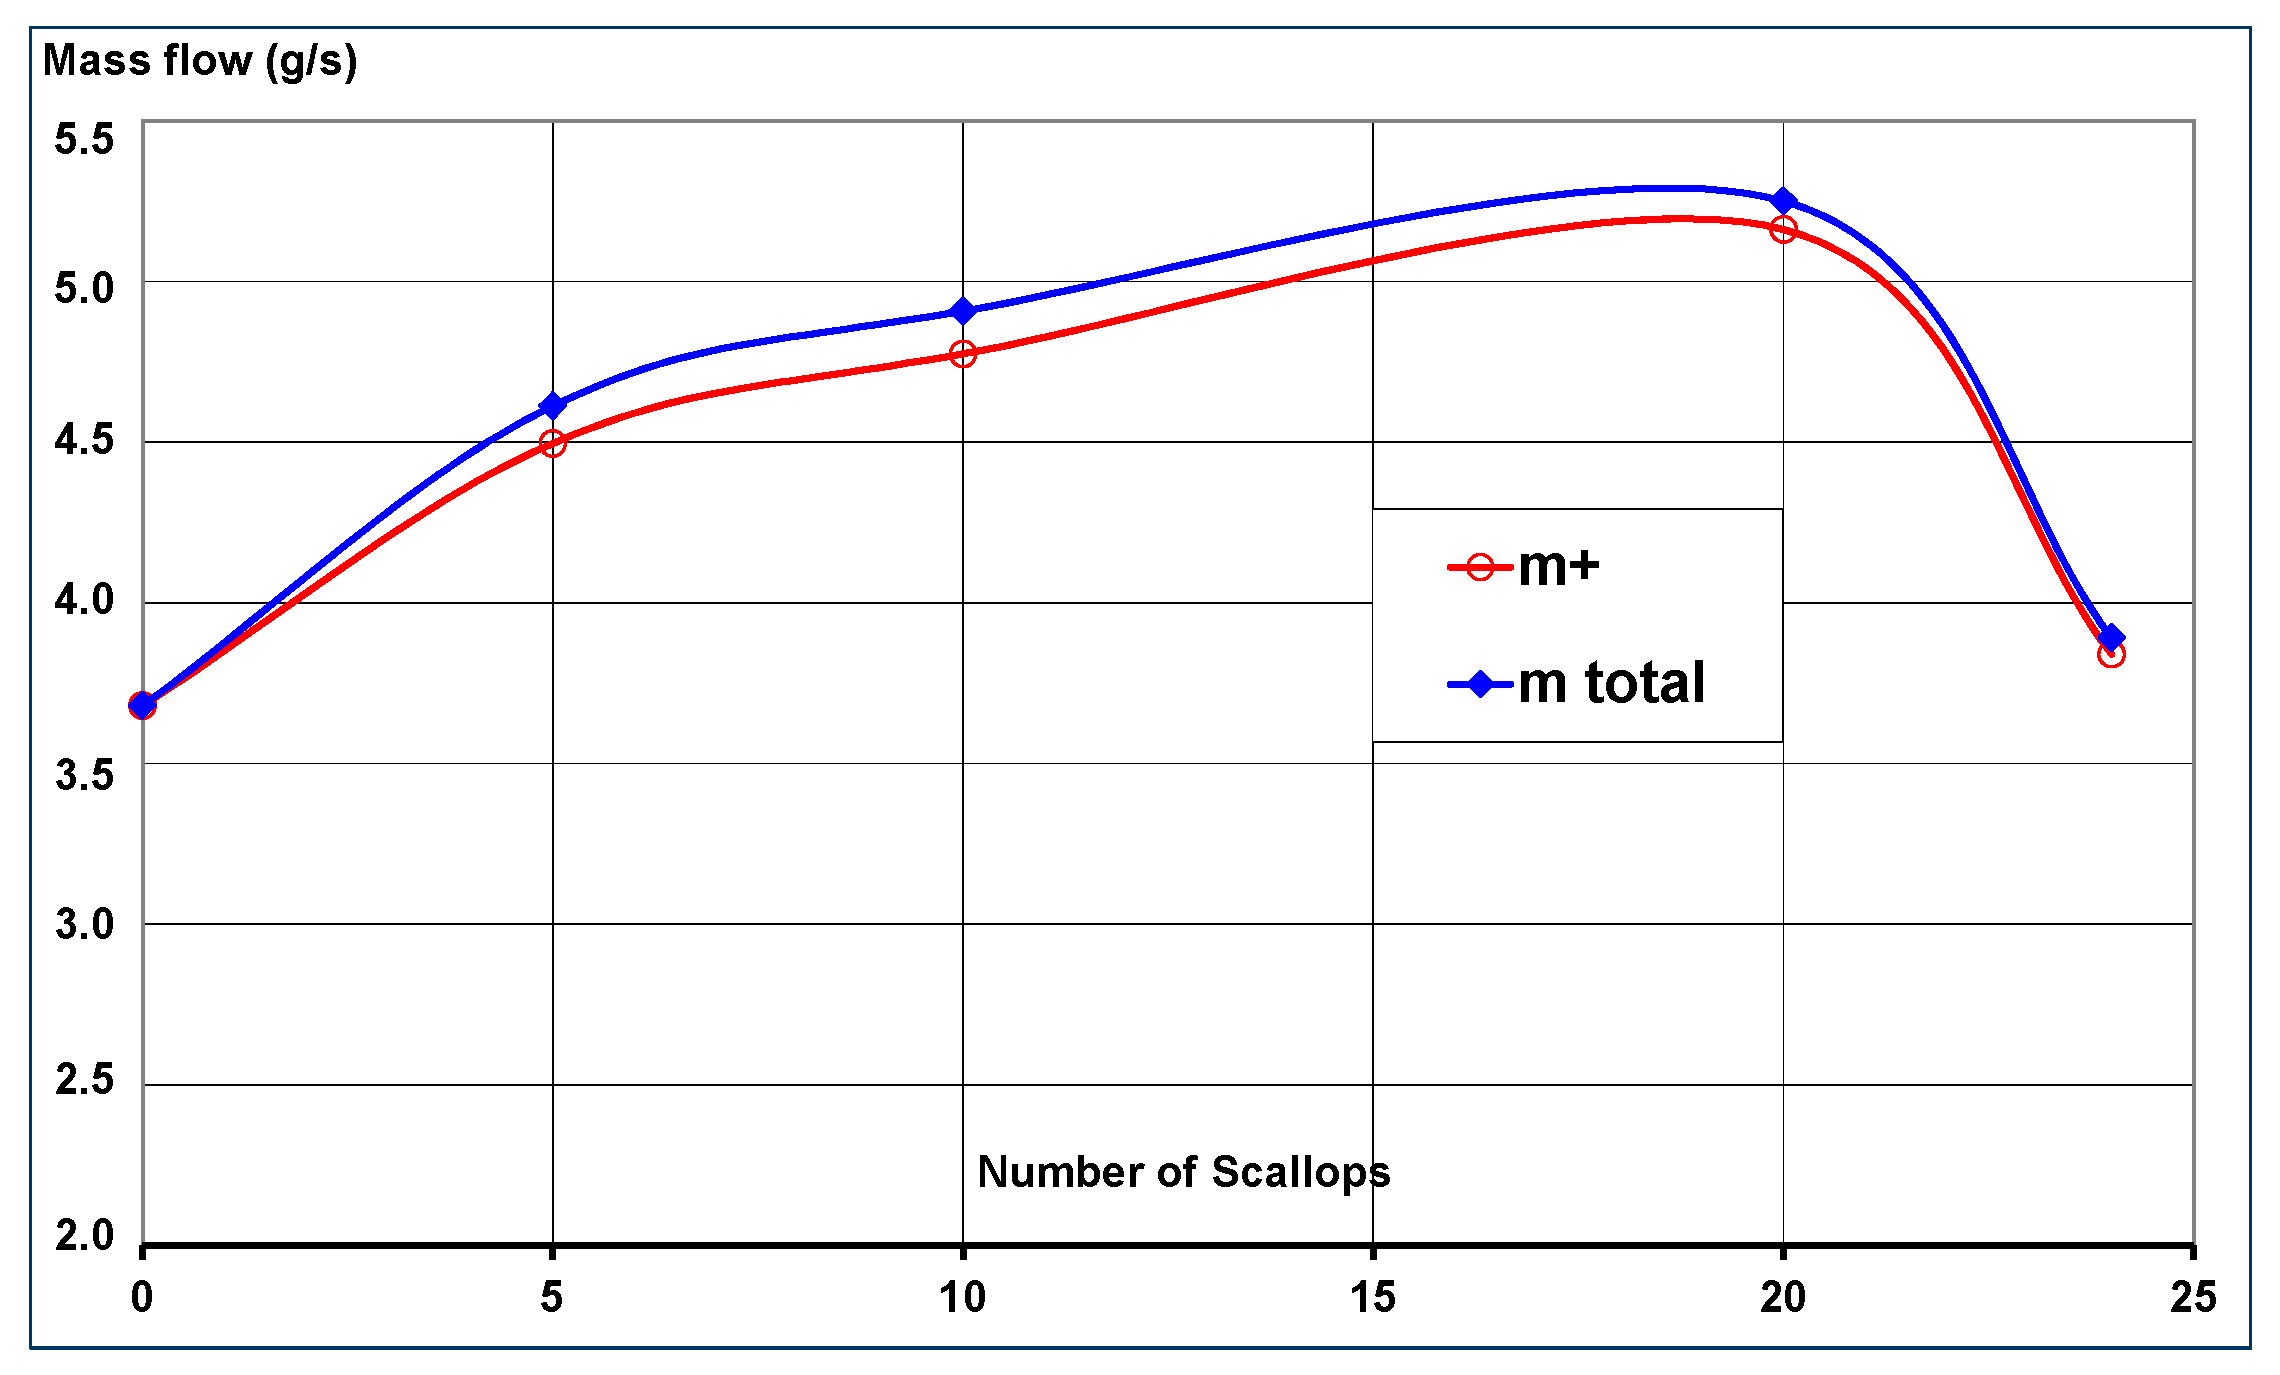
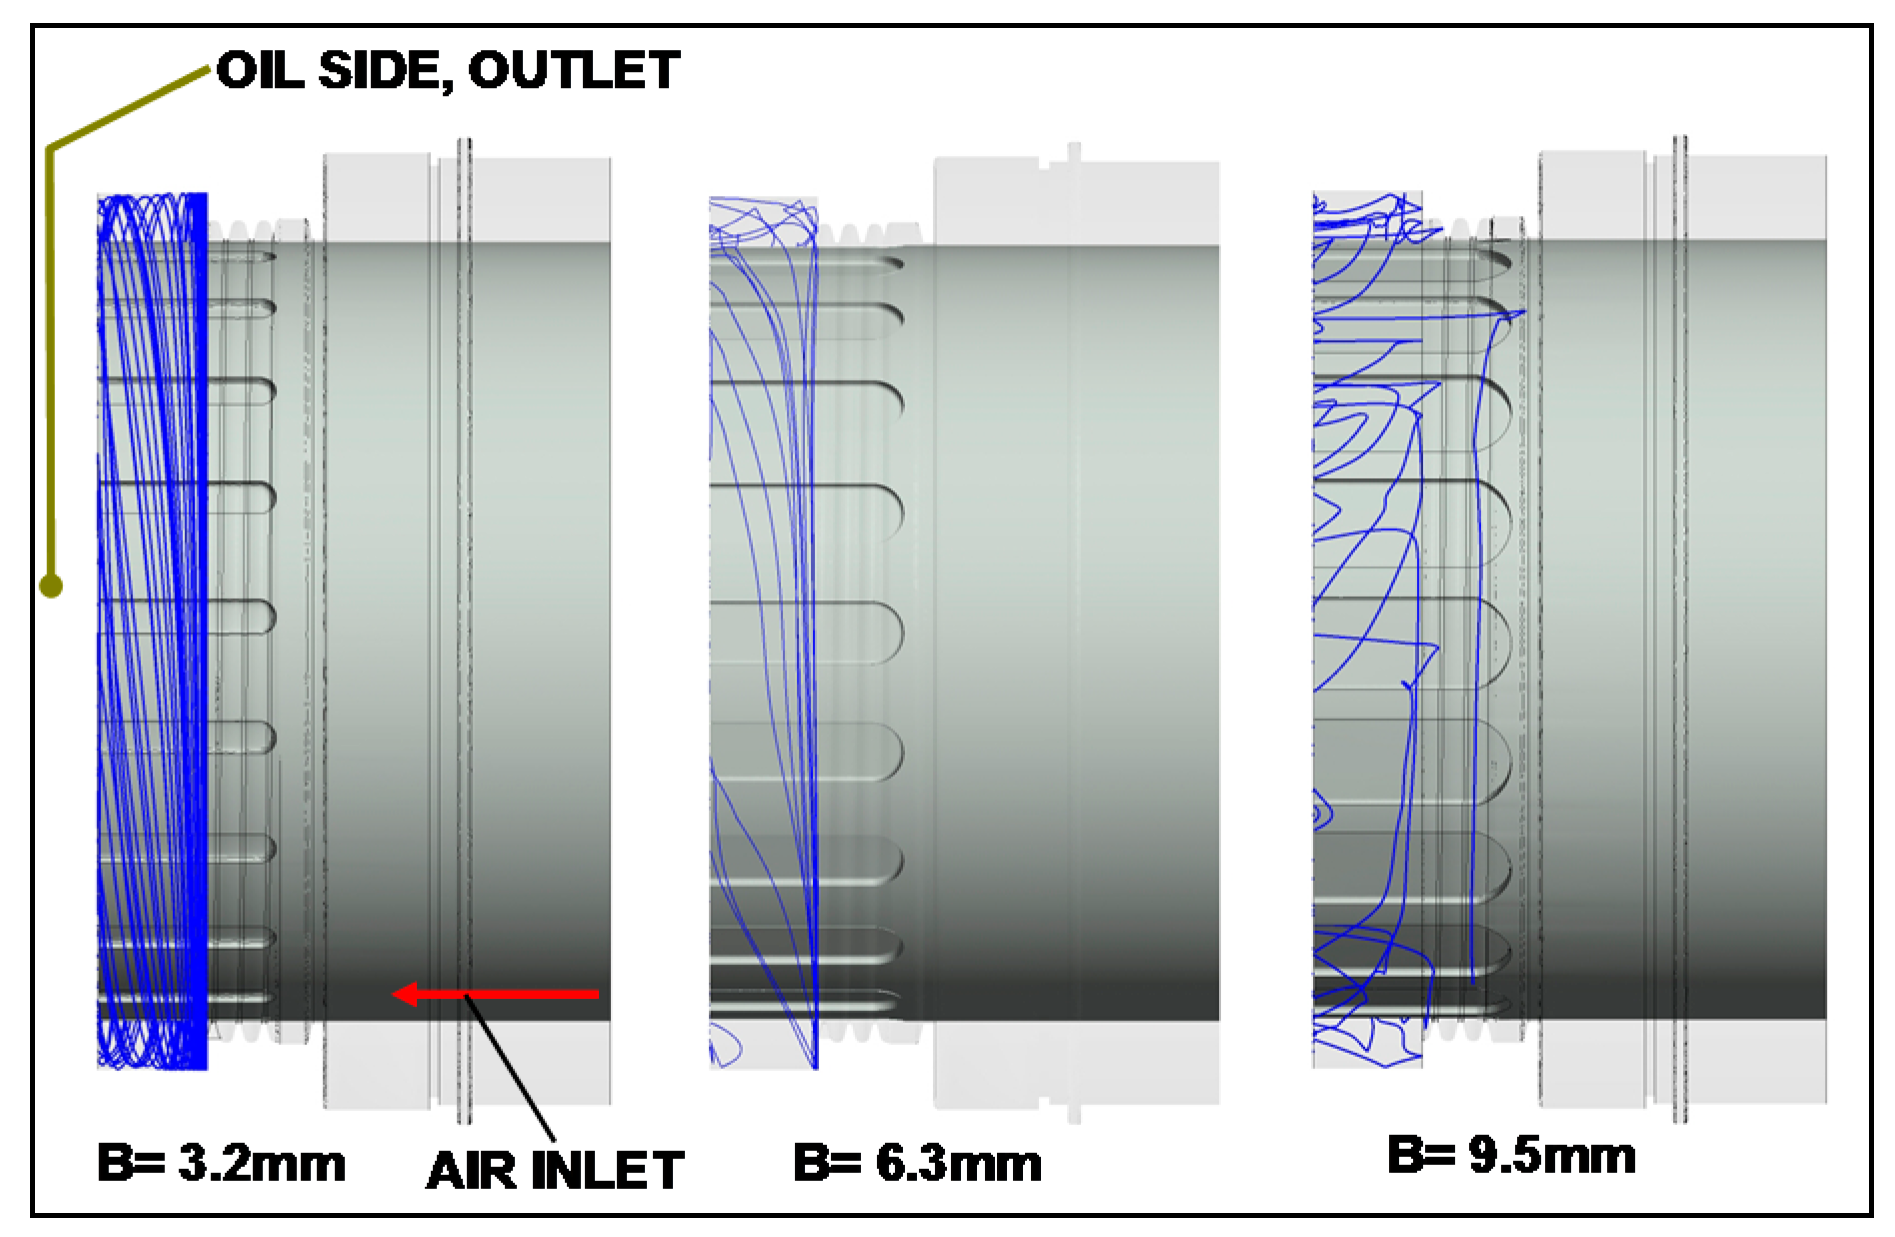
5.2. Impact of Rotor Scallops

The presence of scallops in the rotor and their impact on the flow through the labyrinth and the windback seal is investigated. When the rotor is smooth, 100% of the air flows through (no backflow detected). When the rotor has scallops, some of the air mass flow moves backwards (backflow) and only the so called effective mass flow m+ passes through, with m+ = mtotal − mbackflow.
This is shown in Figure 11a,b, Figure 12 and Figure 13. Figure 11b shows the 0 scallops labyrinth seal performance curve since this curve is not clearly visible in Figure 11a.
In the case of a windback seal and 20 scallops engraved in the rotor, the backflow considerably increases at a pressure ratio less than 1.02. In this case, almost 98% of the flow is a backflow (Figure 12). The authors believe that at low pressure ratios the scalloped rotor is chocked. At higher pressure ratios, the scallops seem to have a pumping action which boosts the total mass flow rate (Figure 12). The difference in total mass flow between two windback seals, one with 0 scallops and one with 20 scallops in the shaft, is about +30% in favour of the scallops. Similar backflow behaviour is also shown by the labyrinth seal. Nevertheless, the increase in total mass flow is less compared to the windback seal.
When the labyrinth seal is combined to a smooth rotor, a very good agreement between the analytic and the numerical computations at low pressure ratios was detected. For the windback seal, the analytic evaluation using the Morisson et al. correlations seem to be valid for the cases described in [1] only. In Figure 13 the influence of the scallop number on the backflow rate was investigated. A smooth rotor causes no backflow. But, with increasing number of scallops in the shaft, the total flow due to the pumping action increases. This is not unlimited as Figure 13 shows. The optimum number and size of the scallops for a certain application will be investigated in future. The average backflow rate for the cases displayed in Figure 13 is about 2% of the total flow.

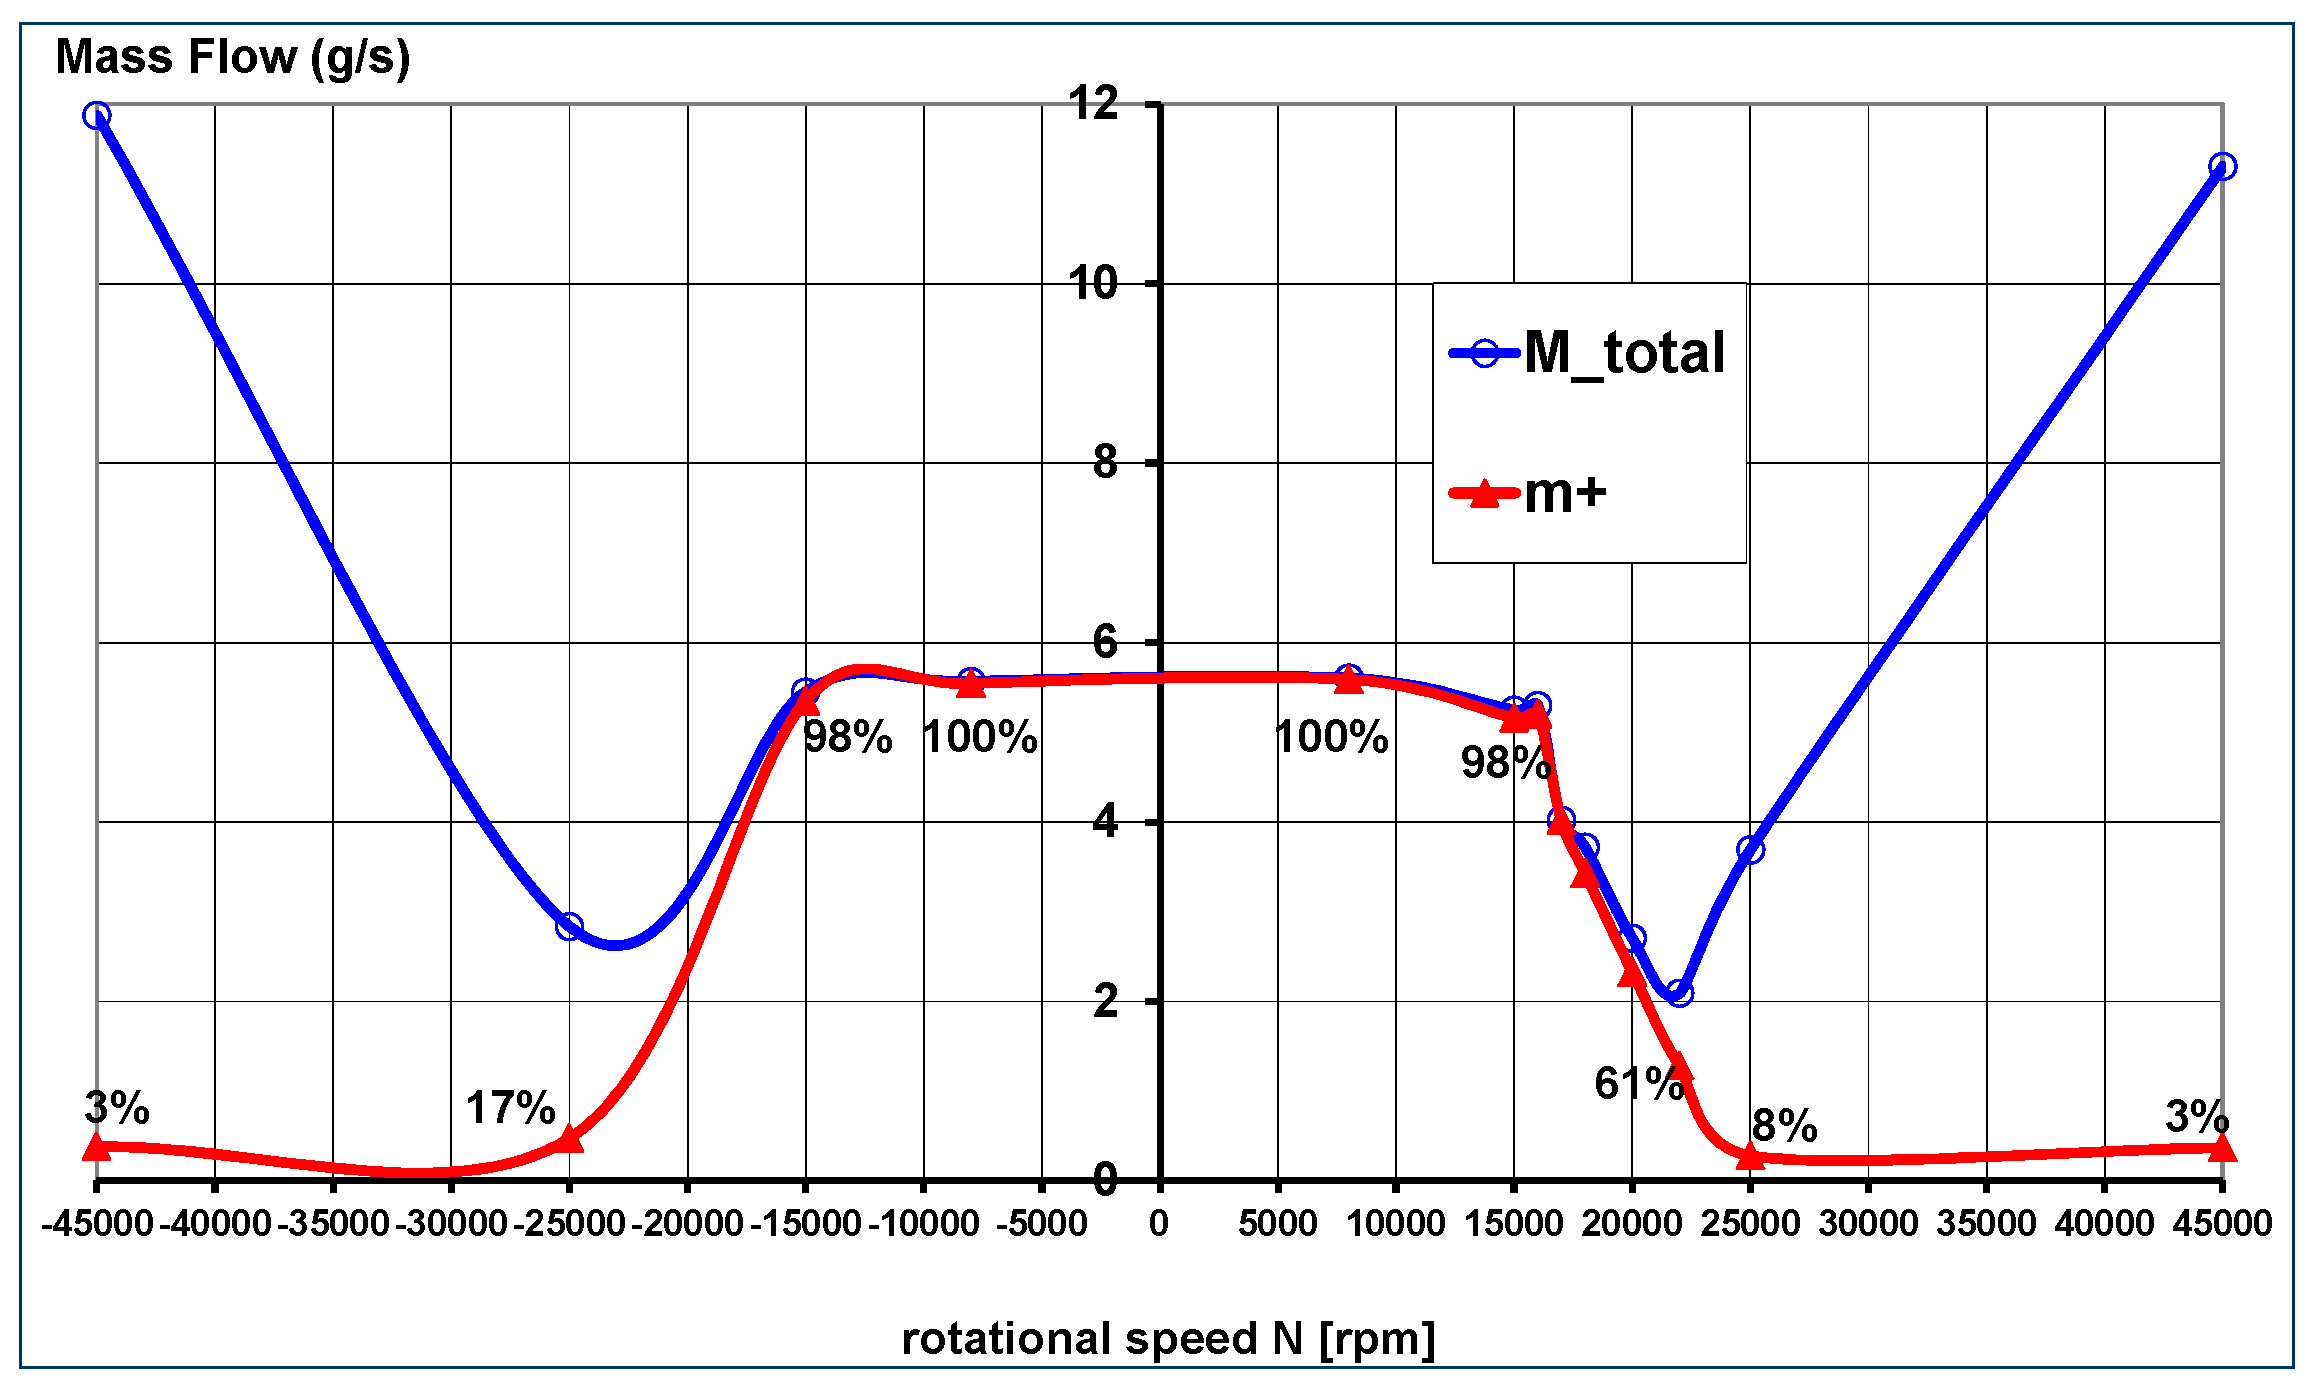
5.3. Impact of the Rotational Speed and Direction

A windback seal with having 20 scallops in the shaft and a clearance of s = 0.3 mm was considered to be the baseline seal.
The impact of the rotor speed and of the rotating direction were investigated and the results are shown in Figure 14. Negative rotational speed numbers indicate that the direction of rotation is opposite to the direction of the helical cut. At rotational speeds over +22,000 rpm the seal becomes unstable with increasing backflow rate. At +45,000 rpm, almost 100% of the total flow is backflow (97% mtotal). The effective mass flow m+ is only 3% of the total mass flow. In the opposite direction against the direction of the helical thread (-) the seal instability begins at about −15,000 rpm whereas at −45,000 rpm the backflow rate is dominant (m+ = 3%mtotal).

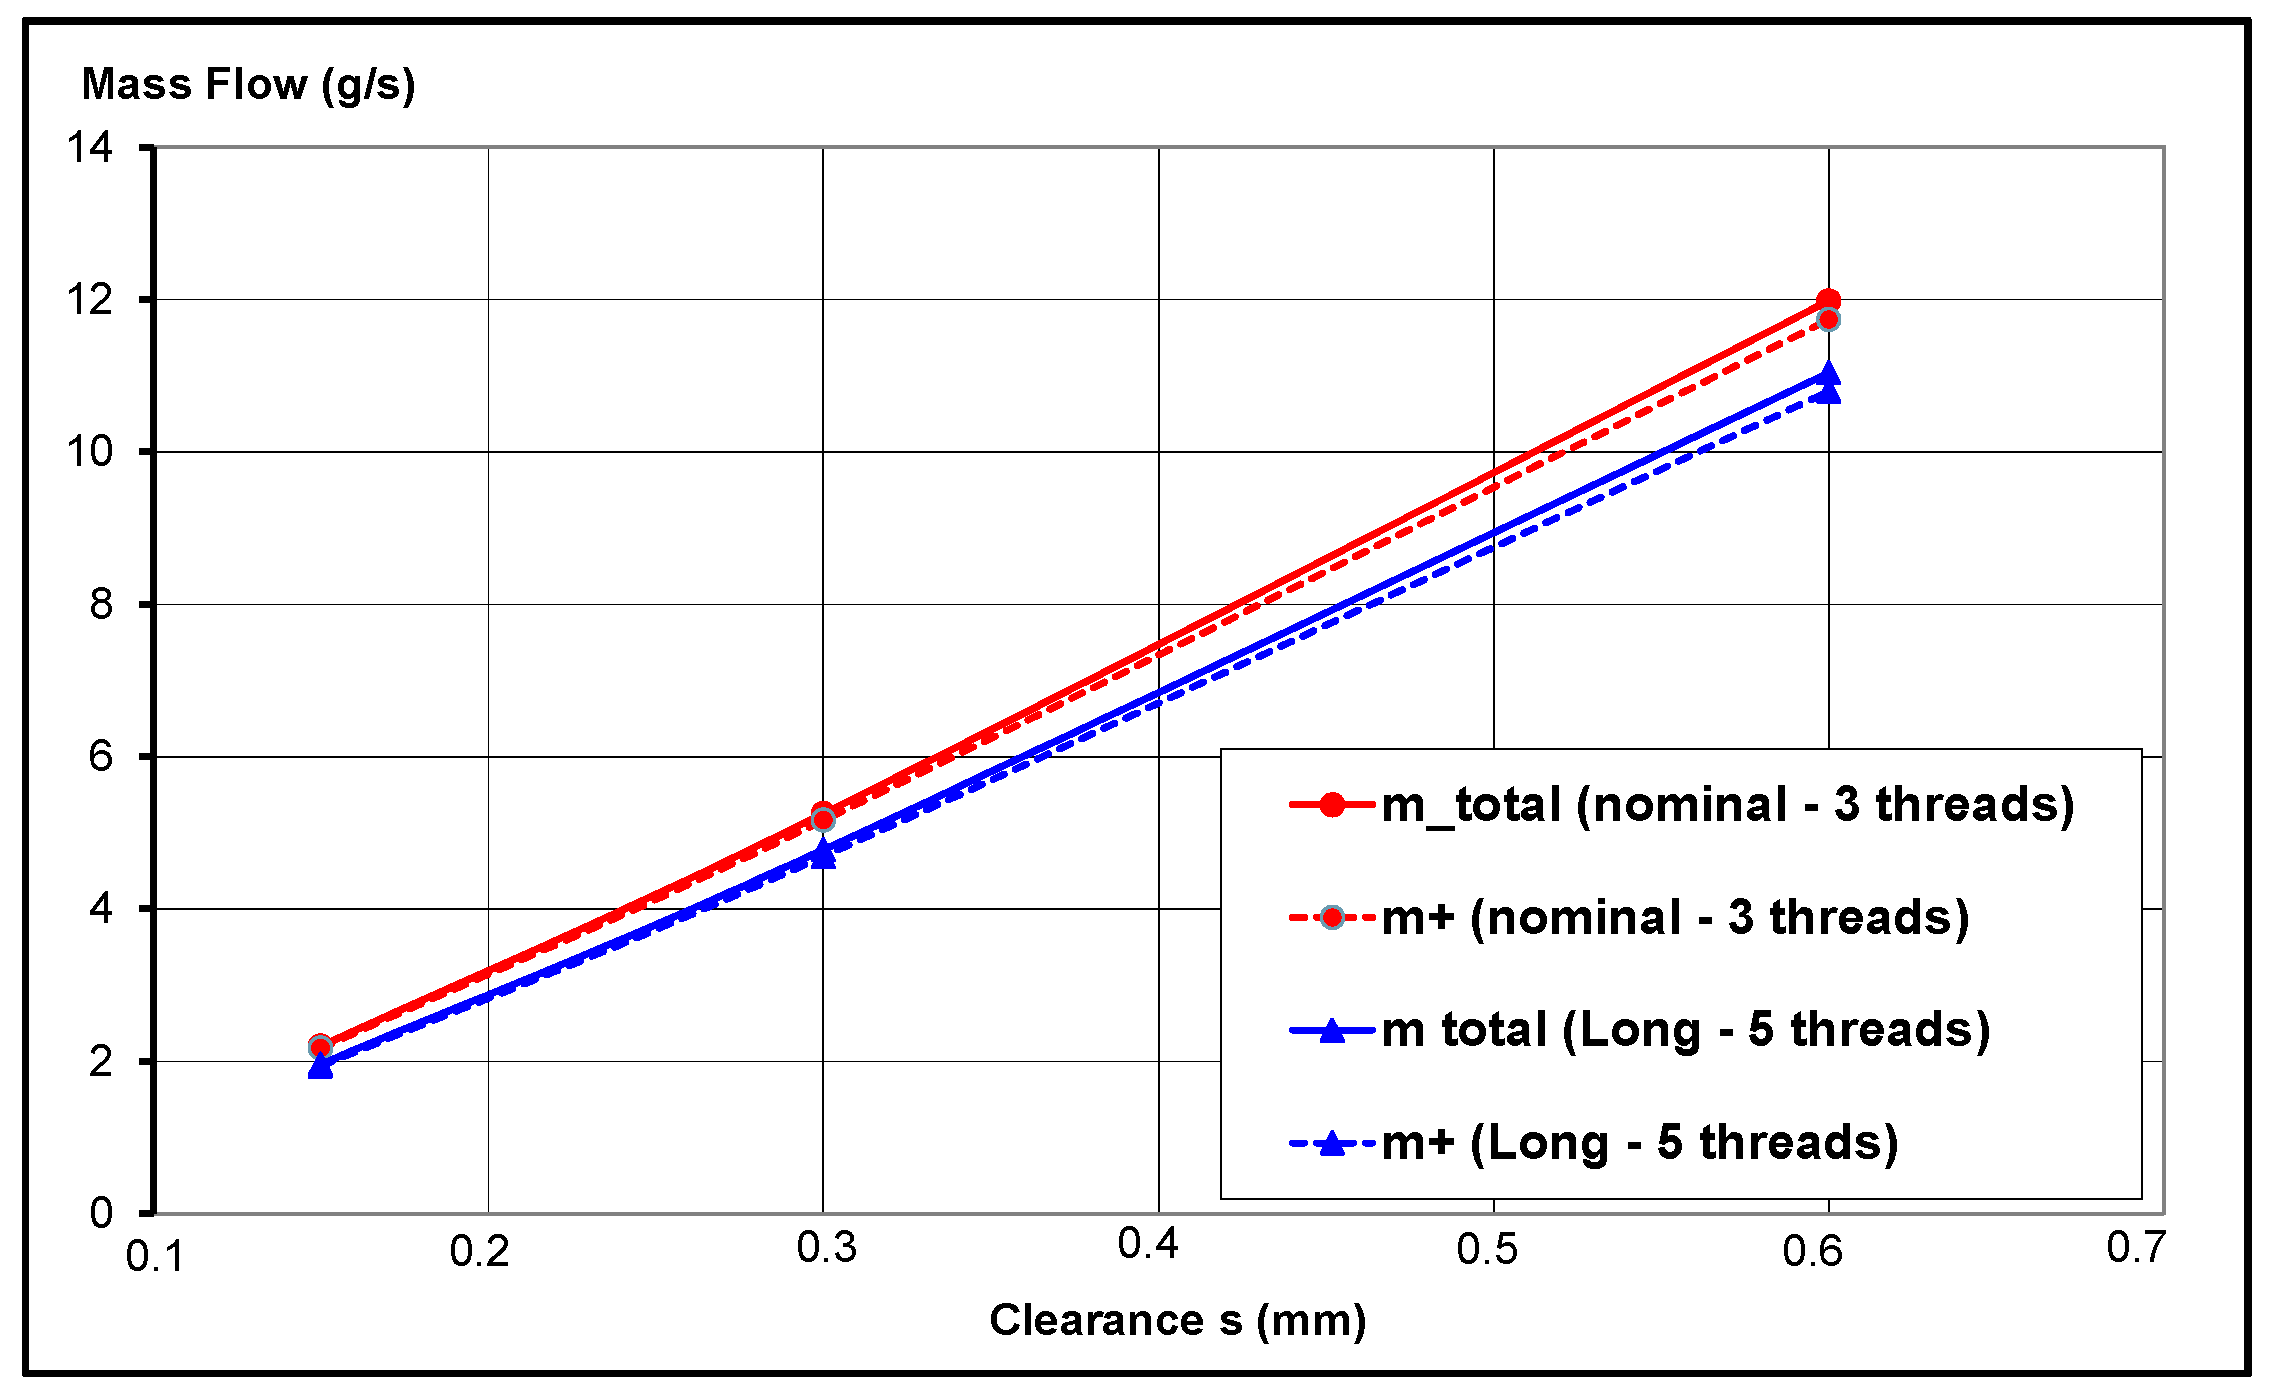
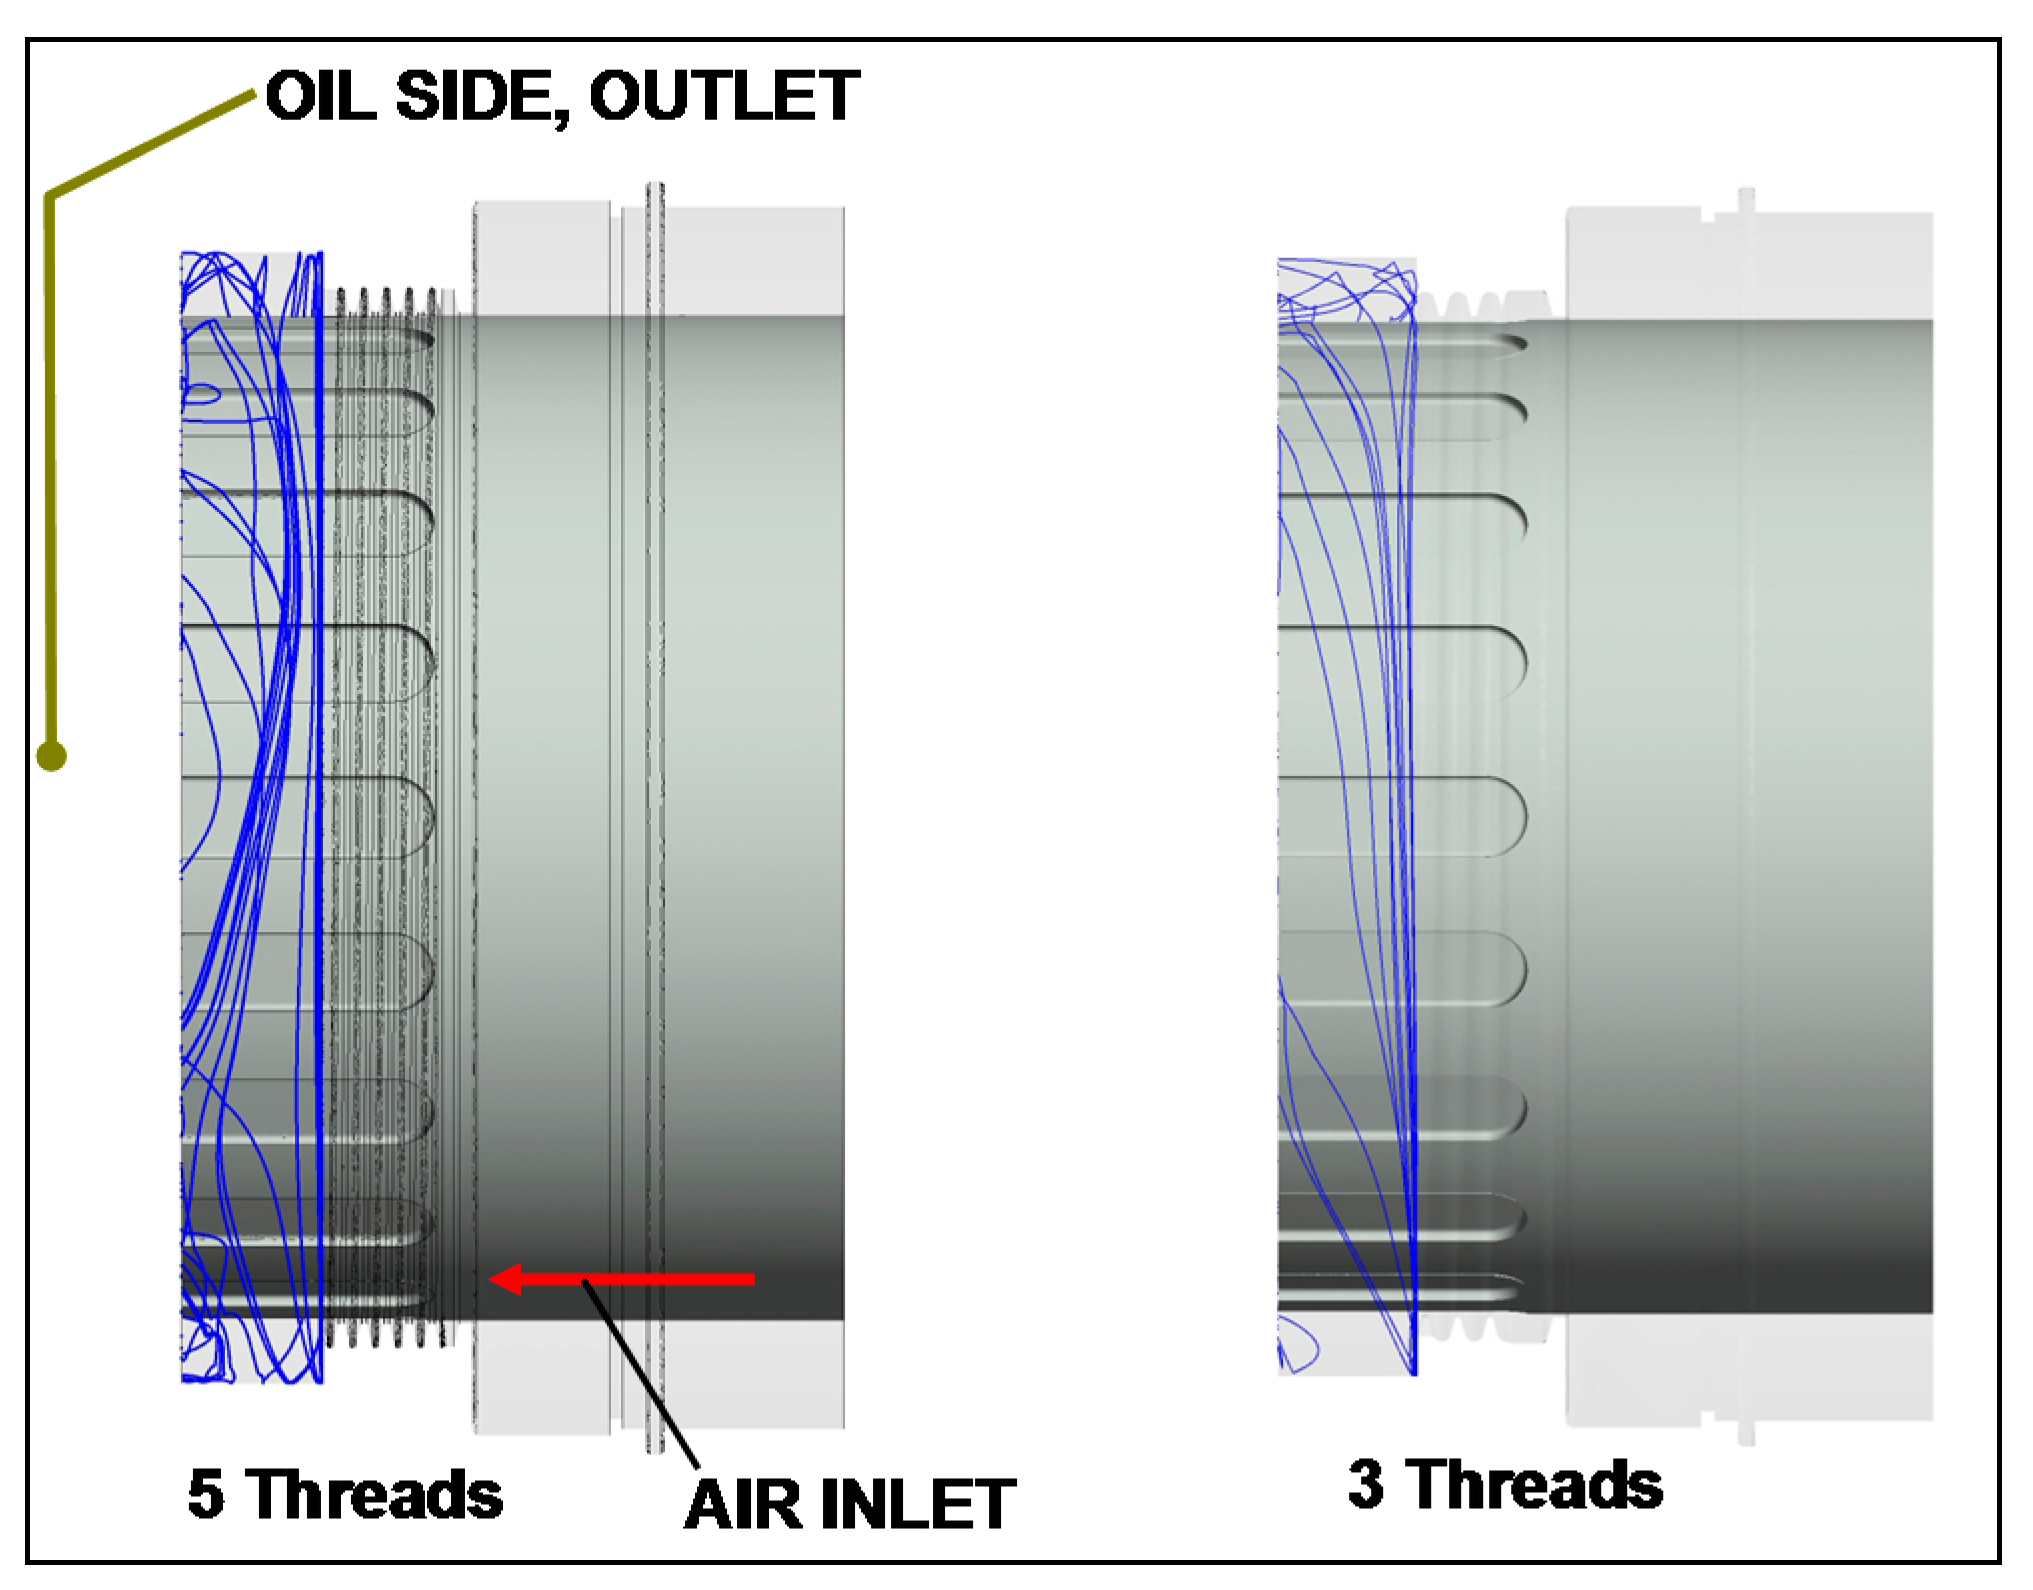
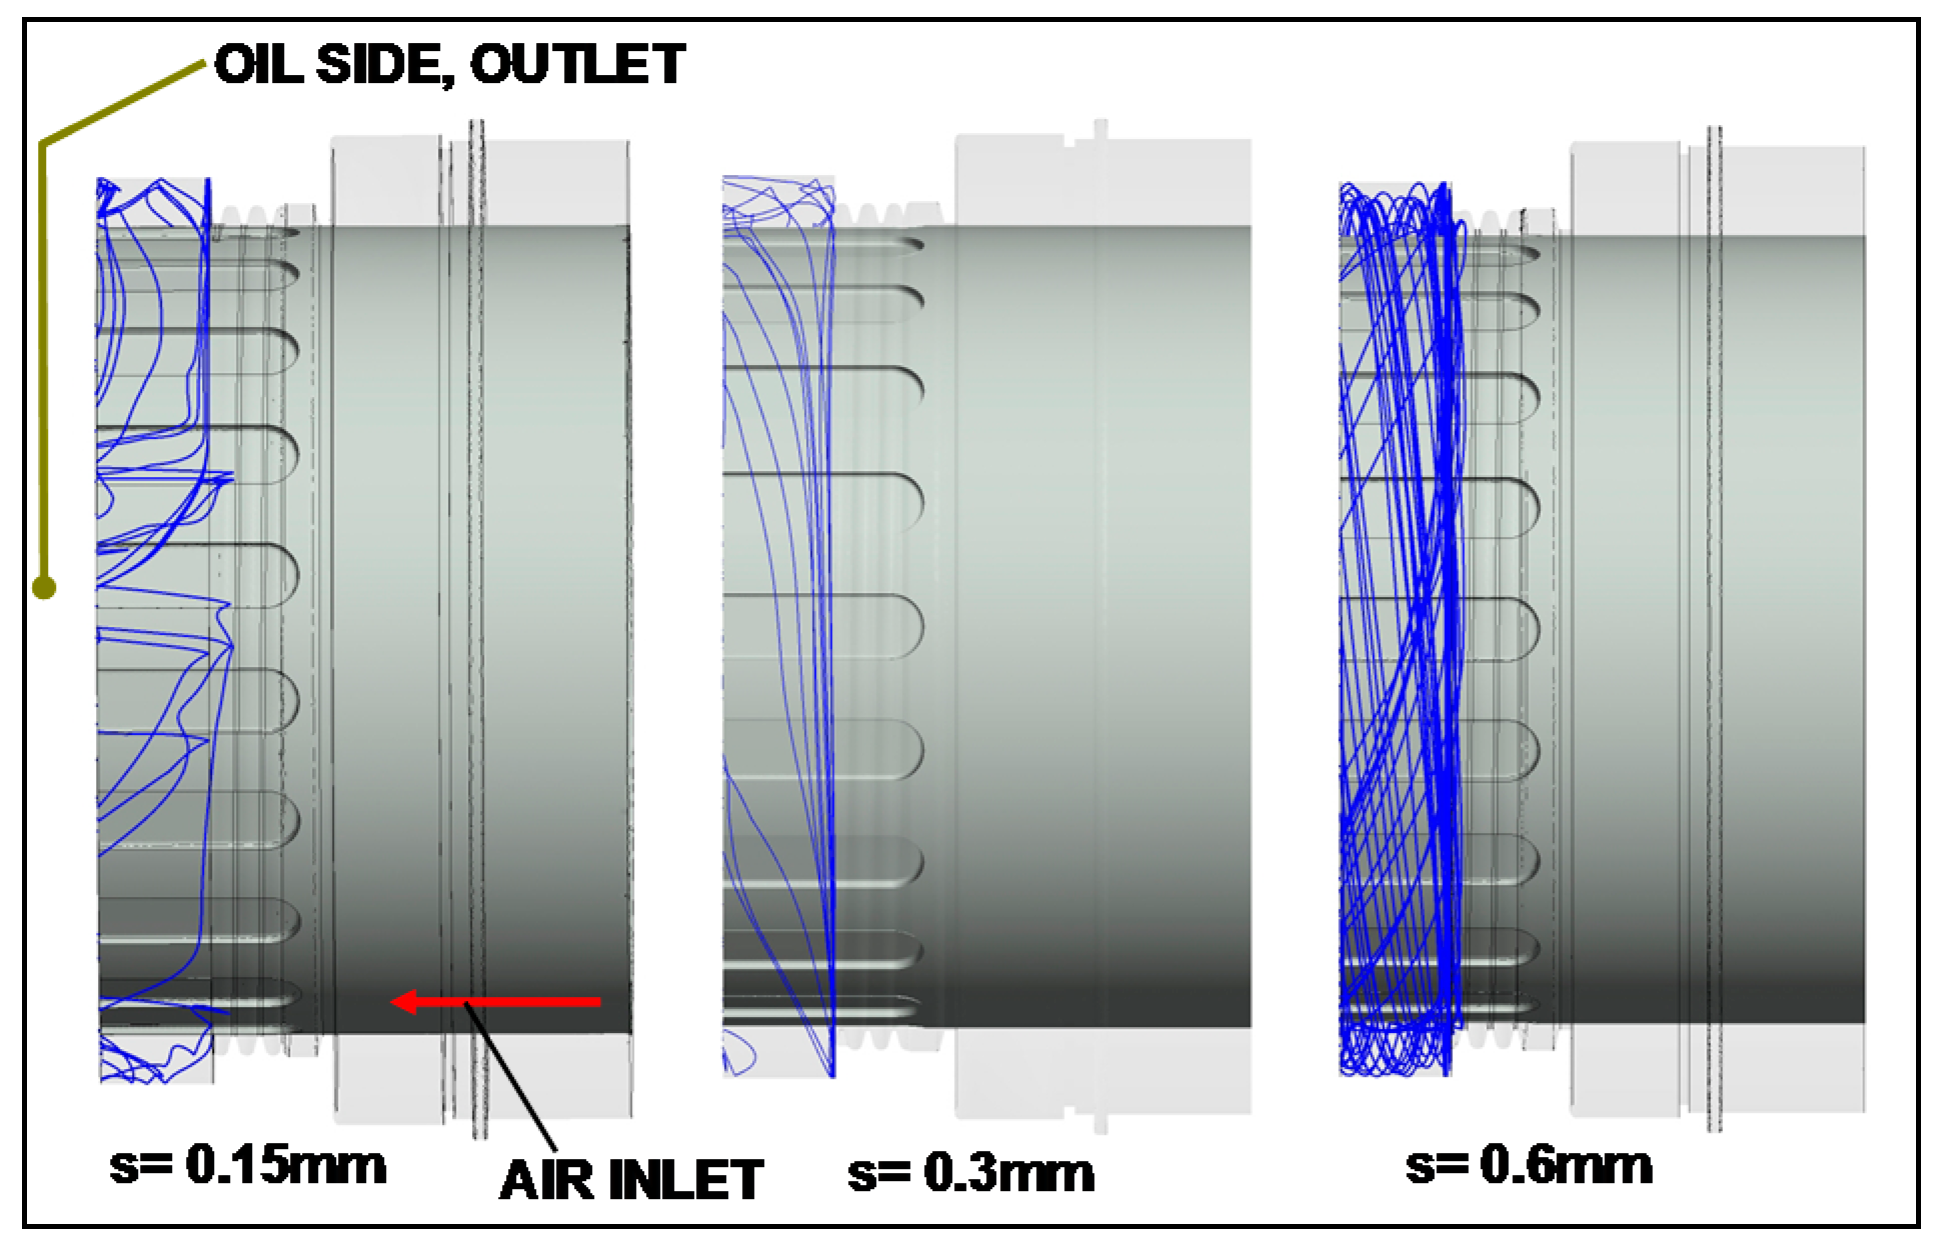
5.4. Impact of the Length of the Helical Thread and of the Clearance

Figure 15 depicts the total mass and the backflow rate variation as a function of the length of the helical cut and of its clearance s to the rotor. The operating condition is at 15,000 rpm and the pressure ratio 1.05.
The helical cut was enlarged from 3 to 5 threads and the clearance s was varied from 0.15 mm to 0.6 mm with 0.3 mm being the baseline. As expected, the higher the clearance the higher is the mass flow which can go through the seal. The five thread seal is more restrictive to the flow. The impact of a pressure ratio below 1.05 as a function of the thread length and of the clearance are still to be investigated.

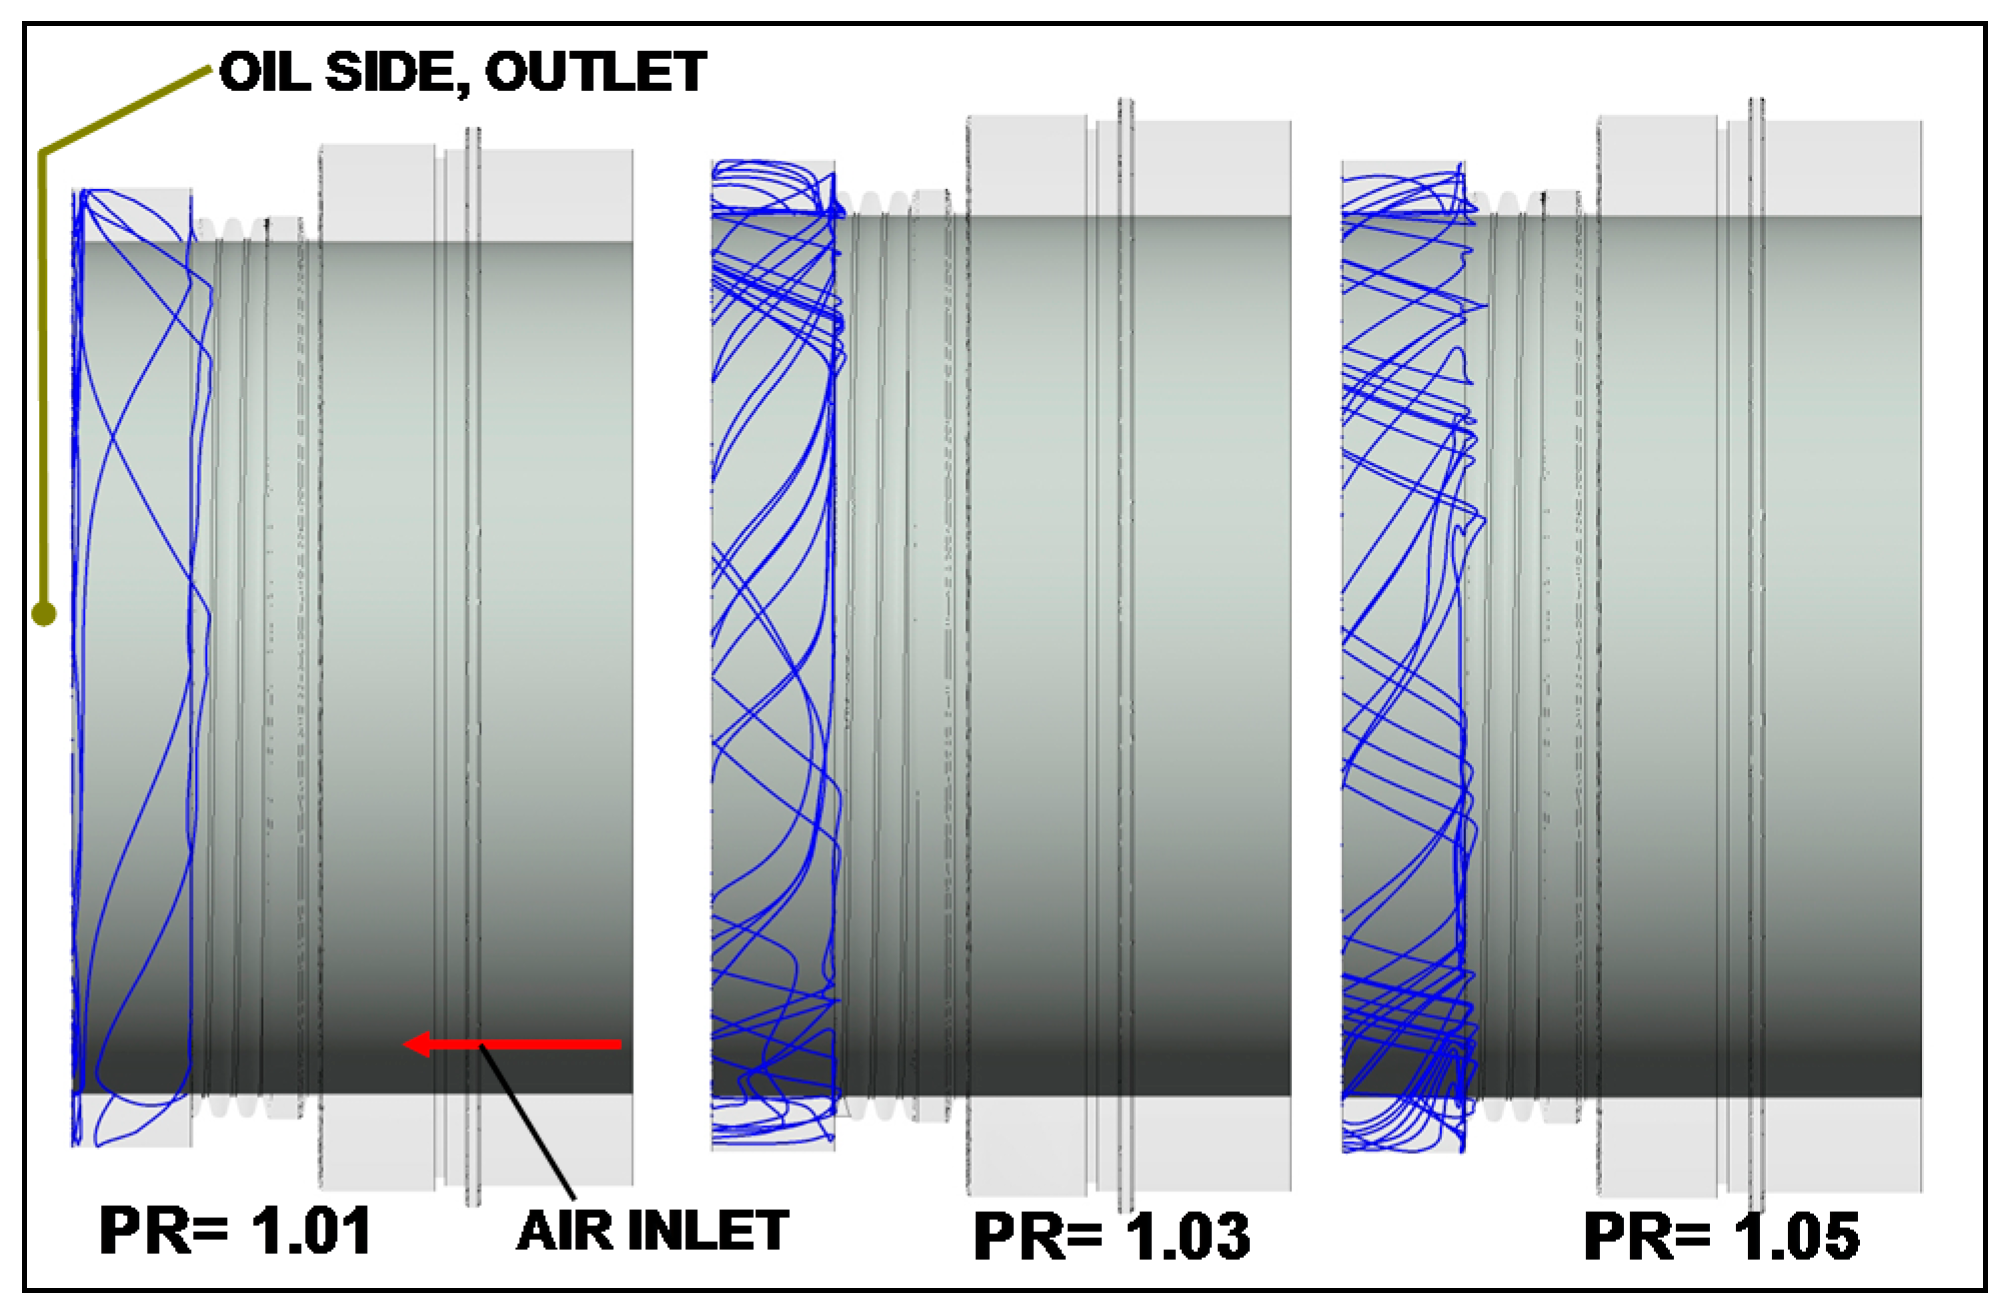
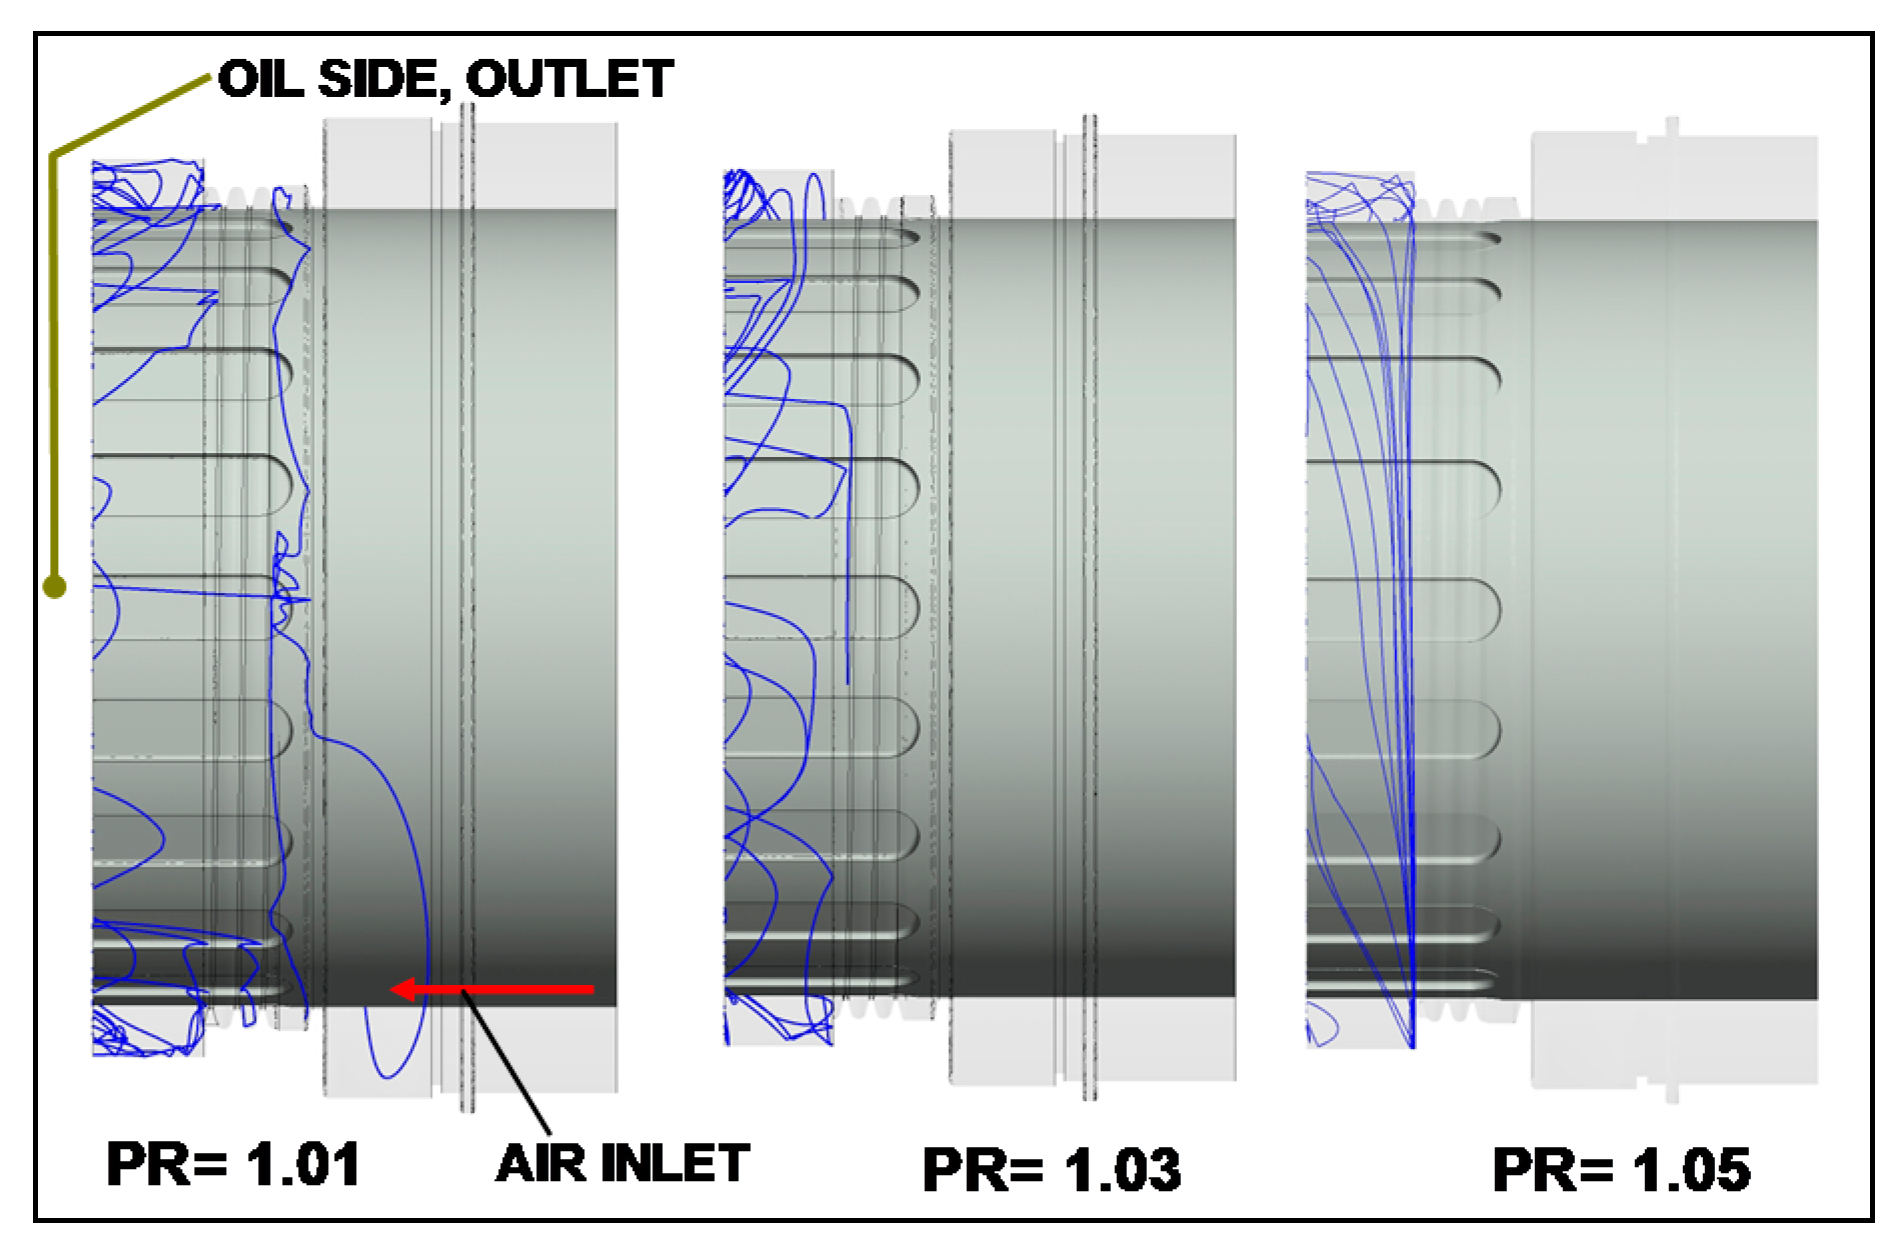
5.5. Oil Particle Tracing

In this section oil particles of different sizes varying from 0.01 to 2 mm in diameter were ingested from the oil side of the windback seal (outlet). Oil is ingested in the bearing chamber for lubrication and cooling of the rotating components. It leaves the components in the form of small droplets which can contaminate the adjacent oil seals. A very good work on oil particles from bearings was performed by Farall et al. [8]. Using particle tracing, the motion of the particles (trajectories) in the vicinity of the windback seal was investigated. Since the windback seal is there in order to protect a primary seal from getting oil contaminated, it is important to know at which operating conditions this might happen. The success criterion is when the oil particles do not overcome the space which is protected by the helical thread. In Figure 16, a windback seal with a smooth rotor is displayed. The computation was performed for three different pressure ratios. It was surprising that even at a low pressure ratio (PR = 1.01) no oil droplets migrated through the seal.
The situation is completely different when the rotor has scallops. Figure 17 shows at different pressure ratios the oil particle trajectories. At PR = 1.01 oil could migrate through the seal and at PR = 1.03 the oil is almost half way through the thread area. At PR = 1.05 the oil is repulsed. For sensitivity analysis reasons the seal clearance, scallop width and number of scallops were modified. Figure 18 shows the results with half (0.15 mm), nominal (0.3 mm) and double (0.6 mm) clearance. The pressure ratio was 1.05 and the rotational speed 15,000 rpm. No oil seems to leak even at the highest clearance of 0.6 mm.
Figure 19 shows the oil trajectories when the scallop width B is varied. The baseline seal value was 6.3 mm and the variations were at 3.2 and 9.5 mm respectively. The number of scallops was unchanged n = 20. The author’s opinion is that the smaller the width the better the oil can be repulsed. At a width of 9.5 mm the oil has already migrated through the thread of the seal indicating that scallop width is a parameter which plays a key role.
The last variation was done with the number of threads which was changed from 3 to 5. Figure 20 shows that both configurations can repulse oil quite efficiently. The limitations concerning the number of threads or the pitch of the thread are still to be investigated.

6. Conclusions

The aim of this work was to investigate the flow through windback seals and their ability to repulse oil which may migrate from an adjacent bearing compartment particularly at low pressure difference over the seal.
The following could be concluded:
(1)
A comparison of results between this CFD survey and Morrison et al. has shown deviations in mass flow rate and discharge coefficient.
(2)
At very low pressure ratios backflow is a problem particularly when scallops are engraved in the rotor.
(3)
No evidence for backflow has been observed for a windback seal combined with rotor without scallops. This is an issue which requires further investigation.
(4)
Nevertheless, scallops in the rotor increase the total mass flow rate through the windback seal.
(5)
There are limitations concerning scallop number and size, seal clearance and rotational speeds. Increase in scallop size compared to the baseline has had a negative impact on the seal’s performance. Increase or decrease in tip clearance showed no performance deterioration. Increase in rotor speed has led to a high instability and backflow above 22,000 rpm. Nevertheless, further investigations on these issues are necessary.
(6)
Operational pressure ratio should be above 1.05 for unproblematic seal operation. Nevertheless, even at a pressure ratio of 1.01 no massive oil migration out of the (baseline) seal was documented. This is an important information for the designer.
(7)
Further numerical and also rig investigations are planned in order to investigate further design and operational aspects of windback seals.

7. Outlook

Numerical investigations are currently being carried out on new windback seal designs. New ideas about the fit, the form and the function of the seal are investigated. The ability of the seal to perform well and repulse oil at zero or even negative pressure differences is of huge interest.

Author Contributions

Michael Flouros has been involved in the relevant project and was the initiator of this research. Francois Cottier and Christina Salpingidou have prepared the complex CFD models and have contributed in the editing of the manuscript. Markus Hirschmann has assisted in the data analysis and documentation.

Conflicts of Interest

The authors declare no conflict of interest.

Nomenclature

AArea between the fin and the statorm2
aScallop depth mm
BScallop widthmm
bFin tip widthmm
CADComputer Aided Design
CdDischarge Coefficient
DFin tip diametermm
dRotor diametermm
HEnthalpyJ/kg K
hFin heightmm
kHHodkinson carry over factor
kccorrection for carry over factor
LTotal length of CFD entitymm
LsScallop lengthmm
m+Effective mass flow rate g/s
through seal
mairAir mass flow rateg/s
mtotalTotal mass flow rateg/s
NRotational speed rpm
NtNumber of threads
NsNumber of scallops
nNumber of fins
PPressurePa
PRPressure Ratio
PsStatic pressurePa
PtTotal pressurePa
RGas constant (air:287)J/kg K
ReReynolds number
SEntropyJ/kg
sFin/Rotor clearancemm
TtTotal temperature K
tPitchmm
UtanTangential component of the velocitym/s
URotorRotor circumferentialm/s
Velocity = π N d/60
ydistance to nodemm
y+non-dimensional wall distance
xAxial coordinatemm
Greek letters
γParticle diametermm
τwWall shear stressN/m2

References

  1. Morisson, G.; Al-Ghasem, A. Experimental and Computational analysis of a gas compressor Windback seal. In Proceedings of the ASME Turbo Expo 2007: Power for Land, Sea, and Air, Montreal, QC, Canada, 14–17 May 2007. [Google Scholar]
  2. Lim, C.H. A Numerical and Experimental Study of Windback Seals. Ph.D. Thesis, Texas A&M University, College Station, TX, USA, 2009. [Google Scholar]
  3. ANSYS Inc. ANSYSVR CFX, release 11.0; ANSYS Inc.: Canonsburg, PA, USA, 2010.
  4. Schiller, L.; Naumann, Z. A Drag coefficient correlation. Z. Ver. Dtsch. Ing. 1935, 77, 318–320. [Google Scholar]
  5. Zimmermann, H.; Wolff, K.H. Air System Correlations: Part 1—Labyrinth Seals. In Proceedings of the ASME 1998 International Gas Turbine and Aeroengine Congress and Exhibition, Stockholm, Sweden, 2–5 June 1998. [Google Scholar]
  6. Hodkinson, B. Estimation of the leakage through a labyrinth gland. Proc. Inst. Mech. Eng. 1940, 141, 283–288. [Google Scholar] [CrossRef]
  7. Kutz, K.J.; Speer, T.M. Simulation of the Secondary Air System of Aero Engines. In Proceedings of the ASME 1992 International Gas Turbine and Aeroengine Congress and Exposition, Cologne, Germany, 1–4 June 1992. [Google Scholar]
  8. Farrall, M.; Simmons, K.; Hibberd, S. Experimental and numerical investigation of shear and gravity driven oil films in aero-engine bearing chambers. In Proceedings of the ASME Turbo Expo 2004: Power for Land, Sea, and Air, Vienna, Austria, 14–17 June 2004. [Google Scholar]
Figure 1. The windback seal components (Rotor with scallops, static part with thread and the assembly).
Aerospace 05 00012 g001
Figure 2. Dimensions of the baseline seal.
Aerospace 05 00012 g002
Figure 3. The windback seal assembly with Inlet and Outlet side.
Aerospace 05 00012 g003
Figure 4. Variation of the Enthalpies, static pressure and velocity with the axial length of the labyrinth seal at 12 g/s.
Aerospace 05 00012 g004
Figure 5. Enthalpies, static pressure and velocity variation in the labyrinth seal as a function of entropy at 12 g/s.
Aerospace 05 00012 g005
Figure 6. Variation of the Enthalpies, static pressure and velocity in the windback seal as a function of the entropy at a mass flow of 12 g/s.
Aerospace 05 00012 g006
Figure 7. Enthalpies, static pressure and velocity variation in the windback seal as a function of the axial length.
Aerospace 05 00012 g007
Figure 8. The axial velocity distribution in a longitudinal plane cut for the labyrinth seal at 15,000 rpm with recirculation zones between the fins and flow carry over adjacent to the rotor.
Aerospace 05 00012 g008
Figure 9. The axial velocity distribution in a longitudinal plane cut for the windback seal at 15,000 rpm.
Aerospace 05 00012 g009
Figure 10. Tangential velocity components as a function of the axial length for labyrinth and windback (smooth rotor) at 12 g/s.
Aerospace 05 00012 g010
Figure 11. (a) Effective mass flow m+ through different seal/rotor types as a function of the pressure ratio at 15,000 rpm and s = 0.3 mm; (b) Effective mass flow m+ through the labyrinth seal as a function of the pressure ratio at 15,000 rpm and s = 0.3 mm.
Aerospace 05 00012 g011
Figure 12. Total and effective mass flow rates for labyrinth and windback seal with and without rotor scallops at 15,000 rpm, s = 0.3 mm as a function of the pressure ratio. Scallops initiate backflow which is considerable at small pressure ratios.
Aerospace 05 00012 g012
Figure 13. Impact of the number of scallops on the flow in a windback seal at a pressure ratio of 1.05, s = 0.3 mm and 15,000 rpm.
Aerospace 05 00012 g013
Figure 14. The impact of rotational speed and rotational direction on the flow in a windback seal at a pressure ratio of 1.05.
Aerospace 05 00012 g014
Figure 15. Mass flow rates through the windback seal at 15,000 rpm using different clearance and thread sizes.
Aerospace 05 00012 g015
Figure 16. Oil trajectories at 15,000 rpm, three different pressure ratios, s = 0.3 mm, smooth rotor.
Aerospace 05 00012 g016
Figure 17. Oil particles trajectories at 15,000 rpm, three different pressure ratios and s = 0.3 mm.
Aerospace 05 00012 g017
Figure 18. The seal seems to be operating quite well even at a clearance of 0.6 mm.
Aerospace 05 00012 g018
Figure 19. Oil trajectories at 15,000 rpm and different widths B of the scallops.
Aerospace 05 00012 g019
Figure 20. Oil trajectories at 15,000 rpm and different number of threads.
Aerospace 05 00012 g020

