Article

Mechanical and Non-Destructive Study of CFRP Adhesive Bonds Subjected to Pre-Bond Thermal Treatment and De-Icing Fluid Contamination

by
Paweł H. Malinowski
1,*,†,
Konstantinos I. Tserpes
2,†,
Romain Ecault
3,† and
Wiesław M. Ostachowicz
1
1
Institute of Fluid-Flow Machinery, Polish Academy of Sciences, 80-231 Gdansk, Poland
2
Laboratory of Technology & Strength of Materials, Department of Mechanical Engineering & Aeronautics, University of Patras, 26500 Patras, Greece
3
Airbus Operations S.A.S., 31060 Toulouse, France
*
Author to whom correspondence should be addressed.
These authors contributed equally to this work.
Aerospace 2018, 5(2), 36; https://doi.org/10.3390/aerospace5020036
Submission received: 27 February 2018 / Revised: 23 March 2018 / Accepted: 28 March 2018 / Published: 2 April 2018
(This article belongs to the Special Issue Selected Papers from IWSHM 2017)

Abstract

:
Composite materials are commonly used in many branches of industry. One of the effective methods to join the carbon fibre reinforced polymer (CFRP) parts includes the use of adhesives. There is a search on effective methods for quality assurance of bonded parts. In the research here reported the influence of surface pre-bond modification on the adhesive bonds of CFRP plates has been analyzed. Adherends surface modifications, to include defects affecting the bonding quality, were obtained through surface thermal treatment, surface contamination with de-icing fluid and a combination of both the previously described treatments. Characterization of bonded joints was performed by means of mechanical testing, ultrasounds and electromechanical impedance (EMI) measurements. The study here proposed has also the aim to evaluate the ability of different destructive and non-destructive techniques to assess the quality of the bonds. While mechanical tests were strongly affected by the surface modifications, results obtained ultrasound and EMI test have demonstrate only a limited ability of these techniques to differentiate between the different samples. In fact, ultrasounds did not show any changes in the bondline, due to pre-bond modifications. However, this technique was able to detect delamination in CFRP for one of the samples thermally treated at 280 °C. Electromechanical impedance (EMI) measurements showed similar behavior as mechanical tests for samples thermally treated at 260 °C and 280 °C, and for the sample whose surface modification was made with a combination of thermally and de-icing fluid treatments.

Graphical Abstract

1. Introduction

Current structures made with CFRP materials are still riveted. Resigning from the riveting and replacing it with only adhesive bonding forces to seek for appropriate quality assurance techniques. In the lifetime of an aircraft there are many factors that can endanger the integrity of the bond. Improper cleaning of the parts before bonding at the manufacturing stage may lead to weak adhesive bonds. Similar dangers arise during the maintenance. If the structure is to be repaired with an adhesive patch the surface before bonding should be clean. There is a need for post-bond inspection to ensure proper bonding and verify its quality. In research reported here we focus on the influence of surface pre-bond modification on: (1) the fracture toughness of the joint, (2) adhesion strength, (3) ultrasonic signals and (4) electromechanical impedance (EMI) response. The investigated surface modifications were made at the purpose to include defects in the bonding quality, that mimic a possible pre-bond contamination scenario for composite-bonded repairs: contamination with a de-icing fluid and thermal degradation of some parts of the airplane. Three groups of pre-bond modifications were considered. The first modification was the thermal treatment before bonding. Structural parts that may be exposed to external heat source, lightening impact, or hot engine exhaust gases. The thermal treatment of CFRP may result in debonding of fiber and resin due to degradation of the interphase, delamination, formation of cracks, and the degradation of the polymer matrix [1]. Thermal degradation of the polymer matrix can be detected by the intensity ratio of infrared (IR) bands at 1510 cm−1 characteristic for the epoxy resin [1]. As it was shown by Heckner et al. [2] when the degradation occurs in an environment with oxygen, a thermo-oxidative degradation occurs. A strong band appears in the IR spectra, that is characteristic for carbonyl groups. The pre-bond thermal treatment has an influence on the fracture toughness of the CFRP bonded joints. The pre-bond thermal treatment results in decrease of GIC (mode-I fracture toughness energy) value by 10% and 13% for treatment at 190 and 200 °C, respectively [3]. In the case of treatment at 210 °C the increase by 9% was observed [3]. The second case was prepared by pre-bond contamination of the sample with de-icing fluid. This runway de-icing fluid can affect the aircraft parts. The potassium formiate, contained in the de-icer, stays deposited in a form of a thin layer on the CFRP surface. During the aircraft cleaning, the potassium formiate can be transported to areas prepared for repair bonding and contaminate them. This can result in a weaker bond. It was shown that a de-icer has a negative influence on both mode I and mode II fracture toughness of the bonded joints. The increasing level of contamination results in decrease of the mode I and mode II fracture toughness energy [4]. The third type of modification was obtained by combining the thermal treatment with the de-icing fluid contamination.
In the past, various methods were used to study adhesive bonds. The non-linear solitary waves were used for adhesive bond contaminated with release agent [5]. Changes of strain were investigated for assessing the adhesive bonding with contamination [6,7]. There were also attempts before to employ EMI method for adhesive bonds assessment. Aluminum lap joints were investigated [8,9]. It was proposed to embed the sensor into the lap joint [8,9]. The EMI method for CFRP adhesive bonds was investigated before in [10] but for moisture contamination, release agent contamination, and improper curing temperature of the adhesive. Only one sample of each kind was tested then. The scenarios reported here were studied for the first time in [11] but only for single modifications and they were not compared with mechanical testing results. Moreover, in this previous research the root-mean-square (RMS) values of wide 3–5 MHz region were considered and the frequency shift of maximum conductance peak in relation to the free sensors [11]. In research reported here a local resonance in the conductance spectra was identified in a limited frequency region and it was investigated for the purpose of bond quality assessment.
The paper is structured as follows. In the next section the samples are described together with modification types and their level. The third section presents the investigated methods and their results. The results are discussed in the fourth section. The last section concludes the findings.

2. Materials

The CFRP samples investigated in the reported research were manufactured from Hexcel (Stamford, CT, USA) IMA/M21E prepregs. Eight-layered [0, 0, 45, −45]S plates were made and they were adhesively bonded together. The thickness of this assembly was about 4 mm. The bonded plates were cut into smaller samples used for investigation with ultrasonics, electromechanical impedance method and for mechanical testing. The adhesive used in this investigation was FM300-2 (Cytec, Woodland Park, NJ, USA) cured at 121 °C. Reference samples (RE) that were properly bonded and samples with bond modification were prepared. The modifications comprised of thermal treatment (TD), contamination with de-icing fluid (DI), and combined modification of thermal treatment and de-icer contamination (TD+DI).
The thermal treatment was performed by putting the plates in an oven with air circulation. Three temperature levels were used: 220 (TD1), 260 (TD2) and 280 °C (TD3). The plates where kept for 2 h at the chosen temperatures. Next, the plates were grinded and bonded to untreated plates. The pre-bond contamination with de-icing fluid was prepared by dip coating of the plates in a water solution of the SAFEWAY KF (Clariant, Charlotte, NC, USA) de-icer with three concentrations: 2%, 7% and 10% of de-icer in demineralized water. The de-icer contains potassium formiate, so the potassium (K) content on the surface was taken as a measure of the degree of contamination. It was determined by XPS (X-ray photoelectron spectroscopy) by Fraunhofer IFAM [11]. The chosen concentrations resulted in following contamination levels: 6.4 ± 1.8 (DI1), 10.9 ± 2.3 (DI2) and 12.0 ± 1.4 at. % K (DI3). The initial lap shear tests showed a significant loss in bond strength for sample which have undergone de-icing fluid contamination treatment with 4 at. % K concentration at the surface [11]. Samples which have undergone combined surface modification have been only thermally treated at 220 °C and de-icing fluid contaminated at level 1 (DI1) and level2 (DI2). Those samples have been denoted with TD1+DI1 and TD1+DI2.
It should be underlined that the ultrasonic and electromechanical impedance studies were made on the same samples. The samples for mechanical testing were prepared separately and had different dimensions.

3. Methods and Results

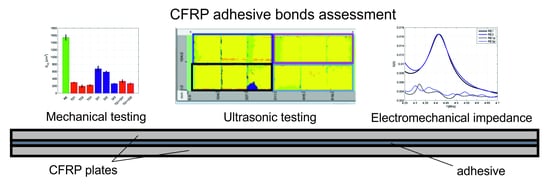
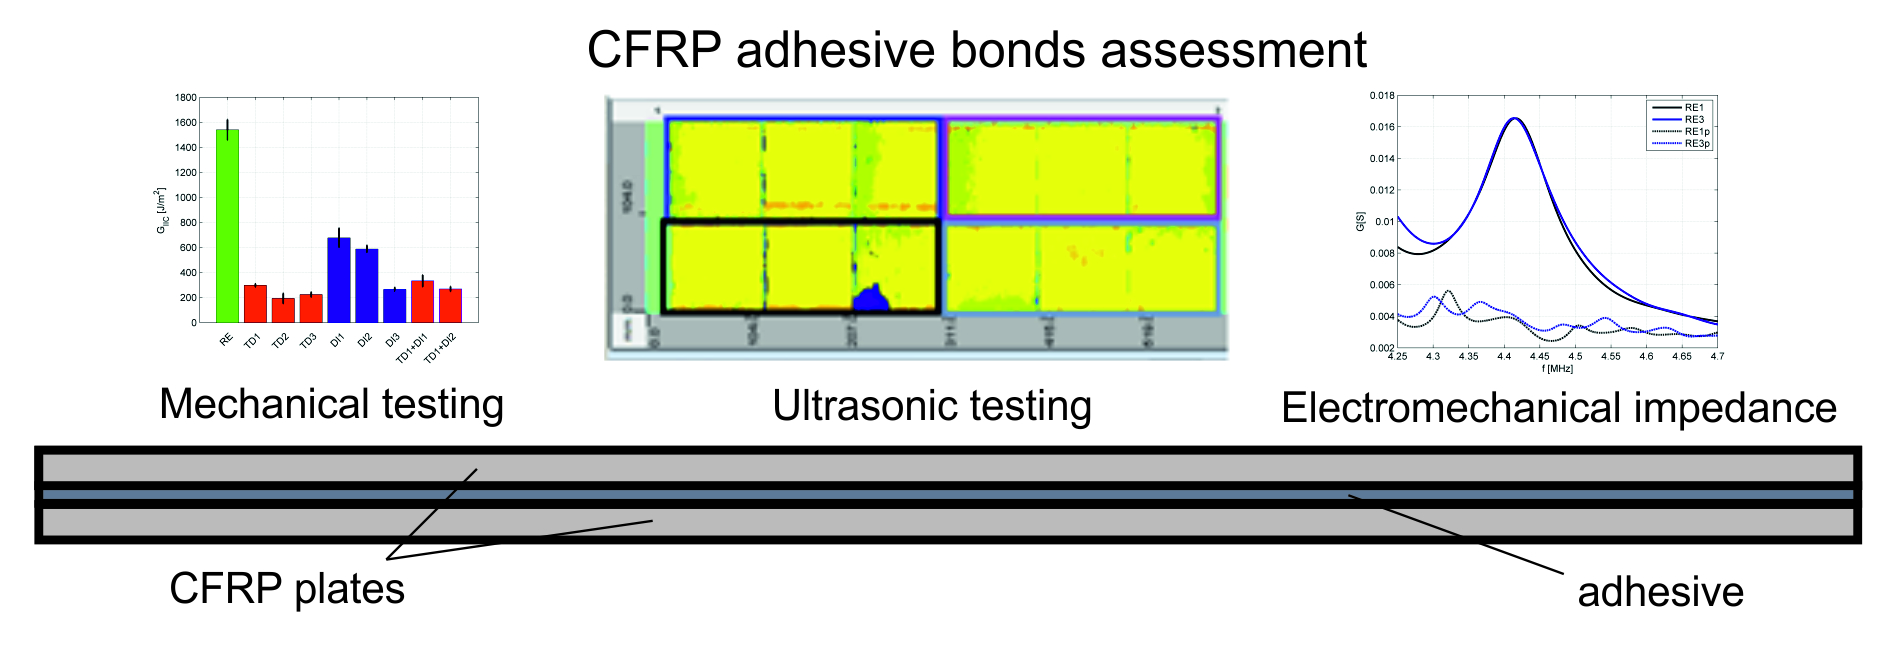
3.1. Mechanical Testing

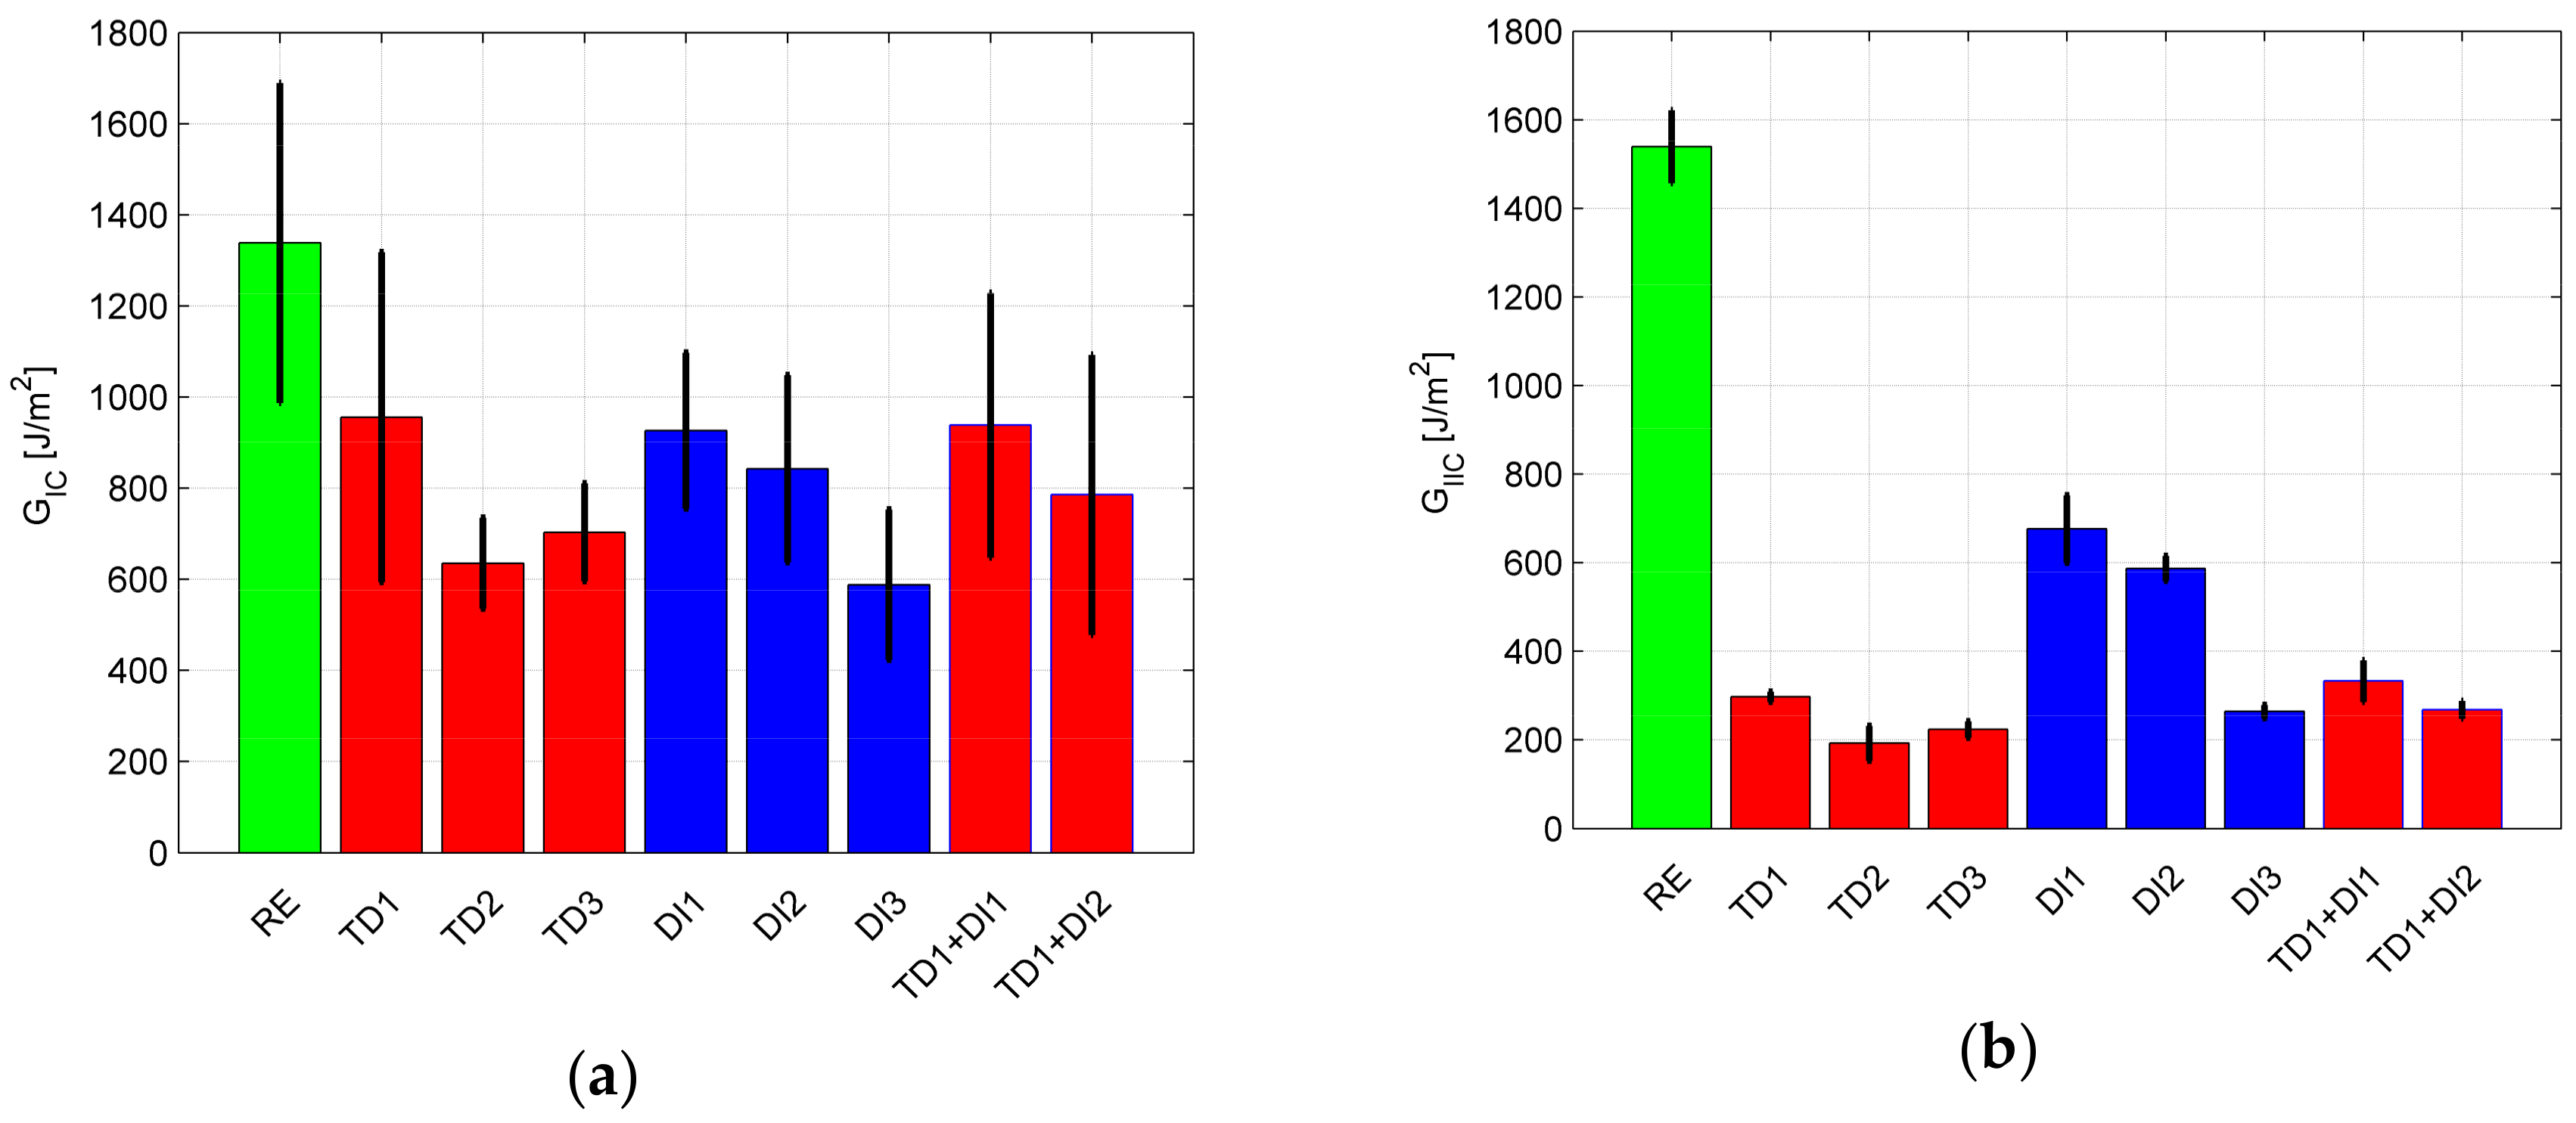
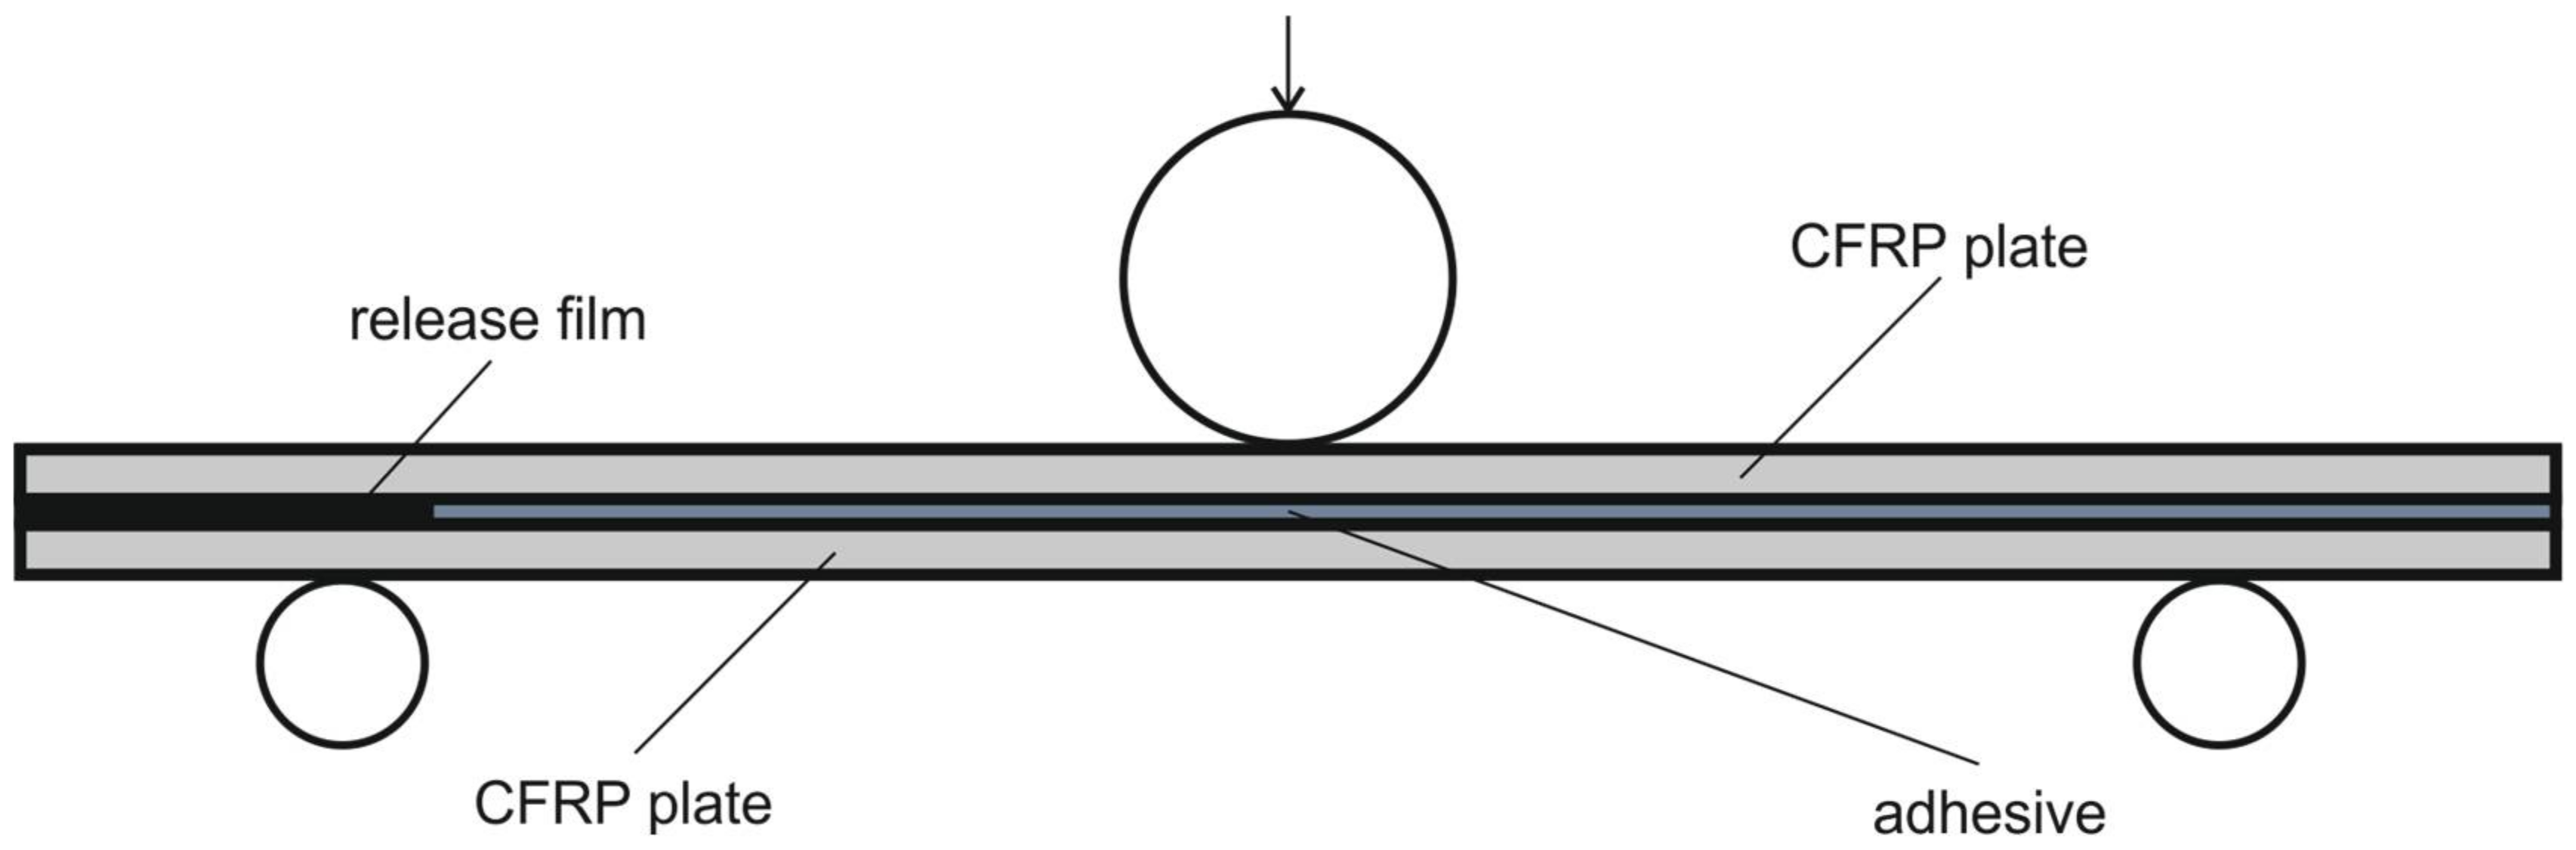
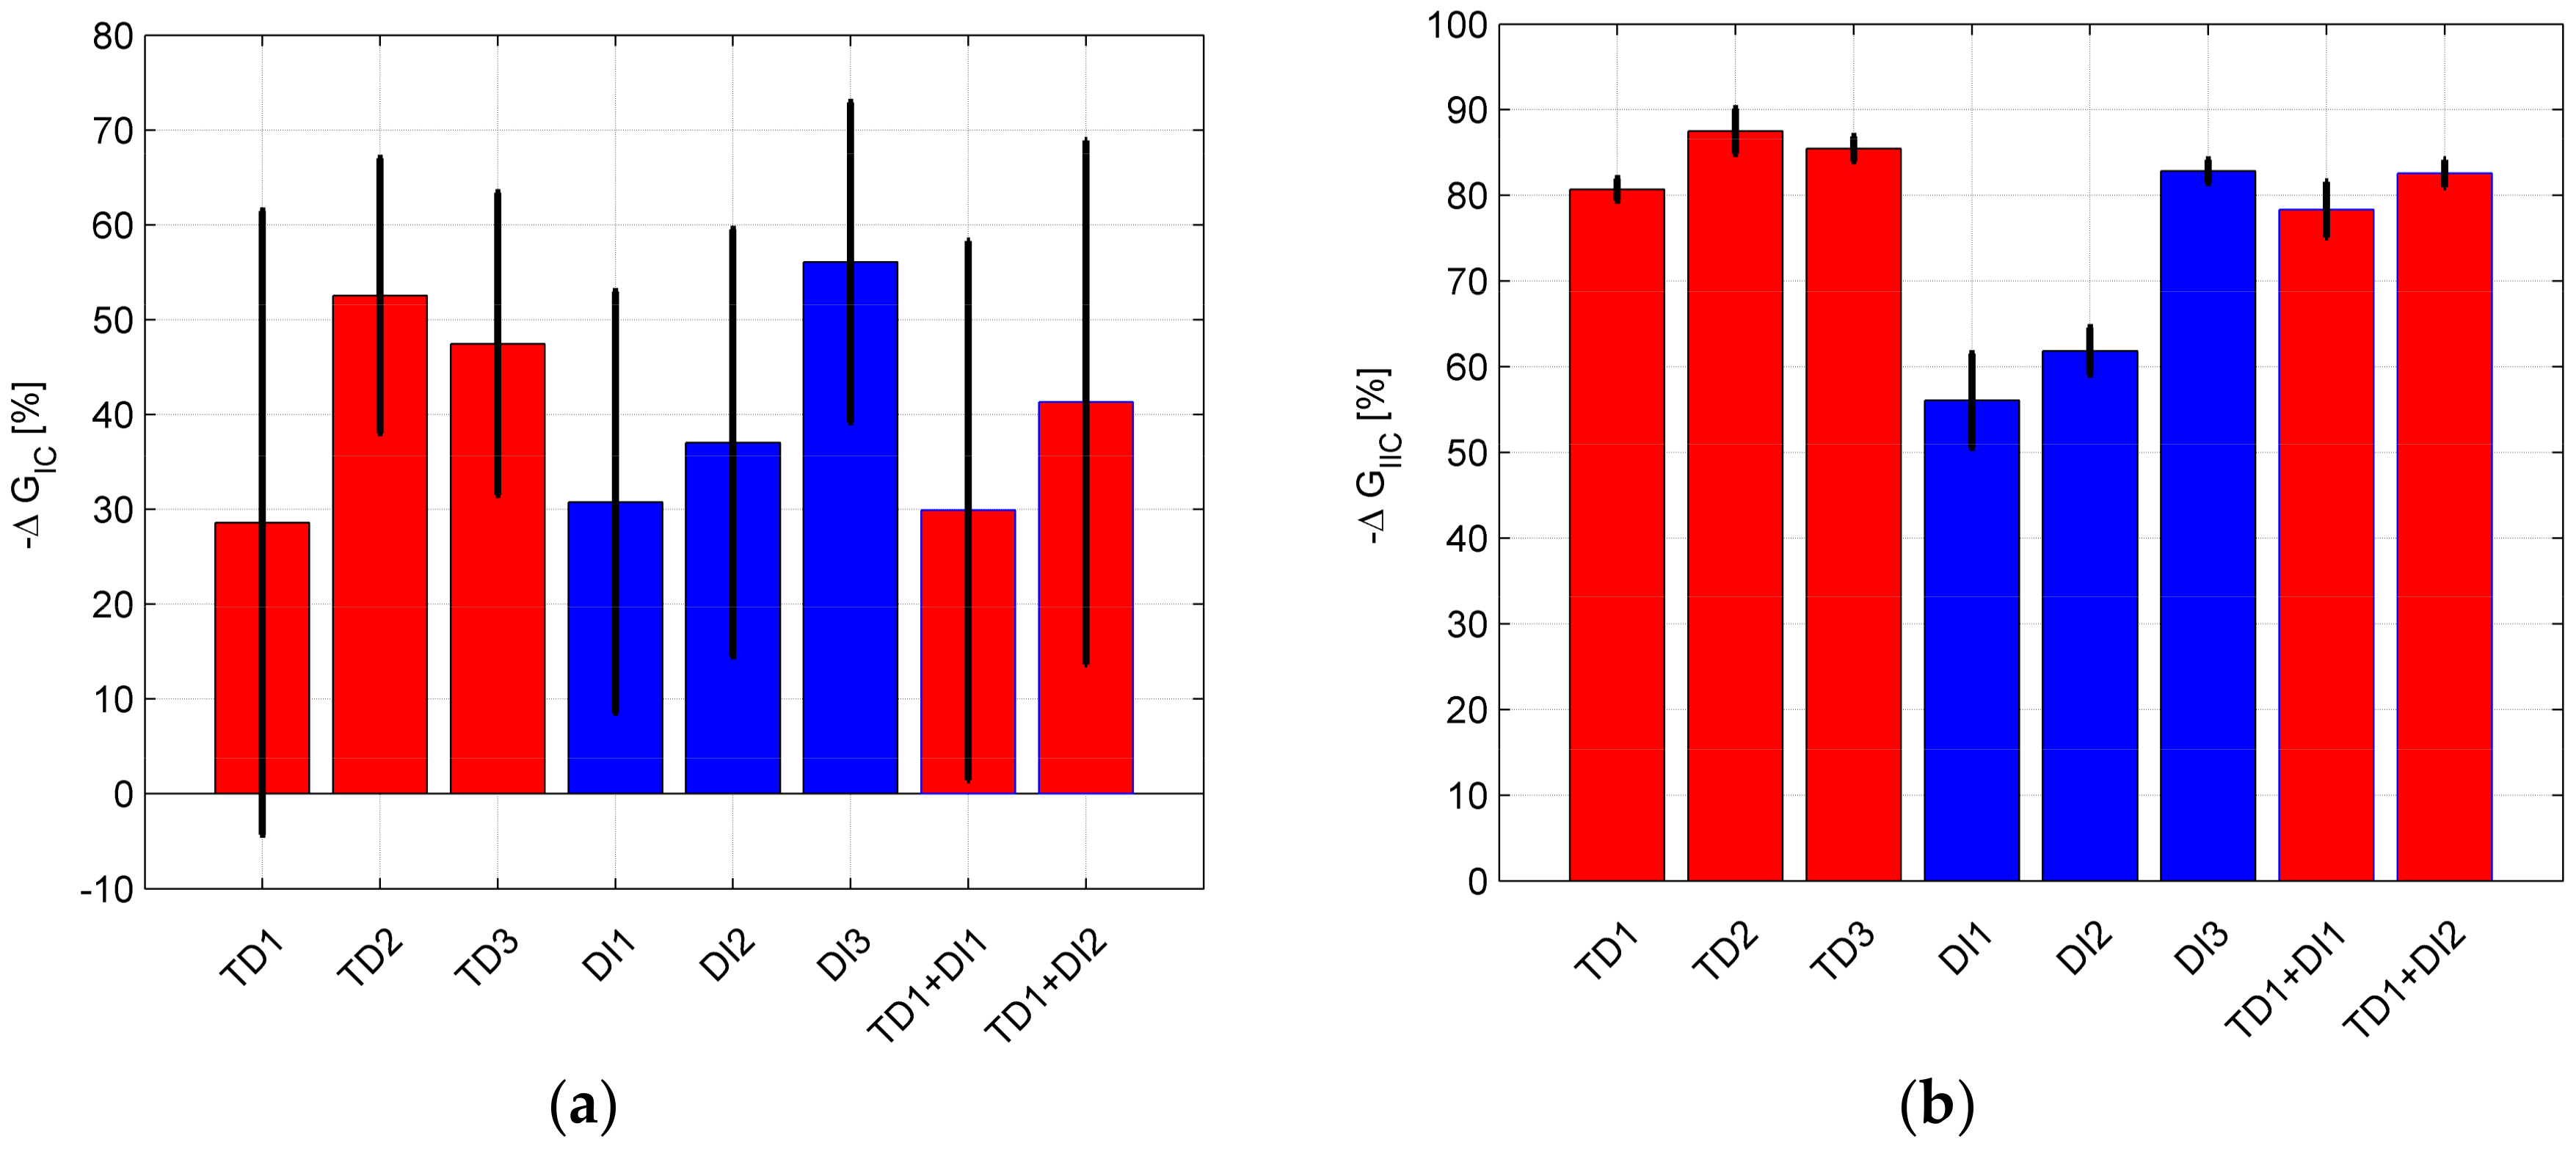
3.1.1. Mode-I Fracture Toughness Test

The mechanical testing followed the Airbus specification AITM 1-0053 [12]. Based on this, the CFRP bonded joints were tested in order to determine the GIC values. The double cantilever beam (DCB) specimen was used (250 mm length, 25 mm width and 3 mm thickness), which consists of rectangular adherents bonded along their length incorporating a region of non-adhesive release film (25 mm) at one end for the introduction of the initial crack in the bond-line (Figure 1). The testing procedure was described in [4]. Loading was applied to the DCB specimen via metallic piano hinges bonded. The specimen was preloaded until an initial crack length of 10 to 15 mm was achieved. The pre-cracked specimen was then loaded continuously by opening forces until total propagated crack length of 100 mm was achieved. Six specimens per scenario were tested under a tensile loading using a Tinius Olsen H5K-S universal testing machine with a load cell of 5 kN. After the tests the mode-I fracture toughness energy GIC was calculated as:
G IC = A a × w × 10 6
where A (J) is the energy to achieve the total propagated crack length, a (mm) is the propagated crack length and w (mm) is the width of the specimen. The obtained GIC values are presented in Figure 2a. It can be noticed that all samples with modified bonds are characterized with lower GIC value than the reference sample. In the case of DI and TD1+DI samples there is a clear decrease with the increasing amount of the contamination. The different behavior is observed for TD samples. The case with the highest temperature of the treatment (TD3) is characterized by a slight increase in comparison to the medium level of the treatment (TD2).

3.1.2. Mode-II Fracture Toughness Test

The second type of mechanical test was the mode-II conducted according to the AITM 1-0006 standard [13] with an MTS universal testing machine with a load capacity of 100 kN. The test specimens were cut from the residual part of GIC specimens so that a pre-crack of 35 mm was achieved. The test is described in details in [4] (Figure 3). To calculate the GIIC fracture toughness energy the following formula was used [13]:
G IIC = 9 × P × a 2 × d × 1000 2 × w × ( 0.25 × L 3 + 3 × a 3 )
where d (mm) is the crosshead displacement at crack propagation onset, P (N) is the critical load to start the crack propagation, a (mm) is the initial crack length, w (mm) is the width of the specimen, and L (mm) is the span length. The obtained GIIC values are presented in Figure 2b. The first observation is that in relation to the reference case the bond modifications have larger influence on GIIC than on the GIC. Analyzing each modification type we can observe similar behavior as for GIC—there is a decrease for DI and TD1+DI cases, while there is an increase for TD3 case in relation to TD2 case.

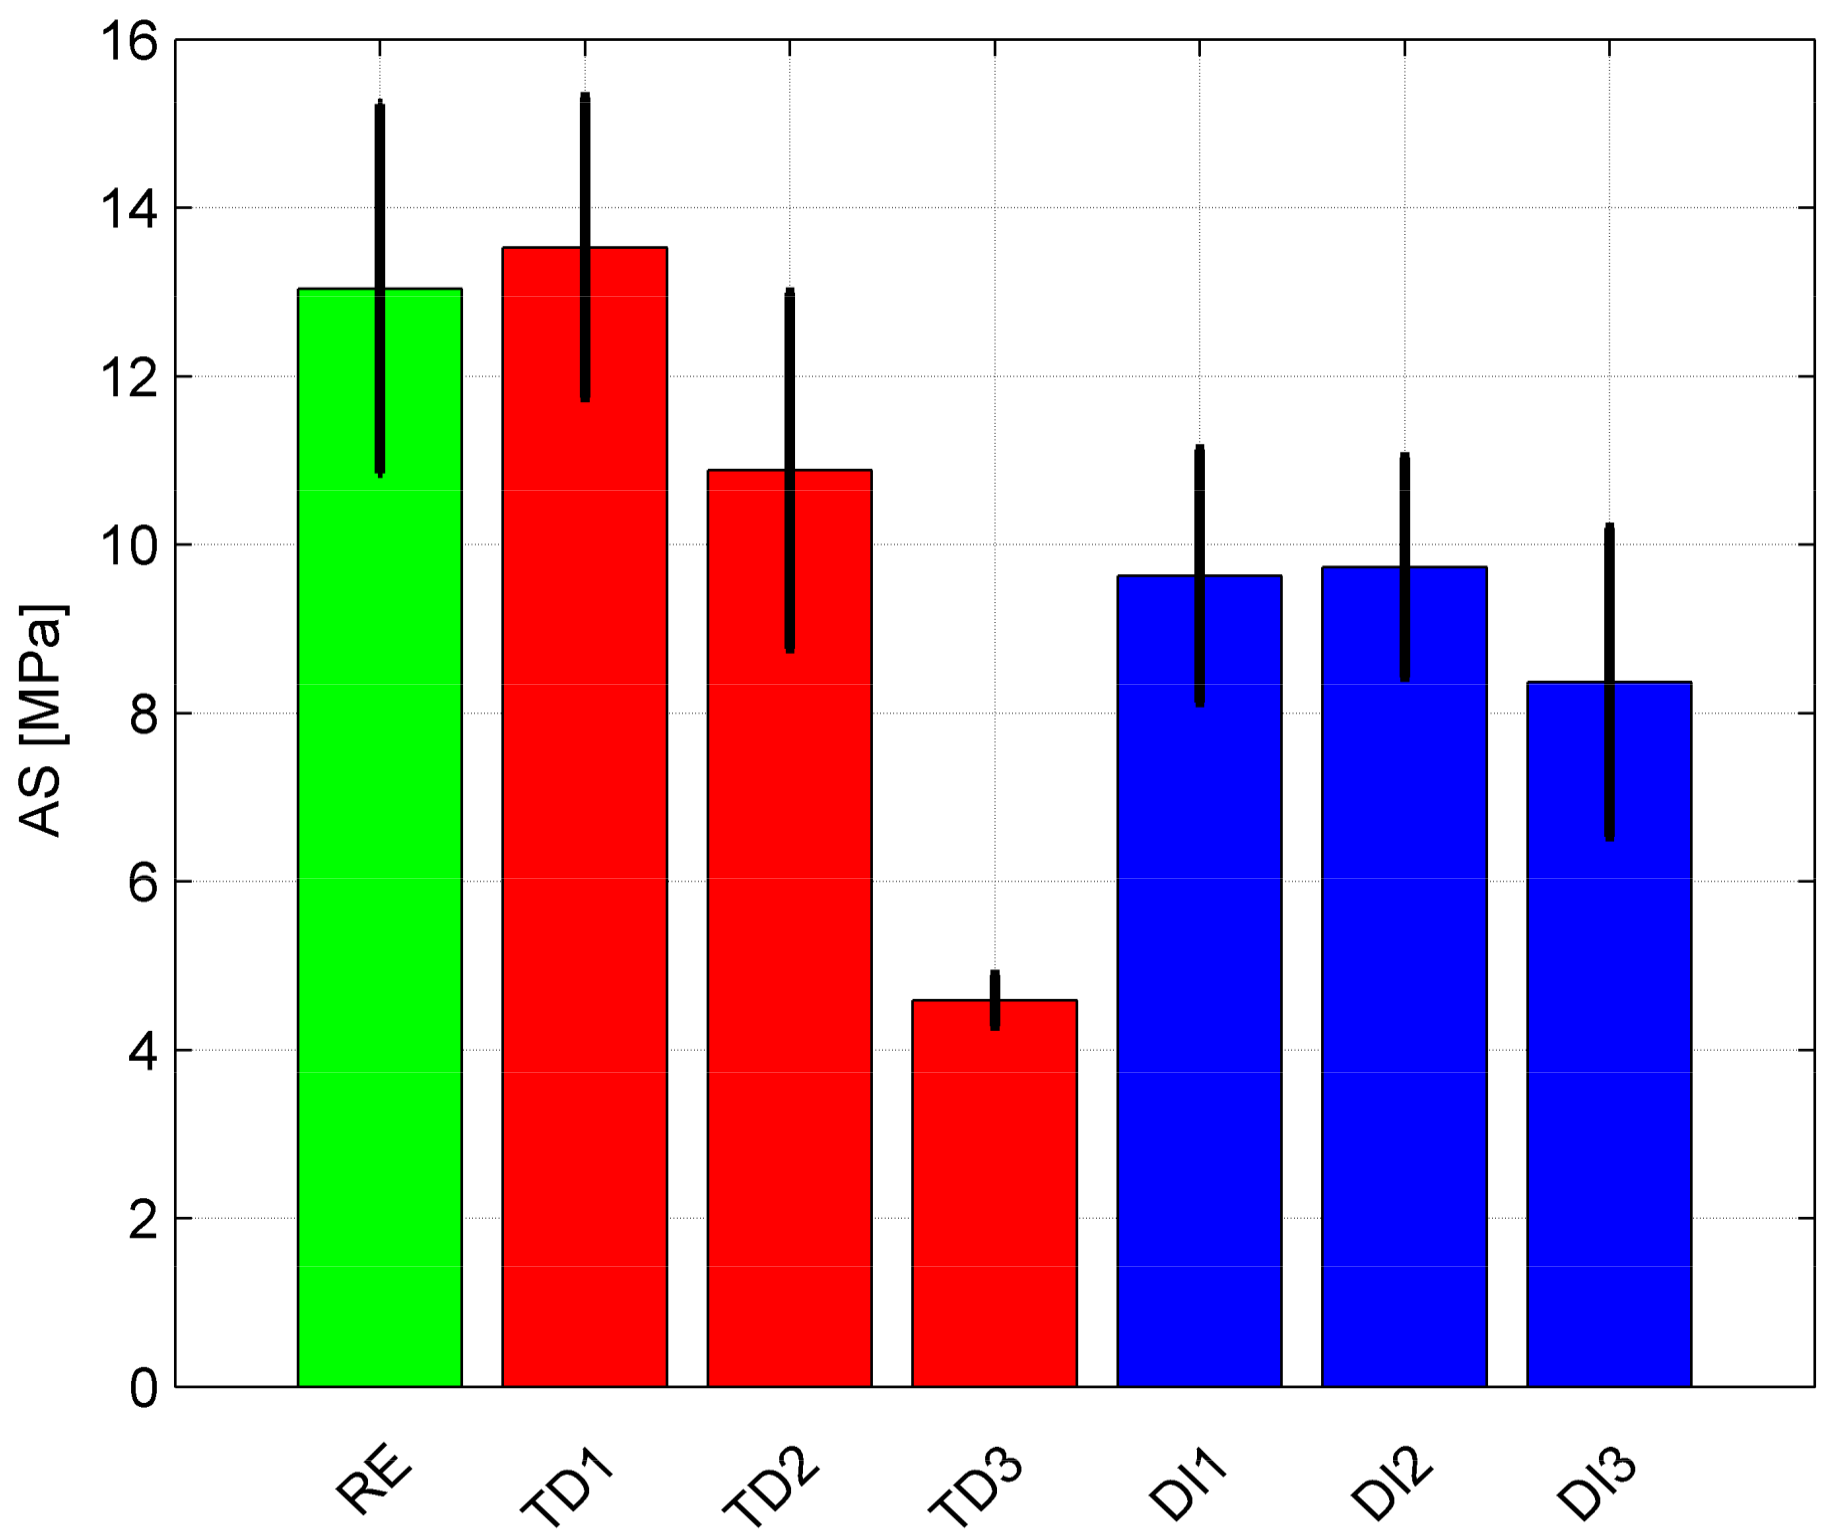
3.1.3. Centrifuge Tests

The centrifuge tests were conducted using the LUMiFrac (LUM GmbH, Berlin, Germany) adhesion analyzer. The testing principle of the centrifuge technology is based on rotation. In the rotational movement, the centrifugal force is acting of the sample assemblies with following magnitude:
F C = m ω 2 r
where m is the rotating mass, ω the rotation speed and r is the distance from the axis of rotation. The increase of rotational speed causes a load increase. If the applied load exceeds the tensile strength of the sample-assembly, either bonding or adhesion strength, the test stamp moves outwards within a guiding sleeve. The detachment of the test stamp (at the moment of rupture) is automatically detected. The force at rupture and the tensile strength are calculated on-line by the measurement software SEPView® (LUM GmbH, Berlin, Germany).
The results of the determined adhesion strength (AS) are depicted in Figure 4. Only samples with single modification (TD and DI) were investigated with this method. For TD1 the average adhesion strength increases in comparison to the reference. In the case of the second (TD2) and third level (TD3) treatment there is a drop of the adhesion strength especially high for TD3. The first two levels of the de-icing fluid contamination (DI1 and DI2) have similar influence on the adhesion strength. The highest considered level of (DI3) influences the AS value in greater extend.

3.2. Ultrasound Testing

Ultrasound inspections were performed using ultrasonic equipment manufactured by M2M (Les Ulis, France). Three samples for each modification level were tested with both non-destructive ultrasound and electromechanical impedance technique. The same samples for the given level of modification were denoted by additional numerical suffix. As an example, TD11, TD12 and TD13 symbols denote the three samples modified thermally at level 1 (220 °C). The samples were 100 mm × 100 mm with about 4 mm thickness. A 10 MHz phased array probe was used in immersion with the following characteristics: 64 elements, 0.5 mm pitch, 32 mm of aperture, cylindrical focusing (R = 40 mm), linear scanning mode. To display the results, a software gate “g+” was used, that records the maximum echo after front wall echo (FWE). In most of the considered cases there were no significant differences in the results indicating defects, with the only exception of the sample which had undergone the thermal treatment at 280 °C (TD3). The results obtained for the thermally treated samples and the reference are shown in Figure 5. In the presented results a delamination can be observed for one of the samples, namely TD31, present in the upper left corner both in amplitude (%) and time of flight (μs) plot.

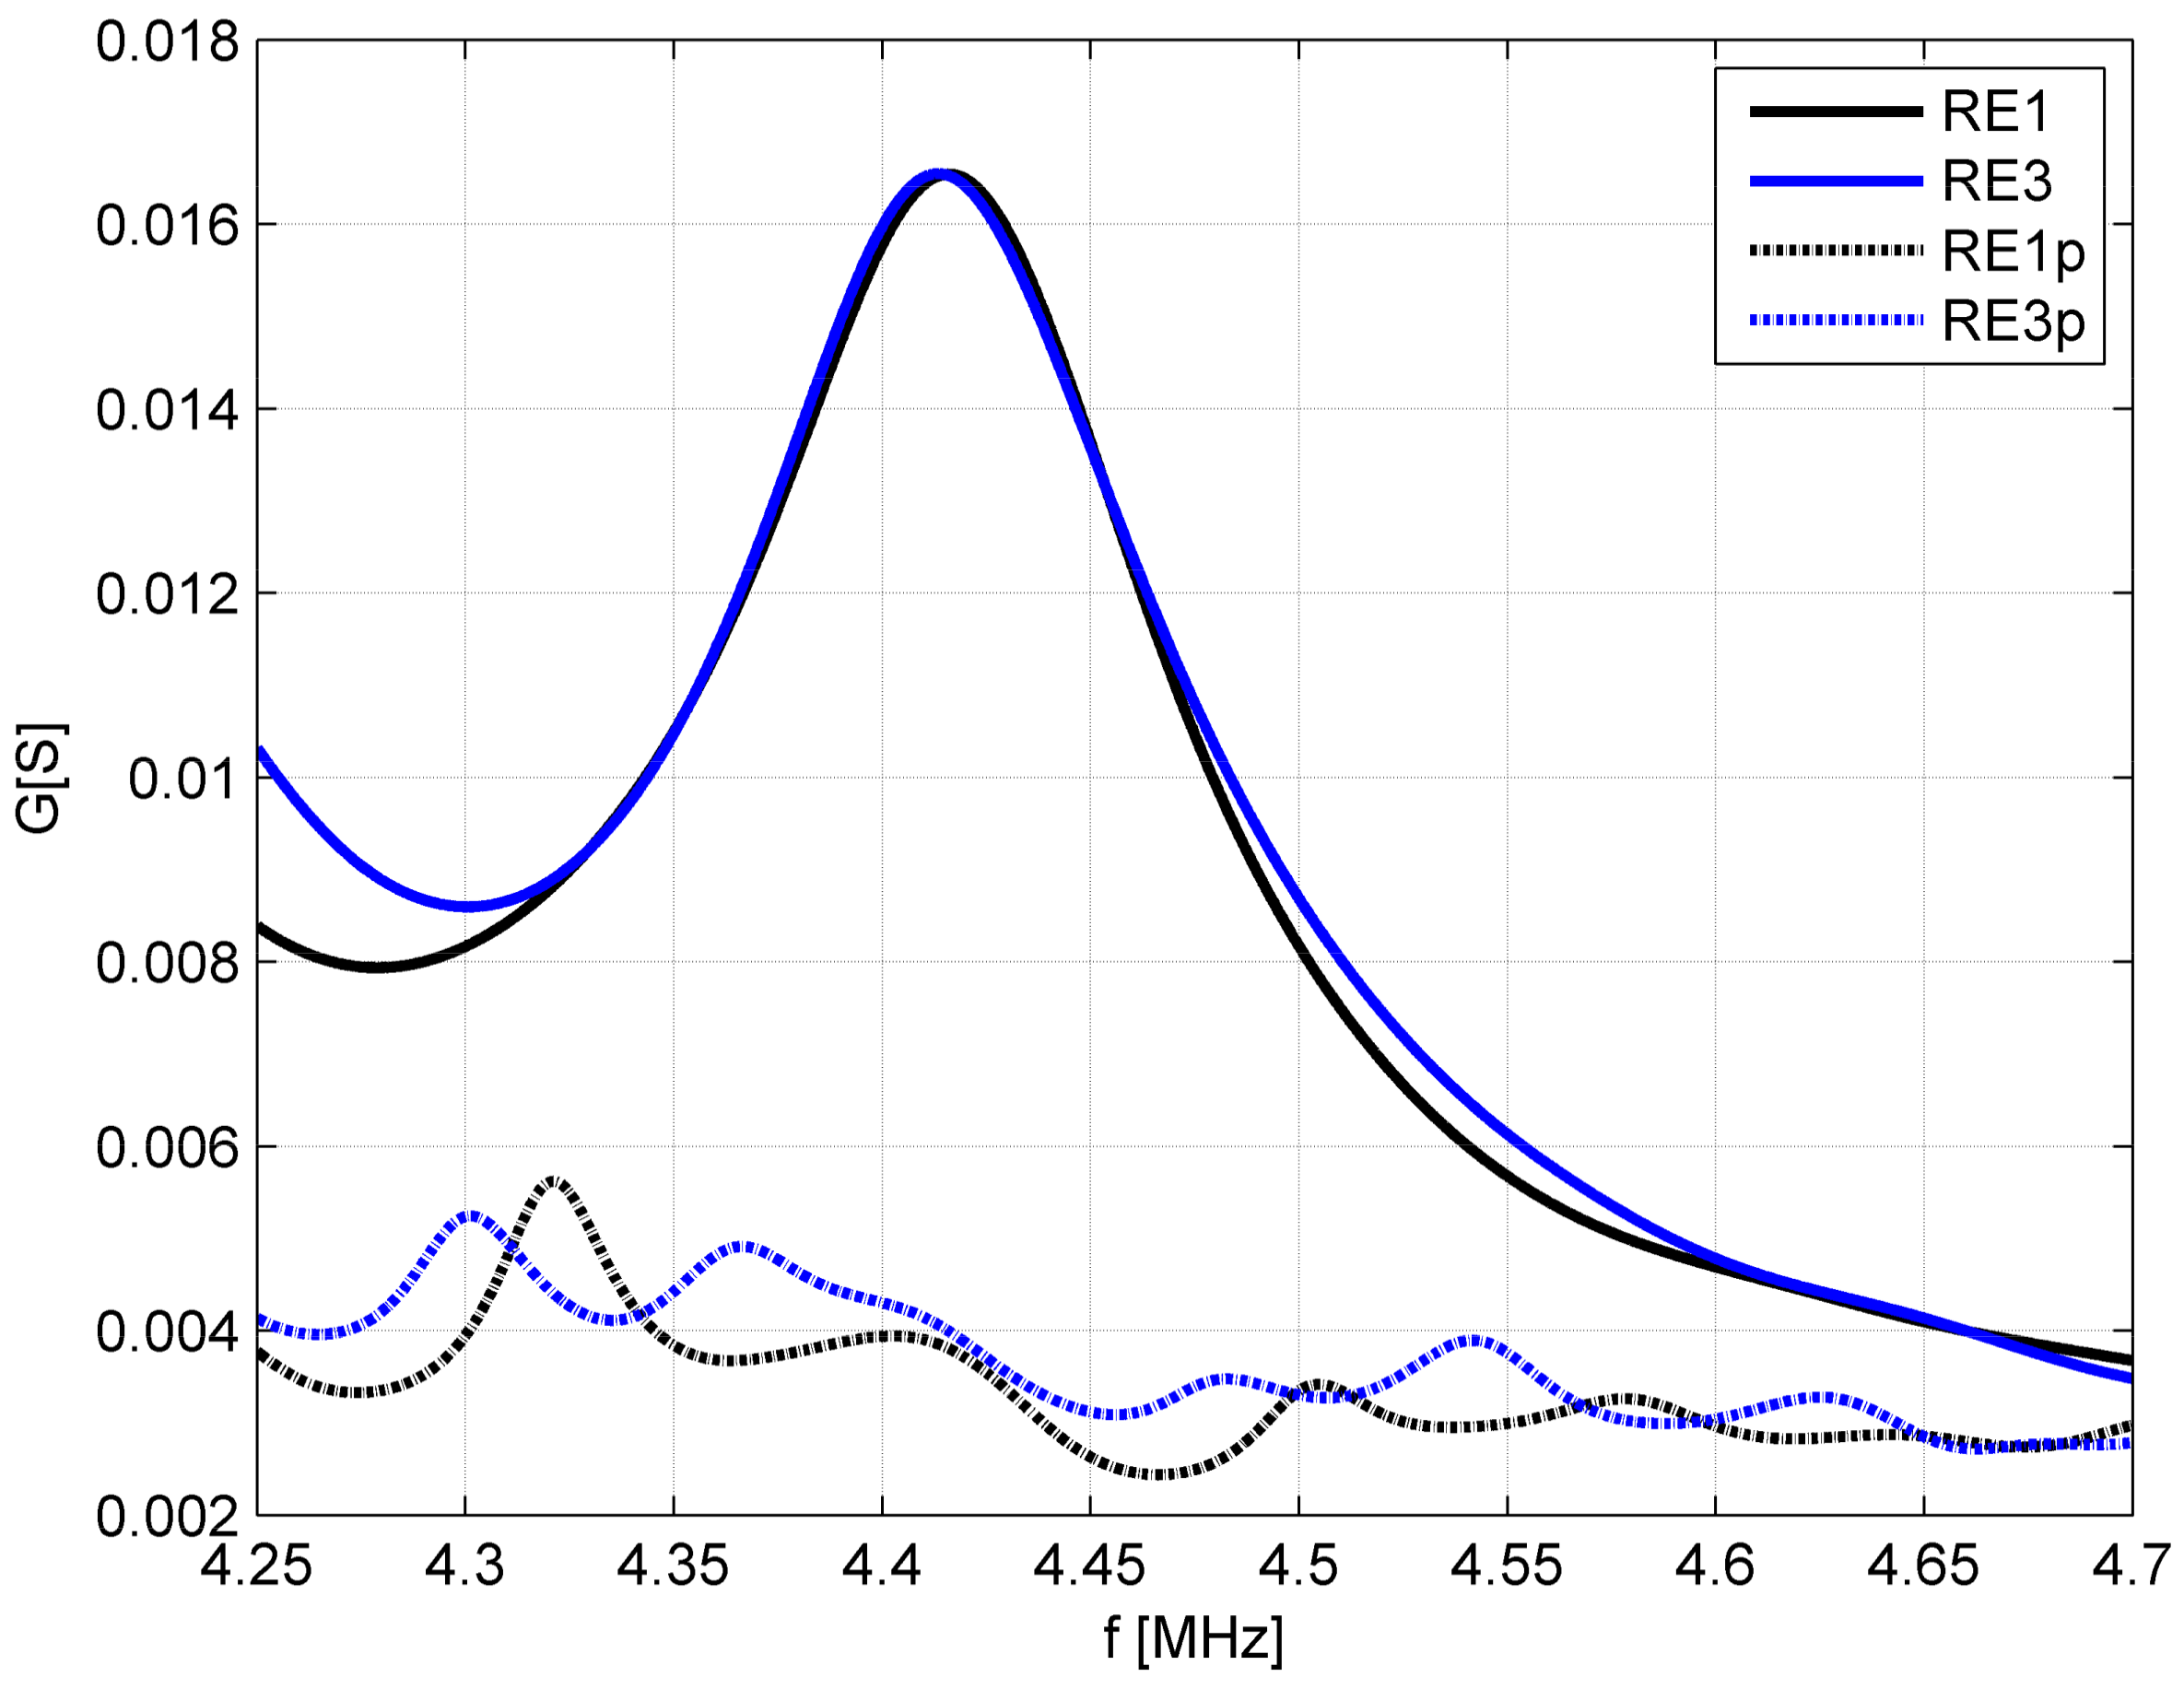
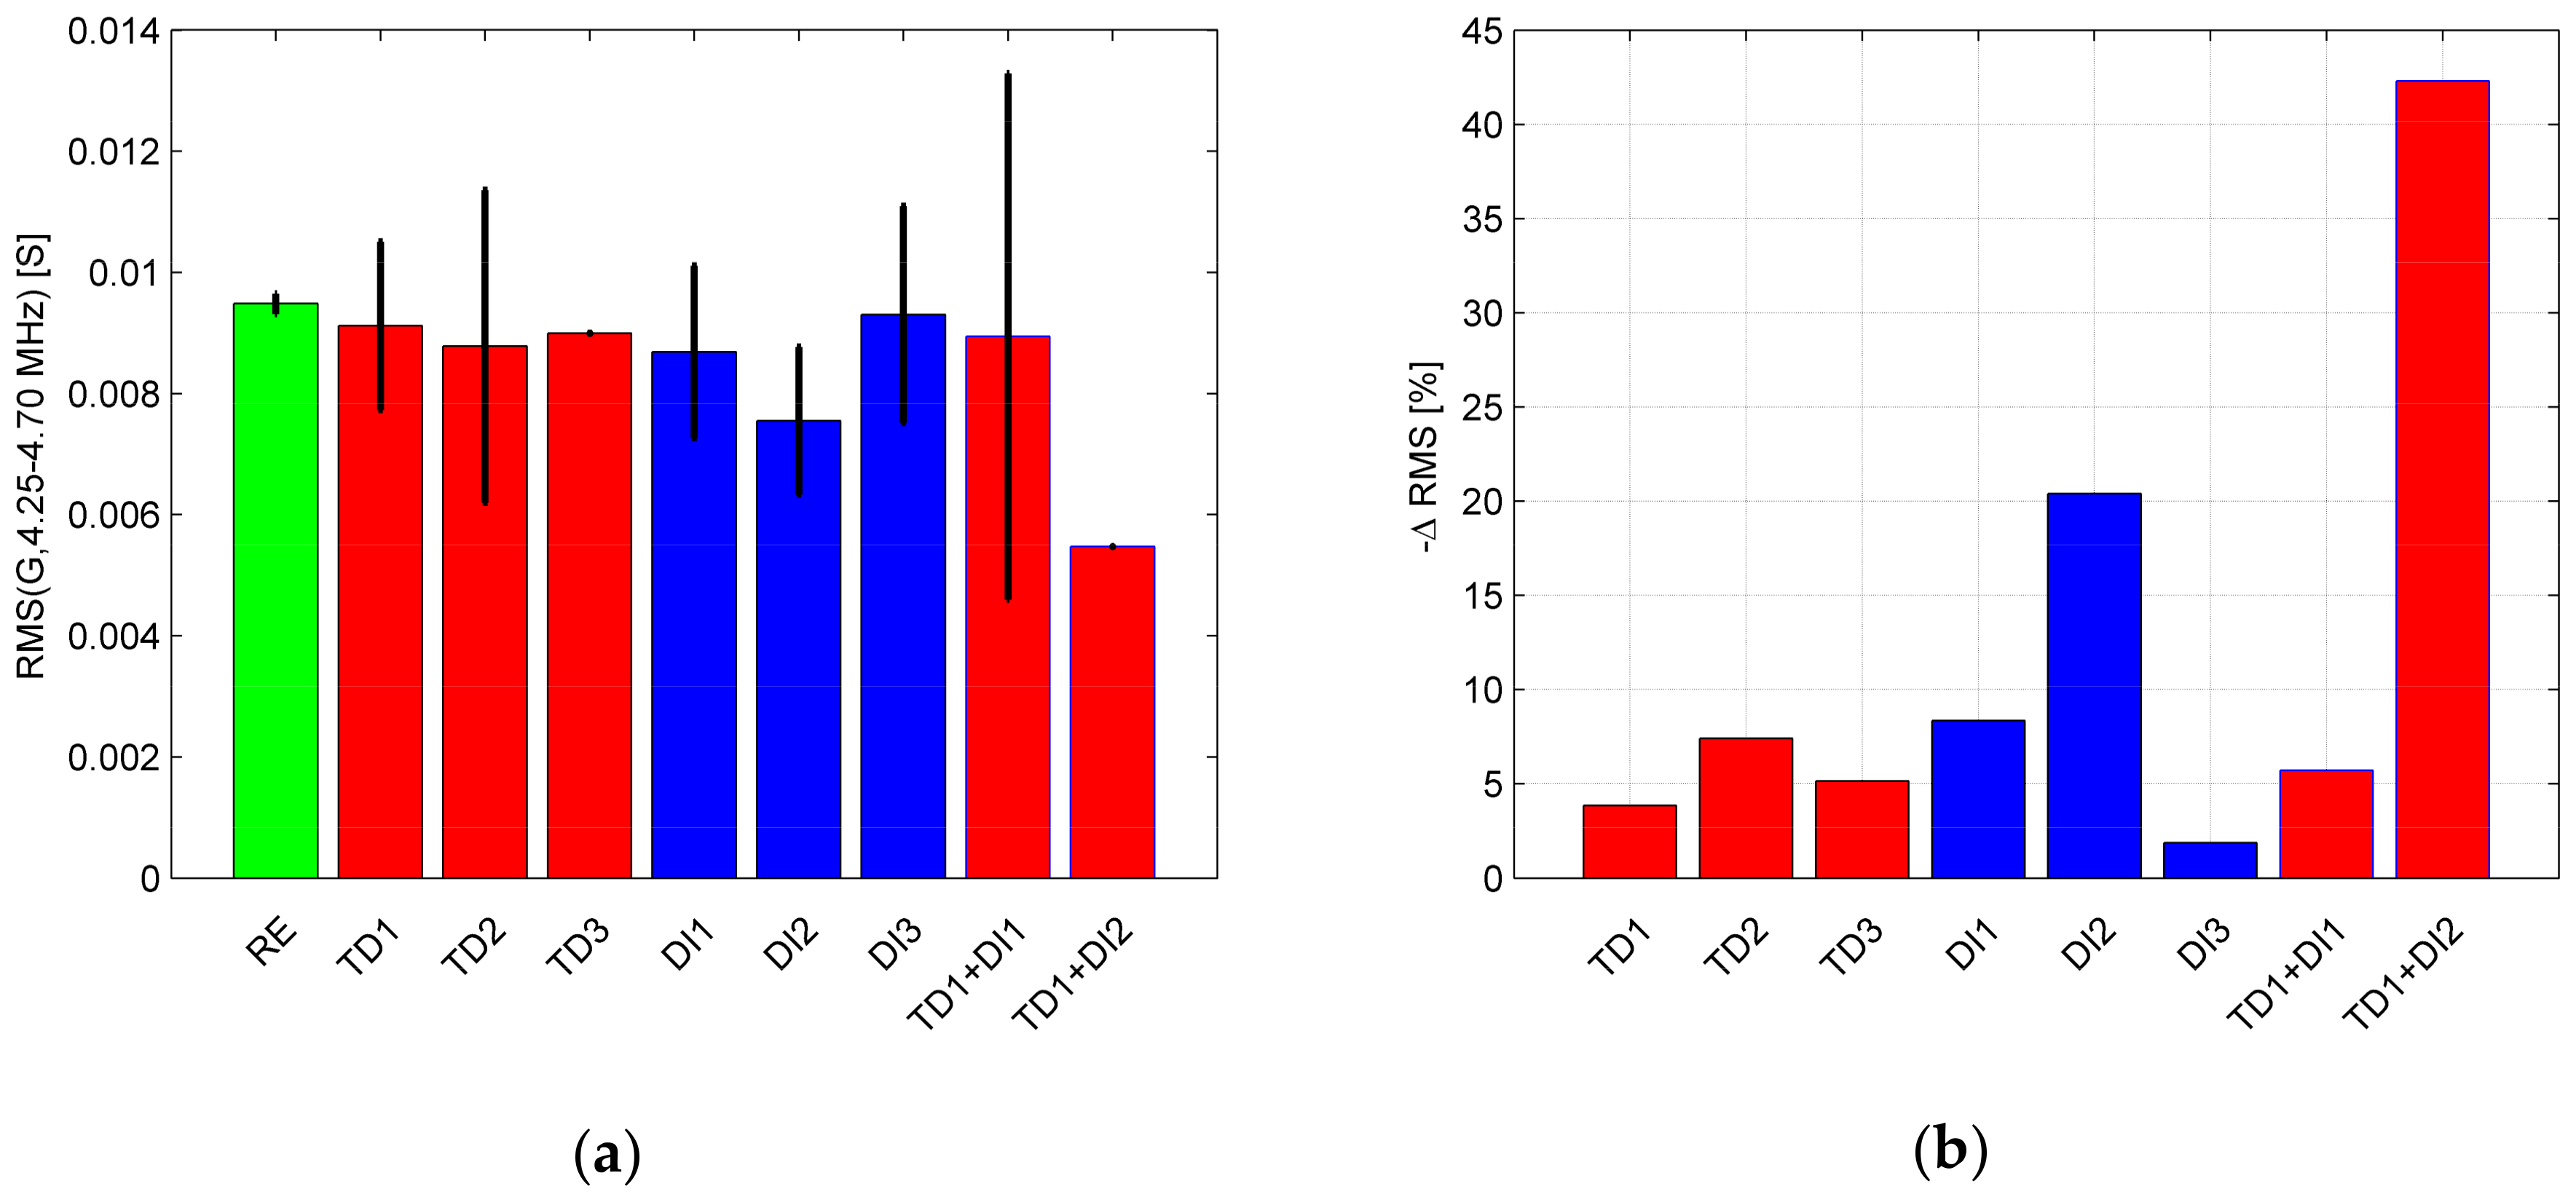
3.3. Electromechanical Impedance Results

IM3570 (HIOKI, Nagano, Japan) impedance analyzer was used to perform EMI testing on the same samples analysed with the ultrasound technique. The samples were instrumented with a piezoelectric disc glued at the middle of the surface for conducting the measurements. The disc had 10 mm diameter and 0.5 mm thickness, and was manufactured by CeramTec (Ebersbach, Germany) with SONOX P502 material. The used analyzer allowed for the measurement of the electrical response, up to 5 MHz, and the whole range was considered. All the sensors before bonding to the samples were measured in order to have the referential (baseline) response. The research focused on the conductance (G) spectra. After inspecting the spectra of free sensors and spectra obtained for the investigated samples it was observed that for some samples the spectra look different. In some case the conductance maximum at about 4 MHz was not apparent or the peak magnitude increase after the bonding of the sensor to the sample. In total six such cases were identified and they were rejected form analysis to avoid misinterpretation of the results. Following samples were not considered further: RE2, TD12, TD22, TD33, TD1+DI21, TD1+DI22. Moreover, following the results of ultrasonic testing from Section 3.2 the TD31 result was also rejected from analysis because the presence of delamination may interfere with the attempts to assess the bond quality. They both can be an origin of changes in the conductance spectra. The first part of the experiment was focused on identification of the frequency region relevant for the assessment of the adhesive bonds. An example of conductance curves for two reference samples (RE1 and RE3) and respective free piezoelectric sensors before bonding (RE1p and RE3p) is depicted in Figure 6. The first observation is that the maximum peak magnitude drops after bonding of the sensors. The difference up to 3 MHz are not well pronounced due to the high maximum peak, but apparent changes after bonding of the sensors are visible near 3.5 MHz and 4.5 MHz. The resonance in the vicinity of 3.5 MHz cannot be solely assigned to the structure (sample) because it was also observed for some other free sensors (for example the TD31p). Therefore, the attention was focused on the 4.5 MHz region. The spectra for 4.25–4.70 MHz range were plotted in Figure 7. It can be clearly seen that G values for free sensors are low in this region, while a resonance is observed for the samples. There is almost a perfect match between location and magnitude of this resonance for the two samples (RE1 and RE3). What is interesting, is that the responses for the free sensors (dotted lines) in this region do not match so well.
The identified frequency region (4.25–4.70 MHz) was used for studying the adhesive bonds. All the samples were compared for this frequency region. The comparison was based on widely used RMS index but applied only to this narrow frequency region. Depending on the case, there were 3, 2 or 1 sample for the same conditions so the mean value of the RMS was taken for comparison together with the standard deviation. The result is depicted in Figure 8a. The cases with no error bars visible (TD3 and TD1+DI2) are the one for which only one sample could be considered. All the samples with contaminated bonds are characterized by lower RMS value than the reference (RE). The exact value for the RE case is RMS = 0.0095 S and this is 2.6 times higher than the mean value for free sensors (RE1p and RE3p) equal to 0.0036 S.

4. Discussion

In order to facilitate the comparison of EMI results with GIC, GIIC and AS results, the RMS values were recalculated as a relative drop in relation to the RE value. The recalculated values were presented in Figure 8b. Similar representation of results was prepared for the GIC (Figure 9a), GIIC (Figure 9b) and AS values (Figure 10). It can be noticed that all the differential values for GIC test are characterized by large uncertainty. The value for TD1 case is in practice insignificant. In the case of higher thermal treatment levels there is highest drop for TD2 case and lower one for TD3 case. The same behavior was observed for RMS values (Figure 8b). The GIIC changes are characterized by lower uncertainty. The behavior of the GIIC and RMS changes are analogous. The observed highest drop for TD2 case suggests that the highest temperature of the thermal treatment (280 °C) weakened the bond to a lesser extent than 260 °C. The AS values show that only TD3 case result is significant, showing a 65% drop in the adhesion strength. In the case of the DI samples, the increase of contamination results in continuous drop of GIIC values (Figure 9b), while there are slight changes in GIC, taking into account large uncertainties. AS for DI1 and DI2 is on the same level (25–26%) and further drop to 36% is observed for DI3 case but with large uncertainty. The RMS values obtained for EMI method are characterized by drop observed for the first (DI1) and second level (DI2) of contamination (Figure 8b). The third level (DI3) differs only by 1.8% from the referential case. The result of the first level combined contamination (TD1+DI1) is comparable to TD1 in the case of GIIC and RMS values. The GIC values for TD1 and TD1+DI1 have too high uncertainties for a good comparison. Considering the second level (TD1+DI2) the RMS value is the highest for this case, while the GIIC drop (82%) for TD1+DI2 do not show too much difference in comparison to TD1 and DI3 drops, equal to 81% and 83%, respectively.

5. Conclusions

The CFRP adhesive bond were tested in destructive and non-destructive way. The mechanical testing showed weakening of the bond in most of the cases. However, the exceptions form this rule were the GIC values for TD1 samples and AS values for TD1, TD2 samples. The reason for this may be sought in the scatter of the reference and TD1 and TD2 cases, such that there is no statistical significance between them. Moreover, the GIC and GIIC values showed that the increase of thermal treatment from 260 °C (TD2) to 280 °C (TD3) do not weaken the bond but the adhesion strength (AS) is significantly lower. Also, there was no significant difference observed between DI1 and DI2 cases, as far as the AS values are concerned. The traditional NDT method used for aero-structures, the ultrasound, did not indicate weak adhesive bond investigated here. However, it was useful to detect a delamination in one of the bonded CFRP plate. The delamination was observed for the plate treated at 280 °C (TD31). The temperature treatment probably caused this damage. This observation allowed to discard the sample from further studies with the EMI technique. The EMI results showed similar behavior to GIC and GIIC for the TD2, TD3, DI1, DI2 and TD+DI samples.

Acknowledgments

This project has received funding from the European Union’s Horizon 2020 research and innovation program under grant agreement no. 636494—project ‘Quality assurance concepts for adhesive bonding of aircraft composite structures by advanced NDT’. The authors would like to thank teams from: Fraunhofer IFAM, Aernnova, Airbus Defense and Space for preparing and characterization of the samples used in this research. The authors would like to thank anonymous reviewers for valuable comments that helped to improve the article.

Author Contributions

Paweł H. Malinowski performed the investigations with the electromechanical impedance technique and wrote the respective section, introduction and conclusions. Konstantinos I. Tserpes investigated the samples with the mechanical testing and wrote the respective section. Romain Ecault conducted the investigations involving ultrasonics and wrote the respective section. Wiesław M. Ostachowicz supervised and advised on the research using electromechanical impedance.

Conflicts of Interest

The authors declare no conflict of interest. The founding sponsors had no role in the design of the study; in the collection, analyses, or interpretation of data; in the writing of the manuscript, and in the decision to publish the results.

References

  1. Eibl, S.; Wolfrum, J. Prospects to separately estimate temperature and duration of a thermal pre-load on a polymer matrix composite. J. Compos. Mater. 2013, 47, 3011–3025. [Google Scholar] [CrossRef]
  2. Heckner, S.; Geistbeck, M.; Grosse, C.; Eibl, S.; Helwig, A. FTIR Spectroscopy as a Nondestructive Testing Method for CFRP Surfaces in Aerospace. J. Nondestruct. Test. 2016, 21, 1–9. [Google Scholar]
  3. Tserpes, K.I.; Markatos, D.N.; Brune, K.; Hoffmann, M.; Rau, E. A detailed experimental study of the effects of pre-bond contamination with a hydraulic fluid, thermal degradation, and poor curing on fracture toughness of composite-bonded joints. J. Adhes. Sci. Technol. 2014, 28, 1865–1880. [Google Scholar] [CrossRef]
  4. Moutsompegka, E.; Tserpes, K.I.; Polydoropoulou, P.; Tornow, C.; Schlag, M.; Brune, K.; Mayer, B.; Pantelakis, S. Experimental study of the effect of pre-bond contamination with de-icing fluid and ageing on the fracture toughness of composite bonded joints. Fatigue Fract. Eng. Mater. Struct. 2017, 40, 1581–1591. [Google Scholar] [CrossRef]
  5. Singhal, T.; Kim, E.; Kim, T.-Y.; Yang, J. Weak bond detection in composites using highly nonlinear solitary waves. Smart Mater. Struct. 2017, 26, 055011. [Google Scholar] [CrossRef]
  6. Christopoulos, A.; Hristoforou, E.; Koulalis, I.; Tsamasphyros, G. Inductive strain sensing using magnetostrictive wires embedded in carbon fibre laminates. Smart Mater. Struct. 2014, 23, 08503. [Google Scholar] [CrossRef]
  7. Canal, L.P.; Sarfaraz, R.; Violakis, G.; Botsis, J.; Michaud, V.; Limberger, H.G. Monitoring strain gradients in adhesive composite joints by embedded fiber Bragg grating sensors. Compos. Struct. 2014, 112, 241–247. [Google Scholar] [CrossRef]
  8. Dugnani, R.; Zhuang, Y.; Kopsaftopoulos, F.; Chang, F.-K. Adhesive bond-line degradation detection via a cross-correlation electromechanical impedance-based approach. Struct. Health Monit. 2016, 15650–15667. [Google Scholar] [CrossRef]
  9. Dugnani, R.; Chang, F.-K. Analytical model of lap-joint adhesive with embedded piezoelectric transducer for weak bond detection. J. Intell. Mater. Syst. Struct. 2017, 28, 124–140. [Google Scholar] [CrossRef]
  10. Malinowski, P.; Wandowski, T.; Ostachowicz, W. The use of electromechanical impedance conductance signatures for detection of weak adhesive bonds of carbon fibre-reinforced polymer. Struct. Health. Monit. 2015, 14, 332–344. [Google Scholar] [CrossRef]
  11. Malinowski, P.; Ostachowicz, W.; Brune, K.; Schlag, M. Study of electromechanical impedance changes caused by modifications of CFRP adhesive bonds. Fatigue Fract. Eng. Mater. Struct. 2017, 40, 1592–1600. [Google Scholar] [CrossRef]
  12. AITM 1-0053. AITM, Airbus Test Method, Carbon Fibre Reinforced Plastics, Determination of Fracture Toughness Energy of Bonded Joints, Mode I; Airbus S.A.S.: Toulouse, France, 2006.
  13. AITM 1-0006. AITM, Airbus Industry Test Method, Carbon Fibre Reinforced Plastics, Determination of Interlaminar Fracture Toughness Energy, Mode II; Airbus S.A.S.: Toulouse, France, 1994.
Figure 1. Schematic drawing of the mechanical test used for determining GIC values.
Aerospace 05 00036 g001
Figure 2. Results of the mechanical testing: (a) mode-I fracture toughness energy; (b) mode-II fracture toughness energy.
Aerospace 05 00036 g002
Figure 3. Schematic drawing of the mechanical test used for determining GIIC values.
Aerospace 05 00036 g003
Figure 4. Average adhesion strength values comparison for the RE, TD and DI samples.
Aerospace 05 00036 g004
Figure 5. Ultrasonic g+ gate amplitude and time of flight results for reference samples (RE) and thermally treated samples (TD).
Aerospace 05 00036 g005
Figure 6. Conductance curves for two reference samples (RE1 and RE3) and respective free piezoelectric sensors before bonding (RE1p and RE3p).
Aerospace 05 00036 g006
Figure 7. Conductance curves for 4.25–4.70 MHz range for two reference samples (RE1 and RE3) and respective free piezoelectric sensors before bonding (RE1p and RE3p).
Aerospace 05 00036 g007
Figure 8. Results of investigating of the 4.25–4.70 MHz frequency region with RMS index: (a) calculated RMS values; (b) relative drop of the RMS values in relation to the results for the set of referential samples (RE).
Aerospace 05 00036 g008
Figure 9. Relative results of the mechanical testing in relation to reference case (RE): (a) mode-I fracture toughness energy drop; (b) mode-II fracture toughness energy drop.
Aerospace 05 00036 g009
Figure 10. Relative drop of adhesion strength (AS) in relation to reference case (RE).
Aerospace 05 00036 g010

