Leading-Edge Roughness Affecting Diamond-Wing Aerodynamic Characteristics


Chair of Aerodynamics and Fluid Mechanics, Department of Mechanical Engineering, Technical University of Munich, Boltzmannstr. 15, D-85748 Garching by Munich, Germany
*
Author to whom correspondence should be addressed.
Aerospace 2018, 5(3), 98; https://doi.org/10.3390/aerospace5030098
Submission received: 1 August 2018
/
Revised: 27 August 2018
/
Accepted: 29 August 2018
/
Published: 19 September 2018
(This article belongs to the Special Issue Feature Papers in Aerospace)
Abstract
:Diamond wing configurations for low signature vehicles have been studied in recent years. Yet, despite numerous research on highly swept, sharp edged wings, little research on aerodynamics of semi-slender wings with blunt leading-edges exists. This paper reports on the stall characteristics of the AVT-183 diamond wing configuration with variation of leading-edge roughness size and Reynolds number. Wind tunnel testing applying force and surface pressure measurements are conducted and the results presented and analysed. For the investigated Reynolds number range of there is no significant influence on the aerodynamic coefficients. However, leading-edge roughness height influences the vortex separation location. Trip dots produced the most downstream located vortex separation onset. Increasing the roughness size shifts the separation onset upstream. Prior to stall, global aerodynamic coefficients are little influenced by leading-edge roughness. In contrast, maximum lift and maximum angle of attack is reduced with increasing disturbance height. Surface pressure fluctuations show dominant broadband frequency peaks, distinctive for moderate sweep vortex breakdown. The experimental work presented here provides insights into the aerodynamic characteristics of diamond wings in a wide parameter space including a relevant angle of attack range up to post-stall.
1. Introduction
The understanding of the complex flow field for low/moderately swept wings (leading-edge sweep angles in the range of –) is essential for designing modern low-radar signature uninhabited aerial vehicles (UAV) [1]. To study the flow separation onset on corresponding blunt leading edges the North Atlantic Treaty Organization’s (NATO) Applied Vehicle Technology Group AVT-183 designed a generic diamond wing geometry with a rounded leading edge [2]. The flow field around this wing constitutes a vortex system that differs to some extent from “classical” leading-edge vortex separation from a sharp edge of a slender swept wing (sweep angle ), for which extensive investigations have been conducted [3]. Relevant findings on the flow field of semi-slender wings and its dependency on wing geometry and freestream conditions is briefly presented below.
Concerning vortex breakdown, early investigations [4,5] demonstrated a strong dependence on the leading-edge sweep angle , and small effect of the trailing edge sweep angle. Vortex breakdown is shifted downstream with increasing leading-edge sweep, this leads to an increase in maximum lift coefficient and corresponding angle of attack. Over moderately swept wings, , the breakdown location is close to the apex even at low incidences. Furthermore, up to , the unsteady loading due to breakdown increases more rapidly with the angle of attack. Moderate sweeps also lead to increased unsteadiness in breakdown location compared to slender vortex flows.
Over a swept delta wing, Taylor et al. measured fluctuations of the breakdown location reaching longitudinal amplitudes as high as of the wing’s root chord [6]. During this investigation, crossflow particle-image-velocimetry (PIV) measurements indicate no concentration of vorticity in the vortex core. Instead, high vorticity values demonstrate the downstream roll-up of the shear layer. At high angles of attack, the separated shear layer fails to reattach on the upper surface. For the same wing model, subsequent investigations reported on the structure of the leading-edge vortex with variations of angle of attack [7]. A less abrupt vortex breakdown than for slender wings dominates the flow field. The breakdown location moves upstream and the reattachment line of the primary vortex shifts inboard with increasing incidence. Measurements of velocity fluctuations identified a broad peak around a frequency that can be associated with the helical mode instability for slender delta wings. However, the peak is much narrower for slender wing vortices. Another different characteristic for non-slender wings is that the reattachment of the shear layer is an important source of buffet flows. The fluctuations owing to the shear layer instability are transported due to the reattachment process towards the wing surface, where reduced frequencies in the range k = 1–2 are measured.
Complementary numerical simulations conducted by Gordnier and Visbal confirm the above findings [8]. The authors concluded that the breakdown above low-sweep delta wings changes the flow from a jet to a wake type, similar to high-sweep wing flows. However, both steady and unsteady flow fields show distinctive features. During breakdown, the sudden vortex expansion accompanied by the spiraling of its core and flow reversal is not observed over low-sweep wings. Instead, the vortex core progression downstream is described by an initial jet flow, followed by undulations due to shear layer instabilities and, finally, a rather continuous conical expansion, which makes the identification of breakdown location difficult. Downstream of breakdown, no mean flow reversal and no distinct peak of the pressure fluctuation power spectrum were measured. This flow field shows a more random behaviour with a very broad dominant frequency range.
The investigation of the flow field around a sweptback wing under breakdown and stall conditions revealed a similar core trajectory and widening as mentioned above [9]. In the aft crossflow plane, under high angle-of-attack conditions, the source of unsteadiness has been identified in the separated shear layer by high values of vorticity, velocity fluctuations and inplane Reynolds-stress correlations. In this region, instantaneous vorticity peaks originate near the leading edge and coalesce inboard into vorticity clusters. Dominant broadband spectral peaks of the vertical velocity fluctuations measured along the shear layer are identified. The dominant frequency decreases downstream, in consistency with the inboard growth of vorticity clusters. The measured unsteadiness grows with the angle of attack until the wing fully stalls. The authors did not identify the typical spiral breakdown and suggest that inherent or extrinsic instabilities of the shear layer are responsible for the low-sweep vortex breakdown.
For complexity reduction, the above described research considered planar wings with sharp edges, which is not generally the case in real-life applications. Blunt leading-edge separation is more difficult to predict and more sensitive to freestream conditions. In this case, separation onset does not coincide with the apex as for fully developed vortices at sharp leading edges [10]. The effect of wing thickness and leading-edge shape on the leading-edge vortices are documented, e.g., in [11]. Because less suction is needed to reattach the separated shear layer on a thick wing, the leading-edge vortex has less strength than above a planar surface. Verhaagen investigated how the leading-edge radius variation () influences the vortex system and the aerodynamic characteristics of a swept delta wing [12]. He reported a decreasing distance of the vortex towards the wing’s surface and the leading edge with increasing leading-edge radius. This results in a narrower vortex with less circulation, which induces higher lateral velocities tangent to the wall, thus, increasing suction locally. The breakdown is delayed for blunt leading edges. This results in higher lift and lower drag coefficients. Schütte conducted an extensive numerical investigation of the flow field sensitivity to the change in leading-edge sweep , angle of attack , Mach number and leading-edge radius [13]. He demonstrated that the separation onset moves upstream with decreasing and , on one hand, and with increasing and , on the other. Same findings are reported by Luckring concerning the vortex separation on a delta wing [10]. In addition to and variation, the effect of Reynolds number on the flow has been assessed: a increase by one order of magnitude delays separation, due to the relative viscosity reduction.
Preceding investigations of the AVT-183 diamond wing characteristics and flow fields are presented in [14,15]. Depending on the applied leading-edge roughness, at , the vortex separation onset is located at about . For a correct validation of fully turbulent computational fluid dynamics (CFD) simulations, the boundary layer in the wind tunnel tests has to be tripped. Trip dots with a disturbance height of = 0.15 mm located both on the upper and lower side at 7 mm arc distance from the leading edge showed a separation onset due to successful transition triggering. Increased disturbance heights lead to a more upstream separation onset, indicating overtripping. The AVT-183 research group defined the flow around the diamond wing with 0.15 mm trip dots, at and , as the validation case for fully turbulent numerical simulations. Several publications concluded the sensitivity of separation to the numerical setup [16,17,18,19].
The current work complements the previous wind tunnel investigations to higher angles of attack (pre-stall, stall and post-stall conditions) and additional increased roughness heights (up to mm). The investigations are conducted by means of PIV measurements, six-components balance measurements and both, steady and unsteady, surface pressure measurements. Description of the experimental methods, discussion of selected results and concluding remarks are the outline of this paper. The main part is Section 3 and includes the quantification and discussion of the vortex development with respect to angle of attack , Reynolds number , relative roughness height and chordwise position on the global and local aerodynamic coefficients. Subsequently, the pressure coefficient fluctuations are investigated for the same cases. The spectral content of is analysed with respect to varying conditions. Broad dominant spectral peaks are identified in the post-breakdown flow field and compared to slender wing flows. Under certain conditions, a second broadband peak appears in the power spectral density (), which is atypical for vortices of slender sharp-edge delta wings.
2. Methods
The investigations are conducted in the low-speed wind tunnel facility of the Chair of Aerodynamics and Fluid Mechanics, Department of Mechanical Engineering, Technical University of Munich (TUM-AER). The current experimental setup, the measurement techniques and the test cases are described subsequently.
2.1. Wind Tunnel Facility
The closed return wind tunnel has a rectangular nozzle cross section, measuring 1.8 m × 2.4 m, and a 4.8 m long open test section. Turbulence level of in all directions and variations in velocity magnitude and direction within and , respectively, characterize the generated freestream. The diamond wing half model is mounted on a turning table with its center located at x = 1.5 m downstream of the nozzle (Figure 1a).
2.2. Wind Tunnel Model
The wind tunnel model represents the geometry of the AVT-183 diamond wing, which is a reduced complexity model for investigating vortex separation onset for blunt edged semi-slender sweptback wings [20]. The planform has a diamond shape, with a positive leading-edge sweep angle of and a forward swept trailing edge . Over the whole span, the wing has a symmetric airfoil, NACA64A006. This leads to a relative leading-edge radius of . The wing’s aspect ratio is equal to and the taper ratio tends to zero. Because the investigations target only symmetric flow conditions, a half model has been developed and manufactured (Figure 1) [2,14]. The model root chord measures = 1.200 m and its resulting half span is s = 0.657 m. The interaction of the diamond wing flow and the test-section boundary layer is eliminated by a péniche with a height of = 0.090 m. Geometric reference values for calculating force coefficients are the reference wing area = 0.394 m2 and the mean aerodynamic chord = 0.800 m. The maximum relative test section blockage of is reached at the highest angle of attack of . Figure 1a includes an upstream view of the test section with the mounted half wing model. The geometric characteristics of the wind tunnel model are shown in Figure 1b and summarized in Table 1.
2.3. Measurement Techniques
2.3.1. Flow Field Visualization
Stereoscopic particle-image-velocimetry (PIV) measurements are essential in order to investigate the near-wall flow of the diamond wing. The current PIV setup is described in [15]. A double-pulse Nd:Yag laser (Nano TRL PIV, Litron Lasers, Rugby, UK) with a maximum energy of E = 325 mJ per pulse and a wavelength of = 532 nm is sent through a widening optic, illuminating seeding particles in selected crossflow planes at two instants ( = 8 ns). The measured chord sections are summarized in Table 2. Two digital cameras fitted with Scheimpflug adapters record both instances at a sampling rate of 15 Hz. Based on the particle relative displacement, the velocity vector field is calculated for each sample by cross-correlation technique. PIV components and software are products of Lavision GmbH., Göttingen, Germany. During one measurement, 400 PIV samples are recorded, from which the averaged flow field is obtained. The inplane spatial resolution measures = 3 mm. Related to the local semispan, the PIV grid spacing decreases linearly downstream in the range . The resulting velocity uncertainty for all three components respectively was found to add up to about pertaining to the free stream velocity [15].
2.3.2. Balance Measurements
The aerodynamic coefficients of the longitudinal motion have been calculated from the forces and moments measured by a six-component strain-gauge balance (Schenk Process GmbH., Darmstadt, Germany) located under the wind tunnel floor. Only aerodynamic loads on the wing have been considered. For this reason, no contact exists between the half wing model and its péniche. The moment reference point (MRP) is located in the symmetry plane and at = 0.491 m downstream of the apex (Figure 1b). Lift and drag coefficients represent the corresponding aerodynamic forces normalized by the reference wing area and the freestream dynamic pressure, which was determined by concomitant measurements. For the pitching moment coefficient, the mean aerodynamic chord is used as reference length. In the previous campaign, the short and long-term repeatability has been demonstrated [15]. The current tests reproduce the coefficients in the range with mean deviations of: , and .
2.3.3. Surface Pressure Measurements
Blue vertical lines in Figure 1b designate the chordwise sections with mounted pressure taps. Their chordwise position and local span are summarized in Table 3. In the vicinity of the chord sections and 0.4, two rows of pressure taps are closely placed (chord Sections 3–6). This increased axial resolution serves for a better determination of incipient vortex separation under the target flow conditions. Three Scanivalve ZOC33/64Px modules (Scanivalve, Liberty Lake, WA, USA) measure local steady surface pressures values at 145 locations on the wing’s suction side and at 17 on the pressure side with a sampling rate of 20 Hz for 10 s. The measurement accuracy is within [14].
For time-accurate measurements Kulite XCS-093 sensors (Kulite Semiconductor Products, Inc., Leonia, NJ, USA) are placed in eight locations on the upper wing surface. In Figure 1b, colored squares mark the position of the unsteady pressure taps. These are distributed pairwise at constant relative local span positions (, 0.75) in each of the four sections at , 0.405, 0.500 and 0.600. The transducers sampled the pressure signal at a frequency of 4000 Hz for 20 s. A low-pass filter has been set at 1000 Hz, which corresponds to a reduced frequency of (see Equation (1)). Signal sampling, conditioning and processing is conducted using the software Labview (National Instruments, TX, USA).
2.4. Test Cases
Aerodynamic forces, surface pressures and freestream conditions were acquired simultaneously at each considered angle of attack in the range of . A polar measurement included increasing in that range by increments. At , the increment was reduced to . The current investigation focuses on the sensitivity of the aerodynamic characteristics to the change in freestream Reynolds number and leading-edge roughness height (relative disturbance height ) within the parameter space summarized in Table 4. Freestream velocity adjustments () determine the Reynolds number, which is based on the mean aerodynamic chord m. In addition, PIV measurements were conducted at and .
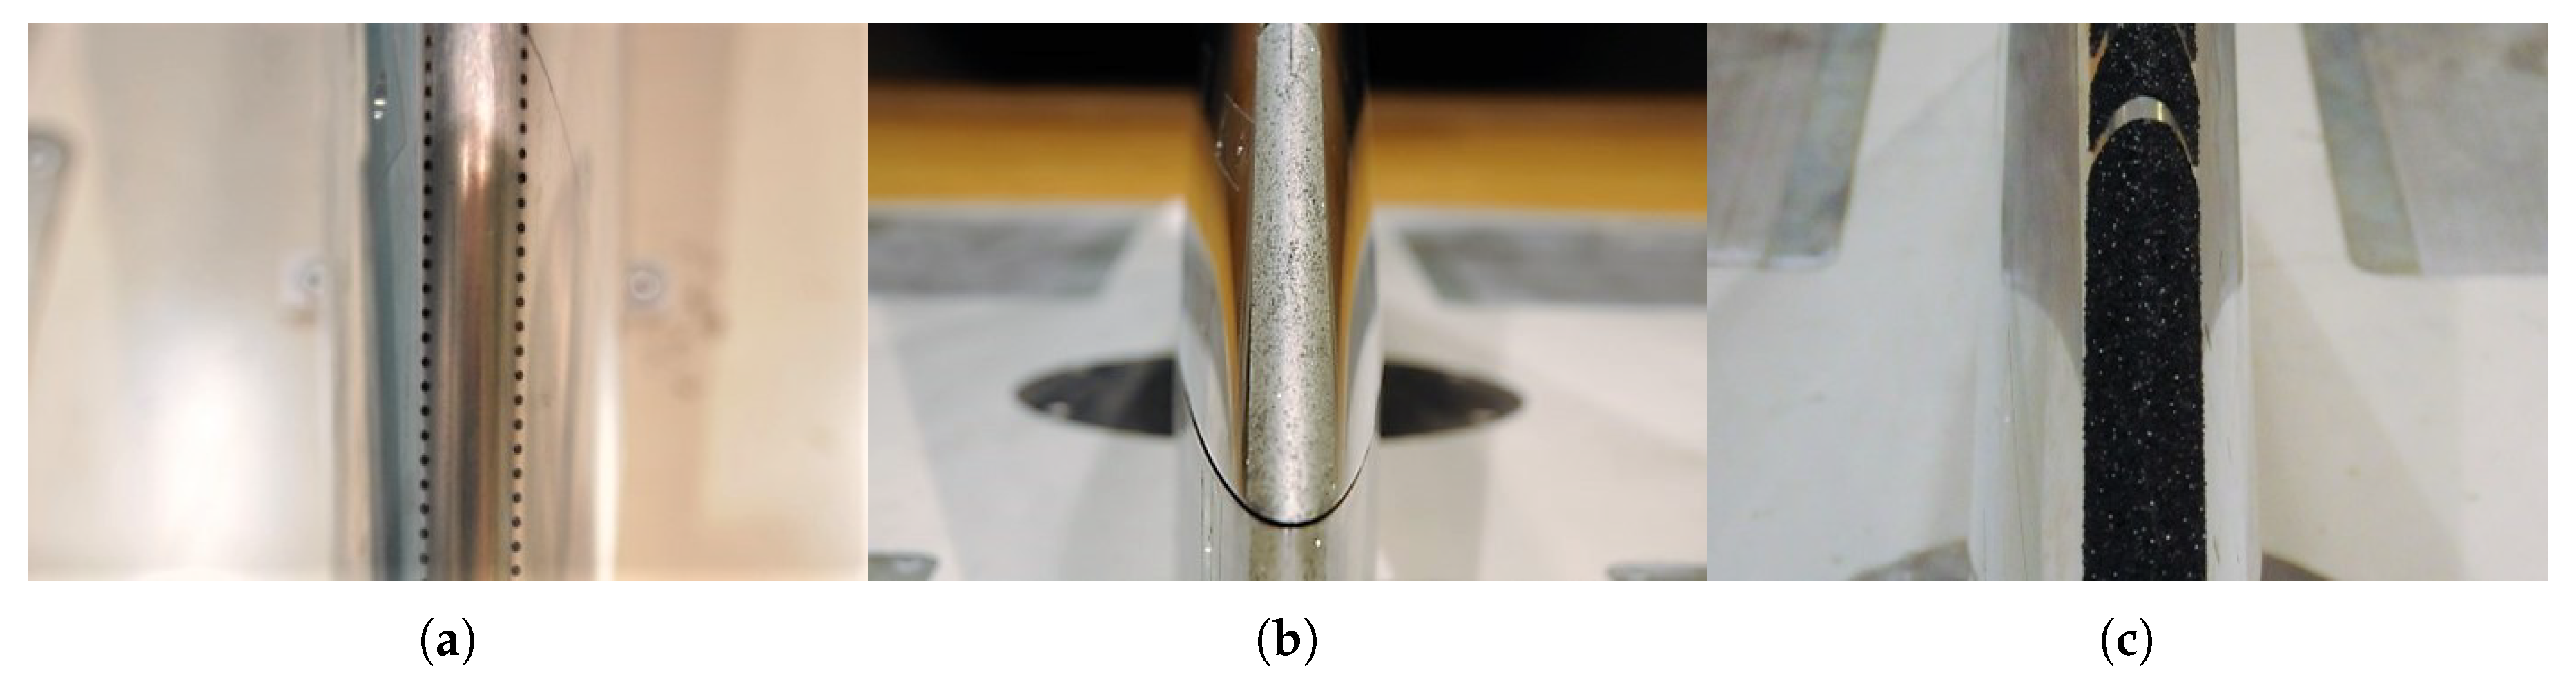
Roughness elements have been applied around the leading edge using the methods described in [14]. Besides the clean configuration, for which natural transition takes place, configurations representing forced transition cases with different trip strip devices have been tested. One of the configuration is equipped with trip dots. These have a cylindrical shape with a diameter of = 1.27 mm and a height of = 0.15 mm. One row of trip dots with a relative spacing along the leading edge of is located on each wing side at a relative arc distance from the leading edge of (see Figure 2a,b and Figure 3a). The preceding investigations concluded that the optimal roughness height of = 0.15 mm () trips the boundary layer prior to separation for the flow around the diamond wing at . Above , the flow is overtripped [14].
Layers with rough surfaces of different heights placed around the leading (carborundum grits) edge constitute the four remaining investigated trip strips. This rough surface extends at a relative arc distance of from the leading edge, both on the upper and lower wing side (see Figure 2c,d). In contrast to the trip-dot case, carborundum grit is randomly distributed and increases the leading-edge radius (Figure 2b,d). Grits of different sizes determine the disturbance height (Figure 3). With exception of a special tape with a maximum roughness size of = 0.55 mm (Figure 3c), all remaining trip strips are applied by manually distributing carborundum particles on a double sided tape with a thickness of = 0.12 mm. In total, four increasing grit sizes are investigated in this work. The cases with and disturbance heights were also investigated in [14] ( = 0.20 mm and 0.55 mm in Figure 3b,c, respectively). The current work extends the investigations to higher angles of attack. Two additional increased relative roughness heights supplement the current wind tunnel tests, namely and ( = 1.00 mm and 2.00 mm in Figure 4). Under these conditions, the disturbance height is expected to exceed the local boundary layer height and, therefore, manipulates the outer flow in form of induced premature separation. The geometric parameters of all investigated trip strips are summarized in Table 5.
3. Results and Discussion
The experimental results are presented in this section in form of crossflow vorticity distribution, global (lift, drag and pitching moment coefficients) and local aerodynamic coefficients (surface pressure coefficients). The investigation focuses on the sensitivity of the aerodynamic characteristics to the variation of Reynolds number and relative roughness size at high angles of attack . First, the flow field at and the vortex development with increasing angle of attack based on spanwise pressure coefficient distribution is discussed (Section 3.1 and Section 3.2, respectively). Second, the effect of parametric variation on the global and the local mean aerodynamic coefficients are assessed (Section 3.3 and Section 3.4). Third, the velocity fluctuations in the flow field of the vortex breakdown inducing pressure fluctuations on the wing surface are discussed for selected configurations (Section 3.5 and Section 3.6).
3.1. Flow Field Visualization
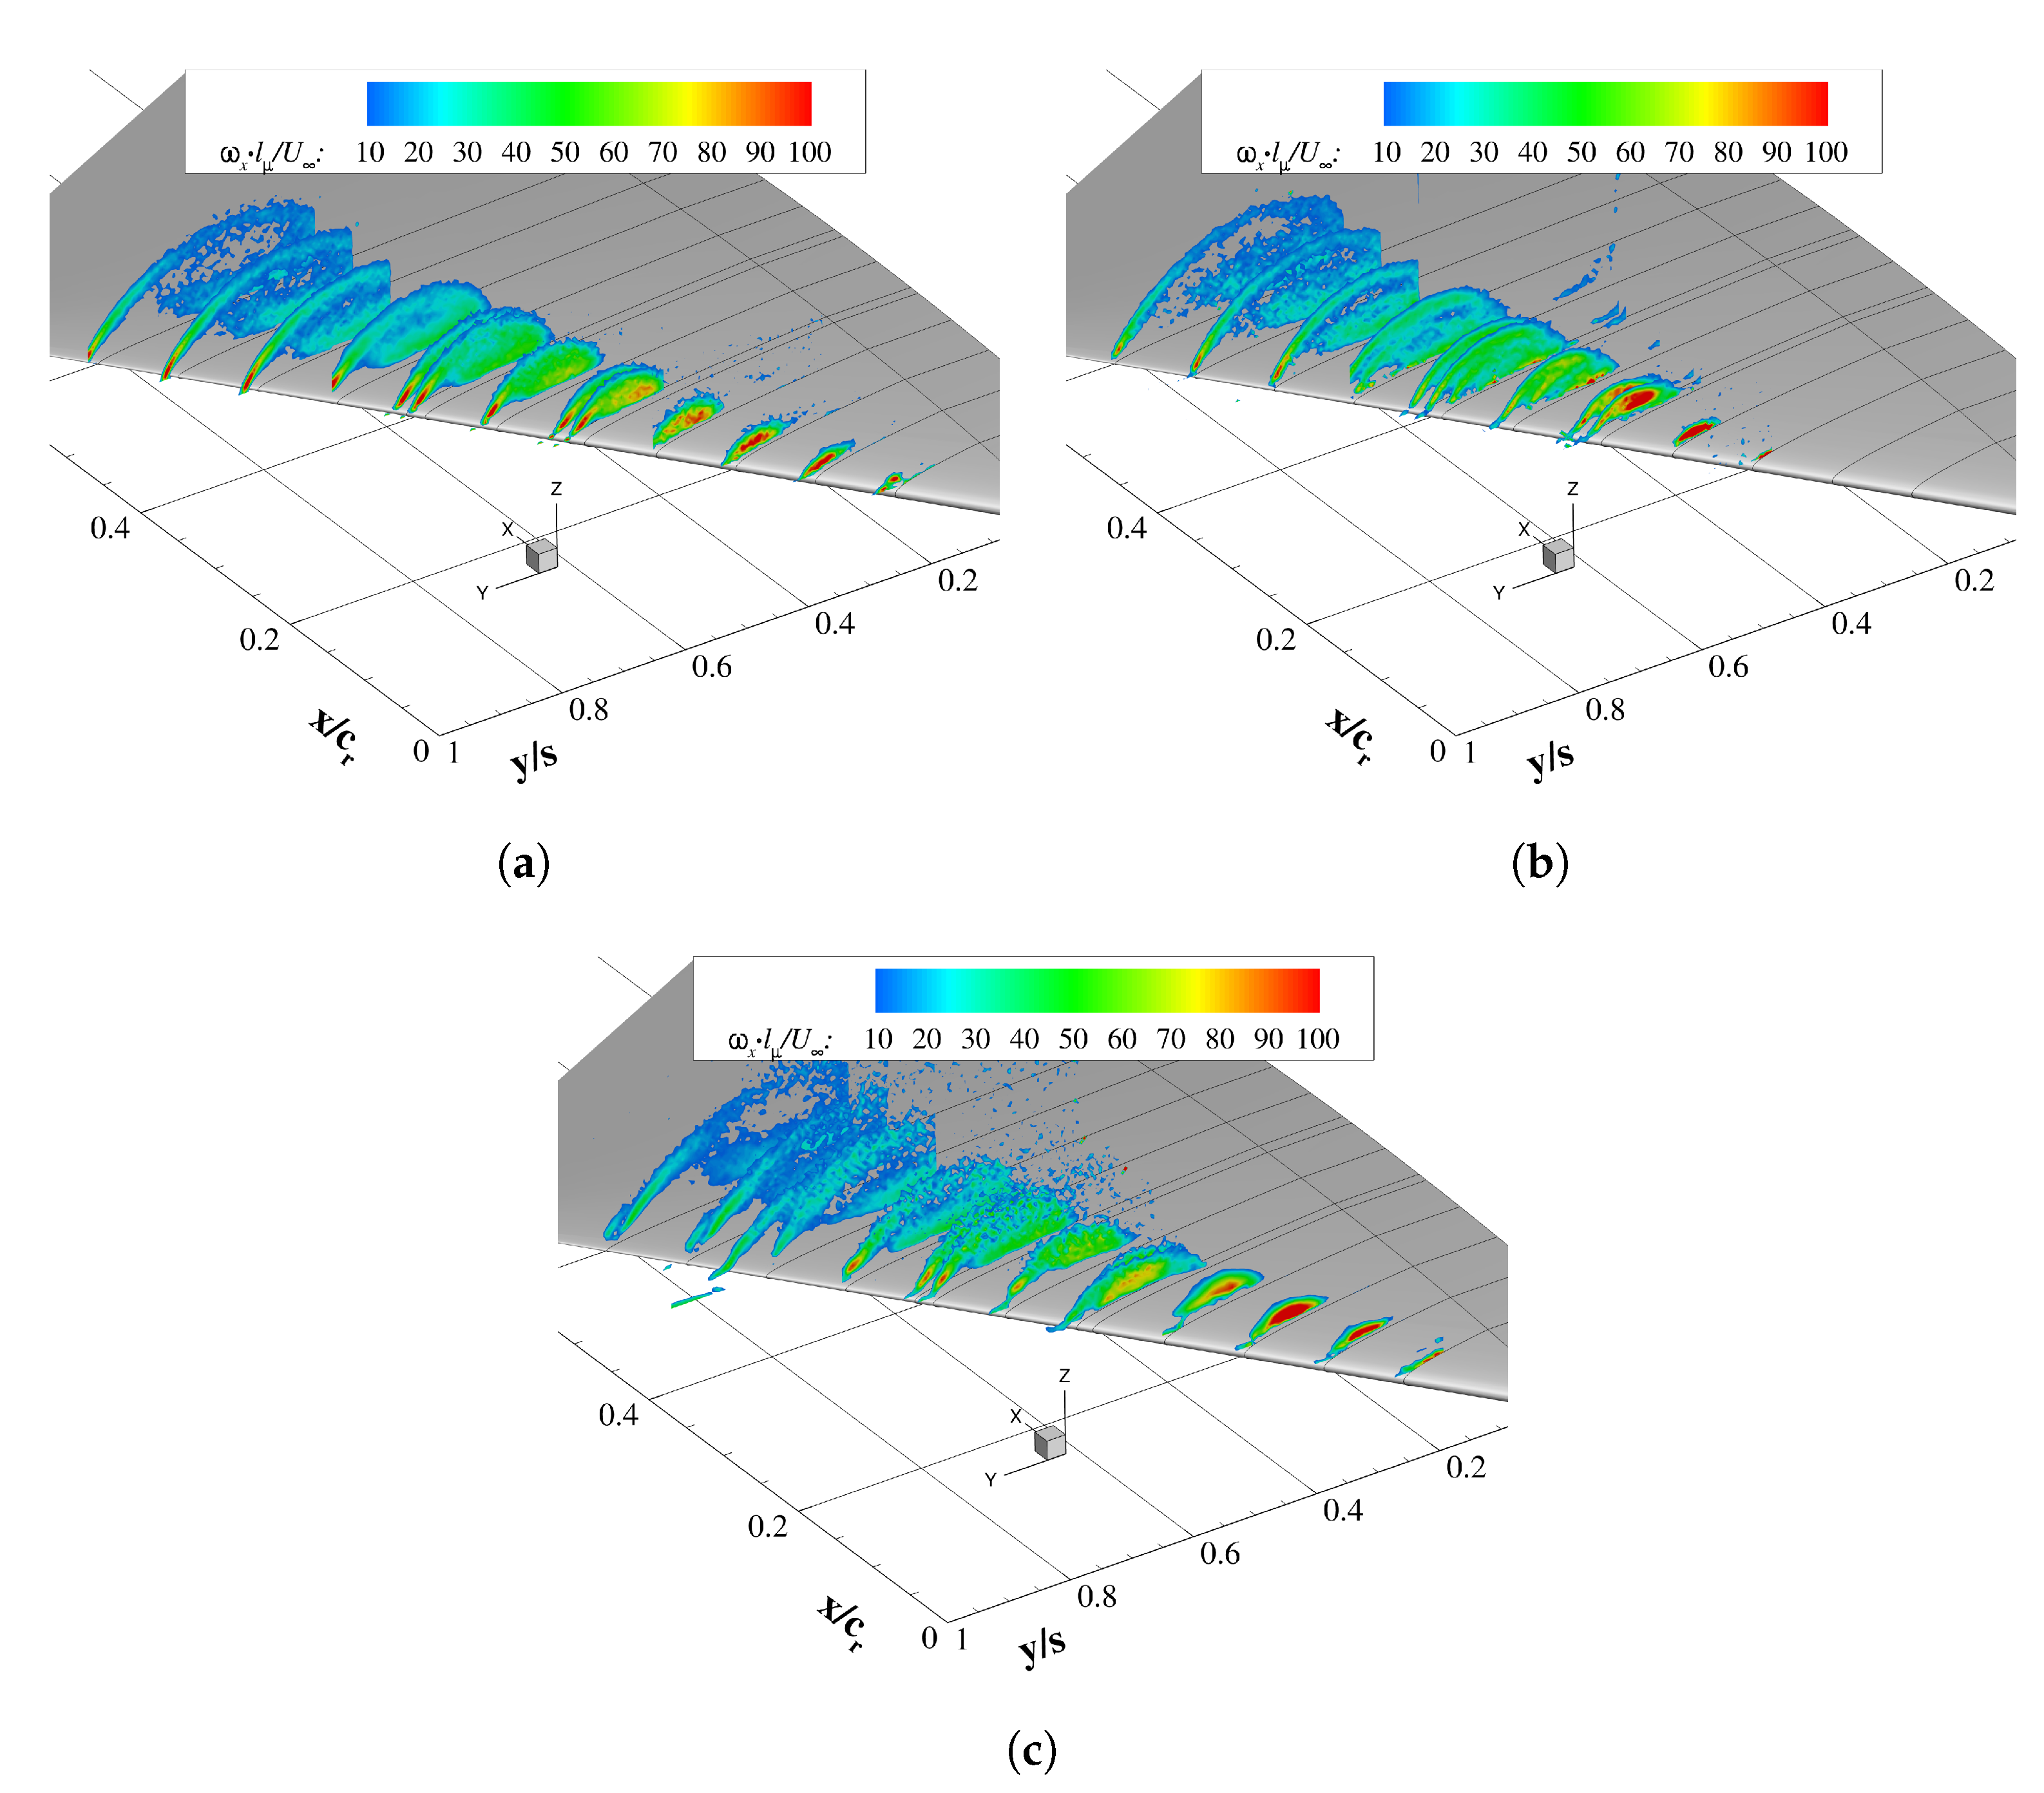
The flow field above the diamond wing investigated via stereo PIV crossflow planes is presented in Figure 5 for three different configurations. The freestream conditions are: and . False colours represent the dimensionless mean axial vorticity in all investigated 13 chord sections in the range of . Based on these, the flow topology is analysed for all investigated configurations: free transition , trip dots and trip strip (Figure 5a–c, respectively). The vortex separates and generates subsequently high vorticity values in its core. Downstream, the core expands due to vorticity feeding from the shear layer. Vortex breakdown is identified when the inplane vorticity distribution transitions from a center peak to an ellipse around the vortex rotation axis. In the breakdown flow field, the shear layer reattaches on the wing’s upper surface and rolls-up around a rotational axis without vorticity feeding towards the core.
The tripping method applied at the leading edge doesn’t change the flow topology. It has a more pronounced impact on the separation onset location, and consequently, on the vortex spanwise position. Comparing the configurations shown in Figure 5, with trip dots (b), vortex separation occurs at the farthest downstream position, as the trip dot case mitigates wall separation by boundary layer tripping. Furthermore, breakdown occurs farthest upstream , whereas the other presented cases have vortex breakdown located downstream of . Increased disturbance heights, , can lead to premature flow separation (see Figure 5c). The corresponding vortex is similar to the natural transition case, but with a wider core section. Further discussion on the leading-edge roughness effect is included in Section 3.4.
3.2. Mean Pressure Coefficient Distribution
Figure 6 includes the distribution of the mean pressure coefficient in the crossflow plane at . The natural transition case is presented, in which the freestream Reynolds number is set at and the angle of attack increases from to with increments. The suction peak designates the lateral position and the strength of the primary leading-edge vortex. With increasing (direction showed by arrows in Figure 6), the vortex moves inboard and increases in diameter, while the suction level drops. The development of the pressure distribution shown in Figure 6 with varying at a fixed chord location is similar to the downstream vortex development (increasing ) at a fixed (see also pressure coefficient distributions in Section 3.2 and Section 3.3). As such, vortex breakdown and, eventually, vortex dissipation is measured at that longitudinal location. The -curve of the upper side is flattening towards stall. This occurs at , according to the lift polar in Figure 7. Up to this incidence, a vortical structure related to vortex breakdown exists over the entire wing. At this point, vorticity feeding from the separated shear layer ceases to increase. Beyond this high angle of attack, the vortical structure becomes unstable and collapses. Wake flow with constant pressure level that increases with is present over the wing (blue curves). On the wing’s lower side, two inboard sensors register the typical pressure increase with . Near the leading edge, however, the flow accelerates and the pressure decreases. This behaviour is observed prior to stall (black curves). During post-stall, a nose-up tendency increases the pressure even at this outboard location (blue curves). The vortex development in Figure 6 represents the unperturbed flow (), but describes the flow physics of all investigated cases. The effect of Reynolds number and disturbance height on the steady and unsteady pressure coefficients are discussed subsequently.
3.3. Reynolds Number Effect
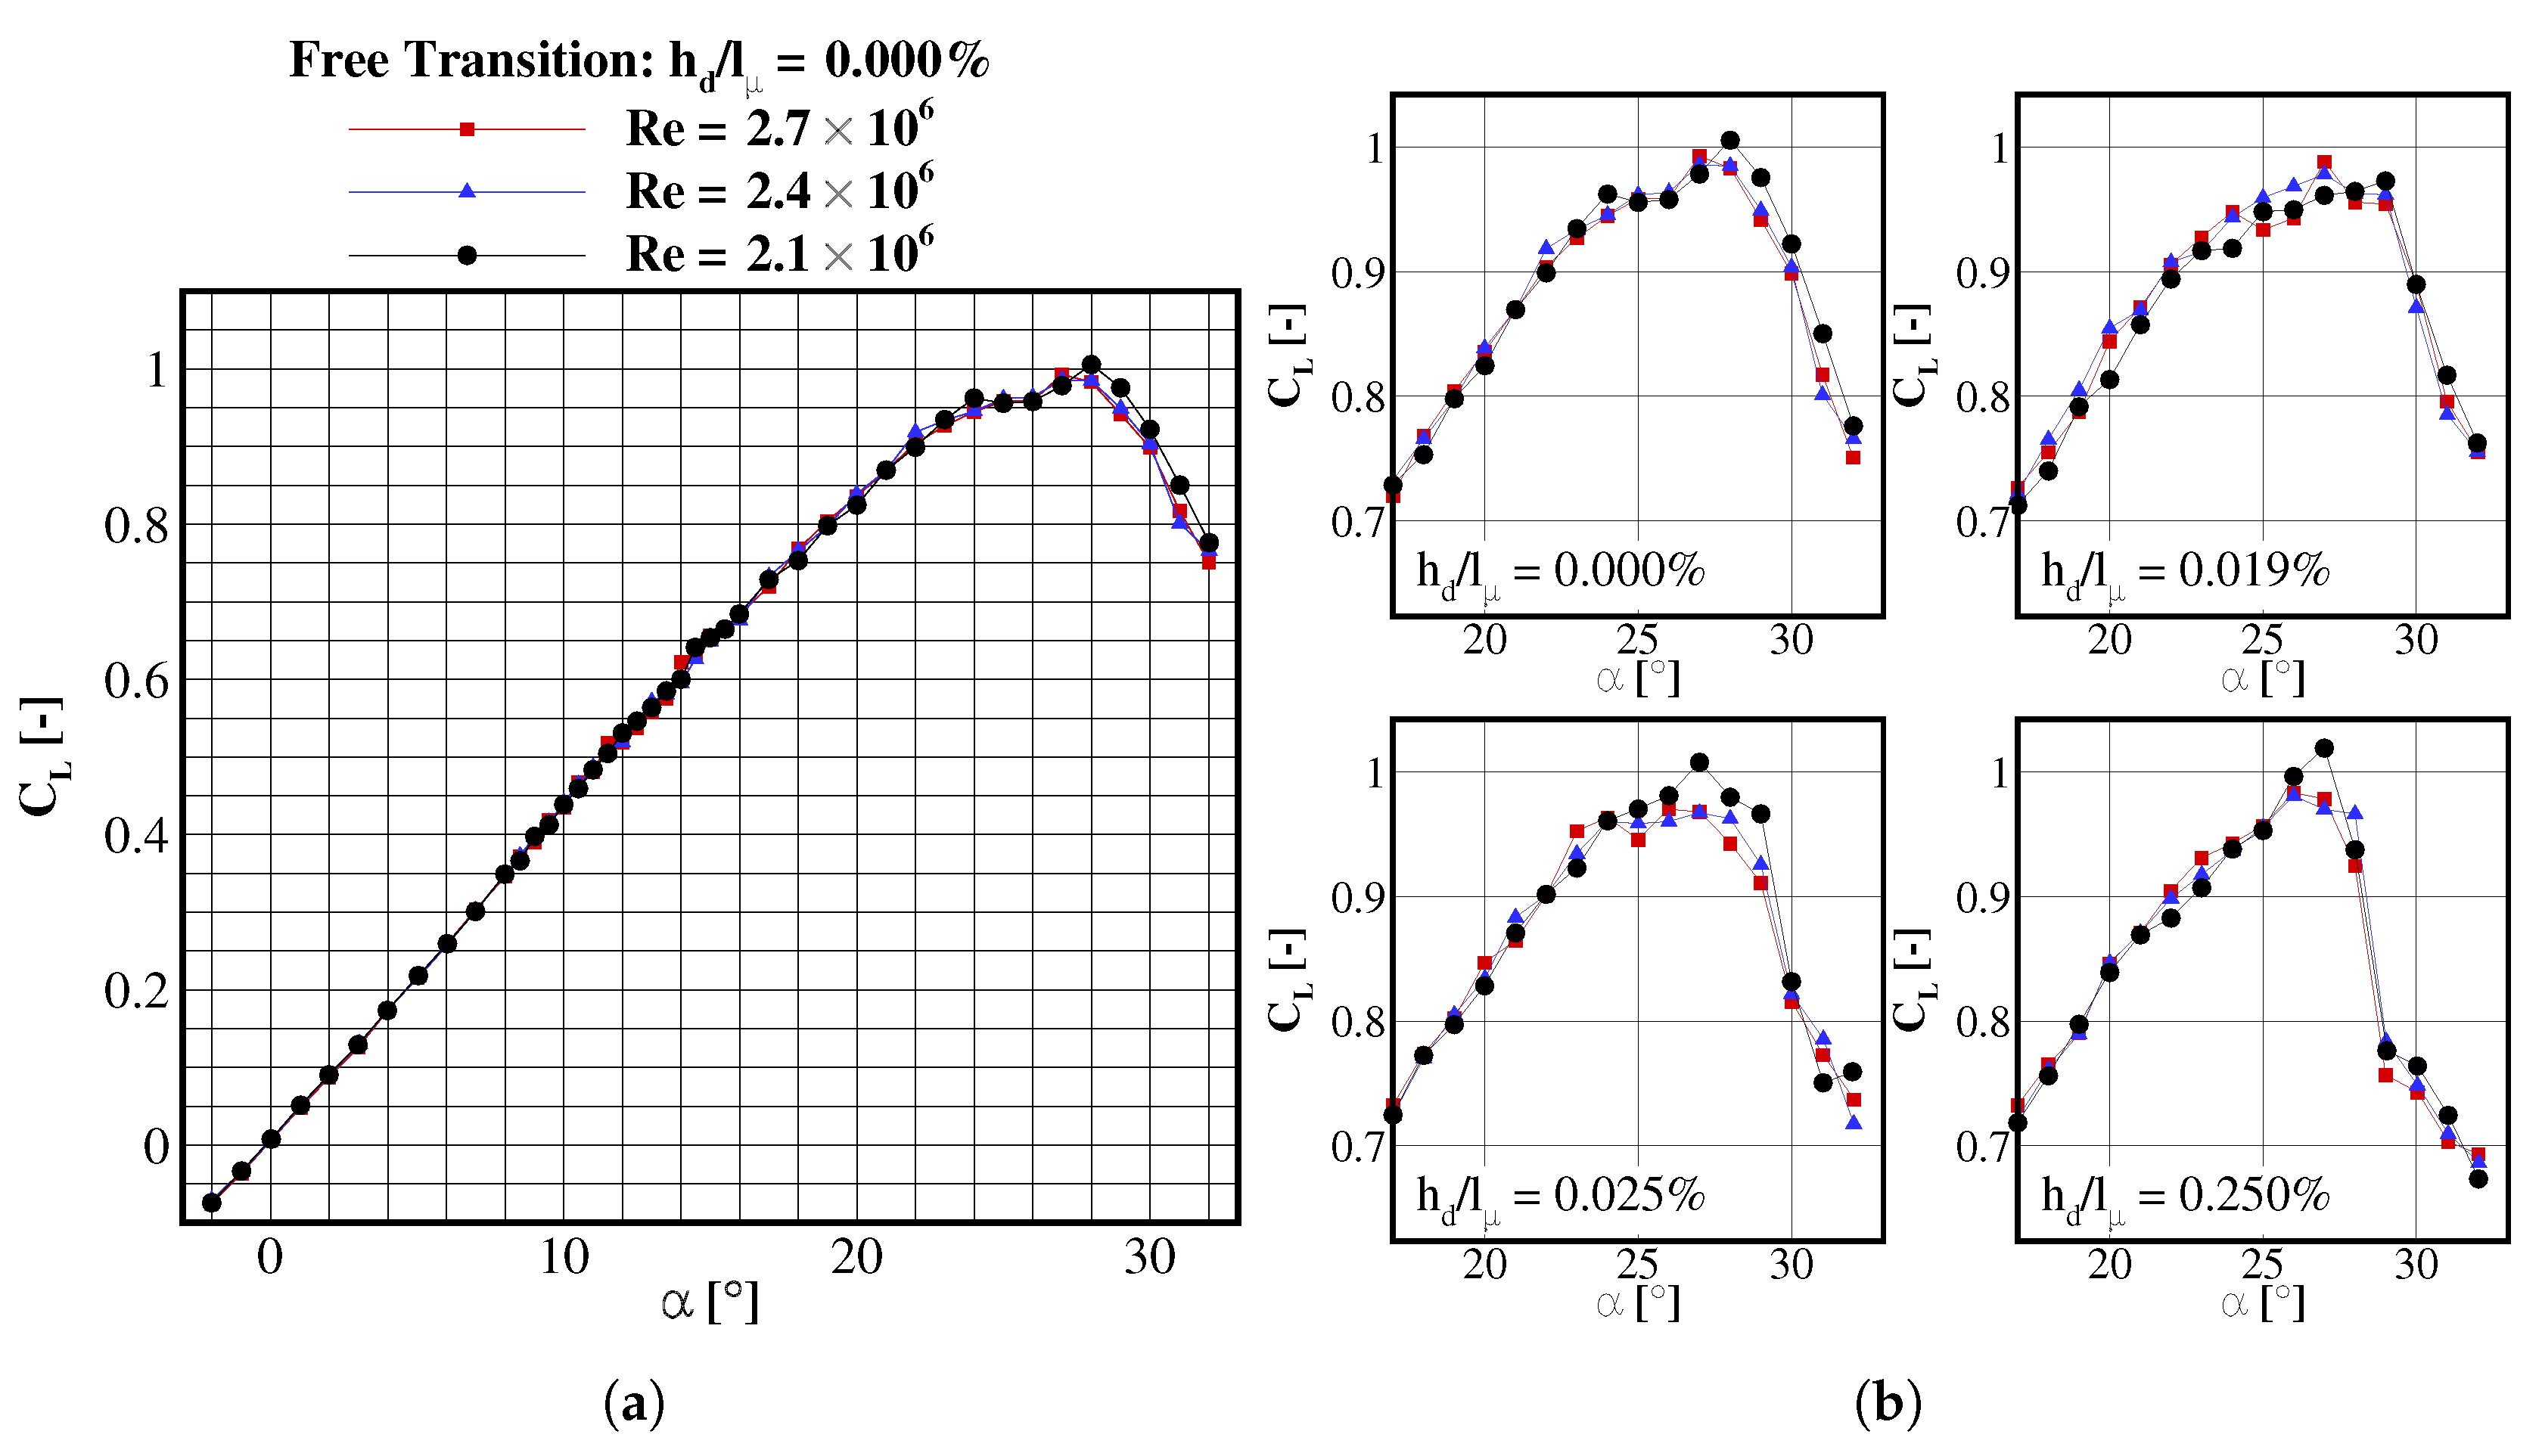
Smooth wall separation is generally dependent on the Reynolds number. Increasing leads to decreasing viscous forces with respect to inertia forces. In this case, the additional kinetic energy of the boundary layer mitigates wall separation. In the current work, the freestream Reynolds number is varied in a relative narrow range of . The lift coefficients show no significant dependency on the Reynolds number (Figure 7). Prior to stall, the lift increases approximately linear with the angle of attack following a slight slope decrease. In this angle of attack range, the Reynolds number variation has no effect on the coefficients. However, the largest deviations are observed around stall (). At these very high angles of attack, the flow field is dominated by vortex collapse, which is more sensitive to than the vortex dominated flow field. The slightly higher lift coefficient measured at is caused by a more upstream blunt leading-edge separation, where the adverse pressure gradient is more pronounced due to high incidence. As seen in Figure 7b, the Reynolds-dependent stall behaviour differs slightly from case to case. For natural transition, a clear lift increase at is observed when the Reynolds number is reduced to . In contrast, the lift coefficients at both highest freestream Reynolds numbers are similar. While the trip-dot case demonstrates no clear Reynolds number dependency, the cases with carborundum grit strip at the leading edge have increased values for the lowest investigated Reynolds number. During post-stall no clear -influence is observed for these cases.
The Reynolds number variation has a more noticeable effect on the case with trip dots (). For this case particularly, the pitching-moment coefficient increases with decreasing Reynolds number in a wide angle of attack range of (Figure 8). Under these conditions, the primary vortex is developed over a major wing portion. Hence, the Reynolds number dependent pitching moment coefficient is generated by Reynolds number dependent separation onset location. Evidence for this can be found in the pressure distribution measured at varying freestream conditions (discussed below). By comparing Figure 8 and Figure 9b a clear pattern is observed: Reynolds number decrease has the same effect on the moment coefficient as the leading-edge roughness height increase.
Figure 10 displays the mean pressure coefficient as function of the local relative span position , for and . The results represent , at which the leading edge vortex originates around . Upstream, the flow follows the leading-edge shape, generating high suction at . Due to the downstream decreasing leading-edge radius, on the one hand, and to boundary-layer momentum loss caused by a longer pressure-side run length, on the other hand, separation starts at the wing tip. The separated shear layer rolls up into a vortex that increases suction. The suction peak decreases and flattens rapidly downstream of indicating vortex breakdown. In contrast to slender delta wings, the primary vortex of semi-slender wings, breaks down early over the wing even at low incidences.
The difference between the pressure distributions caused by -variation shows the associated sensitivity of the vortex separation onset and, consequently, the vortex position. The incipient vortex separation is most sensitive to the freestream Reynolds number for the configuration with trip dots. This results from the relation between the disturbance height and the critical roughness height . According to [21], a laminar boundary layer transitions to turbulence if . A disturbance below this threshold is dampened because of the viscous forces that dominate with decreasing wall distance. Thus, the instability leading to transition is delayed or not triggered. To that effect, the height and the streamwise position of the tripping devices is crucial for a forced boundary layer transition without reversing the effect (overtripping). The optimal tripping device has been extensively investigated in [14]. The trip dots () proved to be the best candidate although the estimated critical roughness height for zero-pressure-gradient boundary layer is approximately three times lower. The chosen disturbance height is necessary to destabilize the rather stable accelerated flow between the separating streamline of the lower side and the leading edge. The Reynolds number decrease from to (see Figure 10) leads to a boundary layer thickening and an increase of , eventually above the disturbance height. As effect, the disturbance is not high enough to trigger transition and premature laminar separation may take place. In conclusion, the decrease in Reynolds number for a fixed critical roughness height has the same effect on the flow as the reduction of the supercritical disturbance height (see Figure 11).
3.4. Leading-Edge Roughness Effect
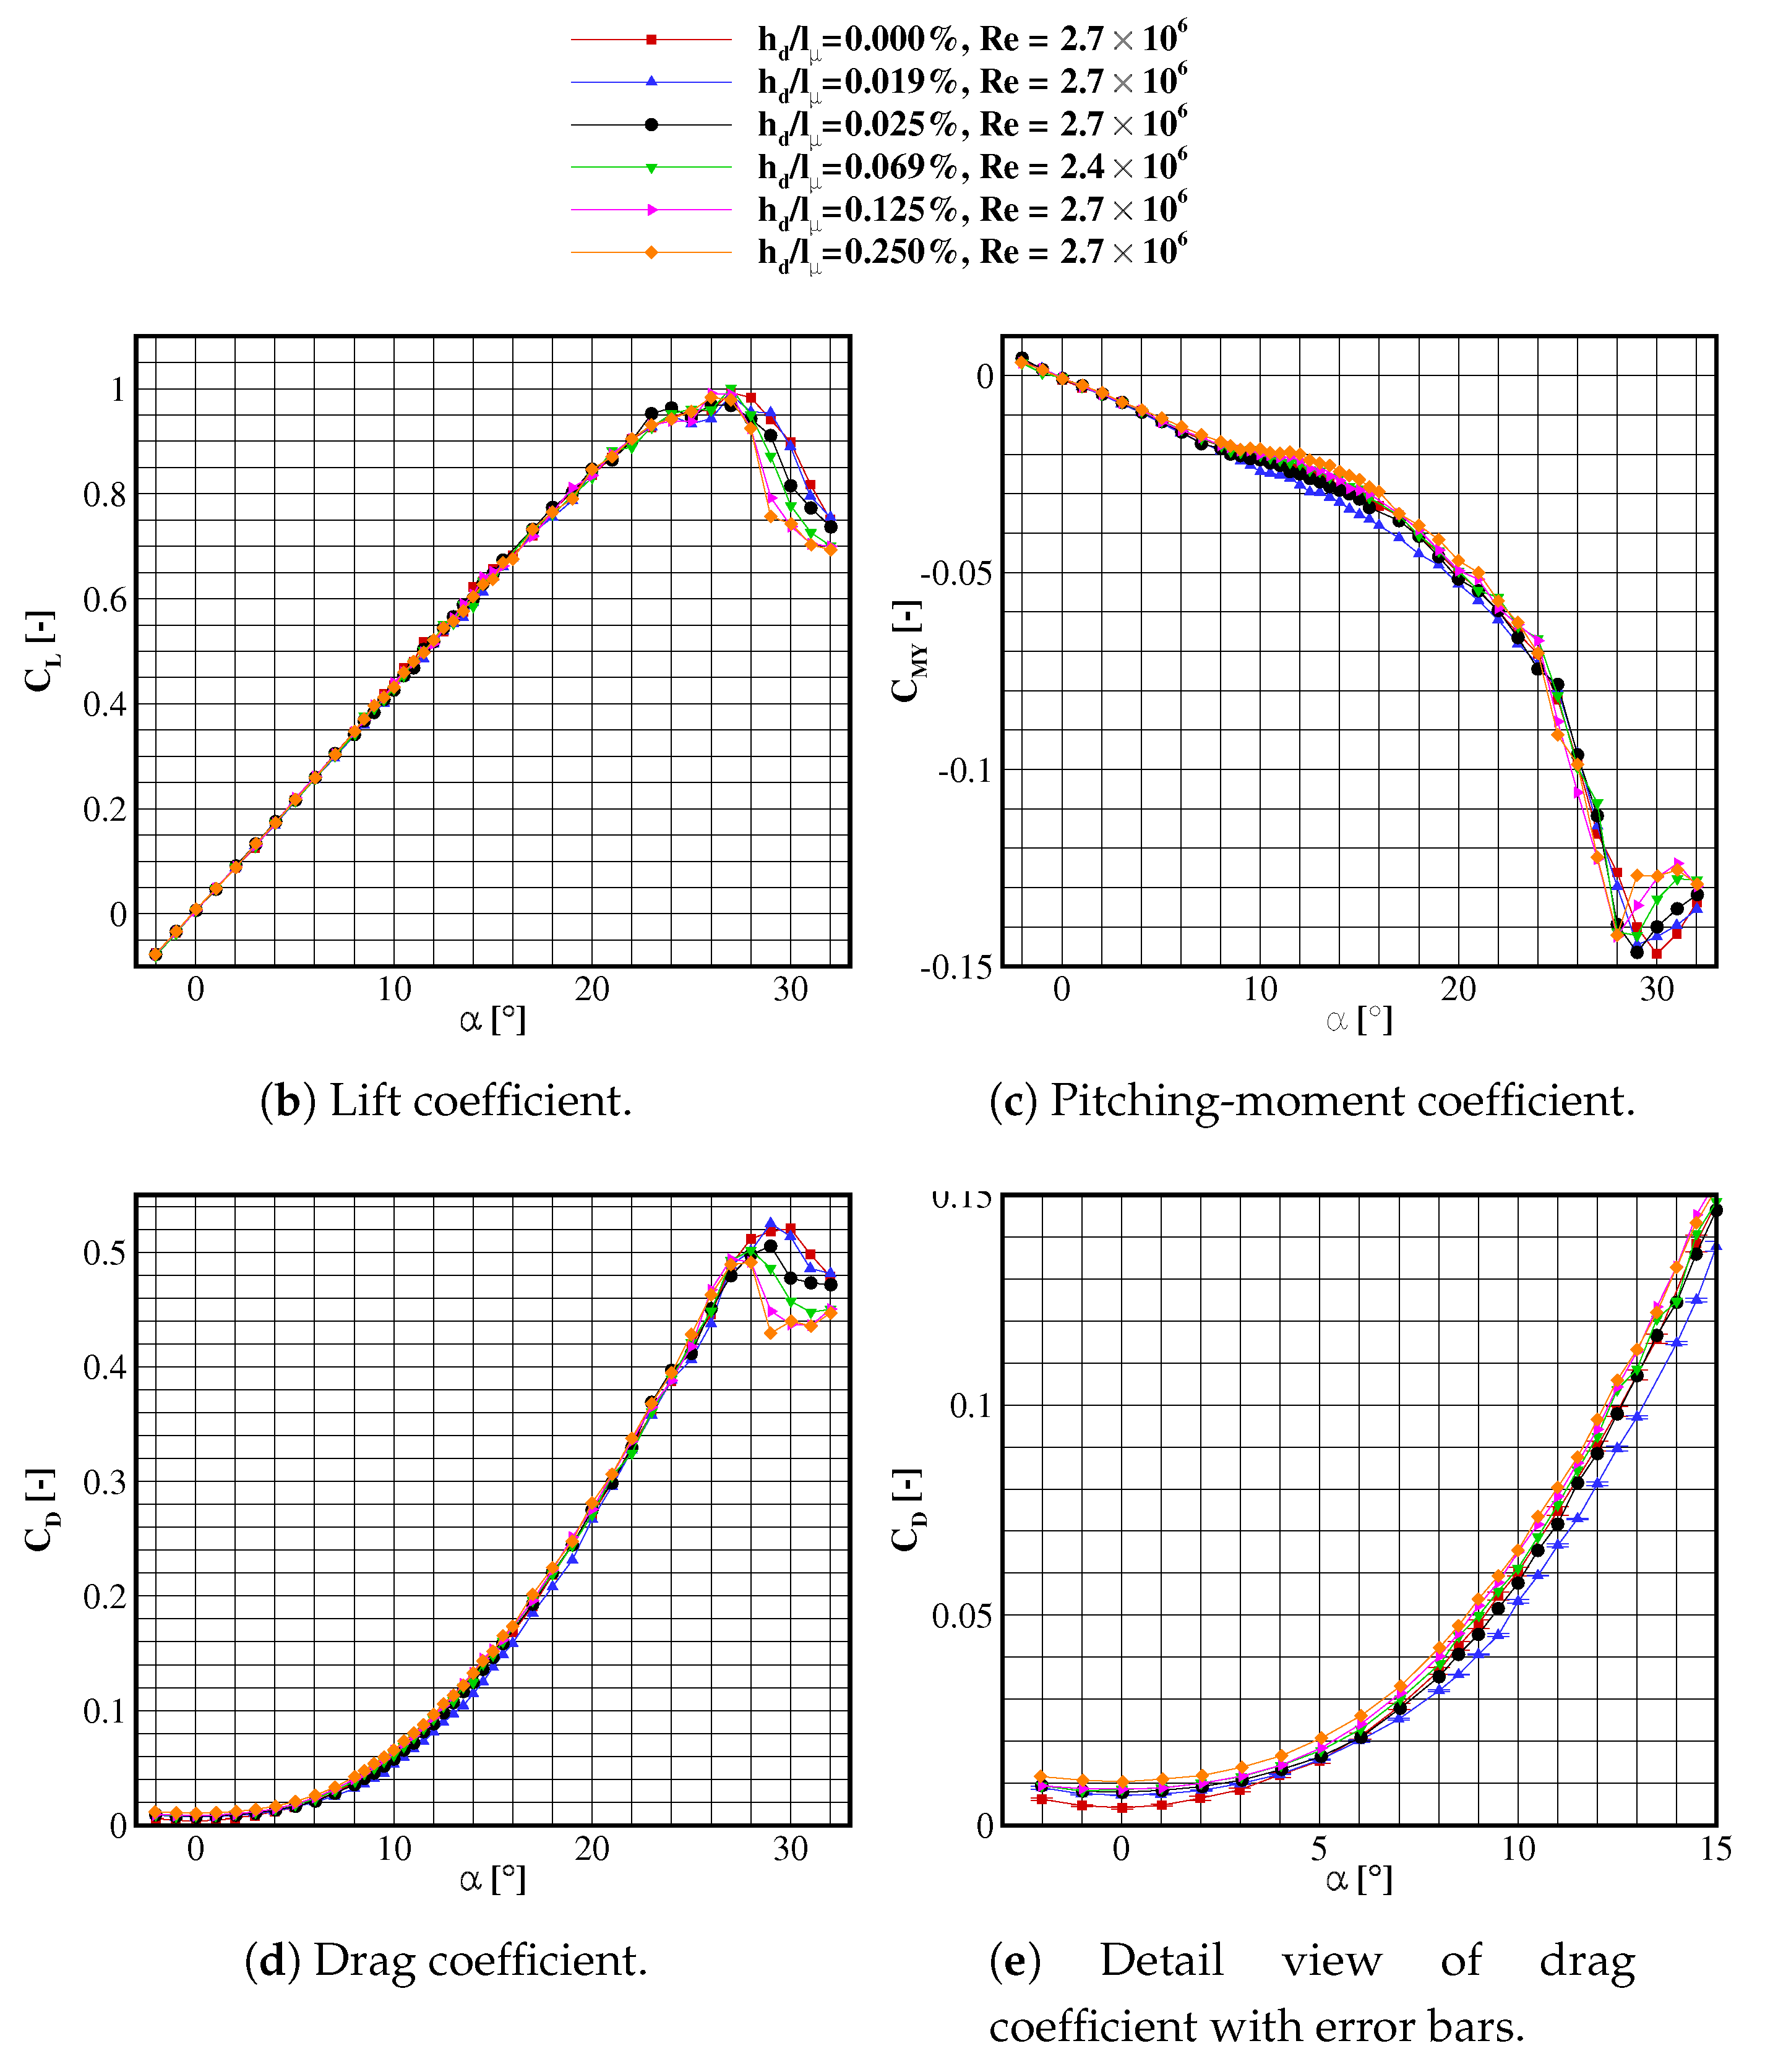
The aerodynamic coefficients of lift , drag and pitching moment are plotted in Figure 9 as function of angle of attack for all investigated relative leading-edge roughness heights . In addition to the experiments in [14], the measured incidence range, , includes pre-stall, stall and post-stall flight regimes, which is the focus of the present study. All measured relative disturbance heights are compared: (natural transition), 0.019% (trip dots), 0.025%, 0.069%, 0.125% and 0.250% (grit surfaces). The results refer to measurements carried out at freestream Reynolds numbers of and . The comparison is justified by the Reynolds-number insensitivity on the global coefficients in the range for all supercritical disturbances (see above).
Up to the pre-stall regime, , the lift coefficient shows no significant dependency on (see Figure 9a). The lift increase is nearly linear. Before reaching stall, the -gradient decreases. This lift slope is typical for blunt non-slender wing configurations: the vortical lift portion is barely measurable, concluding the formation of a rather weak vortex [22]. The maximum lift is reached at – for all measured cases. Above this incidence, however, the lift coefficient slopes diverge. The natural transition and the forced transition with trip dots (designated as red squares and blue deltas, respectively) have similar lift coefficients, with highest values during post-stall. For , the extremely overtripped cases, (pink right triangles) and (orange diamonds) produce the lowest lift coefficients, compared to other disturbance heights. In between these curves lie the moderately overtripped configurations, (black circles) and (green gradient). The latter configuration has lift coefficients lower than the previous one. This concludes a clear negative correlation between roughness height and post-stall lift coefficient: with increasing roughness, stall is more abrupt and occurs at lower incidences. However, this trend reaches a saturation region. Although the increase in roughness height between the roughest configurations is disproportionately larger than for the rest, these cases have similar lift coefficients. The reason is that the roughness height reaches the boundary layer edge. In comparison, the estimated turbulent boundary layer thickness of a hydraulically rough flat plate at x = 0.01 m distance from the edge, at similar flow conditions is 0.4 mm [23]). Therefore, the disturbance at the leading edge reaches the accelerated outer flow, leading to premature separation, which does not shift with further increase.
The roughness effect on the pitching-moment coefficient is displayed in Figure 9b. The trend discussed in [14] is reproduced in the current study, supplemented by the larger roughness heights and angles of attack up to post-stall. The observation from the previous work is valid as well for the additional configurations, with and . For positive angles of attack up to , all pitching-moment curves coincide and have a linear development with . In the range , the pitching-moment slope becomes nonlinear and decreases continuously. The nonlinearity is associated with the leading-edge separation and vortex development, which is strongly dependent on the tripping method. In [14] the trip-dot case showed reproducible delayed separation at the leading edge due to the forced laminar-turbulent transition. In the current investigation as well, trip dots successfully delay leading-edge separation, thus, increasing the vortex lift aft of the relative moment reference point . As a result, the pitching moment coefficient decreases with respect to other cases. Without any forced boundary-layer tripping, leading-edge separation occurs at lower incidences generating a higher pitching moment than forced transition (red squares in Figure 9). A disturbance height increase (above ) promotes flow separation leading to a vortex upstream shift. In consequence, more vorticity is fed aft of . As a result, the pitching moment rises with the leading-edge roughness height.
At , however, the above discussed relationship between overtripped roughness height and the pitching moment loses its validity. The negative slope is the steepest for both roughest leading edges ( and ). These two cases reach the minimum pitching-moment coefficient of at . The other tripped cases have a slightly lower -minimum at , while the free-transition -gradient changes its sign at the highest angle of attack, . By increasing beyond , the pitching-moment rises again with a strong dependency on : increasing the tripping height causes steeper pitching-moment slopes and minimum pitching moment at lower angles of attack.
Equivalent to the pitching moment, the trend of the drag coefficient (see Figure 9c) can be roughly divided into three regions: the region with predominantly attached flow (), the vortex-development region () and the stall region (). Figure 9d shows a zoom-in part of the drag polar, where the roughness effect on the drag coefficient at low angles of attack is evidenced. Error bars for two configurations, clean and with trip dots, demonstrate that the difference in drag between tripping methods is greater than the measurement uncertainty. In the first region, drag is predominantly caused by wall friction. The clean configuration produces the lowest drag due to longest laminar region. Roughening the surface increases wall shear and, consequently, drag. In the second -region, vortex growth causes a lift-dependent drag increase. The configuration with trip dots has the largest region of attached flow around the leading edge, resulting in the highest leading-edge suction and the least drag. With increasing angle of attack, the blue curve diverges from the rest towards lower values caused by increasing thrust force at the leading edge. The curve corresponding to natural transition is closest to the next roughest grit strip, . Both cases have similar vortex position and strength, as seen in the spanwise load distribution of Figure 11. Consistent with the other global aerodynamic coefficients, increases with the roughness height. Maximum drag is reached for all configurations at slightly higher angles of attack than maximum lift. During stall, the leading-edge suction force decreases rapidly with increasing contributing to drag increase while lift values stagnate. As the vortex collapses over the wing and a constant pressure wake flow dominates, a further increase in angle of attack reduces both lift and drag coefficients, as the pressure rises on the suction side. The pitching moment has its extremum at higher angles of attack than the lift, as well. Under these conditions, the collapse of the vortex is responsible for the rise. This phenomenon shows a strong dependency on the tripping method. The post-stall curves of the coefficients and follow the same trend: While increasing the angle of attack, vortex collapse is promoted with increased leading-edge roughness heights, accelerating stall. At post-stall, the aerodynamic coefficients are stationary for leading-edge roughness heights above .
Figure 11 and Figure 12 compare pressure coefficient distributions for all investigated dimensionless roughness heights . At and , the primary vortex is developed over the entire measured wing portion (Figure 11). Only with trip dots, the flow is attached at . In the apex region, the flow is strongly dependent on the roughness height. As expected, the delayed separation around the wing with trip dots generates the most concentrated vortex. Its position is farthest outboard and generates the highest suction ( at ). Excluding the natural transition case, the vortex position and strength is correlated with the roughness height at the leading edge: increased disturbance height leads to a farther inboard vortex location and a larger vortex cross section. Both effects are caused by premature separation and a wider separated shear layer, that rolls up into the primary vortex. Downstream, spanwise pressure curves flatten and tend to converge. Thus, the flow field becomes less dependent on the leading-edge roughness height at sufficient downstream distance from the vortex breakdown location.
Figure 12 consolidates the roughness effect on the post-stall aerodynamic coefficients discussed above. At , the highest suction is present for the clean and trip-dot case explaining the increased and values. In addition, these cases have a distinct pressure coefficient distribution in the apex region (). Starting from the leading edge, the pressure increases inboards, after which it decreases mildly, reaching its negative peak in the symmetry plane. This suggests that reattachment is still present in this chord section. In contrast, the overtripped cases have a nearly constant pressure distribution in all measured crossflow planes, which is typical for stalled wings. The dead water region over the diamond wing can be well influenced by applying different roughness heights. At the leading edge, flow disturbances with amplitudes proportional to the applied roughness height are induced in the shear layer. By increasing the disturbance amplitude, the turbulent mixing is promoted in the shear layer. Therefore, the shear layer is expected to thicken with higher disturbances. The shear layer thickness influences the volume of the enclosed dead-water region and, therefore, the wake pressure. From a flight mechanics point of view, the roughness height increase accelerates the vortex collapse during stall, generating a steeper stall behaviour (see Figure 9).
3.5. Analysis of Transient Surface Pressure Coefficient
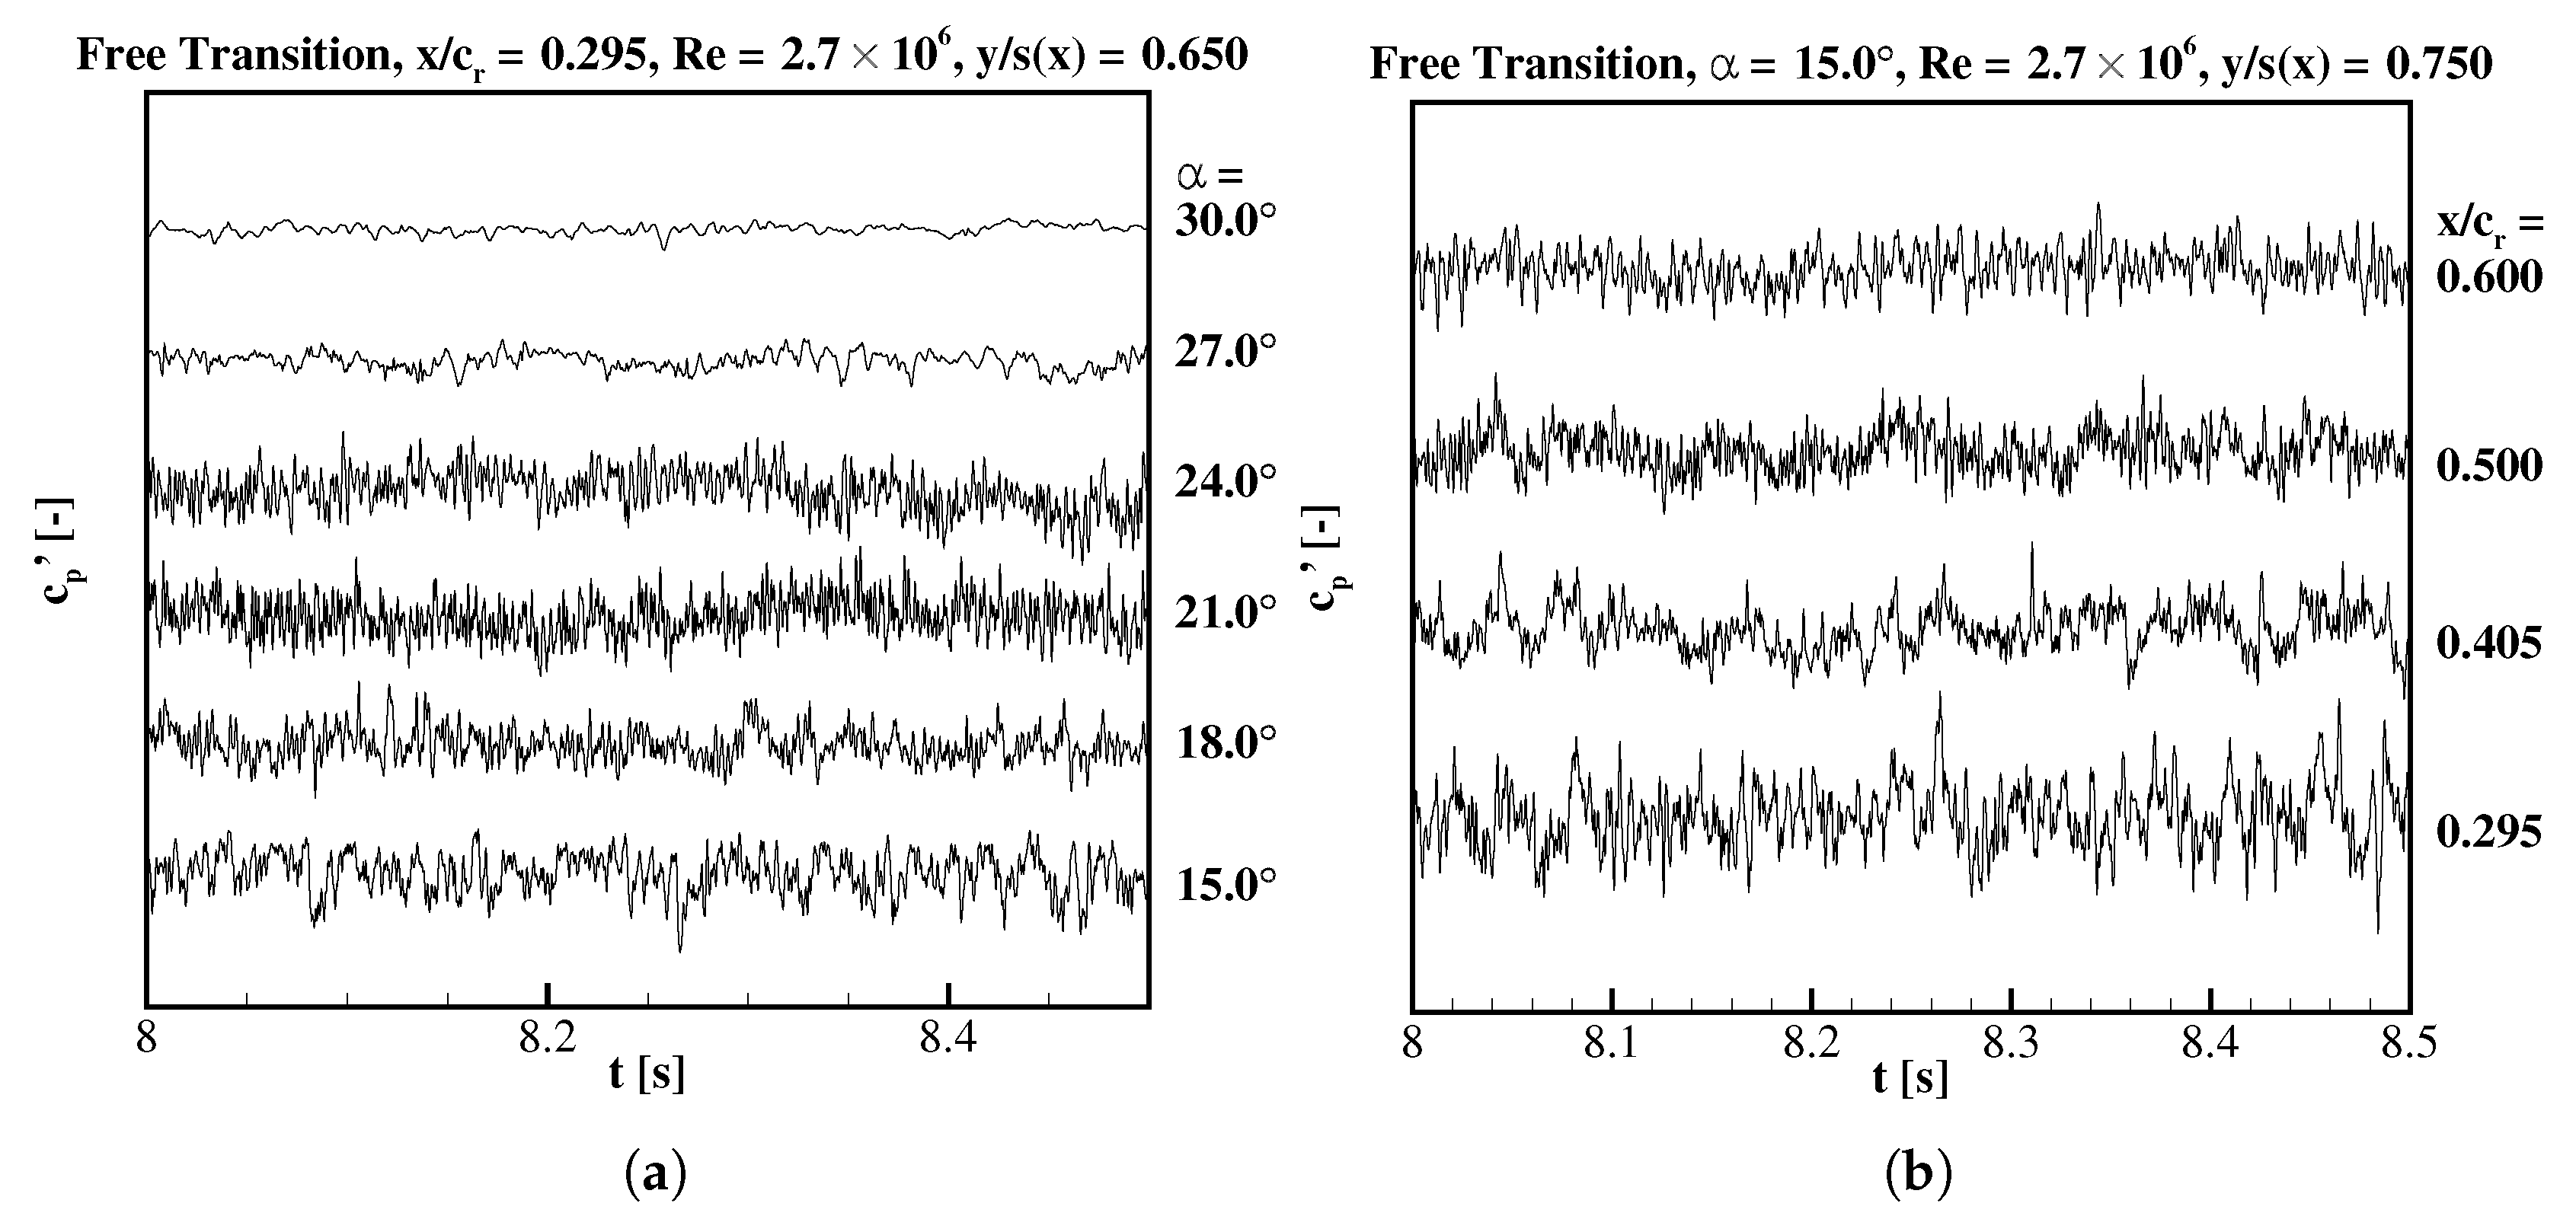
Time-dependent pressure coefficients have been determined at specific locations placed on the wing’s upper surface (see Section 2.3.3). The resulting time sequences of pressure coefficient fluctuations are shown e.g., in Figure 13. The corresponding mean values are already included in the pressure coefficient distribution of the previous subsections. The first graph (Figure 13a) represents the pressure signal measured by the most upstream, inboard sensor at different angles of attack, . The discussed case represents natural transition. At , the sensor is located at the inboard edge of the vortex (compare location in Figure 6). With increasing angle of attack, the vortex grows and its breakdown location shifts upstream. Hence, the recorded pressure signal changes accordingly. Amplitudes and high frequency oscillations are dampened with increasing angle of attack. In Figure 13b, a similar pattern is observed in the downstream signal evolution at . At the angle of attack of , the vortex is positioned above the outboard unsteady pressure sensors (compare Figure 11). Hence, the fluctuations underneath the primary vortex are displayed. In this graph, the signals are measured simultaneously, but no clear downstream correlation between signals can be determined. This indicates that the instabilities in the flow field are rather local and that there are no large flow structures, i.e., discrete vortices extending chord length downstream. The breakdown flow shows a more broadband turbulence pattern than for slender swept wings, as observed also by [8].
In Figure 14, transient pressure coefficients at are analysed statistically for all angles of attack. The time averaged pressure coefficient (empty circles) decreases linearly with the angle of attack (inverse y-axis), as long as the flow is attached. Separation occurs when the pressure slope changes sign twice. The following abrupt suction increase is generated by the increasing vortex strength. After minimum pressure is reached, a further increase in leads to a slow pressure rise, associated with vortex breakdown. A small plateau is present around stall, when vortex collapse is expected, followed by further pressure rise during post-stall.
The right ordinates in Figure 14 represent the rms value. At incidences with predominantly attached flow, , the fluctuations are very small, but rise rapidly as soon as separation occurs locally. This happens before the abrupt pressure decrease, meaning that the vortex is sensed first by increasing fluctuations and then by suction increase. The comparative graphs point out that the extremum precedes for all configurations. This indicates, that the source of unsteadiness is located around the vortex core, under which high suction is present. Hence, instabilities in the shear layer are majorly responsible for the pressure fluctuations, as observed also in [7,8].
While each average pressure coefficient curve has one peak, the rms value has for each presented configuration two, sometimes several, peaks. As the angle of attack increases, a sharp local peak is generally followed by a flat one that occurs at significantly higher angles of attack. The curve’s progression during increasing angle of attack is the effect of the vortex increase in strength and cross-section. The first peak of is measured, while the sensor is situated at the inboard edge of the pressure footprint of the vortex. The rms values decrease, reaching a local minimum, while the suction still rises. A further vortex expansion with angle of attack leads to slow decrease and a increase. The curves of Figure 14 are qualitatively similar downstream. The incipient separation moves upstream during increase. The mean pressure increases downstream and the pressure fluctuations decrease, as breakdown moves farther towards the apex. For all configurations, stall is detected by a kink in curves that occurs at similar angles of attack for all chordwise positions. The vortex collapse, occurring simultaneously above all measured chord sections, is expected under these freestream conditions.
As shown in the comparative graphs (Figure 14a–d), the roughness size has a noticeable effect on the vortex development. Underneath the unperturbed vortex (Figure 14a), the rms pressure coefficient has a similar distribution with angle of attack in all shown chord sections. The first peak is relatively sharp and the second one forms a plateau in the range of . The second graph (Figure 14b) shows the trip-dot configuration. For this case, separation is delayed the most, according to the linear curve region. Once separation occurs, pressure fluctuations rise rapidly with and reach the highest amplitudes compared to other configurations in all four sections. This suggests, that the highest vortex system unsteadiness is generated whit maximum vortex separation delay. In addition, the peak is sharp for the first two chordwise positions, while downstream the peak is barely noticeable. For the overtripped cases (Figure 14c,d), the fluctuations rise less abruptly and reach lower maximum values than for lower disturbance heights. For (Figure 14d), the first rms peak has the lowest value compared to other cases. The typical rms plateau, described above, does not change in value when the normalized disturbance height is increased from to . Hence, increased damping of surface pressure fluctuations is associated with leading-edge roughness size until saturation conditions are reached.
3.6. Spectral Analysis
In order to detect dominant frequencies that can be attributed to flow instabilities, the power spectral densities as a function of reduced frequency are presented in Figure 15 on a double logarithmic scale. The is computed by discrete Fourrier transformation of a complete measured signal of 80,000 samples without using a window function. In addition, band-averaging over 1024 bands is applied in the frequency domain. The reduced frequency k is the frequency f normalized by the mean aerodynamic chord length and the freestream velocity :
The displayed results were measured on the upper surface of the clean diamond wing model at , but represent well the qualitative progression of the power spectra for all investigated cases with respect to and sensor location ( and ).
Figure 15a includes the power spectrum of measured at and , for angles of attack ranging within . It represents the squared and normalized Fourier-transformed time signals of Figure 13a. At low angles of attack, the flow around the diamond wing is mainly attached and steady. The power spectrum has low values with no significant peak. While increasing the angle of attack, the vortex grows and moves upstream, approaching the sensor location. In the range of , the pressure fluctuations are rapidly amplified with increasing , still with no dominant peak in the spectral domain. At , a first dominant broadband frequency peak is detected. In contrast, vortex breakdown above slender delta wings typically exhibits one narrowband peak associated with the helical mode instability [24,25]. The breakdown of non-slender wings is more random, hence, flow structures of different scales are present. In this regard, the peak detection is more difficult. With further increase in angle of attack, the peak shifts to lower frequencies and a second broad band peak is measured at higher frequencies (). Prior to stall (), the higher frequency peak is barely measurable. At stall and post-stall the dominant peak shifts to lower frequencies and flattens until only anisotropic low energy turbulence is detected over the stalled wing.
As discussed previously, the induced pressure fluctuations on the wing surface depend mainly on the relative position between the sensor and the vortex breakdown. As the angle of attack increases, the vortex breakdown location shifts upstream and the breakdown flow expands, in consistency with the dominant frequency reduction. At a fixed angle of attack of , the signals of the four most aft positioned pressure transducers are transformed into the spectral domain and the resulting with respect to k are compared in Figure 15b. In this particular case, the breakdown region is dominated by broadband peaks. Two distinct peaks are detected at three sensor locations. At and , however, a plateau in a relative high frequency range of 3–6 is detected instead of two distinctive peaks. Consequently, the inboard breakdown flow region is dominated by two flow instabilities: shear-layer instability and vortex breakdown. In the most aft chord section, , the levels increase at a more inboard location. At the same time, both dominant peaks get farther apart in the frequency space: the first dominant frequency decreases, while the second increases slightly.
The approximate values of the dominant reduced frequency are plotted in Figure 16 as function of angle of attack. The first detected peak is designated with full symbols, while empty symbols represent the higher dominant reduced frequency . In addition, three roughness heights are compared at six sensor locations. The dashed lines represent the reduced frequencies of the helical mode instability, as deduced empirically in [25]:
The dimensionless helical mode frequency is dependent on the chordwise position x, angle of attack and leading-edge sweep angle , the latter being constant. As described above, the pressure fluctuations rise rapidly with the angle of attack and uniformly in the investigated spectrum. Depending on the configuration, first peaks are detected by the most aft, outboard sensor (, ) at . The dominant reduced frequencies decrease downstream, suggesting increasing wavelength with the vortex cross section. The increase in leads as well to decreasing dominant frequencies, as breakdown shifts upstream. The presence of two dominant peaks suggests that two distinct instabilities are present downstream of breakdown. The second dominant reduced frequency decreases at a higher rate with increasing . The graphs show that both dominant frequencies converge with increasing angle of attack, until only one peak is detected. The shear layer instabilities and fluctuations of the stationary discrete vortices have been identified as one important source of breakdown and unsteadiness for non-slender delta wings [8,9]. However, these investigations did not identify two spectral peaks. At sufficiently high angles of attack, the higher frequency instability dissipates or merges with the first instability that is detected up to . The first spectral peak takes values close to the helical mode frequency range, as reported also in [7]. However, the slope of the measured peaks is generally steeper than that of the calculated ones .
All three investigated configurations (natural, forced and overtripped boundary layer) have similar values in the --space. This indicates that the disturbances induced at the leading-edge separation does not affect the vortex system unsteadiness in the breakdown stage. The roughness height has a greater effect on the vortex separation onset location and the amplitudes of pressure fluctuations (as discussed above). However, distinct features can be extracted by comparing the dominant peaks of the configurations. The unsteady surface pressure has highest dominant frequencies for the fully turbulent case (blue triangles), especially in the outboard region. This is the effect of delayed vortex separation and a more concentrated, farther outboard vortex. Towards high incidences, the dominant frequencies for different configurations converge. The primary vortex of the natural and overtripped case is situated farther inboard, therefore, the sensors located at 0.65 relative local span detect dominant frequencies over a wider -range (compare left graphs with right graphs in Figure 16).
The unsteady pressure coefficients investigated in the spectral domain for a considerable parameter space reveals the unsteady character of the flow field in the post-breakdown region. The investigations identify the presence of two dominant broadband frequency peaks associated with two instabilities: shear-layer and breakdown instability. The vortex high-incidence dynamics is little affected by the leading-edge roughness height, which affects predominantly the separation onset location.
4. Conclusions
Global and local aerodynamic coefficients of the AVT-183 diamond wing are investigated in a wide angle of attack range. The influence of Reynolds number and leading-edge roughness height are assessed. Reynolds number variation in the range of has a rather small effect on the aerodynamic coefficients. At the highest Reynolds number, applying trip dots with a relative disturbance height of results in the most downstream separation onset. Mean pressure distributions show that increasing the roughness size shifts the vortex separation onset upstream. However, prior to stall, the global aerodynamic coefficients are less affected. The flow field during stall and post-stall, which is dominated by the vortex collapse, shows a clear correlation with the disturbance height: the stall phenomenon is more abrupt, when roughness height is increased. Above , an increase in roughness size produces no significant effect on the measured aerodynamic coefficients (, and ). These larger roughness heights extend above the local boundary layer thickness and manipulate the outer flow, inducing separation.
Surface pressure fluctuations have largest amplitudes, when breakdown occurs for the leading-edge vortex of highest strength. Adding roughness around the leading edge leads to premature separation and lower rms values of the surface pressure coefficient. In the breakdown flow field, spectral analysis reveals the existence of two dominant frequency ranges at moderate angles of attack. With increasing angle of attack, the dominant frequencies decrease. Around stall, only one spectral peak is detected. Its frequency is close to the helical mode frequency, typical for highly swept wings, but associates in the present case to unsteadiness generated by shear layer instabilities. The roughness size influences to a greater extent the vortex separation onset, but less the flow unsteadiness. Small but clear deviations are observed when the roughness size is increased: with trip dots, the frequencies are highest and increasing the grit size increases by a small amount the instability wave number. Around stall, the dominant frequencies are rather insensitive to the leading-edge roughness height and decrease with further angle of attack increase.
Author Contributions
F.K. and C.B. designed the experiments. L.D. and F.K. performed the experiments. A.B. and L.D. analysed the data. A.B. and C.B. wrote the paper.
Funding
This research was funded by the German Research Association grant number BR 1511/9-1.
Acknowledgments
The support of this investigation by the German Research Association (DFG, grant BR 1511/9-1) is gratefully acknowledged.
Conflicts of Interest
The authors declare no conflict of interest.
References
- Gursul, I. Unsteady aerodynamics of nonslender delta wings. Prog. Aerosp. Sci. 2005, 41, 515–557. [Google Scholar] [CrossRef] [Green Version]
- Luckring, J.M.; Boelens, O.J.; Breitsamter, C.; Hövelmann, A.; Knoth, F.; Malloy, D.J.; Deck, S. Objectives, approach, and scope for the AVT-183 diamond-wing investigations. Aerosp. Sci. Technol. 2016, 57, 2–17. [Google Scholar] [CrossRef]
- Gursul, I. Recent developments in delta wing aerodynamics. Aeronaut. J. 2004, 108, 437–452. [Google Scholar] [CrossRef]
- Earnshaw, P.B.; Lawford, J.A. Low-Speed Wind-Tunnel Experiments on a Series of Sharp-Edged Delta Wings; Technical Report 3424, Aeronautical Research Council. Reports and Memoranda; Ministry of Aviation, Royal Aircraft Establishment: London, UK, 1964.
- Wentz, W.; Kohlmann, D. Vortex breakdown on slender sharp-edged wings. J. Aircr. 1971, 8, 156–161. [Google Scholar] [CrossRef]
- Taylor, G.S.; Schnorbus, T.; Gursul, I. An investigation of vortex flows over low sweep delta wings. In Proceedings of the 33rd AIAA Fluid Dynamics Conference and Exhibit, Fluid Dynamics and Co-located Conferences (AIAA 2003-4021), Orlando, FL, USA, 23–26 June 2003. [Google Scholar] [CrossRef]
- Taylor, G.S.; Gursul, I. Buffeting flows over a low-sweep delta wing. AIAA J. 2004, 42, 1737–1745. [Google Scholar] [CrossRef]
- Gordnier, R.E.; Visbal, M.R. Compact difference scheme applied to simulation of low-sweep delta wing flow. AIAA J. 2005, 43, 1744–1752. [Google Scholar] [CrossRef]
- Yaniktepe, B.; Rockwell, D. Flow structure on a delta wing of low sweep angle. AIAA J. 2004, 42, 513–523. [Google Scholar] [CrossRef]
- Luckring, J.M. Reynolds number and leading-edge bluntness effect on a 65∘ delta wing. In Proceedings of the 40th AIAA Aerospace Sciences Meeting & Exhibit (AIAA-2002-0419), Reno, NV, USA, 4–17 January 2002. [Google Scholar] [CrossRef]
- Kulfan, R.M. Wing airfoil shape effects on the development of leading edge vortices. In Proceedings of the 5th AIAA Atmospheric Flight Mechanics Conference on Future Space Systems, Boulder, CO, USA, 6–8 August 1979. [Google Scholar] [CrossRef]
- Verhaagen, N. Effects of leading-edge radius on aerodynamic characteristics of 50∘ delta wings. In Proceedings of the 48th AIAA Aerospace Sciences Meeting Including the New Horizons Forum and Aerospace Exposition, Aerospace Sciences Meetings (AIAA 2010-323), Orlando, FL, USA, 4–7 January 2010. [Google Scholar] [CrossRef]
- Schütte, A. Numerical investigations of vortical flow on swept wings with round leading edges. J. Aircr. 2017, 54, 572–601. [Google Scholar] [CrossRef]
- Hövelmann, A.; Knoth, F.; Breitsamter, C. AVT-183 diamond wing flow field characteristics Part 1: Varying leading-edge roughness and the effects on flow separation onset. Aerosp. Sci. Technol. 2016, 57, 18–30. [Google Scholar] [CrossRef]
- Hövelmann, A.; Grawunder, M.; Buzica, A.; Breitsamter, C. AVT-183 diamond wing flow field characteristics Part 2: Experimental analysis of leading-edge vortex formation and progression. Aerosp. Sci. Technol. 2016, 57, 31–42. [Google Scholar] [CrossRef]
- Reasor, D.A., Jr.; Malloy, D.J.; Daniel, D.T. Applicability of hybrid RANS/LES models in predicting separation onset of the AVT-183 diamond wing. In Proceedings of the 53rd AIAA Aerospace Sciences Meeting, AIAA SciTech Forum (AIAA 2015-0287), Kissimmee, FL, USA, 5–9 January 2015. [Google Scholar] [CrossRef]
- Frink, N.T. Numerical analysis of incipient separation on 53∘ swept diamond wing. In Proceedings of the 53rd AIAA Aerospace Sciences Meeting, AIAA SciTech Forum, (AIAA 2015-0288), Kissimmee, FL, USA, 5–9 January 2015. [Google Scholar] [CrossRef]
- Edefur, H.; Tormalm, M.; Coppin, J.; Birch, T.; Nangia, R.K. Numerical study of blunt leading edge separation on a 53 degree swept diamond wing (STO AVT-183) using the Edge and Cobalt flow solvers. In Proceedings of the 53rd AIAA Aerospace Sciences Meeting, AIAA SciTech Forum, (AIAA 2015-0290), Kissimmee, FL, USA, 5–9 January 2015. [Google Scholar] [CrossRef]
- Hitzel, S.M.; Boelens, O.J.; Rooij, M.; Hövelmann, A. Vortex development on the AVT-183 diamond wing configuration—Numerical and experimental findings. Aerosp. Sci. Technol. 2016, 57, 90–102. [Google Scholar] [CrossRef]
- Luckring, J.M.; Boelens, O.J. A reduced-complexity investigation of blunt leading-edge separation motivated by UCAV aerodynamics. In Proceedings of the 53rd AIAA Aerospace Sciences Meeting, AIAA SciTech Forum, (AIAA-2015-0061), Kissimmee, FL, USA, 5–9 January 2015. [Google Scholar] [CrossRef]
- Breitsamter, C. Strömungsphysik und Modellgesetze; Lect. Notes; Technical University of Munich: Munich, Germany, 2012. [Google Scholar]
- Luckring, J.M. A survey of factors affecting blunt leading-edge separation for swept and semi-slender wings. In Proceedings of the 28th AIAA Applied Aerodynamics Conference (AIAA 2010-4820), Chicago, IL, USA, 28 June–1 July 2010. [Google Scholar] [CrossRef]
- Schlichting, H.; Gersten, K. Boundary-Layer Theory, 9th ed.; Springer: Berlin/Heidelberg, Germany, 2017. [Google Scholar]
- Gursul, I. Unsteady flow phenomena over delta wings at high angle of attack. AIAA J. 1994, 32, 225–231. [Google Scholar] [CrossRef]
- Breitsamter, C. Unsteady flow phenomena associated with leading-edge vortices. Prog. Aerosp. Sci. 2008, 44, 48–65. [Google Scholar] [CrossRef]
Figure 1.
AVT-183 diamond wing model: (a) mounted in the test section and (b) draft.

Figure 2.
Geometric parameters of the applied trip strips. (a) Trip dot type, overview; (b) Trip dot type, leading-edge sectional view; (c) Carborundum grit type, overview; (d) Carborundum grit type, leading-edge sectional view.
Figure 2.
Geometric parameters of the applied trip strips. (a) Trip dot type, overview; (b) Trip dot type, leading-edge sectional view; (c) Carborundum grit type, overview; (d) Carborundum grit type, leading-edge sectional view.

Figure 3.
Applied trip strips. (a) Trip dots, ( = 0.15 mm); (b) Carborundum grit, ( = 0.20 mm); (c) Carborundum grit, ( = 0.55 mm).
Figure 3.
Applied trip strips. (a) Trip dots, ( = 0.15 mm); (b) Carborundum grit, ( = 0.20 mm); (c) Carborundum grit, ( = 0.55 mm).

Figure 4.
Additional very rough carborundum grits. (a) ( = 1 mm); (b) ( = 2 mm).

Figure 5.
Nondimensional vorticity distribution in chord sections at and . (a) Free Transition, ; (b) Trip Dots, ; (c) Trip Strip, .
Figure 5.
Nondimensional vorticity distribution in chord sections at and . (a) Free Transition, ; (b) Trip Dots, ; (c) Trip Strip, .

Figure 6.
Spanwise distribution of the pressure coefficient as function of angle of attack , at and , for free transition conditions; arrows towards increasing .
Figure 6.
Spanwise distribution of the pressure coefficient as function of angle of attack , at and , for free transition conditions; arrows towards increasing .

Figure 7.
Lift coefficient as function of angle of attack and Reynolds number. (a) Free Transition; (b) Detail view at post-stall for different disturbance heights.
Figure 7.
Lift coefficient as function of angle of attack and Reynolds number. (a) Free Transition; (b) Detail view at post-stall for different disturbance heights.

Figure 8.
Reynolds number effect on the pitching-moment coefficient as function of angle of attack—case with trip dots .
Figure 8.
Reynolds number effect on the pitching-moment coefficient as function of angle of attack—case with trip dots .

Figure 9.
Aerodynamic coefficients of the longitudinal motion as function of angle of attack and roughness height.
Figure 9.
Aerodynamic coefficients of the longitudinal motion as function of angle of attack and roughness height.

Figure 10.
Reynolds number effect on the spanwise mean pressure coefficient distribution at —case with trip dots .
Figure 10.
Reynolds number effect on the spanwise mean pressure coefficient distribution at —case with trip dots .

Figure 11.
Leading-edge roughness effect on the spanwise mean surface pressure distribution, at and .
Figure 11.
Leading-edge roughness effect on the spanwise mean surface pressure distribution, at and .

Figure 12.
Leading-edge roughness effect on the spanwise mean surface pressure distribution in the apex region ( and 0.2), at and .
Figure 12.
Leading-edge roughness effect on the spanwise mean surface pressure distribution in the apex region ( and 0.2), at and .

Figure 13.
Pressure coefficient time sequences for the free transition case measured at (a) , with increasing angle of attack, ; and at (b) four different chordwise locations, , , at an incidence of ; .
Figure 13.
Pressure coefficient time sequences for the free transition case measured at (a) , with increasing angle of attack, ; and at (b) four different chordwise locations, , , at an incidence of ; .

Figure 14.
Time averaged and rms values of the pressure coefficient (circles and full squares, respectively) measured at local span as function of angle of attack and local chordwise position . Leading-edge roughness heights: (a) ; (b) ; (c) ; (d) .
Figure 14.
Time averaged and rms values of the pressure coefficient (circles and full squares, respectively) measured at local span as function of angle of attack and local chordwise position . Leading-edge roughness heights: (a) ; (b) ; (c) ; (d) .

Figure 15.
Power spectral density () of the pressure fluctuations as function of reduced frequency k, at . (a) Angle of attack variation; (b) Position variation at .
Figure 15.
Power spectral density () of the pressure fluctuations as function of reduced frequency k, at . (a) Angle of attack variation; (b) Position variation at .

Figure 16.
Dominant peaks (first peak with full symbols, second one with empty symbols) measured at six sensor locations as function of angle of attack for three cases: free transition case (red squares), case with trip dots (blue triangles) and overtripped case (orange diamonds). Dashed curves follow the maximum and minimum empirical helical mode frequency typical for slender delta wings [25].


Table 1.
Wing planform parameters.
| (-) | (m) | s (m) | (m) | (m) | (m) | (m) | ||
|---|---|---|---|---|---|---|---|---|
| 2.191 | 53.0 | −26.5 | 1.200 | 0.657 | 0.491 | 0.800 | 0.394 | 0.090 |
Table 2.
Chordwise sections for particle-image-velocimetry (PIV).
| Section | 1 | 2 | 3 | 4 | 5 | 6 | 7 | 8 | 9 | 10 | 11 | 12 | 13 |
|---|---|---|---|---|---|---|---|---|---|---|---|---|---|
| (-) | 0.100 | 150 | 0.200 | 250 | 0.295 | 0.305 | 350 | 0.395 | 0.405 | 0.450 | 0.500 | 0.550 | 0.600 |
| x (m) | 0.120 | 0.180 | 0.240 | 0.300 | 0.354 | 0.366 | 0.420 | 0.474 | 0.486 | 0.540 | 0.600 | 0.660 | 0.720 |
| (m) | 0.090 | 0.136 | 0.181 | 0.226 | 0.267 | 0.276 | 0.317 | 0.357 | 0.366 | 0.407 | 0.452 | 0.498 | 0.543 |
Table 3.
Chordwise sections for surface pressure measurements.
| Section | 1 | 2 | 3 | 4 | 5 | 6 | 7 | 8 |
|---|---|---|---|---|---|---|---|---|
| (-) | 0.100 | 0.200 | 0.295 | 0.305 | 0.395 | 0.405 | 0.500 | 0.600 |
Table 4.
Test conditions.
Table 5.
Geometrical parameters of applied trip strips.
| Trip Strip | Height of Adhesive | Roughness Height | Total Disturbance Height | Relative Disturbance Height |
|---|---|---|---|---|
| (mm) | (mm) | (mm) | ||
| Trip dots | - | 0.15 | 0.15 | 0.019 |
| Carborundum grit | 0.12 | 0.08 | 0.20 | 0.025 |
| Carborundum grit | - | 0.55 | 0.55 | 0.069 |
| Carborundum grit | 0.12 | 0.88 | 1.00 | 0.125 |
| Carborundum grit | 0.12 | 1.88 | 2.00 | 0.250 |
© 2018 by the authors. Licensee MDPI, Basel, Switzerland. This article is an open access article distributed under the terms and conditions of the Creative Commons Attribution (CC BY) license (http://creativecommons.org/licenses/by/4.0/).
Share and Cite
MDPI and ACS Style
Buzica, A.; Debschütz, L.; Knoth, F.; Breitsamter, C. Leading-Edge Roughness Affecting Diamond-Wing Aerodynamic Characteristics. Aerospace 2018, 5, 98. https://doi.org/10.3390/aerospace5030098
AMA Style
Buzica A, Debschütz L, Knoth F, Breitsamter C. Leading-Edge Roughness Affecting Diamond-Wing Aerodynamic Characteristics. Aerospace. 2018; 5(3):98. https://doi.org/10.3390/aerospace5030098
Chicago/Turabian StyleBuzica, Andrei, Lisa Debschütz, Florian Knoth, and Christian Breitsamter. 2018. "Leading-Edge Roughness Affecting Diamond-Wing Aerodynamic Characteristics" Aerospace 5, no. 3: 98. https://doi.org/10.3390/aerospace5030098
Note that from the first issue of 2016, this journal uses article numbers instead of page numbers. See further details here.