Abstract
This is the second of a two-paper series describing a multi-scale modeling approach developed to simulate crack sensing in polymer fibrous composites by exploiting interruption of electrically conductive carbon nanotube (CNT) networks. The approach is based on the finite element (FE) method. Numerical models at three different scales, namely the micro-scale, the meso-scale and the macro-scale, have been developed using the ANSYS APDL environment. In the present paper, the meso- and macro-scale analyses are described. In the meso-scale, a two-dimensional model of the CNT/polymer matrix reinforced by carbon fibers is used to develop a crack sensing methodology from a parametric study which relates the crack position and length with the reduction of current flow. In the meso-model, the effective electrical conductivity of the CNT/polymer computed from the micro-scale is used as input. In the macro-scale, the final implementation of the crack sensing methodology is performed on a CNT/polymer/carbon fiber composite volume using as input the electrical response of the cracked CNT/polymer derived at the micro-scale and the crack sensing methodology. Analyses have been performed for cracks of two different lengths. In both cases, the numerical model predicts with good accuracy both the length and position of the crack. These results highlight the prospect of conductive CNT networks to be used as a localized structural health monitoring technique.
1. Introduction
Structural Health Monitoring (SHM) aims to provide at every moment during the life of a structure, a diagnosis of the “integrity” of the materials, of the different structural parts, and of the entire structure. Based on Reference [1], an effective SHM system aims to minimize the time required for ground inspections, to increase the operation time of the aircraft and to reduce the maintenance cost by more than 30%. These advantages represent a major contribution towards a greener aviation. SHM has two modules, i.e., the diagnosis and prognosis. The diagnosis module is based on a monitoring system, which usually consists of a network of sensors distributed over a relatively large area of the structure. However, with such a monitoring system only major damage events can be detected. The current trend is the development of dense wireless networks of very small sensors. Moreover, multifunctional materials for SHM have gained attention due to their ability to sense, actuate and harvest energy from ambient vibrations.
Carbon nanotubes (CNTs) are used as nanofillers to produce multifunctional polymers (nanocomposites) and fiber composites due to their extraordinary mechanical [2,3,4,5,6,7], thermal [8] and electrical properties [2,7,9] combined to their 1D structure. Amongst the targeted functionalities of the CNT-based materials is strain and damage sensing. Damage sensing in fiber composites by conductive CNT networks has been initially studied by Fiedler et al. [10]. Since then, numerous works, mainly experimental (e.g., References [11,12,13,14,15]), have been performed. On the contrary, there have been reported only a few models of damage sensing by CNT networks. The most representative of them are those of References [13] and References [14]. In [13], the authors modeled damage sensing in [0/90]s cross-ply glass fiber composites using embedded CNT networks. The contact resistances of the CNTs were modeled using the electrical tunneling effect and the effective electrical resistance of the percolating CNT network was calculated by considering nanotube matrix resistors and employing the FE method for electrical circuits. The loading process of the composite, from initial loading to final failure, was simulated also by the FE method. The deformation and damage induced resistance change was identified at each loading step. The numerical results show that the model captures the essential parameters influencing the electrical resistance of the CNT networks. The authors did not carry out any parametric study. In [14], the authors presented an analytical model of the strain sensing behavior of CNT-based nanocomposites. The model incorporated the electrical tunneling effect due to the matrix material between the CNTs to describe the electrical resistance variation due to mechanical deformation. The model simulates the inter-nanotube matrix deformation at the micro/nanoscale due to the macroscale deformation of the nanocomposites. A comparison of the analytical predictions with the experimental data showed that the proposed model simulates the sensing behavior efficiently.
Based on the above overview, we can summarize that the understanding of the key factors governing strain and damage identification mechanisms of nanocomposites through localized variations of the electrical conductivity in the absence of mechanical loads has been mainly attempted experimentally. However, in the design of such SHM systems, simulation-driven design tools could be very useful as they could to the reduction of development cost and time. Within this framework, in the present paper, proposed is a multi-scale FE-based modeling approach for simulating the basic mechanisms of crack sensing by conductive CNT networks in nanocomposites and fibrous composites. The description of the modeling approach is done in two papers. The first paper [15] describes the micro-scale model while the present paper (second paper) describes the development of a crack sensing methodology by means of a meso-scale model, a parametric study and the final implementation of the crack sensing methodology.
2. Meso-Scale Model
2.1. Geometry and FE Model
In the meso-scale, a 2D model of a CNT/polymer reinforced by carbon fibers has been developed. The modeled area is a transverse section of size of 0.2 mm × 0.2 mm containing 400 carbon fibers (circular cross-sections). The fibers are placed in a square configuration, but they are not equally spaced and do not have the same diameter. The model was structured in line with electron microscopy images of unidirectional carbon fiber reinforced plastic (UD CFRP) cross sections which show a random positioning and diameter of carbon fibers. In the process of developing a realistic approach, this observation is incorporated as a geometrical variation. The model describes a quadratic distribution and is divided in square fiber-polymer sections of size of 10 μm × 10 μm. In each sector, the fibers’ diameter varies according to , thus a unique value inside this interval is assigned iteratively. Simultaneously, there is shift of the fiber center from the center of the section in the x and y axes given by and where s is the section’s size and D is the diameter value at the given iteration. The variation quantities are arbitrary with respect to the physical mechanisms though they were chosen based on the requirement of the minimum mesh distortion.
The aim of this analysis is to develop a crack sensing methodology through the parametric correlation of current drop with the characteristics of the crack (length and position). The analysis is based on the simplicity of the implementation of the direct current (DC) for measuring the variation of resistance in conductive composites (e.g., the four-probe method e.g., Reference [11]) and the through-the-thickness measurement of resistance in thin-walled structures with a known transverse conductivity. Both the fibers and the matrix are modeled using the 2D 8-node ANSYS PLANE223 triangular elements [16]. The 3-node option of the elements has been used as it was found that it reduces significantly the computational effort without compromising considerably the accuracy of the results. PLANE223 has many capabilities including structural-thermal and thermal-electric capabilities. The element input data includes eight nodes and structural, thermal, and electrical material properties. The FE mesh of the meso-scale model is shown in Figure 1.
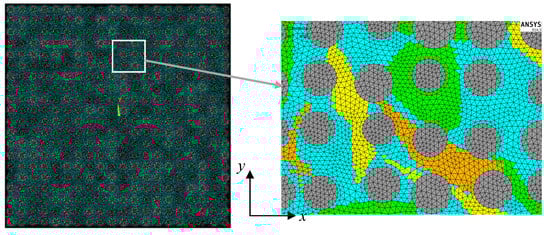
Figure 1.
FE mesh of the meso-scale model. The different colors in the elements of the matrix indicate areas with different effective electrical conductivity due to the various density of the CNT network that comes from the micro-scale.
For the transition to the meso-scale, we consider electrically homogeneous matrix and a full bonding between the fibers and the matrix. The transition from micro-scale to meso-scale is achieved through the definition of discrete electrical conductivity regions using the values computed in the validation process of the micro-scale model as demonstrated in the first part [15] for the 5 volume fractions above the percolation threshold. The regions were distributed randomly utilizing APDL algorithm to alter element properties and this was done to reproduce the inhomogeneity of network density.
2.2. Imposed Electric Field
Charging has been applied to the model using a series of circuit ANSYS CIRCU124 elements [16] placed at the top nodes. These are 2-node circuit elements with a constant resistance which are not affected by geometrical factors. The contact with the upper end of the model is utilized using common nodes. A circuit element was placed at each node of the plane elements. A voltage V0 is applied to the free node of the circuit element while the lower nodes of the model are grounded. A benefit from the use of circuit elements is the direct computation of reaction currents without the need for gathering and processing data from the interior of the model. It is noted that parasitic capacitance could occur given the miniscule distances between the resistors of the meso-scale model. However, the aim of modelling this arrangement in this scale is to bridge the microstructural electrical behavior with the macro-scale response from a resistor response standpoint. In a hypothetical implementation, the density of a resistor arrangement on a surface determines the resolution of measurement. The normalized quantities of drop and span can be used to roughly characterize discontinuities of larger scales through proportional considerations. Moreover, the use of resistor elements constitutes a modelling approach of a simplistic arrangement from which we can derive information externally from the holistic response of the model. Moreover, the data acquisition is rendered easier.
The sketch in Figure 2 describes the simple electric circuit of the meso-scale model. The reaction current iR is simply derived from Ohm’s law as
where V0 is the voltage and R0 and Rp are the resistances. In the present application, R0 is the resistance of the circuit element while Rp is the resistance of the model (material). Furthermore, the parallel network of the circuit elements provides information about the location of the current drop.
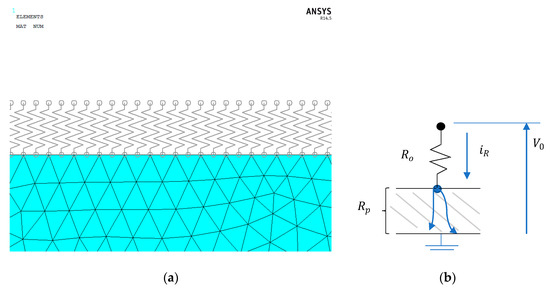
Figure 2.
(a) Part of the FE mesh of the meso-scale model showing the connection of the circuit elements with the nodes of the nanocomposite and (b) sketch of the electric circuit of the meso-scale model.
2.3. Crack Sensing Methodology
The proposed crack sensing methodology is based on the parameterization of the measurements derived for different crack lengths and crack distance from the measurement points (crack depth). It is assumed that the crack is single, continuous and parallel to the x axis. Inclined cracks might be also considered by using the effective length, which is projection of the inclined crack to the x direction. The crack is introduced in the mesh by releasing nodes as it was done in the micro-scale model.
For each crack case, we derive through repetitive analyses the reaction currents at the circuit elements (i is the number of circuit element, l is the crack length and d is the crack depth. For a constant depth, we derive the reaction current for different crack lengths and we compare the values with the reference value of the uncracked material ). This way, we evaluate the effect of crack length on the current drop for each circuit through the current drop parameter given by
Figure 3 shows a typical computed distribution of current drop around the crack zone. It is observed that outside the crack zone the reaction current increases (negative ) due to the redistribution of current flow in the area around the crack. As shown, the maximum current drop occurs at the centroid of the crack. Using the electrical response of the reference material we define in the diagram the maximum current drop value (drop) and the difference between the maximum and minimum current drops (span). The latter was used to quantify the inhomogeneity of the electrical response, i.e., whether a sudden or a smooth increase takes place. For the difference between the maximum and minimum current drops to be generalized, span is normalized over the maximum current drop value. Based on the above, we have
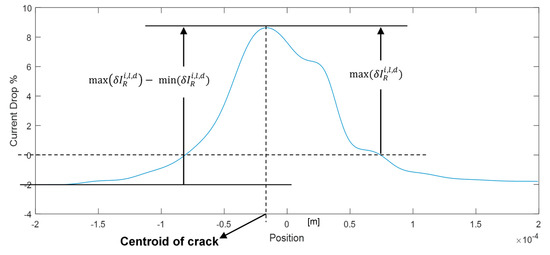
Figure 3.
An example of the electrical response curve in the area around the crack.
A parametric study has been performed to correlate the different crack scenarios with the measured values of the drop and span values and develop corresponding functions. By cross-checking the drop and span values for every circuit element, the maximum values are located. Then, 2D plots of the maximum values with regards to the normalized crack length and normalized crack depth are created and every surface is fitted with a two-variable function. The outcome of this process, when compared to the outcome of the reference material can give an estimation about the size and location of the crack. Graphically, this can be implemented by using the cross-section of the curves derived from the cross-section of the drop and span surface plots as will be shown in Section 4.1.
3. Macro-Scale Model
3.1. Geometry and FE Modeling
In the macro-scale, a CNT/polymer/carbon fibers composite volume of dimensions of 10 mm × 10 mm × 2.5 mm has been modeled. The volume has been meshed with 20-node SOLID131 elements [16]. The mesh density is selected such as each element to have the dimensions of the micro-model. The FE mesh of the macro-model is shown in Figure 4. As in the mesoscale, the 5 volume fraction values used in the validation graph [15] are used as input in the full fiber-CNT-polymer microscale model and the 5 effective electrical conductivities are computed. These values are assigned randomly as the transverse electrical conductivity property of each macro-scale element using APDL code. Similarly, thee electrical conductivity of the solid elements in the fiber direction has been computed using the rule of mixtures
in which the electrical conductivity of the matrix σm is either one of the 5 values in the validation graph chosen randomly by the code. In Equation (5), is the conductivity of the fibers and is the conductivity of the matrix. The parameter of 0.55 corresponds to the fiber volume fraction (55%) and the 0.45 to the matrix volume fraction (%). Again, this approach aims in the numerical reproduction of the network density inhomogeneity.
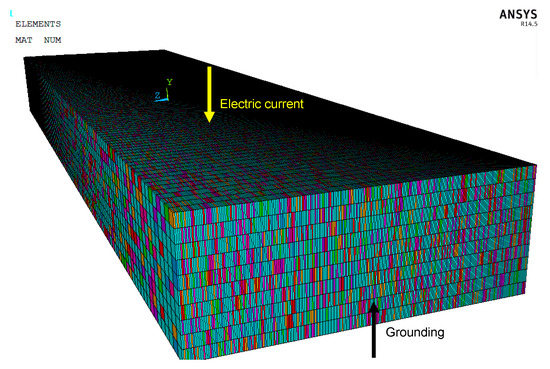
Figure 4.
FE mesh of the macro-scale model.
3.2. Introduction of a Virtual Crack, Charging and Computations
As for the meso-scale model, charging has been applied to the macro-scale model using circuit elements CIRCUIT124 [16] which are placed on the nodes of the top XY surface while the nodes of the bottom surface are grounded. Crack growth in the composite volume has been simulated by applying the corresponding drop of effective conductivity at the elements of crack path using the micro-scale analysis results on the variation of with regards to crack length. Computations have been performed by gathering the values of the current from the circuit elements and comparing them with the corresponding values of the reference model. Then, the differences are qualified on the plane, thus producing a graphical representation for the location and magnitude of the current drop at the XY plane. In order to validate the meso-scale model, results from the macro-scale for a known crack have been used.
4. Numerical Results
4.1. Meso-Scale: Effect of Crack Presence
In the meso-scale, the electrical response of models with 39 different crack lengths and 9 different depths (from −0.1 to −0.9) has been simulated. The crack length and depth are normalized with regards to the dimension of the Representative Volume Element (RVE) [15], . The input parameters and material properties of the meso-scale model are listed in Table 1. Note that the resistance of the circuit elements does not affect the results.

Table 1.
Input parameters and materials properties in the meso-scale model.
The predicted drop and span values for the different and ratios have been listed in tables. Table 2 lists the results for the case of . The other tables are omitted for the sake of briefness. To visualize the data, 3D plots have been created from tabular data in the MATLAB software using fitting functions. Figure 5 shows the 3D plot of drop vs. and for the case of maximum drop while Figure 6 shows the 3D plot of span vs. and for the case of maximum span. We observe a decrease in the sensitivity of the response with increasing the depth ratio , which means that the deeper the crack is the less sensitive the method becomes.
Table 2.
Drop and span values vs. length ratio, and depth ratio .
Figure 5.
Fitted 3D plot of the drop function with regards to length ratio and depth ratio .
Figure 6.
Fitted 3D plot of the span function with regards to length ratio and depth ratio .
The opposite procedure, i.e., the characterization of a cracked model, lies in the determination of crack length and position using the tabular data or the graphs. To demonstrate the process, we select random values of drop and span, for instance, drop = 6.2% and span = 1.18%, and from the graphs of Figure 7 and Figure 8 using intersection lines we gather all sets of the and ratios which have given the selected values. The outcome of this first step are projection-curves (see Figure 7 and Figure 8). Then, we plot the two lines in a vs. system (Figure 9) and we find their intersections. The intersection points give sets of and ratios which lead to the selected drop and span values. Since the intersections are more than one, this means we have more than one sets of drop and span values that lead to the same electrical result. The selection of a unique solution requires more data. Nevertheless if we use the solution with the maximum ratio, i.e., and , we get a crack length of and a depth of .
Figure 7.
Intersection curve for drop = 6.2%.
Figure 8.
Intersection curve for span = 1.18%.
Figure 9.
Intersection curves for drop = 6.2% and span = 1.18%.
4.2. Macro-Scale: Crack Detection
The input parameters and material properties of the macro-scale model are listed in Table 3. In the macro-scale, we examine the model’s capability of detecting a crack in the ZY plane introduced through the reduction of the element’s electrical conductivity derived from the micro-scale analysis [14]. Two cracks (crack1 and crack2) of different length have been modeled at the same location; their characteristics are listed in Table 4.
Table 3.
Input parameters and materials properties in the macro-scale model.
Table 4.
The characteristics of the cracks modeled.
By comparing the current values taken from the circuit elements for the reference and the cracked model, we plot the results at the XZ plane in Figure 10. The obtained inhomogeneity of the current distribution is due to the inhomogeneous electrical properties of the model’s elements.
Figure 10.
2D plot of the drop at the XZ plane for crack1 (50 μm).
The computed contours of drop at the Y direction due to the presence of crack1 and crack2 are plotted on the XZ plane in Figure 10 and Figure 11, respectively. The results have been normalized by the current of the reference model. As shown, in both cases the location of the current drop at the Y direction matches the location of the crack. For crack1, given the crack spans through the width of the modified element, the ratio of the crack surface to the XZ surface of the model is . Hence, the response is quite large compared to the modeled crack length. The reason for choosing the width of 0.2 mm (20% of the model’s width) is because the meso-scale analyses have shown that smaller crack widths give very weak responses. In the case of crack2, the magnitude of electrical response increases by 643.3% for a 100% increase in crack length from 50 μm to 100 μm. This finding is an indication of the high sensitivity of the model to the crack length.
Figure 11.
2D plot of the drop at the XZ plane for crack1 (100 μm).
To further exploit the above findings, we note that the same technique does not have the same sensitivity in metallic materials since in that case the electric current from the cracked area is redistributed to the remaining material volume and the drop is not detectable. On the contrary, due to the very small volume of the CNT network compared to the volume of the composite material, any interruption of the network, which leads to the redistribution of electric current, is detectable.
Aiming to characterize crack1, we use the technique described in the previous section. Based on the computed values of drop and span, we delimit the area around the crack until the nodes where the electrical response is fully recovered (zero value). The dimension of the perturbation area is defined as the dimension in the direction of the denser mesh (Z direction). For crack1, we define an area of dimension of 250 μm and for this area we read drop = 3% and span = 1.1 (see Figure 3). The intersection of the drop and span intersection-curves shown in Figure 12 gives = 2.1, a crack length of 52.5 μm and = −1.88. The characterized values of crack length and crack depth are close to the actual values, something which validates the proposed crack sensing methodology.
Figure 12.
Intersection curves for drop = 3% and span = 1.1.
5. Conclusions
This is the second of a two-paper series describing a multi-scale modeling approach developed to simulate crack sensing in polymer fibrous composites by exploiting interruption of electrically conductive carbon nanotube (CNT) networks. In the present paper, the meso- and macro-scale analyses has been described. In the meso-scale, a crack sensing methodology has been developed by means of a parametric study which correlates the crack characteristics with the current drop characteristics. In the macro-scale, the final implementation of the crack sensing methodology has been made for cracks of different lengths. The numerical results show a large sensitivity of the current flow to the crack length. Moreover, the model has been proved capable of predicting both the length and the position of the cracks considered.
Based on the findings of the two papers, we can conclude that the proposed multi-scale electrical modeling approach is capable of simulating the electrical response of CNT/polymers and CNT/composites. The model in combination with the crack sensing methodology is also capable of characterizing cracks in these materials. The proposed modeling approach after being improved could be used for the virtual design and optimization of structural health monitoring systems based on conductive CNT networks in polymers, epoxy adhesives, and polymer fibrous composites.
Author Contributions
Conceptualization, K.T. and C.K.; methodology, K.T. and C.K.; software, C.K.; validation, K.T.; investigation, K.T. and C.K.; writing—original draft preparation, K.T. and C.K.; writing—review and editing, K.T.; supervision, K.T.; project administration, K.T.; funding acquisition, K.T.
Funding
Part of the work reported in this paper has received funding from the European Union’s Horizon 2020 research and innovation programme ECO-COMPASS (Grant no. 690638).
Conflicts of Interest
The authors declare no conflict of interest.
References
- Boller, C. Why SHM? A Motivation. In NATO Lecture Series STO-MP-AVT-220 Structural Health Monitoring of Military Vehicles: STO Educational Notes; NATO STO: Brussels, Belgium, 2014. [Google Scholar]
- Duong, H.M.; Gong, F.; Liu, P.; Tran, T.Q. Advanced Fabrication and Properties of Aligned Carbon Nanotube Composites: Experiments and Modeling. Available online: https://www.intechopen.com/books/carbon-nanotubes-current-progress-of-their-polymer-composites/advanced-fabrication-and-properties-of-aligned-carbon-nanotube-composites-experiments-and-modeling (accessed on 5 October 2017).
- Tran, T.Q.; Headrick, R.J.; Bengio, E.A.; Myo Myint, S.; Khoshnevis, H.; Jamali, V.; Duong, H.M.; Pasquali, M. Purification and Dissolution of Carbon Nanotube Fibers Spun from the Floating Catalyst Method. Appl. Mater. Interfaces 2017, 9, 37112–37119. [Google Scholar] [CrossRef] [PubMed]
- Tserpes, K.I.; Papanikos, P. Finite element modeling of single-walled carbon nanotubes. Compos. Part B 2005, 36, 468–477. [Google Scholar] [CrossRef]
- Papanikos, P.; Nikolopoulos, D.D.; Tserpes, K.I. Equivalent beams for carbon nanotubes. Comput. Mater. Sci. 2008, 43, 345–352. [Google Scholar] [CrossRef]
- Tserpes, K.I.; Papanikos, P.; Tsirkas, S.A. A progressive fracture model for carbon nanotubes. Compos. Part. B 2006, 37, 662–669. [Google Scholar] [CrossRef]
- Tserpes, K.I.; Papanikos, P. The effect of Stone-Wales defect on the tensile behavior and fracture of single-walled carbon nanotubes. Compos. Struct. 2007, 79, 581–589. [Google Scholar] [CrossRef]
- Kim, P.; Shi, L.; Majumdar, A.; Mc Euen, P.L. Thermal transport measurements of individual multiwalled nanotube. Phys. Rev. Lett. 2001, 87, 215502. [Google Scholar] [CrossRef] [PubMed]
- Ebbesen, T.W.; Lezec, H.J.; Hiura, H.; Bennett, J.W.; Ghaemi, H.F.; Thio, T. Electrical conductivity of individual carbon nanotubes. Nature 1996, 382, 54–56. [Google Scholar] [CrossRef]
- Fiedler, B.; Gojny, F.H.; Wichmann, M.H.G.; Bauhofer, W.; Karl, S. Can carbon nanotubes be used to sense damage in composites? Eur. J. Control. 2004, 29, 81–94. [Google Scholar] [CrossRef]
- Gallo, G.J.; Thostenson, E.T. Electrical characterization and modeling of carbon nanotube and carbon fiber self-sensing composites for enhanced sensing of microcracks. Mater. Today Commun. 2015, 3, 17–26. [Google Scholar] [CrossRef]
- Aly, Κ.; Li, A.; Bradford, P.D. Strain sensing in composites using aligned carbon nanotube sheets embedded in the interlaminar region. Compos. Part. A 2016, 90, 536–548. [Google Scholar] [CrossRef]
- Li, C.; Chou, T.W. Modeling of damage sensing in fiber composites using carbon nanotube networks. Compos. Sci. Technol. 2008, 68, 3373–3379. [Google Scholar] [CrossRef]
- Kuronuma, Y.; Takeda, T.; Shindo, Y.; Narita, F.; Wei, Z. Electrical resistance-based strain sensing in carbon nanotube/polymer composites under tension: Analytical modeling and experiments. Compos. Sci. Technol. 2012, 72, 1678–1682. [Google Scholar] [CrossRef]
- Tserpes, K.; Kora, Ch. A multi-scale modeling approach for simulating crack sensing in polymer fibrous composites using electrically conductive carbon nanotube networks. Part II: Micro-scale analysis. Comput. Mater. Sci. 2018, 154, 530–537. [Google Scholar] [CrossRef]
- ANSYS User’s Manual, version 11; Swanson Analysis Systems: Pittsburgh, PA, USA, 2008.
© 2018 by the authors. Licensee MDPI, Basel, Switzerland. This article is an open access article distributed under the terms and conditions of the Creative Commons Attribution (CC BY) license (http://creativecommons.org/licenses/by/4.0/).