
Enhancing the Interlaminar Fracture Toughness and AO Resistance of CFRPs by Using Phosphorus-Containing Polymer/PEC-K Bifunctional Film


1
AVIC Composite Technology Center, AVIC Manufacturing Technology Institute, Beijing 101300, China
2
National Key Laboratory of Advanced Composites, Beijing 101300, China
Aerospace 2021, 8(12), 365; https://doi.org/10.3390/aerospace8120365
Submission received: 12 October 2021
/
Revised: 13 November 2021
/
Accepted: 18 November 2021
/
Published: 26 November 2021
(This article belongs to the Special Issue Adaptive/Smart Structures and Multifunctional Materials in Aerospace)
Abstract
:A new attempt to use a bifunctional interleaf for developing a novel structure–function-integrated composite with simultaneously improved interlaminar fracture toughness and atomic oxygen resistance was studied. The toughening mechanism and the atomic oxygen erosion property of the delaminated surfaces of the composites were examined. The bifunctional interleaf was prepared by blending a phosphorus-containing polymer and a thermoplastic polymer. After being interleaved, the mode I and mode II fracture toughness increased by 8.2% and 23.7% compared to the control sample, respectively. The toughness gains are much smaller than that of the only thermoplastic film-toughened composite because of the relative brittleness of the blend film. The atomic oxygen erosion rates of the mode I and mode II delamination surfaces decreased by 45.3% and 31.3% compared with the control, respectively. The carbon fibers on the irradiation surfaces are protected by a layer of phosphine oxide to prevent further erosion, and they were much less eroded, particularly for the mode I surface. In comparison, the erosion rates of the mode I and mode II surfaces of the toughened-only composite significantly increased by 83.6% and 107.2%, respectively, and the carbon fibers are seriously eroded.
1. Introduction
With the development of aerospace technology, the boundary between space and the sky is gradually blurred. Vehicles operating in low earth orbit (LEO), such as aerospace aircrafts and satellites, have been greatly developed. Among various materials, lightweight and high-strength composites are the preferred materials for these new vehicles [1,2,3,4,5]. However, the environment in LEO is far different from the earth’s surface and the outer space, which is full of atomic oxygen (AO), ultraviolet (UV) radiation, impacts of cold and hot cycles, impacts of flying objects, and other features. Among these, damage caused by AO is the most serious and has attracted much attention [6,7,8,9]. For composite materials, their matrixes are usually thermosetting resins. Under the erosion of high-energy, highly oxidizing AO, all hydrocarbons, including carbon fiber [1], will be oxidized into gaseous substances, which causes mass loss and performance degradation of the structures, and affects their reliability and service life [1,2,3,4]. For most carbon-fiber-reinforced composites, AO causes serious surface erosion and mass loss [4,5] and even leads to a distinct decrease in bending strength, for example, only 74.2% of the initial value [4] is found after irradiation for 24 h. The strength degradation is even accelerated with the increase in AO irradiation time.
The methods for the protection of AO erosion are mainly through introducing compounds or nano particles containing silicon, boron, phosphorus, or other elements into the surface or the base materials. After the introduction, these elements form nonvolatile oxides under AO irradiation, and then the oxides cover the erosion surface and block further erosion, playing a role in self-healing [10,11,12,13,14]. For composite materials, the improvement of AO resistance is mostly based on the modification of the surface protection layer, the resin matrix, and reinforcing fibers. For example, in terms of surface protection, modified polyimide films [10] or ceramic or metal coatings are used as the protective layers [11]. However, microcracks are easily formed in the surface layer during AO irradiation, resulting in poor protection for the internal material. In terms of improving the AO resistance of the matrix, for example, Liu et al. introduced phosphorus into the chemical structure of the matrix resin [12]. Zhao et al. added talc to the polyimide matrix [13]. Another attempt has been made to improve the AO resistance of the fiber/resin interface. Wei et al. improved the AO resistance of the fibers through depositing Au on the fiber surface. A better retention rate of the interface shear strength was found after AO erosion [2]. Zheng et al. treated the fibers with a silane agent. The AO erosion rate of the fiber/resin interface was markedly decreased [14].
On the other hand, composite materials in the space environment suffer the impact of the temperature gradient because of the alternation of heat and cold, and they also face the threat of flying objects. Another important problem of traditional composites is that they easily form microcracks and become delaminated caused by low-velocity impact, resulting in the decline of compression strength [15,16]. Generally, microcracks and delamination are most likely to occur in the resin-rich interlaminar region. Interlayer toughening is the most important method to improve the interlaminar toughness to resist impact energy [17]. After being toughened, the resistance to the interlaminar crack growth is significantly improved; typically, the mode I (GIC) and mode II (GIIC) interlaminar fracture toughness of the composites will be greatly improved [18,19]. The increase in energy dissipation can be attributed to several mechanisms, such as the bridging caused by nanofillers and fibers, the increase in matrix viscoelasticity, and the deflection of the crack path [20,21].
AO can penetrate through cracks, resulting in damage to the interior material [11]. For composite laminates, cracks are most likely to occur in the resin-rich interlaminar region during the molding process and application. However, there is no research on improving the AO resistance of the interlaminar region, and no work has studied the AO erosion behavior of the delamination surface of the composites.
In our previous work, we developed a novel functionalized interleaf technology (FIT) for preparing multifunctional structural composites [22,23,24]. One of the applications of this technology is the production of composites with simultaneous high conductivity and high toughness [24]. In this paper, we first further expand the application of FIT in the field of atomic oxygen protection for developing new structure–function-integrated composites used for vehicles operating in LEO. We propose a bifunctional film using for the interleaf, which can not only improve the interlaminar fracture toughness of the composite, but also improve the AO resistance of the easily delaminated interlaminar region. In view of this idea, a blend film of high-toughness poly (aryl ether ketone) (PEK-C) and phosphorus-containing polymer (PSPPP) was prepared as the bifunctional interleaf for simultaneously improving the interlaminar fracture toughness and AO erosion behavior of carbon-fiber-reinforced bismaleimide resin. The AO erosion behavior of the delamination surfaces was examined.
2. Experimental
2.1. Materials
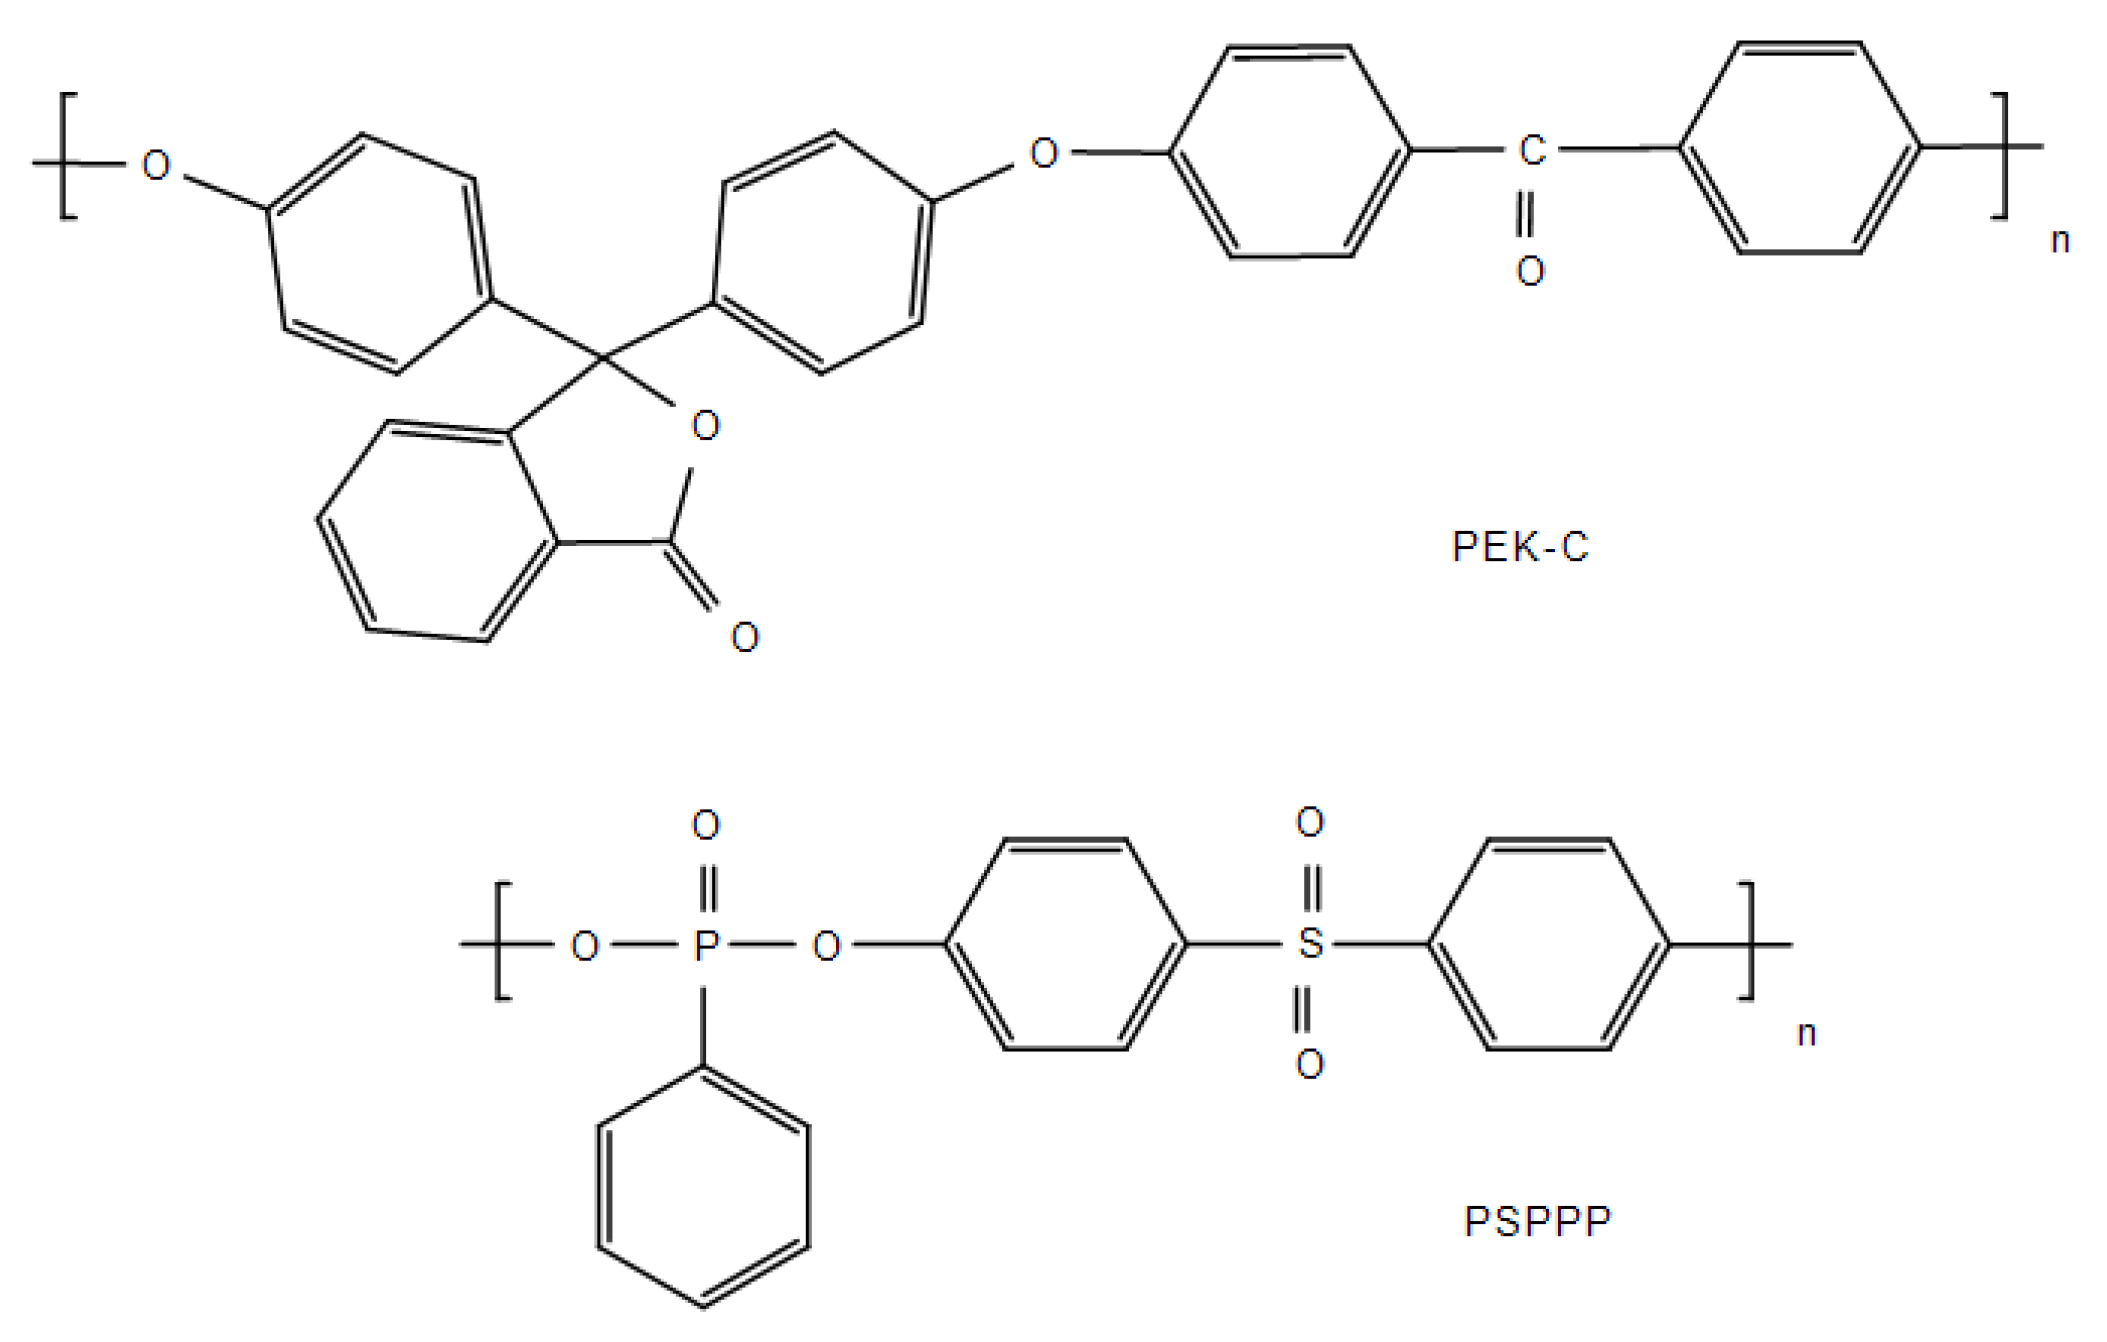
PEK-C is a phenolphthalein-modified polyaryletherketone purchased from Xuzhou Engineering Plastics Factory (Xuzhou, China). PSPPP is a kind of phosphorus containing polyethersulfone purchased from Hubei Nona Technology Co., Ltd., Wuhan, China. Their chemical structures are as follows (Scheme 1).
To prepare the PEK-C films and PEK-C/PSPPP blend films, first, PEK-C and PSPPP powders in a certain proportion were dissolved in N,N-dimethylformamide (DMF) to form a uniform, transparent 10–15 wt.% solution. Then the solution was casted on a clean glass plate and heated in a 100 °C oven for 2 h to form the film. Before use, the residual DMF was fully removed via drying in a vacuum oven at 100 °C for 2 h. Table 1 gives the abbreviations of the corresponding films and composite laminates. CCF300/6421 prepreg was prepared in our laboratory (AVIC Composite Technology Center, Beijing, China). Here CCF300 is the reinforcing fiber, and 6421 is an aero-grade bismaleimide resin, a product of the AVIC composite technology center, Beijing, China (ACTC). The thickness of a single layer of the prepreg is 0.125 mm. The resin content is controlled at 31–33 wt.%. Other auxiliary materials, such as the polytetrafluoroethylene (PTFE) film, were purchased commercially without further treatment.
2.2. Preparation of the Laminates
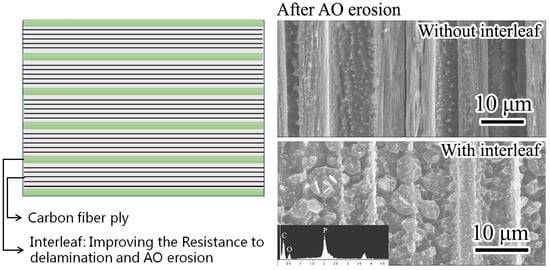
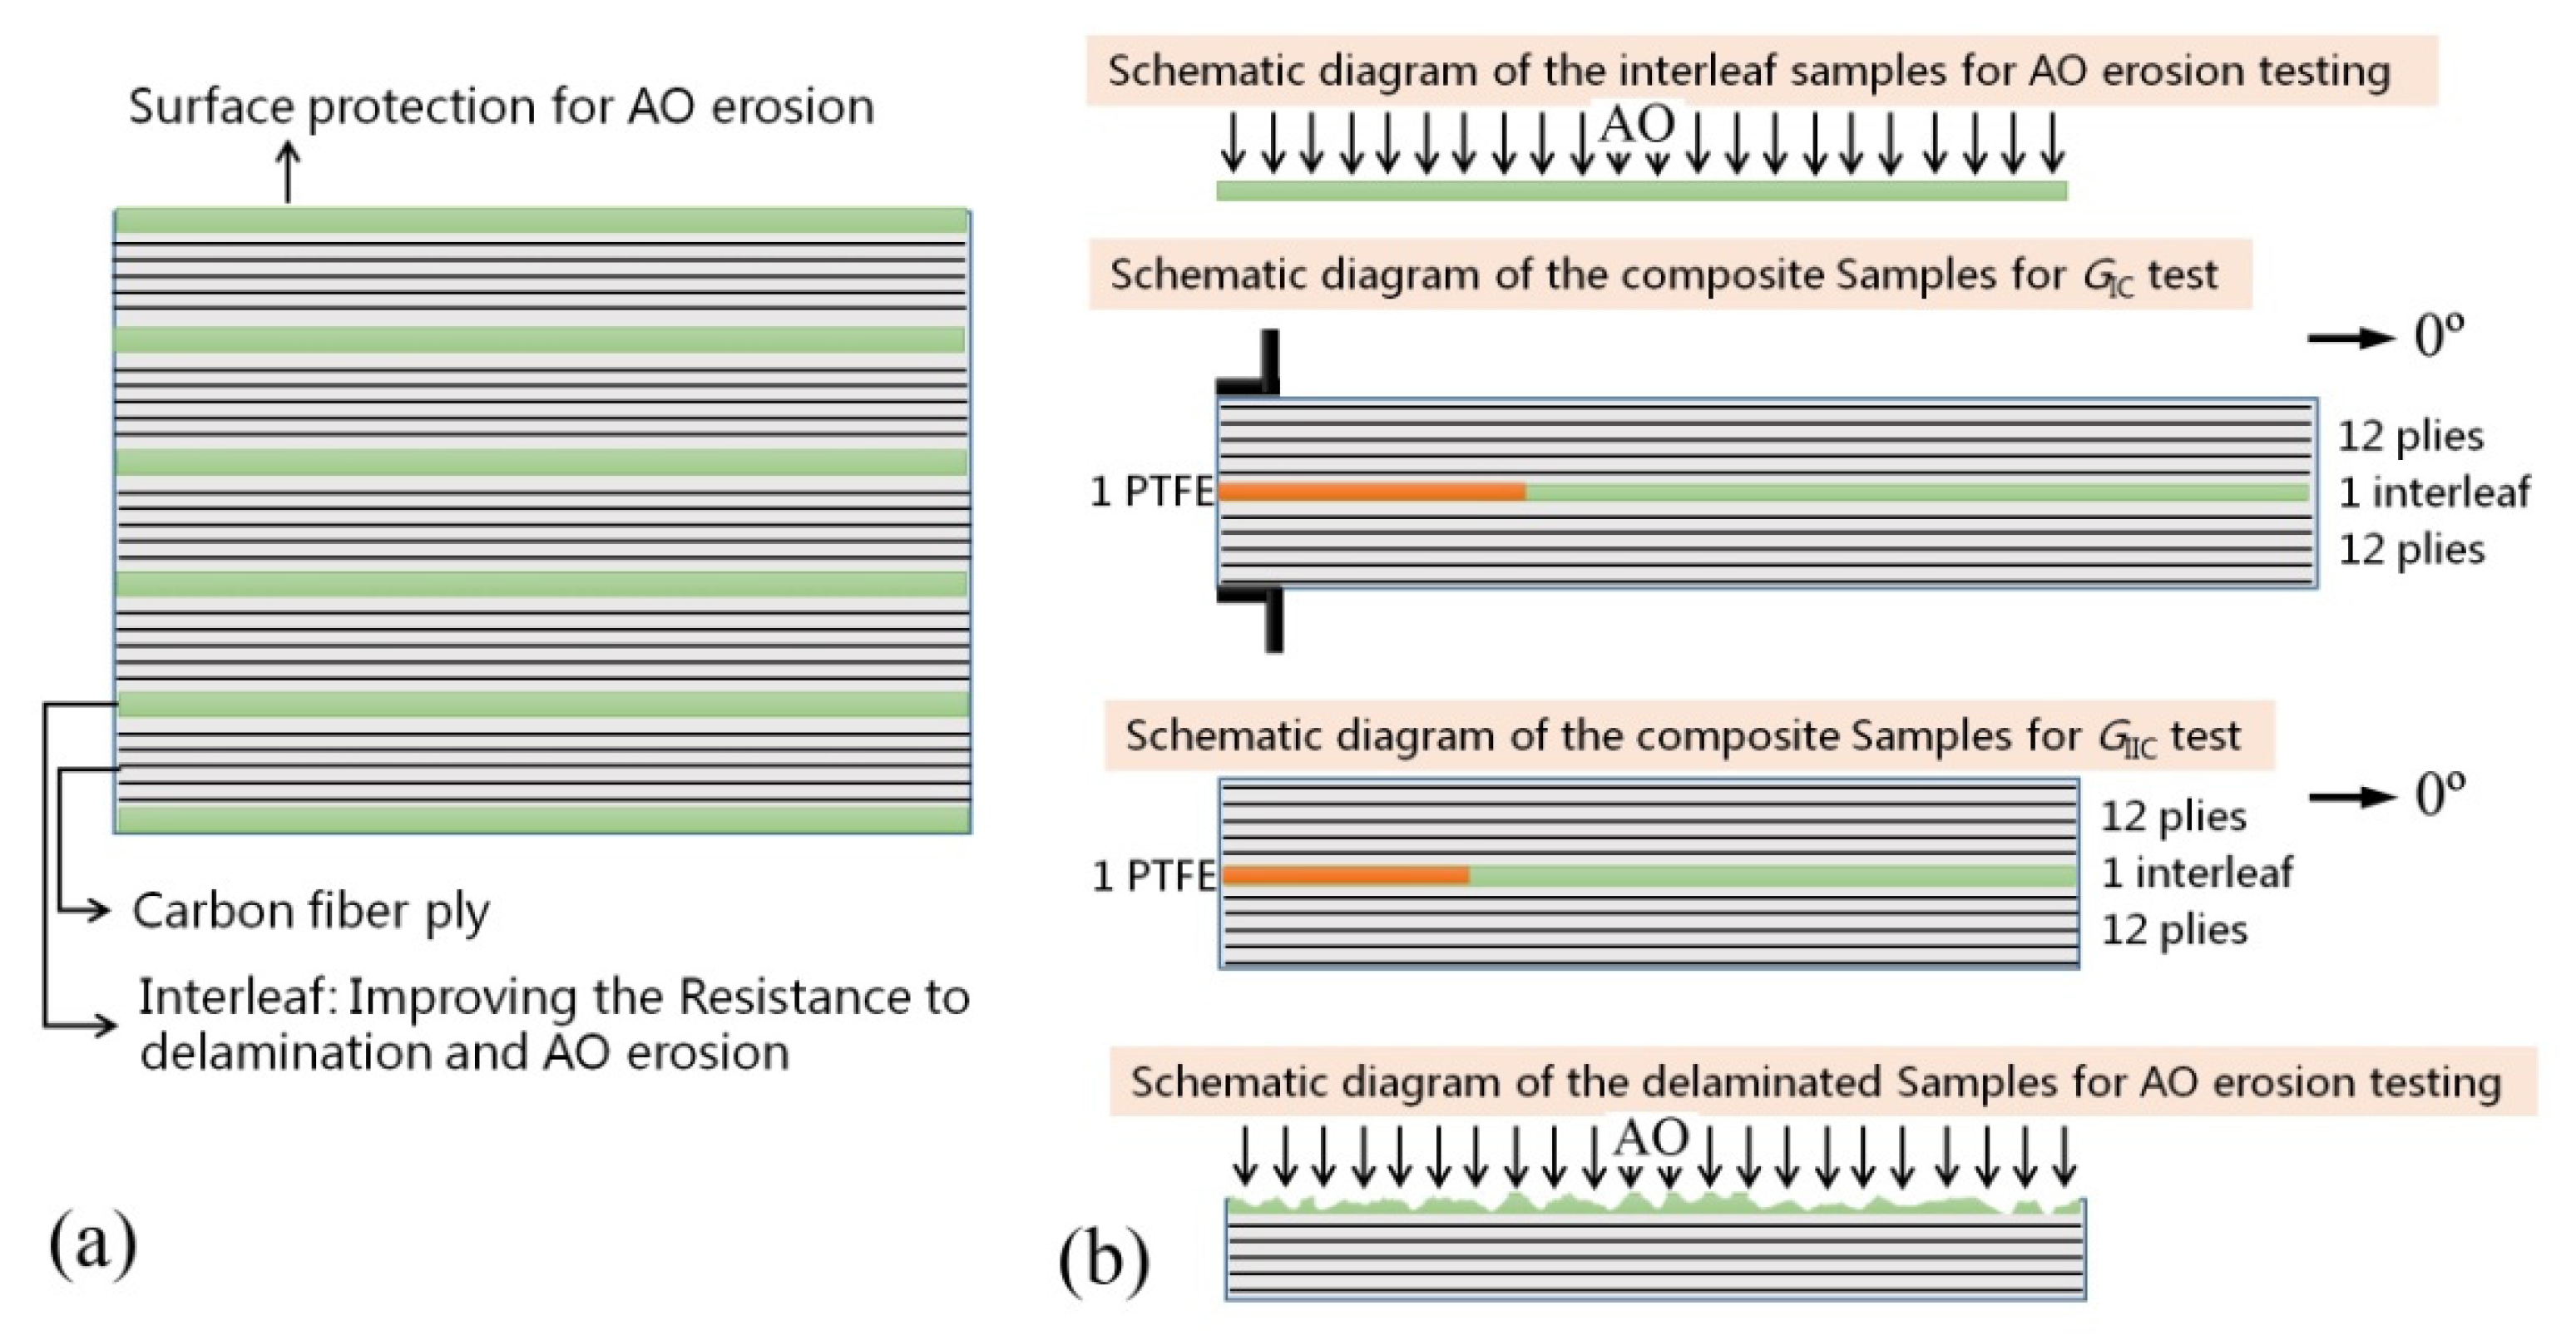
The design principle of the composite is shown in Figure 1a. The blended films are covered on the surface and interleaved in the interlayer of the laminate. The surface film protects the AO erosion of the surface. The interleaved films enhance the toughness of the laminate to avoid microcracks and delamination. During the curing process, part of the film near the interface is dissolved in the matrix resin, and the reaction-induced phase separation occurs at a high curing degree, finally forming a polyphase structure. This is a so called “ex situ” toughening technology [17], which has been proved to be an effective toughening method. Thus, the application of the toughening and anti-AO interleaf can suppress microcrack formation and improve the AO resistance of the interlayer region and protect the composite from AO erosion even when the interlayer is delaminated or full of cracks.
The schematic diagram of the test samples is shown in Figure 1b. The AO erosion rate of the base materials was tested by using 6421 resin, PEK-C film, and PS100 film as the samples. The samples for GIC and GIIC tests were cut from a unidirectional laminate made of CCF300/6421 prepreg. First, the prepregs were stacked in a preform with the sequence of [0]24. Three kinds of laminates were prepared, i.e., the control sample without any interleaf, the toughened-only sample interleaved with one PEK-C film (PS0-C), and the sample interleaved with one PS100 film (PS100-C). When preparing the preform, a 25-μm-thick PTFE film was inserted at one side of the middle layer to prepare the precrack. The width of the PEFE film (along the fiber direction) was controlled at 5.5–6 mm. One interleaf was used to fully fill the other side of the middle layer without the PTFE film coverage. Then the preform was cured by the hot press curing method according to the curing conditions of 6421 resin. The laminate was finally demolded for use after being cooled below 60 °C.
2.3. Test of Mode I and II Interlaminer Fracture Toughness
The GIC test is used in accordance with the Chinese Aviation Industry Standard HB 7402-96, which is based on the American Society for Testing and Materials (ASTM) standard D5528-01 [25]. Standard double-cantilever beam (DCB) specimens with a width of 25 mm and a length of 180 mm were used (Figure 1b). The length of the precrack made by the PTFE film was 50 mm. Before testing, an initial load was applied to the hinges stuck on the two surfaces of the precracked end of the sample to cause the precrack to expand about 10–20 mm to obtain a fresh crack. During the test, the load, displacement, and crack length of each specimen were recorded in real time. The loading rate was 2 mm/min. Three specimens were tested for each sample. The GIIC test is according to HB 7403-96, which is based on ASTM D790-00. End-notched flexure specimens (ENF) with the width of 25 mm and length of 140 mm were used (Figure 1b). The length of the precrack made by the PTFE film was 40 mm. A 5–10 mm long fresh crack was created by applying an initial load to each specimen. The critical value of the load and the displacement were recorded. Five specimens were tested for each sample. GIC is calculated by Equation (1) and GIIC is calculated by Equation (2), respectively.
where GIC is the mode I interlaminar fracture toughness, J/m2; m is the fitting coefficient; P is the load, N; δ is the displacement, mm; W is the specimen width, mm; a is the crack length, mm.
where GIIC is the mode II interlaminar fracture toughness, J/m2; P is the critical load, N; δ is the displacement, mm; a is the crack length, mm; W is the specimen width, mm; 2L is the span (distance between the cylinders), mm.
2.4. Test of the AO Erosion Rates
The AO erosion rates were tested according to the Chinese national military standard GJB 2502.9-2015. An AO ground simulation test equipment is adopted for the test. The AO flux density is 5 × 10¹⁵ O atoms/cm2.s, and the total count is 7.5 × 10²⁰ O atoms/cm2. The size of films for the erosion rate test of base materials is 20 mm × 20 mm. The samples for the erosion rate test of the delamination surfaces were obtained from the typical failure area of the specimens after the DCB and ENF tests. The sample width is the same as that of the interlaminar fracture test sample (25 mm). The sample length, which is along the fiber direction, is 15 mm. The projection area of the macro sample was used as the irradiation area when calculating the erosion rate. Three specimens were tested for each sample.
2.5. Other Characterizations
Scanning electron microscopy images (SEM) were obtained by a Hitachi S-4800 (Hitachi Group, Tokyo, Japan) in the Beijing Center for Physical and Chemical Analysis. Before the test, all of the samples were sprayed with a thin gold layer. Optical photos were taken by a smart phone. Differential scanning calorimetry (DSC) was obtained from A TA DSC Q10 (TA Instruments, New Castle, DE, USA). The tensile strength of the film was tested by cutting the film with a width of about 12.5 mm and a length of 25 mm. The tensile speed of the film was 5 mm/min with a SANS CMT4000 tensile machine (MTS systems (China) Co., Ltd., Shanghai, China). Five films were tested for each sample.
3. Results and Discussion
3.1. Preparation and Properties of Interleaf Films
PEK-C is a typical highly tough thermoplastic polymer, which has been applied to toughen carbon-fiber-reinforced composites [17]. PSPPP is a kind of phosphorus containing polyester, which is often used for flame-retardant modification. Compared with PEK-C, the molecular structure of PSPPP is more rigid. Pure PEK-C films and PEK-C/PSPPP (1:1) (PS100) films were prepared using for the interleaf films. The thicknesses of the PEK-C and PS100 films are 25 and 30 μm, respectively.
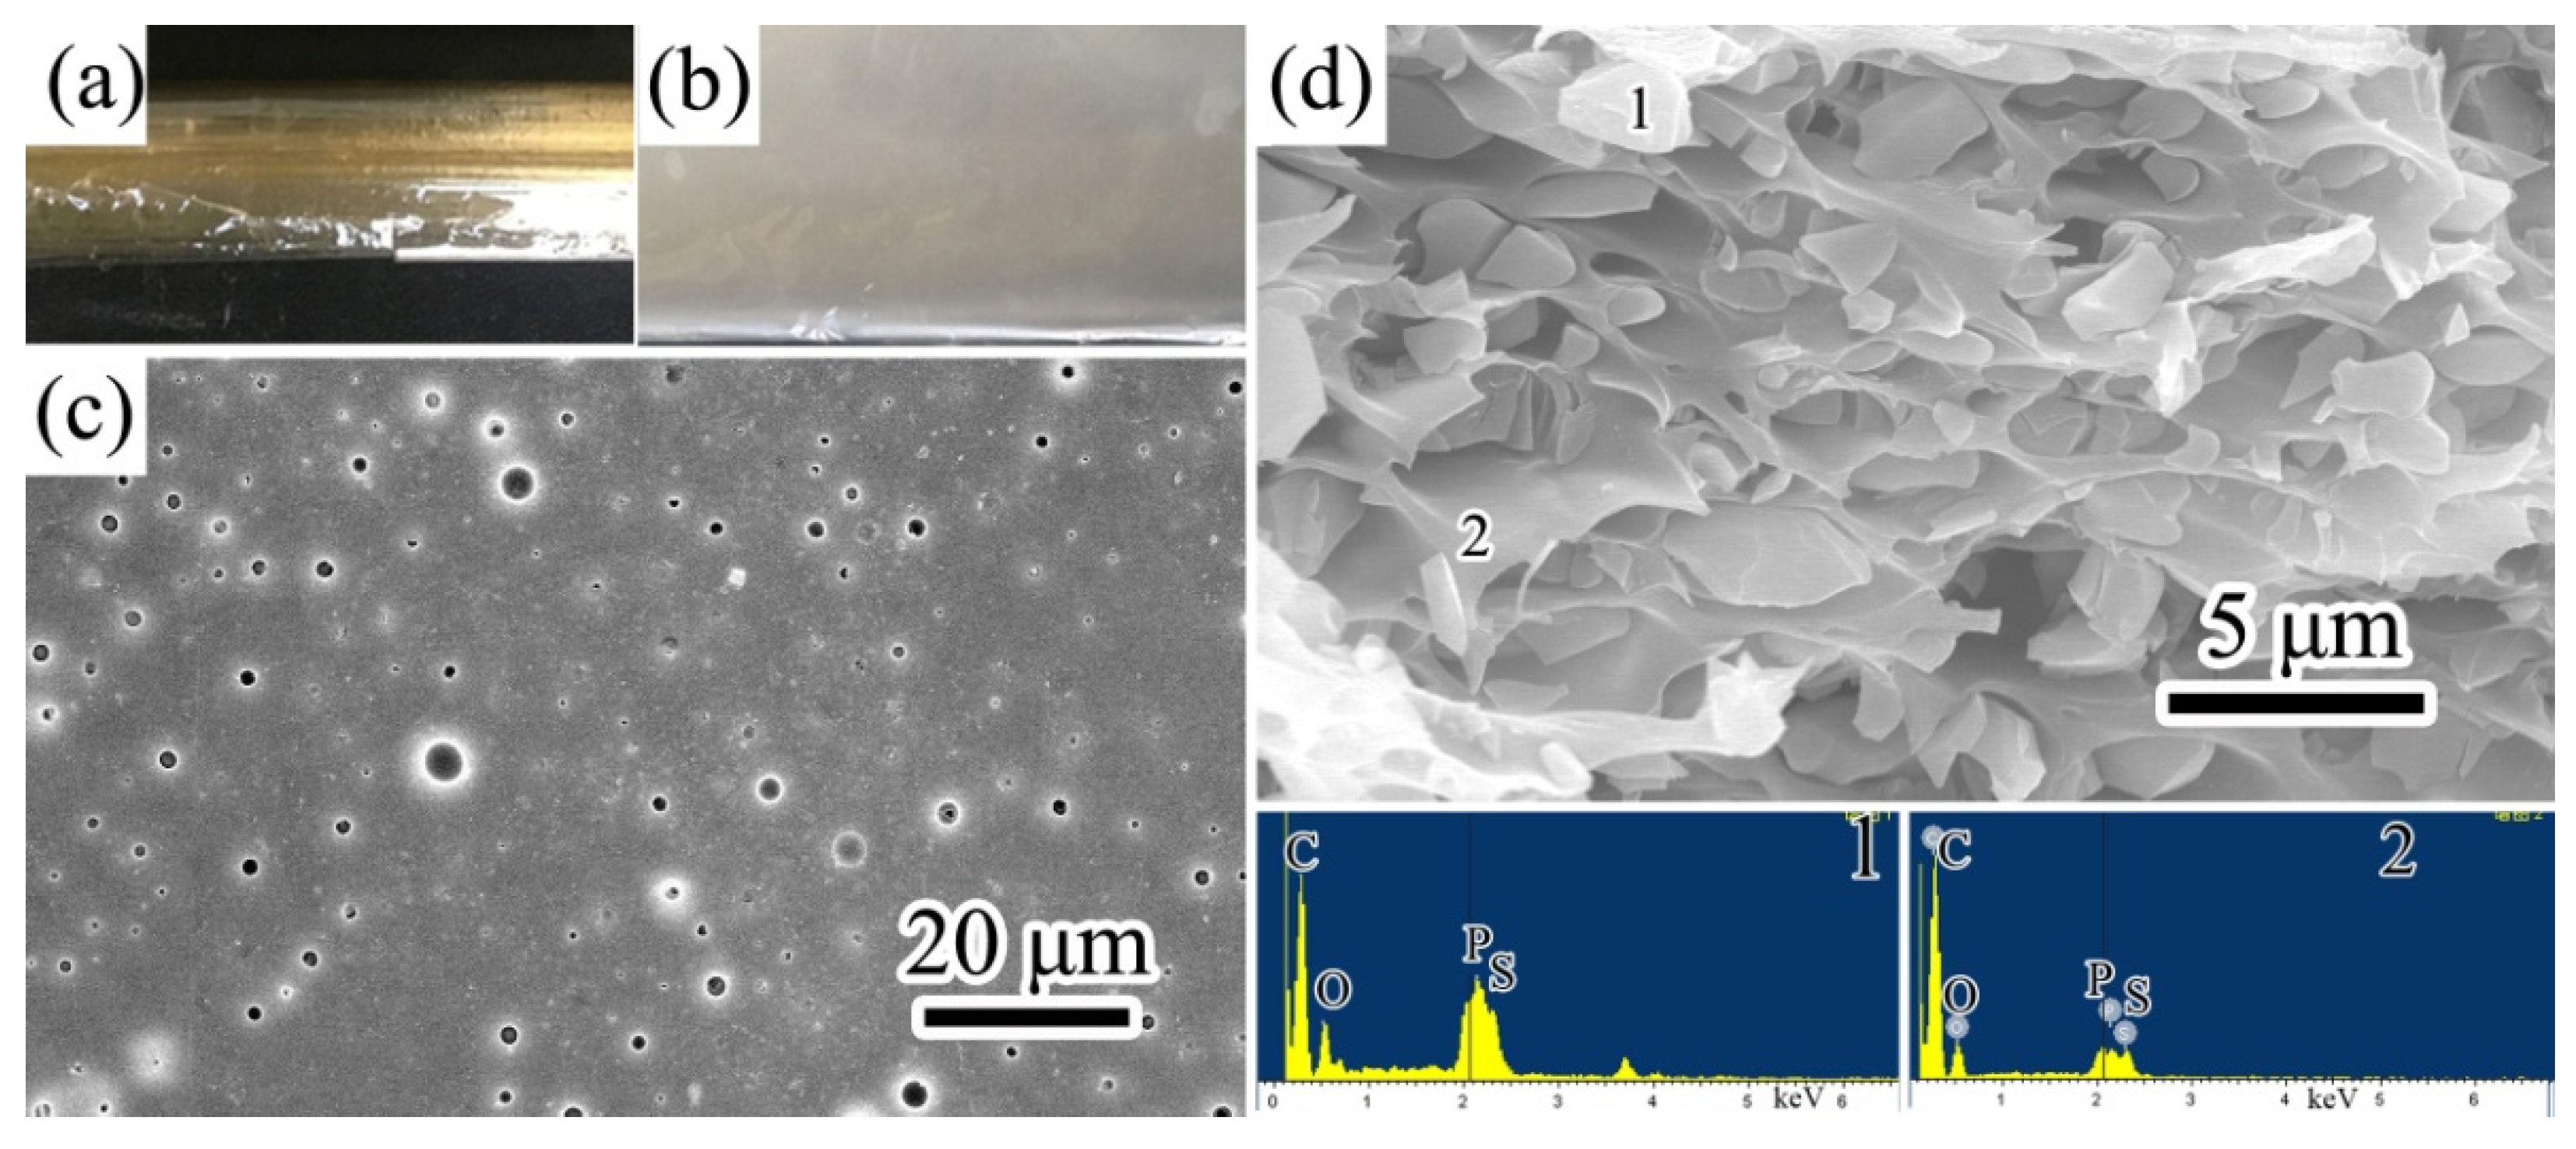
The PEK-C films were transparent because they were formed by homogeneous PEK-C without micro-phase separation (Figure 2a). Different from the PEK-C films, the PS100 films were milky white and not transparent, indicating that PSPPP and PEK-C are not completely compatible, and micro-phase separation occurred during the film formation process (Figure 2b). SEM images of the PS100 show that many small dark dots are distributed on the film surface and many micropores with small particles on the fracture surface. The size of the micropores is around 2–7 μm, whereas the particle size is relatively smaller (Figure 2c,d). The above results indicate that micro-phase separation occurred during film formation, and the interface of the two phases is very poor. Compared with the results of energy dispersive X-ray spectroscopy (EDS), it can be considered that the continuous phase is a blend of PEK-C and PSPPP, while the particles are mainly PSPPP.
From the DSC curves of PEK-C and PS100 films (Figure 3), it can be seen that the glass transition temperature (Tg) of PEK-C is 221 °C, indicating that PEK-C is a typical high-Tg polymer, thus it can be used for the toughening of bismaleimide resin. As a comparison, the Tg of the PS100 film is not obvious. A peak at 289 °C can be found, which can be identified as the melting point of PSPPP. It further indicates PSPPP crystallized from the blend film after film formation. Since PSPPP has a high melting point, it can also be used for the modification of bismaleimide resin and will not reduce the heat resistance of the resin.
Figure 4 gives the tensile curves of the PEK-C film and the PS100 film. The PEK-C film is significantly higher than the PS100 film in both tensile strength and elongation at break. The elongation at break of the PEK-C film reaches 5.5%, showing obvious stress-plastic yield, whereas the elongation at break of PS100 film is only 2.2%, showing brittle fracture. It indicates that the toughness of the PS100 film is significantly lower than that of the PEK-C film because of the brittleness of PSPPP.
3.2. The Interlaminar Fracture Toughness of the Composites
The thermoplastic PEK-C film produces good toughening properties on the CCF300/6421 laminate. After interleaved with the PEK-C film. GIC and GIIC of the PS0-C are markedly increased by 57% and 115%, respectively (Table 2). Compared with the PS0-C, GIC and GIIC of the PS100-C interleaved with a PS100 film are much lower. Compared with the control, GIC and GIIC of the PS100-C still showed a small increase of 8.2% and 23.7%, respectively.
GIC increased with the increase in crack length for all three samples as shown in Figure 5. It is also consistent with the results reported in many previous research works [18,26]. Among the three samples, the GIC increase in the control is more obvious. Its value exceeds the GIC value of the PS100-C when the crack length is larger than 90 mm. The observations made during the test found that more fiber bridging existed for the control sample because of its smaller interlayer thickness without any interleaf.
The typical load–displacement curves of ENF tests are given in Figure 6. The load increases linearly with the increase in displacement at the beginning stage for all three samples. When near the critical load, plastic deformation occurs, and the increase in load become nonlinear. It can be seen that for the PS0-C specimen, the plastic deformation is most obvious. The plastic deformation of the PS100-C specimen is significantly smaller, but it is still larger than the control specimen.
Fractography analysis was examined by SEM. Figure 7 presents the SEM images of the delaminated surfaces of the three samples after the mode I test. River-like stripes can be found on the delaminated surface of the control sample, which is a typical brittle fracture morphology. For PS0-C, many carbon fibers/resin interfaces can be seen on its mode I fracture surface, which look similar to that of the control. However, the resin fracture surface is much rougher when observed from the enlarged area. Nano-sized phase-separation structures can be seen. This is because PEK-C can be dissolved with 6421 resin in the initial stage and the reaction-induced phase separation occurred near the gel point during the curing process. The existence of phase separation makes the fracture surface quite rough and markedly improves GIC.
The fracture surface of PS100-C is quite different. No bare carbon fiber or fiber/resin interface is found, while phase-separation morphology with the size of several microns can be seen everywhere, which is similar to the fracture surface of the PS100 film shown in Figure 2d. It indicates that the delamination tends to occur inside the interlayer, that is, inside the region with the PS100 interleaf. The reason may be that plastic deformation at the crack tip became smaller than the interlayer size, causing the cracks to occur inside the interlayer [27], because of the higher brittleness of the PS100 film. The decrease in the interlayer toughness leads to the decrease in viscoelastic energy dissipation, resulting in the decrease in GIC. Compared with the SEM images of the three samples, we can determine the reason bridging of carbon fibers did not exist on the fracture surface of PS100-C, which is because the GIC increase with the increase in crack length is smaller than the control, as shown in Figure 5b.
Figure 8 presents the SEM images of the delaminated surfaces of the three samples after the mode II test. The mode II delamination usually occurs at the interlayer because of the tensile crack and the fiber/resin interface because of the transverse shear stress. For the control sample, a hackle structure is found, which is the typical interlayer cohesive failure for a brittle matrix [28]. For the PEK-C-toughened PS0-C sample, the fracture surface is relatively rough. Ductile deformation and nano-sized phase separation of the resin can be clearly seen. After being toughened, the toughness of the interlayer is significantly increased and the tensile cracks inside it do not occur easily. The main failure mode is changed to interfacial bonding failure. Due to the high viscoelastic energy dissipation of ductile interlayer, GIIC is greatly improved. For the PS100 film-toughened PS100-C sample, an obvious resin phase-separation structure and carbon fiber/resin interfacial debonding can be seen. The morphology of carbon fiber is missing in certain parts of the CF interface. It indicates that the phase separation leads to interface deterioration. In addition, the toughness of the PS100 interleaf is also lower than PEK-C, resulting in lower GIIC. However, it is still higher than the control sample.
3.3. AO Erosion Properties
Table 3 presents the AO erosion rates of the samples at the AO dose of 7.5 × 10²⁰ O atoms/cm2. For the base materials, the erosion rate of PS100 is significantly lower than that of the matrix resin and PEK-C, about 15.6% of the erosion rate of the 6421 resin. However, the AO erosion rates of the delamination surfaces of the composites are different from those of the base materials. The erosion rates of the mode I surface and mode II surface of the only toughened PS0-C are 83.6% and 107.2% higher than those of the control, respectively. It indicates that after being toughened, although the interlaminar toughness of the composite is improved, its resistance to the AO erosion is significantly decreased. For the PS100-C sample, the erosion rates of the mode I surface and mode II surface decreased by 45.3% and 31.3% compared with the control, respectively, indicating a notable increase in AO resistance.
The morphologies of the 6421 resin, PEK-C film, and PS100 film after AO erosion are shown in Figure 9. The surface morphologies of the 6421 resin and PEK-C film after erosion are relatively similar. Both surfaces became uneven surfaces, which is a typical AO-eroded surface morphology of homogeneous materials. On the other hand, for the AO-eroded surface of the PS100 film, numerous quasi spheres containing nano-sized pores are found. The diameter of the spheres is around 5–8 μm. Comparing the element composition of the eroded film with the unirradiated film, the carbon content is much lower, while the relative proportions of phosphorus and oxygen are much higher. This is because PS100 displays phase separation of PEK-C and PSPPP. The AO erosion rates of these two polymers are significantly different. After erosion, the PEK-C phase near the film surface was removed, whereas the PSPPP phase was oxidized into phosphate compounds and prevented the further diffusion and erosion of AO. Thus, the PS100 film has a lower AO erosion rate and special eroded morphology.
Figure 10 presents the SEM images of mode I delamination surfaces after AO erosion. The carbon fibers on the surfaces of the control and PS0-C samples were eroded into bundles of nano-sized fibers. The delamination surfaces of the control and PS0-C were seriously damaged. For the control, the 6421 resin was eroded evenly, while for the PS0-C sample, the resin between carbon fibers was eroded into a honeycomb-like morphology. This is due to the existence of PEK-C/6421 resin phase separation. The phase separation increases the surface roughness and interfacial AO permeation; thus, the erosion rate of PS0-C is significantly higher.
The mode I delamination surface of PS100-C after AO erosion is quite different. Compared with the un-eroded surface shown in Figure 7c, the interlayer resin was partly eroded, and the shape of carbon fibers appeared. However, all the carbon fibers are covered with a layer of compounds with high phosphate content, and nearly no eroded carbon fiber is found. This indicated the eroded interlayer plays a role in self-healing for AO erosion and protects the carbon fiber and matrix.
The mode II delamination surfaces of the control and PS0-C after AO erosion shown in Figure 11 are more or less similar to the mode I delamination surfaces. The 6421 resin was uniformly and seriously eroded for the control sample. A honeycomb-like morphology is found for the PS0-C sample. The carbon fibers on the delamination surfaces are seriously damaged.
On the other hand, for the PS100-C sample, there are some differences. Some of the carbon fibers near the delamination surface were completely eroded. This is because the mode II delamination region occurred at the fiber/resin interface, which is different to the mode I delamination region. The erosion depth is still much smaller than the control and PS0-C samples, indicating better AO protection.
4. Conclusions
A novel structure–function-integrated composite with improved interlaminar toughness and AO resistance was prepared by interleaving it with a PEK-C/PSPPP bifunctional film. After being interleaved, GIC and GIIC increased by 8.2% and 23.7%, respectively, compared to the control sample, but were lower than those of the toughened-only composite interleaved with the PEK-C film. The main reason is the brittle PSPPP decreased the toughness of the interleaf. The AO erosion rates of the mode I and mode II delamination surfaces decreased by 45.3% and 31.3%, respectively, compared to the control sample, while those of the toughened-only composite increased by 83.6% and 107.2%, respectively. Further, the carbon plies of the PS100-C on the delamination surfaces are protected by phosphorous compounds after erosion, whereas the carbon fibers were seriously damaged in the control and PS0-C.
Funding
The work was supported by the Aeronautical Science Foundation of China [Grant number: 2016ZFV8010] and the Basic Research Enhancement Program of National Defense Science and Technology [Grant number: 2020-JCJQ-JJ-157].
Institutional Review Board Statement
Not applicable.
Informed Consent Statement
Not applicable.
Acknowledgments
The author is grateful to the financial supporting institutions for their financial supports.
Conflicts of Interest
The authors declare no conflict of interest.
References
- Ghosh, L.; Kinoshita, H.; Ohmae, N. Degradation on a Mechanical Property of High-Modulus Aramid Fiber due to Hyperthermal Atomic Oxygen Beam Exposures. Compos. Sci. Technol. 2007, 67, 1611–1616. [Google Scholar] [CrossRef]
- Wei, H.; He, J.; Huang, Y.; Mao, L.; Cheng, Z. Study on Atomic Oxygen Erosion Resistance for Interface of Carbon Fiber/Epoxy Composites. J. Reinf. Plast. Compos. 2010, 29, 2547–2555. [Google Scholar]
- Chen, L.; Wei, F.; Liu, L.; Cheng, W.; Hu, Z.; Wu, G.; Du, Y.; Zhang, C.; Huang, Y. Grafting of Silane and Graphene Oxide onto PBO Fibers: Multifunctional Interphase for Fiber/Polymer Matrix Composites with Simultaneously Improved Interfacial and Atomic Oxygen Resistant Properties. Compos. Sci. Technol. 2015, 106, 32–38. [Google Scholar] [CrossRef]
- Huo, C.; Guo, L.; Cao, A.; Wang, Z.; Wang, C.; Kou, G.; Zhang, Y. The Degradation Behavior of C/C Composites in High-Energy Atomic Oxygen. Vacuum 2017, 146, 120–129. [Google Scholar] [CrossRef]
- Liu, X.; Cheng, L.; Zhang, L.; Luan, X.; Mei, H. Behavior of Pure and Modified Carbon/Carbon Composites in Atomic Oxygen En-Vironment. Int. J. Miner. Metall. Mater. 2014, 21, 190–195. [Google Scholar] [CrossRef]
- Pei, X.; Li, Y.; Wang, Q.; Sun, X. Effects of Atomic Oxygen Irradiation on the Surface Properties of Phenolphthalein Poly (Ether Sulfone). Appl. Surf. Sci. 2009, 255, 5932–5934. [Google Scholar] [CrossRef]
- Atar, N.; Grossman, E.; Gouzman, I.; Bolker, A.; Murray, V.J.; Marshall, B.C.; Qian, M.; Minton, T.K.; Hanein, Y. Atomic-Oxygen-Durable and Electrically-Conductive CNT-POSS-Polyimide Flexible Films for Space Applications. ACS Appl. Mater. Interfaces 2015, 7, 12047–12056. [Google Scholar] [CrossRef] [PubMed]
- Mundari, N.D.A.; Srivastava, A.K.; Toyoda, K.; Cho, M. Influnce of Atomic Oxygen Exposure on Surface Resistivity of Silicon Doped Polyimide Affecting Spacecraft Charging. Vacuum 2014, 105, 11–16. [Google Scholar] [CrossRef]
- Xu, S.; Sun, J.; Weng, L.; Hua, Y.; Liu, W.; Neville, A.; Hu, M.; Gao, X. In-Situ Friction and Wear Responses of WS2 Films to Space Environment: Vacuum and Atomic Oxygen. Appl. Surf. Sci. 2018, 447, 368–373. [Google Scholar] [CrossRef] [Green Version]
- Liu, F.; Guo, H.; Zhao, Y.; Qiu, X.; Gao, L. Enhanced Resistance to the Atomic Oxygen Exposure of POSS/Polyimide Composite Fibers with Surface Enrichment through Wet Spinning. Eur. Polym. J. 2018, 105, 115–125. [Google Scholar] [CrossRef]
- Qi, H.; Qian, Y.; Xu, J.; Zuo, J.; Li, M. An AZ31 Magnesium Alloy Coating for Protecting Polyimide from Erosion-Corrosion by Atomic Oxygen. Corros. Sci. 2018, 138, 170–177. [Google Scholar] [CrossRef]
- Liu, B.; Ji, M.; Liu, J.; Fan, L.; Yang, S. Phenylphosphine Oxide Containing Polyimide Matrix Resins for Atomic Oxygen-Resistant Fiber-Reinforced Composites. High Perform. Polym. 2013, 25, 907–917. [Google Scholar] [CrossRef]
- Zhao, G.; Liu, B.; Wang, Q.; Wang, T. The Effect of the Addition of Talc on Tribological Properties of Aramid Fiber-Reinforced Polyimide Composites Under High Vacuum, Ultraviolet or Atomic Oxygen Environment. Surf. Interface Anal. 2013, 45, 605–611. [Google Scholar] [CrossRef]
- Zheng, N.; He, J.; Zhao, D.; Huang, Y.; Gao, J.; Mai, Y.-W. Improvement of Atomic Oxygen Erosion Resistance of Carbon Fiber and Carbon Fiber/Epoxy Composite Interface with a Silane Coupling Agent. Mater. Des. 2016, 109, 171–178. [Google Scholar] [CrossRef]
- Dransfield, K.; Baillie, C.; Mai, Y.-W. Improving the Delamination Resistance of CFRP by Stitching—A Review. Compos. Sci. Technol. 1994, 50, 305–317. [Google Scholar] [CrossRef]
- Hutchinson, J.W.; Lu, T.J. Laminate Delamination due to Thermal Gradients. J. Eng. Mater. Technol. 1995, 117, 386–390. [Google Scholar] [CrossRef]
- Yi, X.-S.; An, X.F. Effect of Interleaf Sequence on Impact Damage and Residual Strength in a Graphite/Epoxy Laminate. J. Mater. Sci. 2004, 39, 3253–3255. [Google Scholar] [CrossRef]
- Guo, M.; Liu, L. Structuring the Thermoplastic Interleaf with Lotus-Leaf-Like Structure and its Interlaminar Toughening for CFRPs. Compos. Sci. Technol. 2019, 183, 107825. [Google Scholar] [CrossRef]
- Tsotsis, T.K. Interlayer Toughening of Composite Materials. Polym. Compos. 2009, 30, 70–86. [Google Scholar] [CrossRef]
- Riccio, A.; Russo, A.; Sellitto, A.; Toscano, C.; Alfano, D.; Zarrelli, M. Experimental and Numerical Assessment of Fibre Bridging Toughening Effects on the Compressive Behaviour of Delaminated Composite Plates. Polymers 2020, 12, 554. [Google Scholar] [CrossRef] [Green Version]
- Enayati, M.S.; Neisiany, R.E.; Sajkiewicz, P.; Behzad, T.; Denis, P.; Pierini, F. Effect of Nanofiller Incorporation on Thermome-Chanical and Toughness of Poly (Vinyl Alcohol)-Based Electrospun Nanofibrous Bionanocomposites. Theor. Appl. Fract. Mech. 2019, 99, 44–50. [Google Scholar] [CrossRef]
- Guo, M.; Yi, X. The Production of Tough, Electrically Conductive Carbon Fiber Composite Laminates for Use in Airframes. Carbon 2013, 58, 241–244. [Google Scholar] [CrossRef]
- Guo, M.; Yi, X. Effect of Paper or Silver Nanowires-Loaded Paper Interleaves on the Electrical Conductivity and Interlaminar Fracture Toughness of Composites. Aerospace 2018, 5, 77. [Google Scholar] [CrossRef] [Green Version]
- Guo, M.; Yi, X.; Rudd, C.; Liu, X. Preparation of Highly Electrically Conductive Carbon-Fiber Composites with High Interlaminar Fracture Toughness by Using Silver-Plated Interleaves. Compos. Sci. Technol. 2019, 176, 29–36. [Google Scholar] [CrossRef]
- ASTM D5528-01. Standard Test Method for Mode I Interlaminar Fracture Toughness of Unidirectional Fiber-Reinforced Polymer Matrix Composites; ASTM International: West Conshohocken, PA, USA, 2001. [Google Scholar]
- Daelemans, L.; van der Heijden, S.; De Baere, I.; Rahier, H.; VAN Paepegem, W.; De Clerck, K. Nanofibre Bridging as a toughening Mechanism in Carbon/Epoxy Composite Laminates Interleaved with Electrospun Polyamide Nanofibrous Veils. Compos. Sci. Technol. 2015, 117, 244–256. [Google Scholar] [CrossRef]
- Hunt, C.; Kratz, J.; Partridge, I.K. Cure Path Dependency of Mode I Fracture Toughness in Thermoplastic Particle Interleaf Toughened Prepreg Laminates. Compos. Part A Appl. Sci. Manuf. 2016, 87, 109–114. [Google Scholar] [CrossRef] [Green Version]
- Hojo, M.; Ando, T.; Tanaka, M.; Adachi, T.; Ochiai, S.; Endo, Y. Modes I and II Interlaminar Fracture Toughness and Fatigue Delamination of CF/Epoxy Laminates with Self-Same Epoxy Interleaf. Int. J. Fatigue 2006, 28, 1154–1165. [Google Scholar] [CrossRef]
Scheme 1.
The chemical structures of PEK-C and PSPPP.

Figure 1.
Schematic diagrams of the (a) design principle of the composite and (b) the testing samples.
Figure 1.
Schematic diagrams of the (a) design principle of the composite and (b) the testing samples.

Figure 2.
Optical images of the (a) PEK-C film and (b) PS100 film, and SEM images of (c) the surface of PS100 film, and (d) the fracture surface of PS100 film.
Figure 2.
Optical images of the (a) PEK-C film and (b) PS100 film, and SEM images of (c) the surface of PS100 film, and (d) the fracture surface of PS100 film.

Figure 3.
DSC curves of PEK-C and PS100 films.
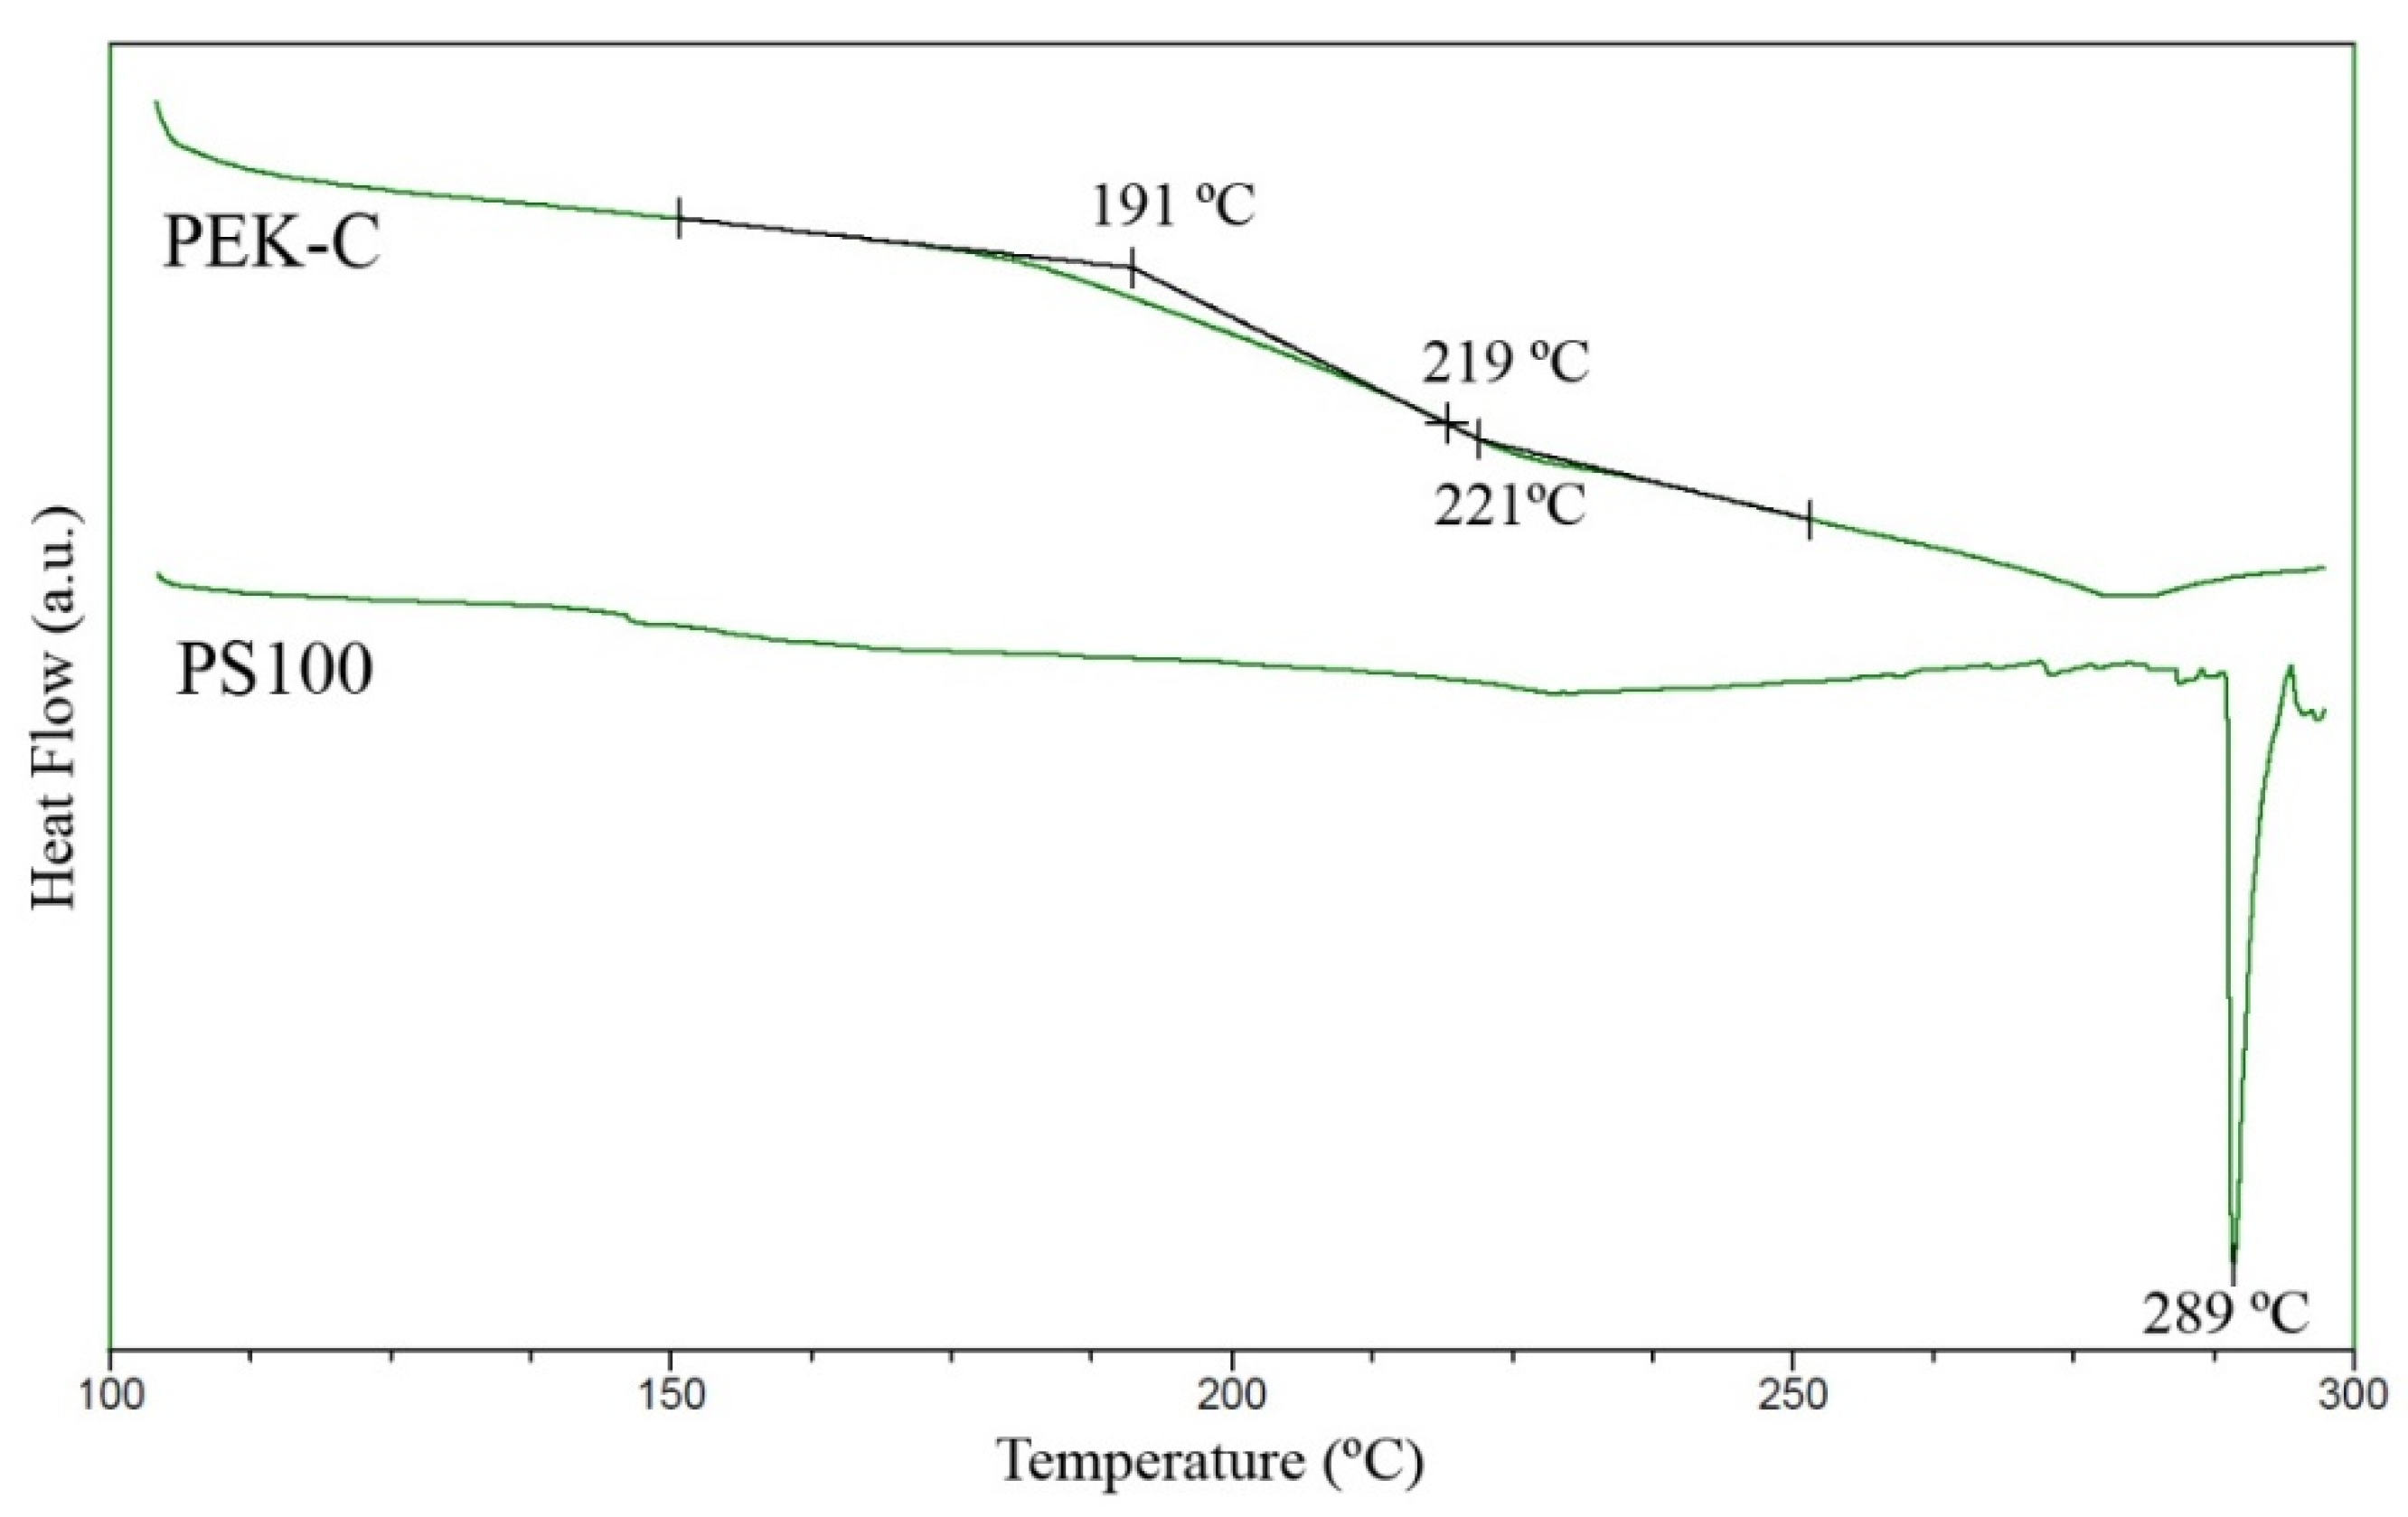
Figure 4.
Tensile curves of PEK-C films and PS100 films.
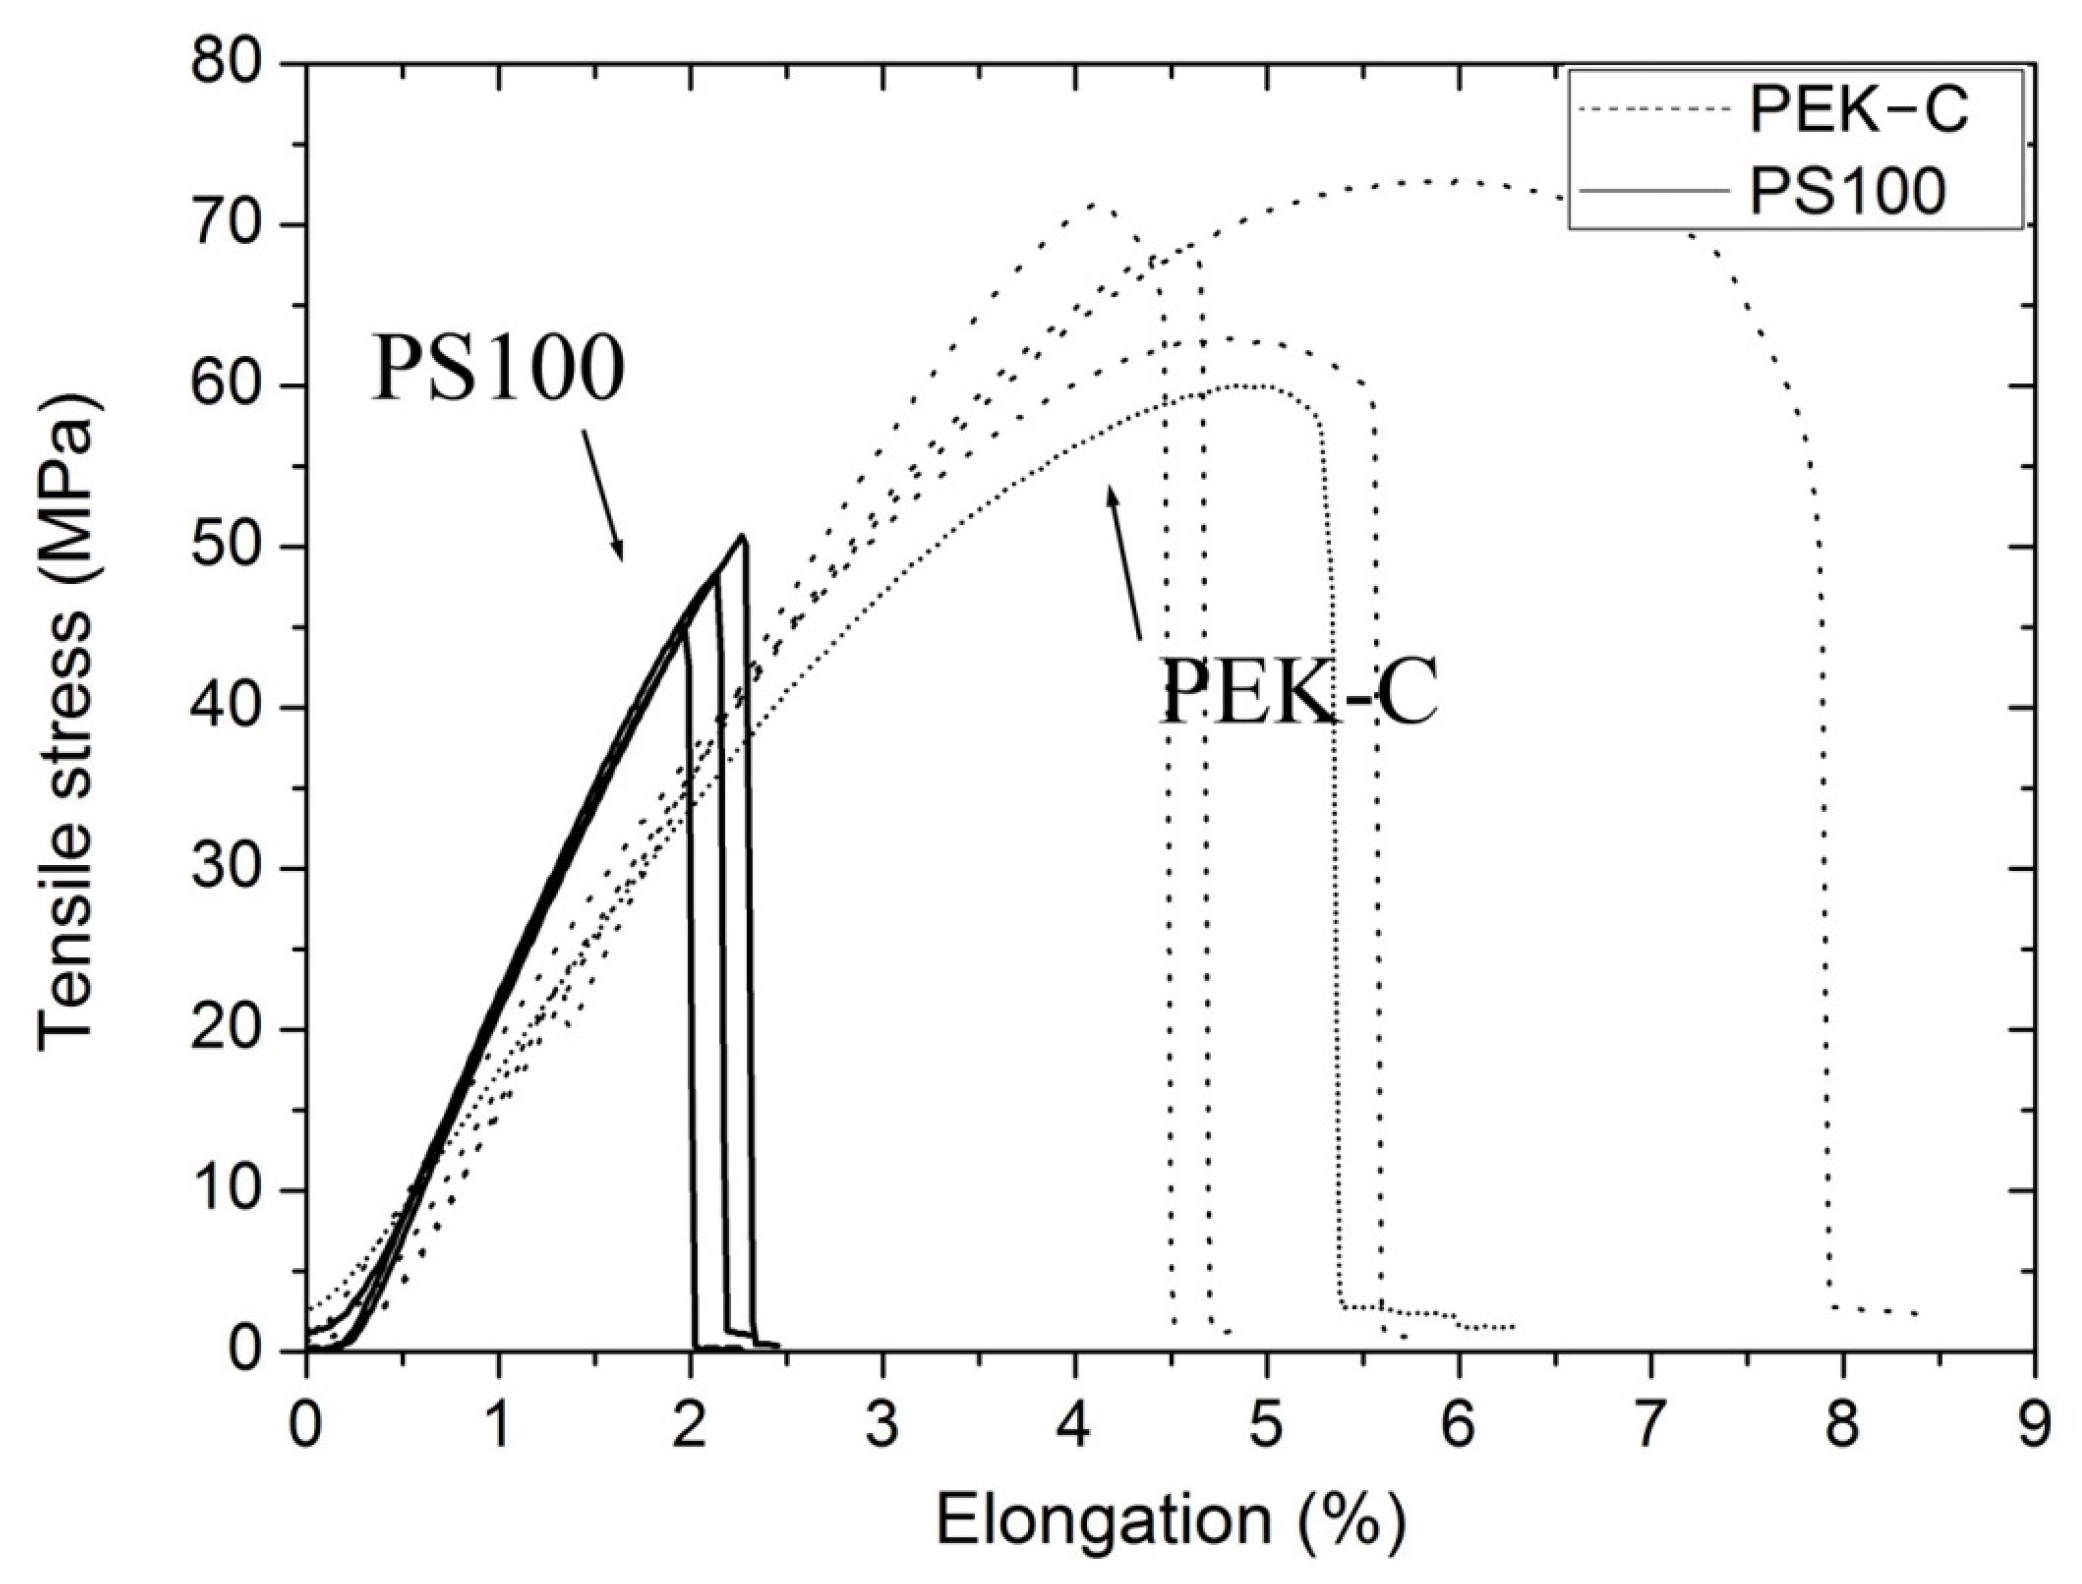
Figure 5.
(a) Typical load–displacement curves of the DCB test, (b) changes of GIC with crack length.
Figure 5.
(a) Typical load–displacement curves of the DCB test, (b) changes of GIC with crack length.
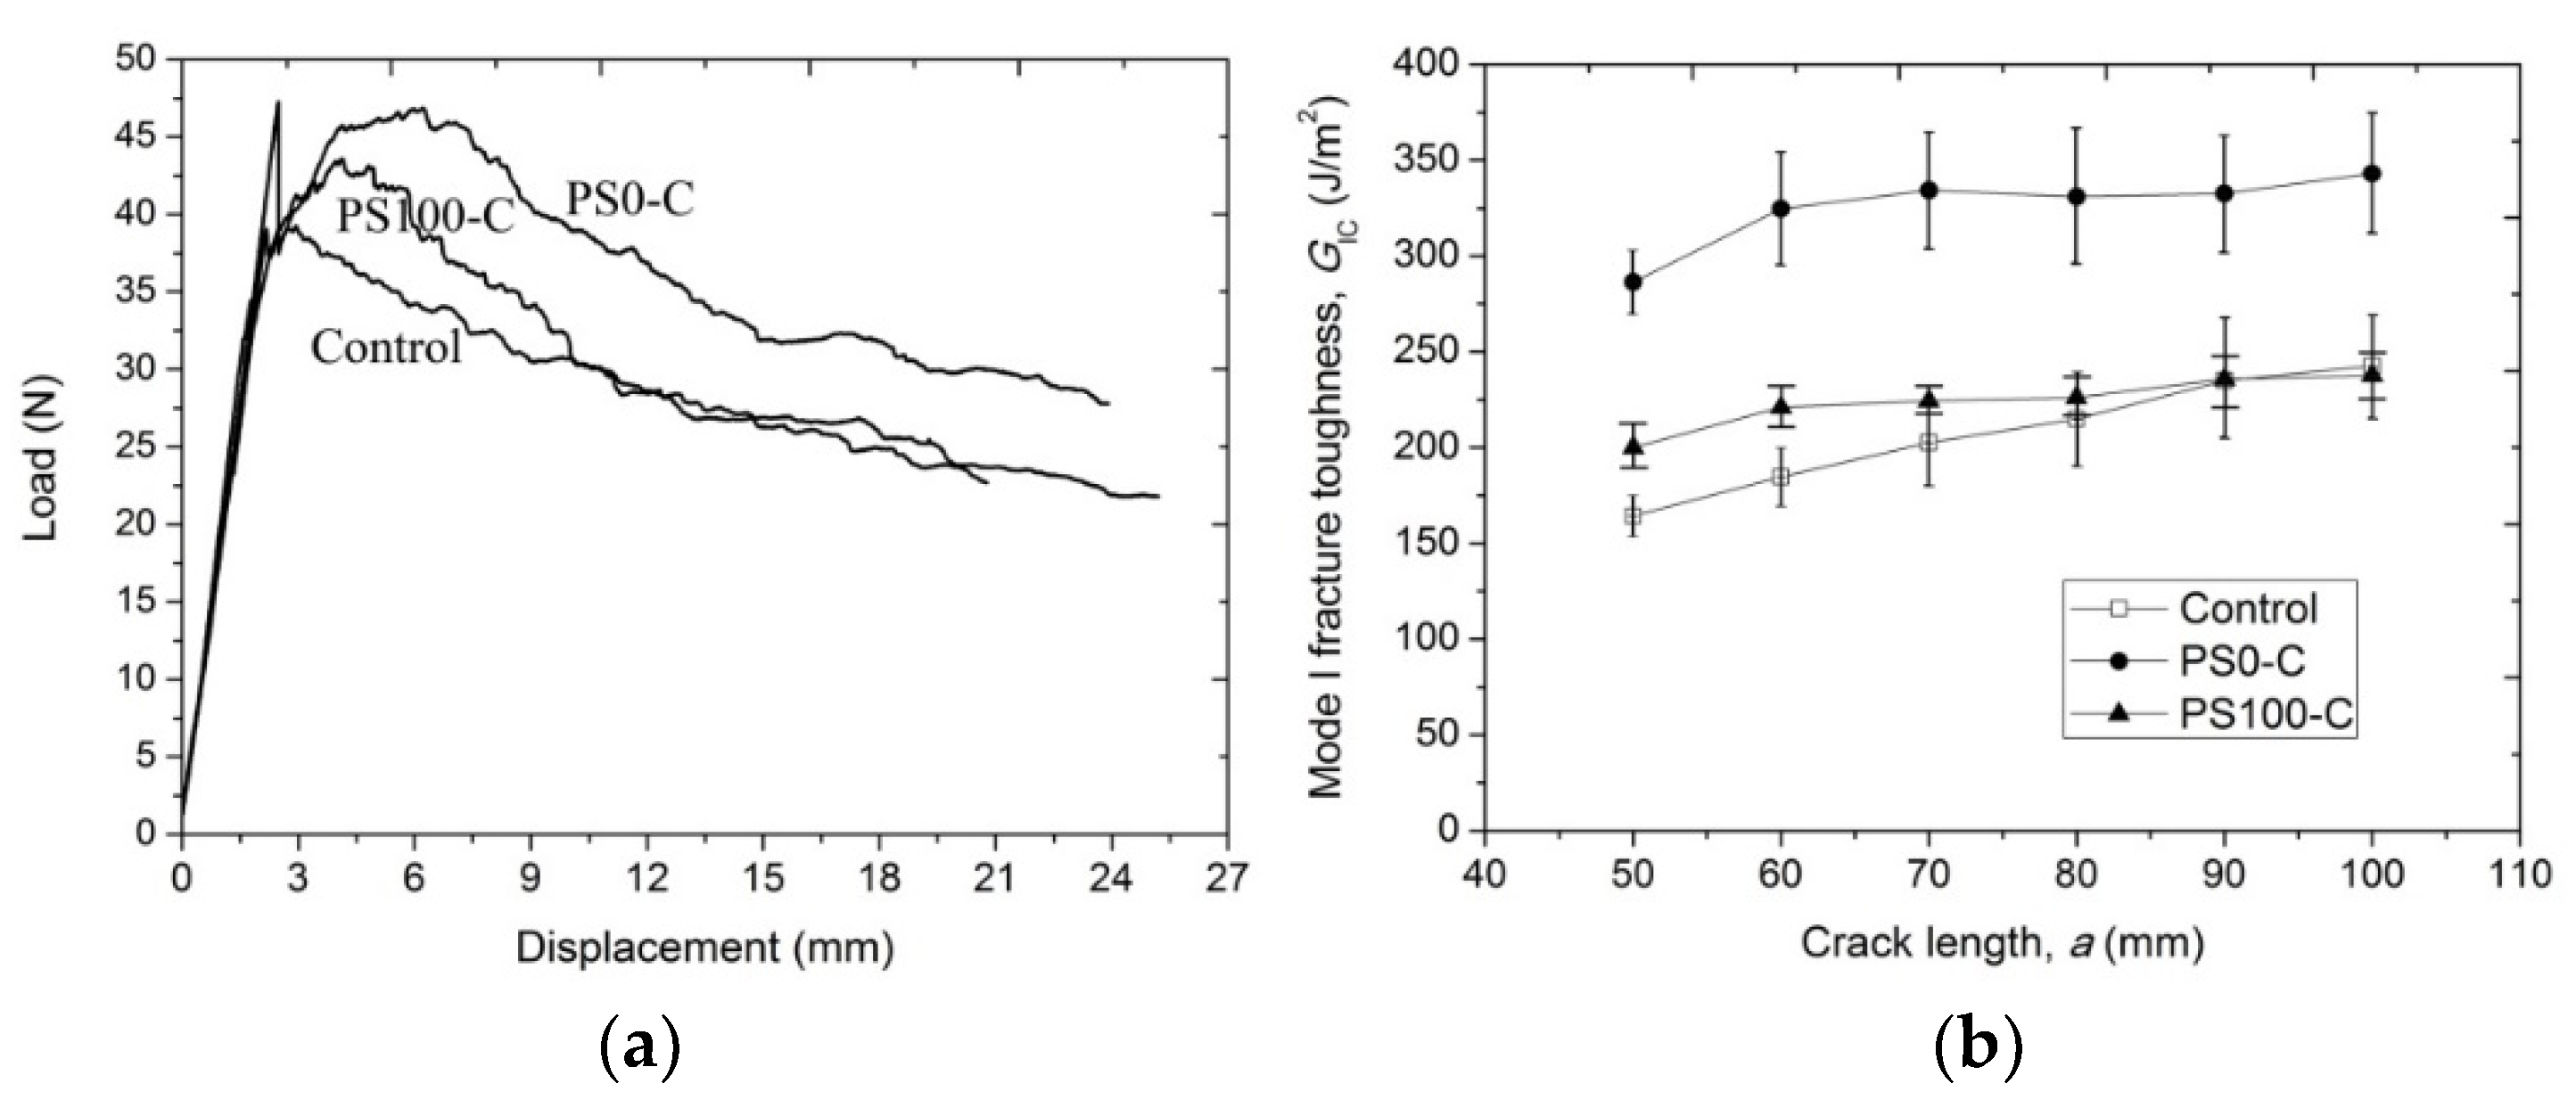
Figure 6.
Typical load–displacement curves of the ENF test.

Figure 7.
SEM images of the mode I fracture surfaces of (a) the control, (b) PS0-C, (c) PS100-C.
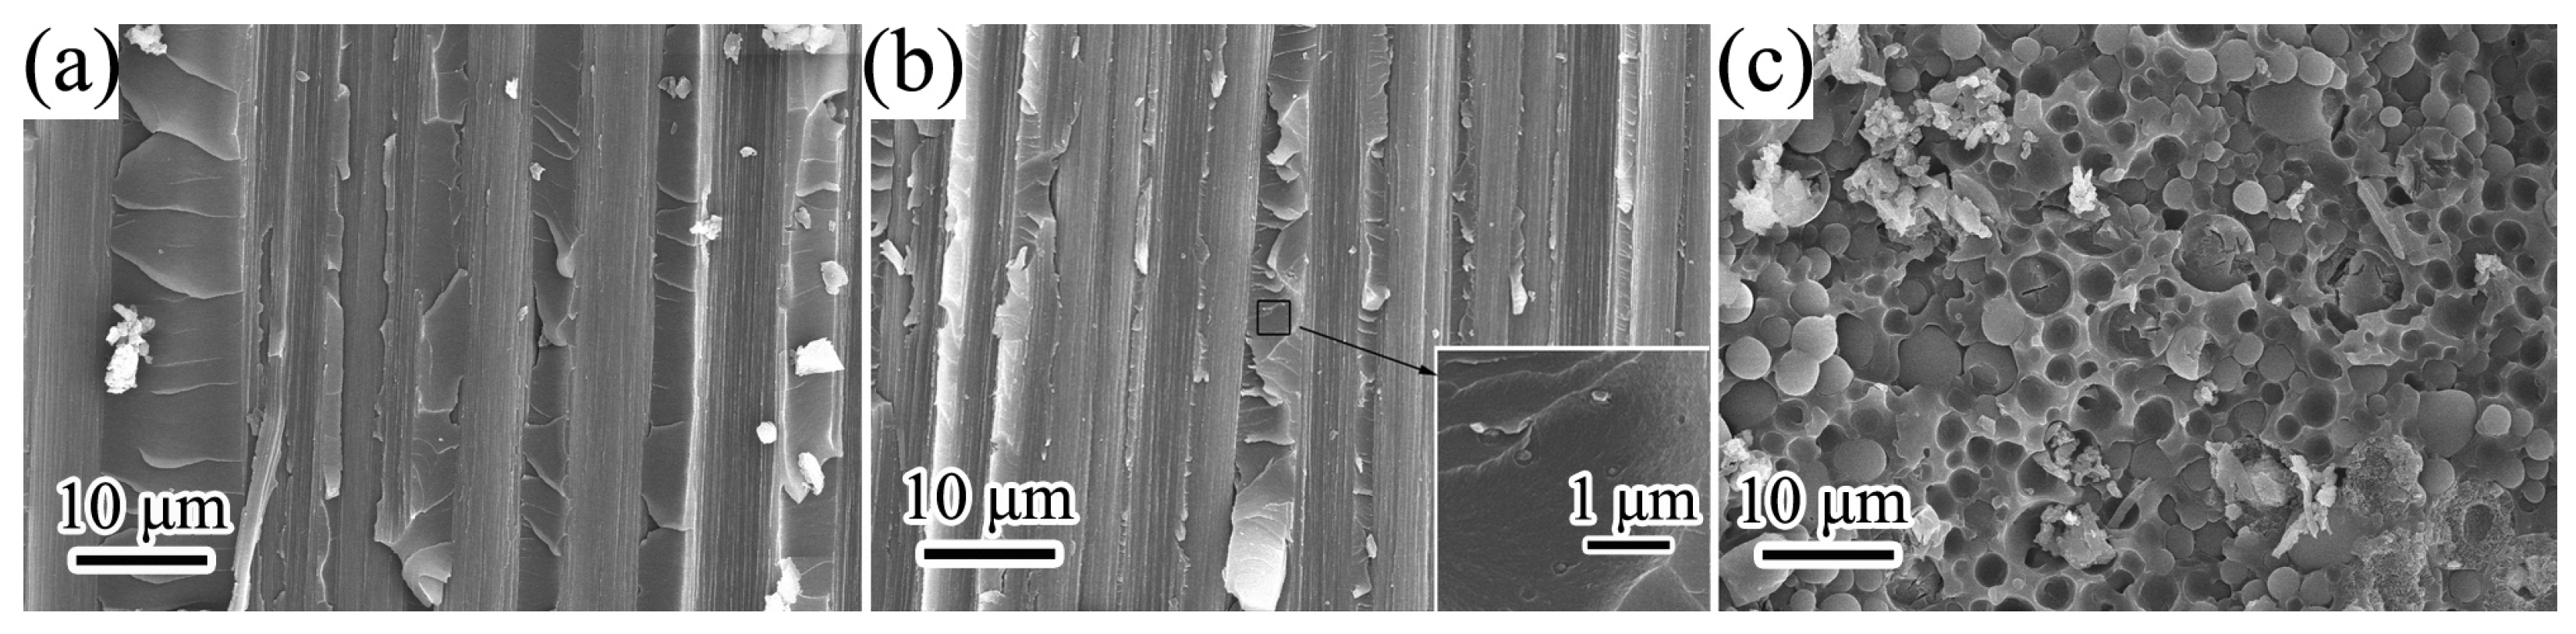
Figure 8.
SEM images of the mode II fracture surfaces of (a) the control, (b) PS0-C, (c) PS100-C.
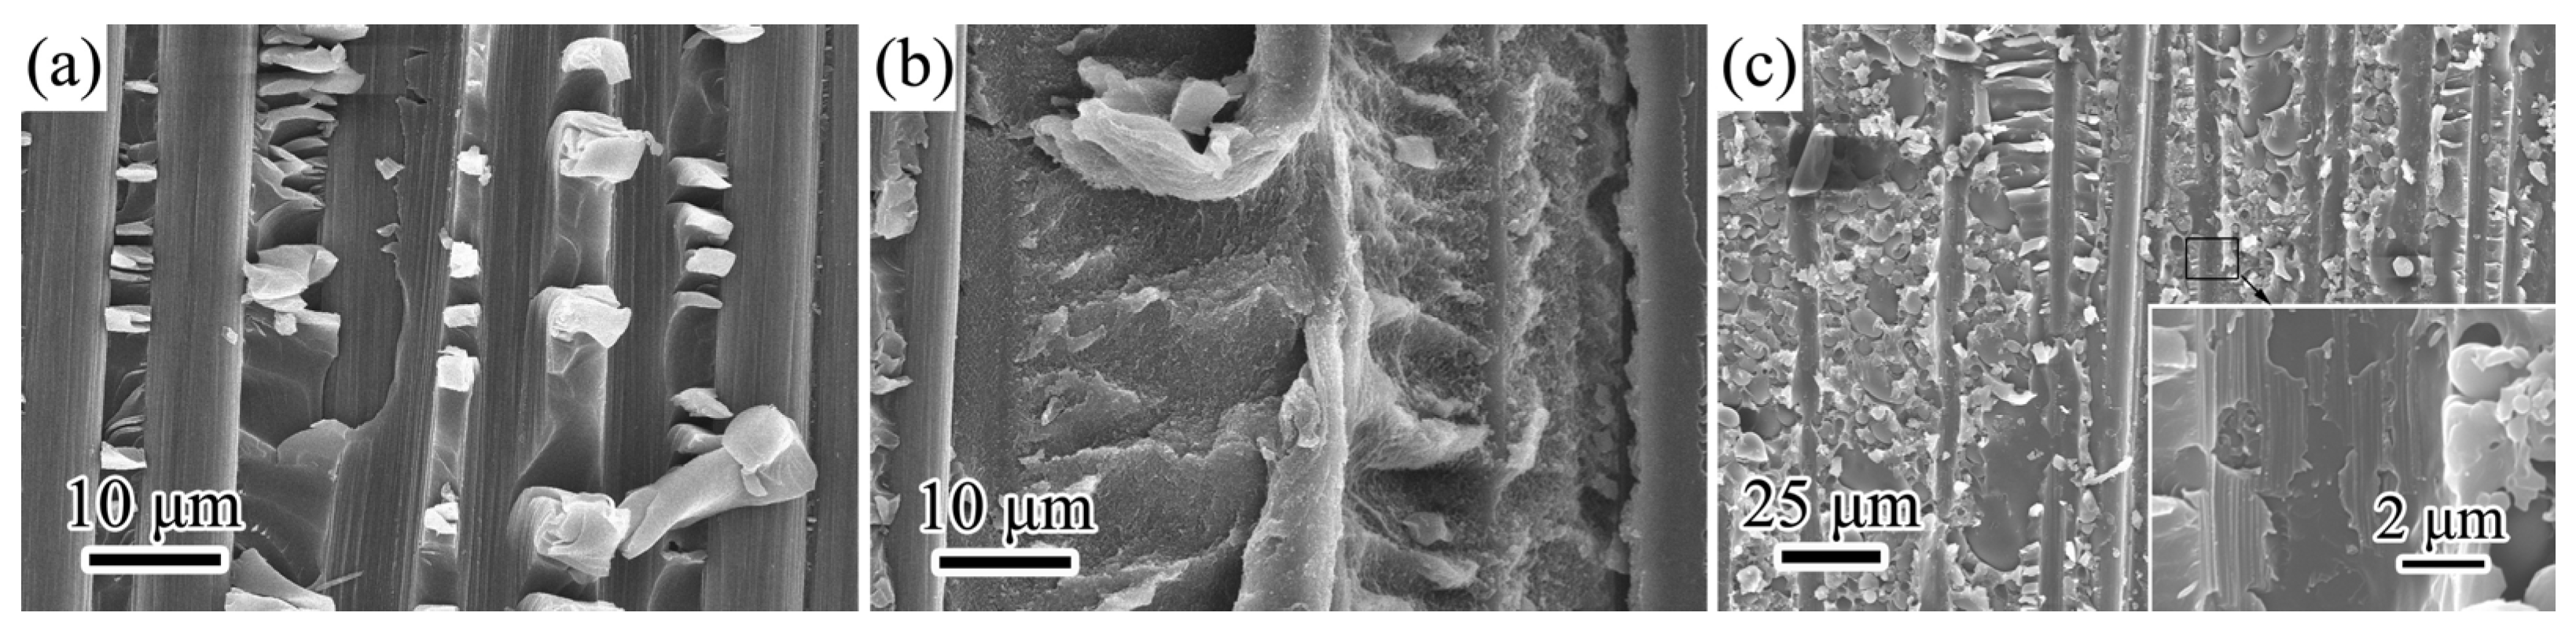
Figure 9.
SEM images of based materials after AO erosion: (a) 6421resin, (b) PEK-C, (c) PS-100.
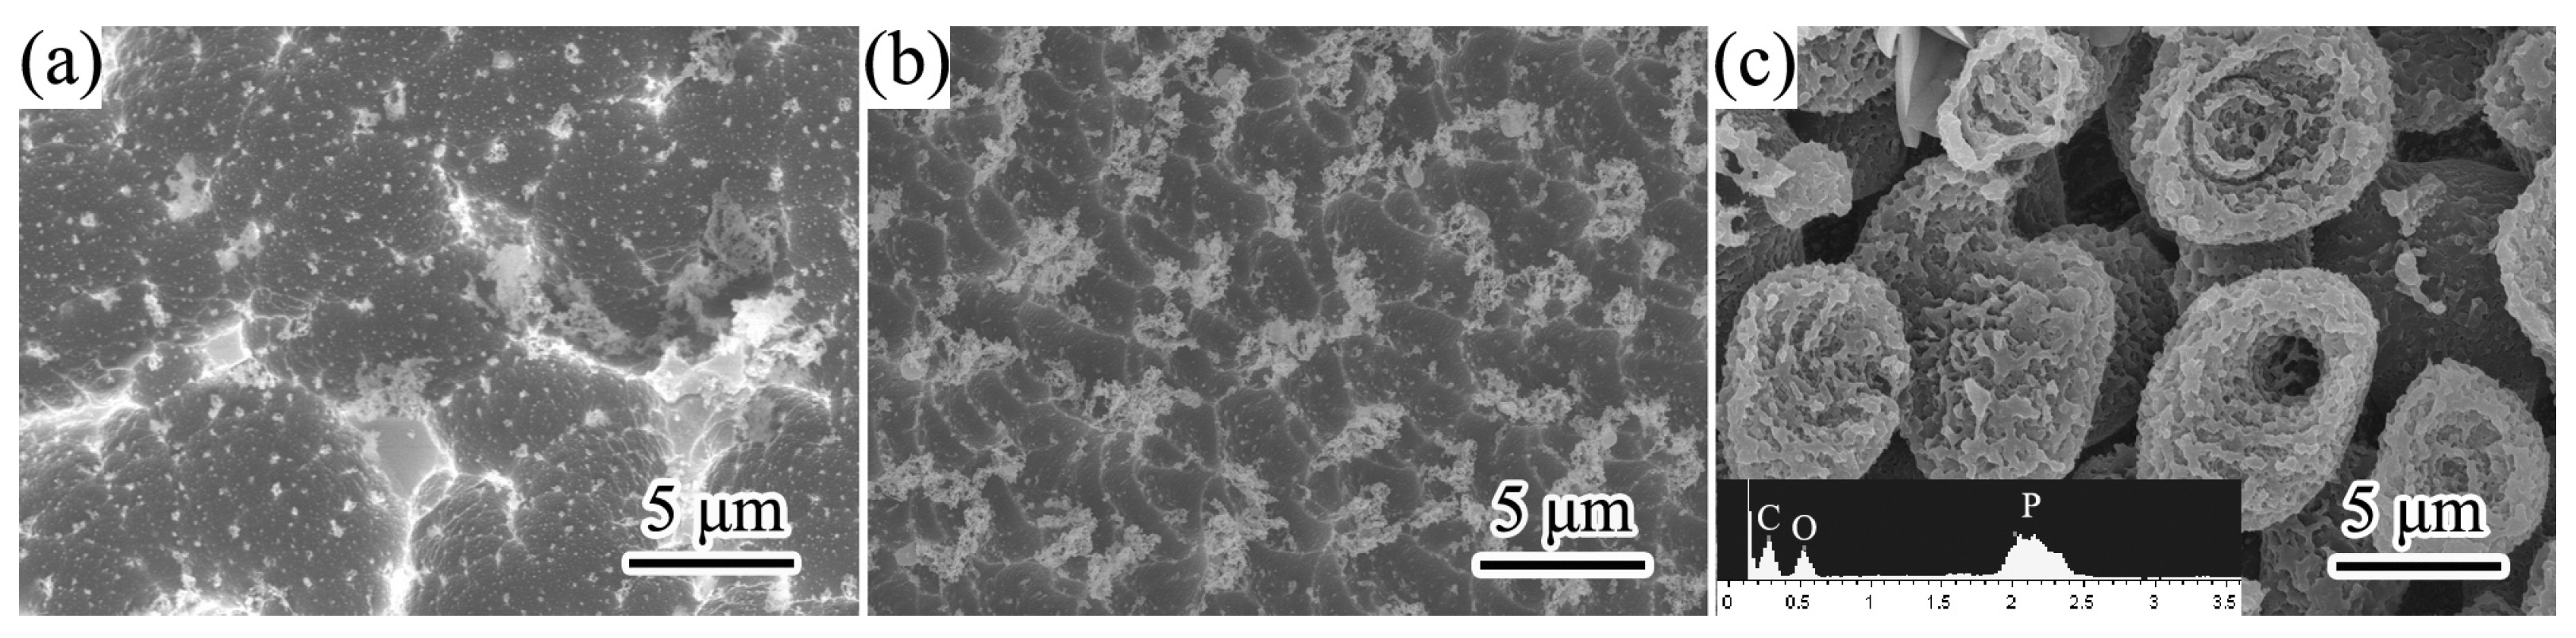
Figure 10.
SEM images of mode I delamination surfaces after AO erosion of the (a) control, (b) PS0-C, (c) PS100-C.
Figure 10.
SEM images of mode I delamination surfaces after AO erosion of the (a) control, (b) PS0-C, (c) PS100-C.
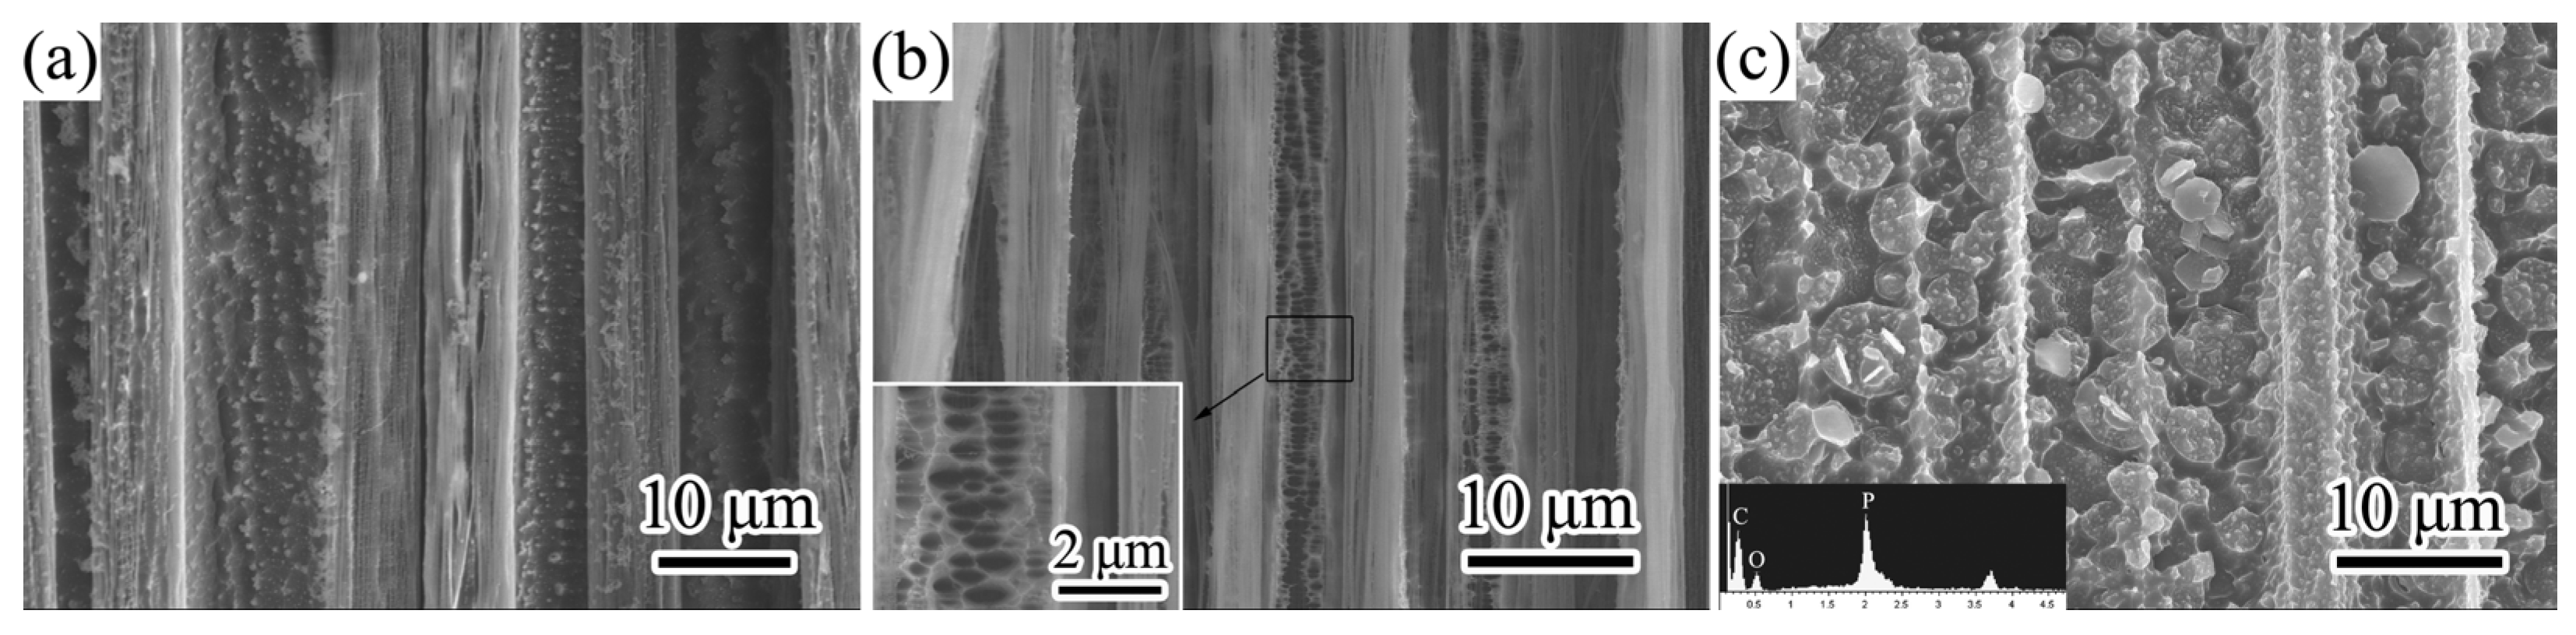
Figure 11.
SEM images of mode II delamination surfaces after AO erosion of the (a) control, (b) PS0-C, (c) PS100-C.
Figure 11.
SEM images of mode II delamination surfaces after AO erosion of the (a) control, (b) PS0-C, (c) PS100-C.


Table 1.
Properties of the film interleaf and abbreviations.
| Film Abbreviation | PEK-C Content | PSPPP Content | Thickness | Composite Abbreviation |
|---|---|---|---|---|
| PEK-C | 100 wt.% | 0 | 25 μm | PS0-C |
| PS100 | 50 wt.% | 50 wt.% | 30 μm | PS100-C |
Table 2.
The interlaminar toughness of the different samples.
| Composites. | Control | PS0-C | PS100-C |
|---|---|---|---|
| GIC/(J/m2) | 207 | 325 | 224 |
| Std. Dev./(J/m2) | 44 | 58 | 20 |
| GIIC/(J/m2) | 556 | 1193 | 688 |
| Std. Dev./(J/m2) | 129 | 85 | 115 |
Table 3.
The AO erosion rate of the composites (×10−24 cm3/atom).
| Composites | Control | PS0-C | PS100-C |
|---|---|---|---|
| Base material | 3.20 ± 0.33 | 2.63 ± 0.52 | 0.50 ± 0.07 |
| Mode I fracture surface | 2.56 ± 0.86 | 4.70 ± 0.81 | 1.40 ± 0.32 |
| Mode II fracture surface | 3.04 ± 0.27 | 6.30 ± 0.76 | 2.09 ± 0.36 |
Publisher’s Note: MDPI stays neutral with regard to jurisdictional claims in published maps and institutional affiliations. |
© 2021 by the author. Licensee MDPI, Basel, Switzerland. This article is an open access article distributed under the terms and conditions of the Creative Commons Attribution (CC BY) license (https://creativecommons.org/licenses/by/4.0/).
Share and Cite
MDPI and ACS Style
Guo, M. Enhancing the Interlaminar Fracture Toughness and AO Resistance of CFRPs by Using Phosphorus-Containing Polymer/PEC-K Bifunctional Film. Aerospace 2021, 8, 365. https://doi.org/10.3390/aerospace8120365
AMA Style
Guo M. Enhancing the Interlaminar Fracture Toughness and AO Resistance of CFRPs by Using Phosphorus-Containing Polymer/PEC-K Bifunctional Film. Aerospace. 2021; 8(12):365. https://doi.org/10.3390/aerospace8120365
Chicago/Turabian StyleGuo, Miaocai. 2021. "Enhancing the Interlaminar Fracture Toughness and AO Resistance of CFRPs by Using Phosphorus-Containing Polymer/PEC-K Bifunctional Film" Aerospace 8, no. 12: 365. https://doi.org/10.3390/aerospace8120365
Note that from the first issue of 2016, this journal uses article numbers instead of page numbers. See further details here.