

Effects of Stroke Amplitude and Wing Planform on the Aerodynamic Performance of Hovering Flapping Wings †

1
Department of Mechanical, Aerospace and Civil Engineering, The University of Manchester, Manchester M13 9PL, UK
2
Aerospace Engineering Department, Faculty of Engineering, Cairo University, Giza 12613, Egypt
*
Author to whom correspondence should be addressed.
†
This paper is an extended version of our paper published in the Proceedings of the AIAA SciTech 2022 Forum, San Diego, CA & Virtual, USA, 3–7 January 2022. https://doi.org/10.2514/6.2022-1056 .
Aerospace 2022, 9(9), 479; https://doi.org/10.3390/aerospace9090479
Submission received: 3 July 2022
/
Revised: 19 August 2022
/
Accepted: 24 August 2022
/
Published: 29 August 2022
(This article belongs to the Special Issue Bioinspired Flying Systems)
Abstract
:In this paper, the effects of stroke amplitude and wing planform on the aerodynamics of hovering flapping wings are considered by numerically solving the incompressible Navier–Stokes equations. The wing planform geometry is represented using a beta-function distribution for an aspect ratio range of 3–6 and a dimensionless radial centroid location range of 0.4–0.6. Typical normal hovering kinematics has been employed while allowing both translational and rotational durations to be equally represented. The combined effects of stroke amplitude with wing aspect ratio and radial centroid location on the aerodynamic force coefficients and flow structures are studied at a Reynolds number of 100. It is shown that increasing the stroke amplitude increases the translational lift for either small aspect ratio or large radial centroid location wings. However, for high aspect ratio or low radial centroid location wings, increasing the stroke amplitude leads to higher lift coefficients during the translational phase only up to a stroke amplitude of 160°. Further increase in stroke amplitude results in reduced translational lift due to the increased wingtip stall effect. For all the cases considered, the lift and drag coefficients of the rotational phase decrease with the increase of stroke amplitude leading to decreased cycle-averaged force coefficients. Furthermore, it is found that the significant reduction in the rotational drag as the stroke amplitude increases leads to a consistently increasing aerodynamic efficiency against stroke amplitude for all aspect ratio and radial centroid location cases.
1. Introduction
Insect flight has received significant research attention in the past few decades due to the unique flight dynamics involved and has inspired numerous developments of small flying robots [1,2,3,4,5,6]. To exploit the benefits of insect-like flight, it is essential to develop adequate understanding of the involved aerodynamics; and thanks to the many and continuous efforts from the different research communities, our current perception of the underlying aerodynamic mechanisms of insect wings has improved significantly. To better classify the different aerodynamic mechanisms, it is instructive to recognise them in relation to when they take place within an insect-like stroke motion. Such stroke typically consists of two translational phases (within the forward and backward half-strokes), as well as two rotational phases, where the wing flips its motion direction (at the start/end of each half-stroke) [7]. In the translational phases, the wing would typically travel at a relatively constant but high angle of attack (AoA), where a leading-edge vortex (LEV) resulting from flow separation at the leading-edge is formed on the upper surface of the wing and persists throughout the translational motion. This persistence of the LEV allows flow reattachment for insect wings operating at high AoA, where classical wings would normally stall, thus augmenting lift production [8,9,10,11,12]. In the rotational phases, the wing rotates and flips the upper and lower surfaces in preparation for the next half-stroke. Several unsteady aerodynamic mechanisms take place during the wing rotational phases, including rotational circulation, added mass, and wake capture, which all result in different forms of force variations that can be significant for certain insect wing motions [10,13,14].
For insect wings, the planform shape has significant influence on the aerodynamic performance [15]. A widely employed setup to study such influence is the revolving wing setup. While revolving wing experimental/numerical setups are simple, they are still valuable in representing the aerodynamic effects within the translational phase of an insect flapping stroke. Usherwood and Ellington [16] were among the first to experimentally study the aerodynamic force production of revolving hawkmoth wing models with aspect ratios ranging between 2.27 and 7.92. They found minor influence of aspect ratio on force coefficient values, but also observed that higher aspect ratios result in higher lift curve slopes. Kruyt et al. [17] experimentally visualised the LEV structures on rectangular revolving wings using Particle Image Velocimetry (PIV). They found that the LEV remains attached up to a distance along the wingspan that is four times of the mean chord length. Further outboard, the LEV is detached and lifted away. Hence, they used this observation to explain the reduced aerodynamic efficiency for wings with aspect ratio greater than four. Broadley et al. [18,19] experimentally measured the aerodynamic force production of revolving insect-like wings at Reynolds number of 104. The effect of wing planform shape was investigated for a wing aspect ratio range between 2 and 4, and a radial centroid location range between 40% and 60% of the wingspan. They found that the lift curve slope decreases with the increase of the area centroid location. Moreover, they showed that the drag coefficient increases with the decrease of aspect ratio. Harbig et al. [20] used Computational Fluid Dynamics (CFD) simulations to study aspect ratio effects on a revolving Drosophila shaped wing planform. They found that the lift coefficient is nearly constant for aspect ratios within 2.9–5.1; however, when aspect ratio further increases to 7.3, the lift coefficient is decreased.
The planform effect has also been investigated using the complete flapping wing setup. Clearly, such setup is more representative as it not only simulates the translational phases of a flapping stroke, but also the rotational phases associated with stroke reversals. Phillips et al. [21,22] experimentally measured the aerodynamic force production of flapping rectangular wings with different aspect ratios. They found that for aspect ratios of three and above, the LEV starts to detach from the wing at approximately 70% of the wingspan near mid half-stroke. However, they also found that the LEV circulatory lift peaks at an aspect ratio of six, but further increase of the aspect ratio results in a reduced lift coefficient due to the increased effect of LEV detachment. Similarly, in the experimental study of Han et al. [23], it was shown that for aspect ratios greater than three, lifting away of the LEV results in reduced lift coefficients, hence lift was deemed to peak at an aspect ratio of three. On the other hand, Luo and Sun [24] used CFD simulations to study the force production of different wing planforms taken from 10 different insect species, with aspect ratios ranging between 2.84 and 5.45. Their results showed only minor differences for the aerodynamic force coefficients of the different wing planforms, hence the effect of aspect ratio was deemed to be small. Shahzad et al. [25] also used CFD to study the effect of wing planform on aerodynamic performance. Lift coefficient values were found to increase with the increase of aspect ratio. Aerodynamic efficiency was also found to increase with aspect ratio, but only within the aspect ratio range of 1.5–2.96, then it started to decrease as aspect ratio was further increased. For more detailed discussions on the effect of aspect ratio on insect wing aerodynamics, the reader is referred to the review paper [26]. While the previous studies have considered flapping wing motions, most of the focus was on translational and global aerodynamics. It is worth noting here that wing rotation/acceleration during stroke reversals can have significant influence on the aerodynamic performance; however, studies/results focusing on aerodynamic force contributions during the rotational phases are limited.
For insect-like flapping motions, the stroke amplitude is a fundamental parameter that varies between the different species. Until now, limited studies have addressed the effect of stroke amplitude on the aerodynamic performance of insect wings with sufficient details. Sane and Dickinson [27] used a model Drosophila wing within a robotic experimental rig to study the aerodynamic force production for different wing kinematics at a Reynolds number of 100. In their experiments, the effect of varying the stroke amplitude was investigated for a range of stroke amplitude between 60° and 180°. Their results showed that, for the wing planform considered, lift is highest at a stroke amplitude of 180° and angle of attack of 50°. Later, Phillips and Knowles [28] also used a robotic flapping apparatus to study the effect of Reynolds number and stroke amplitude on the LEV structures of a model Drosophila wing using PIV. However, they found that for all Reynolds numbers investigated ( = 3850–18,210), the LEV breaks down at a constant stroke amplitude of approximately 132°, whereas for smaller stroke amplitudes, the breakdown of the LEV is suppressed. This observation led them to propose that LEV breakdown depends more on stroke amplitude, rather than Reynolds number. A couple of previous studies have noted that stroke amplitude can play an important role in determining the degree of aerodynamic unsteadiness during the rotational phases. Altshuler et al. [29] experimentally investigated the effect of stroke amplitude on aerodynamic force production of hovering honeybees. By employing the measured wing kinematics of honeybees while artificially modulating the stroke amplitude between 80 and 180, they showed that the transient force peaks during the wing rotational phases decrease with the increase of stroke amplitude up till a stroke amplitude of 135. They concluded that for low stroke amplitudes, unsteady mechanisms during the rotational phases become a much larger contributor to the net upward force required for hovering. Lentink and Dickinson [30] experimentally studied the effect of the dimensionless stroke amplitude, , on the LEV structure and force production for Drosophila wing models. They considered a unidirectional wing motion with infinite and a reciprocal motion with = 3.5. They showed that the attachment state of LEV on the wing was not influenced by ; however, the smaller dimensionless stroke amplitude case contributed to lift augmentation by keeping the LEV close to the wing during the wing rotational phases.
Clearly from the previous studies, for insect-like flapping wings, both the wing planform shape and the stroke amplitude have direct influence on the LEV structure/topology and aerodynamic force production. However, previous studies have primarily focused on either the effect of wing planform for a given stroke amplitude or the effect of stroke amplitude for a given wing planform, but their combined effect on aerodynamic performance has never been investigated. As such, in this study, we aim to provide the most comprehensive investigation, up to date, of the combined stroke amplitude/wing planform effects on inset-like wing aerodynamics. Moreover, we provide detailed comparisons between the relative contributions of both the translational and rotational phases of a flapping stroke to aerodynamic force production, an aspect that is usually overlooked in the literature. To enable our study aims, the wing planform shape was defined using the beta-function distribution, with three aspect ratios (within the range 3–6) and three dimensionless radial centroid locations (within the range 0.4–0.6) being investigated. The stroke peak-to-peak amplitude in this study was chosen to vary between 60°–180°, and its effect was simultaneously investigated with the variation of the wing aspect ratio or radial centroid location. The effects of all these parameters were considered at a Reynolds number of 100, most relevant to small insects such as fruit flies.
2. Methods
2.1. Wing Planform and Kinematics Definitions
The wing planform shape was defined using the beta-function distribution [31], where the wing chord length, , is expressed as:
where is the non-dimensional radial position ( = 0–1 from wing root to tip) and the parameters and are related to the non-dimensional radii of first and second moments of wing area, and , via:
Ellington [31] demonstrated that insect wing planforms, generally, follow the statistical relation: , hence we used this relation to correlate and .
The wing aspect ratio was defined as:
where is the length of a single wing and is the mean geometric chord. Insect wings typically have aspect ratios between two and five, however their aspect ratios are most clustered between three and four [31]. As such, in the current study, we considered aspect ratio values of 3, 4.5, and 6: the first two aspect ratios were chosen because of being closely representative of insect wings, whereas the last aspect ratio represented a maximum value, mainly to demonstrate how aerodynamics changes as the aspect ratio increases. The dimensionless radial centroid location (first moment of the wing area), , was varied between the values 0.4, 0.5, and 0.6, which cover most of planform shapes known for insect wings [31]. In all simulation cases, the pitching axis was set at 25% of the local chord and the wing thickness had a constant value set as 5% of the mean chord length, a representative value from the reported studies in the literature [14,32]. Figure 1 shows the wing planform shapes employed in our simulations.
In the current study, the flapping wing is modelled as a rigid structure, hence the effects of wing flexibility are not considered. For real flapping insects, wing flexibility aspects, e.g., bending and twisting deformations, contribute towards controlling the wing load distribution and are expected to influence the flow structure/topology. That said, it should be noted that several previous studies in the literature have demonstrated that rigid wings are capable of representing the aerodynamics of hovering flapping wings in an acceptable fashion. For example, Zhao et al. [33] experimentally measured the aerodynamic forces on a flapping wing with flexible trailing edge. They showed that decreasing the flexural stiffness of the trailing edge leads to decreased aerodynamic force production, but the lift-to-drag ratio of the wing remains approximately constant. Du and Sun [34] also studied the effects of camber and twist deformations of a hovering hoverfly wing using computational fluid dynamics simulations. They showed that the flexible wing version can produce 10% higher lift compared to a rigid wing version, but the time courses of lift, drag, and aerodynamic power coefficients for a flexible wing were similar to that of the rigid wing counterpart.
It is worth noting here that there have been significant research efforts focusing on the fluid–structure interaction (FSI) problem of flexible flapping aerofoils and wings. These studies provided different insights into insect wing aerodynamics. Toomey and Eldredge [35] and Eldredge et al. [36] numerically and experimentally studied the effect of chordwise flexibility on the aerodynamic performance of 2D aerofoils using a simplified model of rigid sections connected by a hinge with torsional spring. They showed that a mildly flexible aerofoil has better aerodynamic performance compared to its rigid counterpart, when compared over a wide range of kinematic variations [36]. Yin and Luo [37] used FSI simulations to study 2D flexible flapping aerofoils and found that when the mass is small (hence, deformation is mainly due to aerodynamic force), high aerodynamic power efficiency is achieved. Kang and Shyy [38] conducted FSI simulations to study the effect of passive wing rotation on flexible flapping wings, showing that camber deformation can mitigate the negative wing–wake interaction effects and hence results in higher lift production. Nakata and Liu [39] used FSI simulations to investigate the effect of wing flexibility on the aerodynamics of hovering hawkmoths (Manduca Sexta). It was found that while wing flexibility can lead to increased lift, the power cost is also increased. Hence, in total, only a 3.4% increase in aerodynamic efficiency was found for the flexible wing case when compared to the rigid wing case. Shahzad et al. [40] conducted FSI simulations to study flexible hovering flapping wings of different aspect ratios and radial centroid locations. They showed that wing flexibility, for wings with aspect ratios ranging between 4.5 and 6, decreases lift but increases power economy. Notably, Dai et al. [41] also used FSI simulations to study the aerodynamic performance of hovering rectangular flapping wings of an aspect ratio of two and different rigidities. They showed that when the frequency ratio (defined as the ratio of flapping frequency to wing natural frequency) is less than or equal to 0.3, both lift production and efficiency improve. This result was later supported by the numerical studies of Wang and Tian [42] and Sridhar and Kang [43], where despite the difference in adopted approaches, both studies showed that optimum efficiency is evident at frequency ratios of 0.3 and 0.35, respectively. Finally, Kang et al. [44] studied the effects of flexibility on the aerodynamic performance of flapping wings in forward flight. They found that maximum propulsive force occurs while flapping near resonance, whereas optimal propulsive efficiency occurs when flapping at a frequency around half of the wing natural frequency.
The employed flapping velocity waveform had a sinusoidal variation during the acceleration and deceleration phases within a half-stroke, and a constant velocity value in between. Hence, the flapping velocity during stroke reversal was defined using [45]:
where is the maximum flapping velocity; is the non-dimensional time; is the starting time of wing acceleration; and is the non-dimensional acceleration duration. Similarly, the pitching waveform had a sinusoidal variation during stroke reversal while holding a constant angle-of-attack during the wing translational phase. Hence, the pitching angular velocity, during stroke reversal, was defined as [45]:
where is the starting time of wing pitching and is the non-dimensional pitching duration. Here the wing pitch amplitude, , was chosen to allow a 45° AoA at mid half-stroke (known to produce a maximum lift coefficient value [46]). The stroke amplitude (peak-to-peak) values chosen for investigation were 60°, 120°, 160°, and 180°, allowing representative values observed for many insects [7]. Furthermore, the increment in stroke amplitude was chosen to decrease linearly allowing for a more refined investigation as the flapping stroke amplitude approaches its maximum value of 180°. Note that the current study only employed one wing for investigation, hence wing-wing interaction effects were not considered. The non-dimensional acceleration and pitching durations, and , were chosen as 0.25 to produce representative flapping and pitching waveform variations of insect flight, as shown in Figure 2. This choice was based on a previous assessment which showed that varying and has negligible effect on the trends of the average aerodynamic force coefficients [47].
It should be noted here that the current kinematics definition leads to an implicit angular velocity difference between flapping and pitching, i.e., for larger stroke amplitudes, the wing travels a larger stroke angle for the same duration, hence the flapping angular velocity is increased, whereas the wing pitching angular velocity remains the same due to the fixed stroke reversal kinematics. This leads to a relatively smaller wing rotational effect with respect to the wing translational effect for the larger stroke amplitude cases. However, collected kinematics data for real insects, such as the data from Ellington [7] for craneflies, ladybirds, hoverflies, droneflies, and bumblebees, showed that the pitching duration is typically confined within a relatively fixed period near stroke reversal. In addition, the method of unifying a pitching waveform variation while changing the flapping amplitude has been typically employed in previous studies, such as in the work of Altshuler et al. [29].
Finally, the average velocity of the wing taken at , i.e., , was used to define the Reynolds number using the well-known relation:
where is the peak-to-peak flapping stroke amplitude; is the flapping frequency; and is the kinematic viscosity. Note that the frequency was kept constant throughout our simulations, and the kinematic viscosity was always adjusted to ensure a constant Reynolds number for a given stroke amplitude and wing planform.
2.2. Numerical Simulation
The incompressible Navier–Stokes equations, that assume constant viscosity, were solved for the fluid flow around the investigated 3D wings:
where represents the flow velocity vector; represents the Cartesian position vector; denotes time; denotes pressure; and denotes density. The above equations were handled using the open-source package OpenFOAM with a cell-centred finite volume method. For the incompressible flow, a combined PISO (Pressure–Implicit with Splitting of Operators) and SIMPLE (Semi-Implicit Method for Pressure Linked Equations) algorithm known as PIMPLE was used to solve the pressure-velocity coupling [48,49]. Second order schemes were employed for both spatial gradient and time evolution terms. The pressure equation was solved using the GAMG (Geometric–algebraic Multi Grid) method, and the velocity equation was solved using the Gauss–Seidel method.
The computational domain consisted of an outer spherical domain surrounding an inner spherical domain with the wing located at its origin. The outer and inner domains were linked using a spherical sliding interface. At the far-field boundary of the outer domain, uniform fixed zero values for gauge pressure and velocity gradient were applied. At the wing surface, a no-slip boundary condition was applied. The inner sphere had a radius of 36 and the outer sphere had a radius of 40. Hexahedra and split-hexahedra cells were generated using the blockMesh and snappyHexMesh utility of OpenFOAM. The computational domain and mesh setup are demonstrated in Figure 3. Note that throughout the simulations, the inner domain rotated about the origin to produce the required wing motions, whereas the outer domain was kept stationary. Flow variables were interpolated at the sliding interface using an inverse distance algorithm. This allowed the required wing rotations without mesh deformation or re-meshing, hence ensured high-quality mesh throughout the simulations.
In this work, the instantaneous lift and drag coefficients were obtained using the classical relations:
where and are the instantaneous lift and drag forces, and is the wing area. The average lift and drag coefficients over a period from to were defined as:
Hence, the cycle averaged coefficients, and , were obtained by taking = 4 and = 5 (Note that, investigations in this study were for the fifth stroke cycle to ensure that the effect of initial disturbances, typically evident in the first few cycles, are damped); the averaged coefficients during the wing translational phase, and , were obtained by taking = 4.125 and = 4.375; and the averaged coefficients during the wing rotational phase, and , were obtained by taking = 4.375 and = 4.625. Moreover, the aerodynamic efficiency was assessed using the “power factor” metric for general wing motions, using the definition provided in [50]:
where is the average power coefficient over a flapping cycle, , and is the aerodynamic power.
To further investigate the distribution of the aerodynamic force along the wing length, the sectional normal force coefficient, , was defined at different spanwise sections of the wing. This coefficient at a given spanwise location, , was obtained using the following equation:
where is the pressure on the lower/upper wing surface along the local dimensionless chordwise coordinate, . The vortical structures of the simulated flows were identified using the well-known Q-criterion [51], which represents the contributions of the antisymmetric and symmetric components of the velocity gradient tensor such that a positive value of the Q-criterion indicates regions dominated by rotation. Here, the Q-criterion, , was scaled using the following equation:
Finally, for our simulations, mesh systems with approximately 2.3–3.7 million cells were chosen, depending on the wing planform geometry simulated. The cells close to the wing surface were refined by subdivision, resulting in approximately 48,000–97,000 nodes on the wing surface. The time step size, t, was set as 1e-3 (relative to the flapping cycle). This simulation setup was decided based on a convergence assessment for the mesh and time step sizes. Moreover, the accuracy of the numerical solver has been validated against a number of benchmark experimental and numerical data from literature. The convergence assessment and validations of our numerical method were comprehensively presented in our previous work [50], hence are not repeated here for brevity.
3. Results and Discussion
3.1. Effect of Aspect Ratio
The investigation provided in this section considers the sole effect of aspect ratio, while fixing the stroke amplitude value to = 160° and the dimensionless radial centroid location value to = 0.5. The normal force coefficient distribution along the wingspan for the different aspect ratio wings throughout a half-stroke are shown in Figure 4. A clear distinction is evident regarding the aerodynamic force production at the different spanwise locations. For all aspect ratios, it is found that the normal force coefficient increases throughout = 4.7–4.9 for the sections close to the wing root, whereas for the section closest to the wingtip, the normal force coefficients decrease during the same period. On the other hand, at stroke reversal, = 5.0, the normal force coefficients become negative for all sections except the ones closest to the wing root, where remains small and positive. Notably, Figure 4 shows that for all aspect ratios, the sections near the wingtip tend to show a drop in normal force coefficient after mid half-stroke, i.e., = 4.8–4.9. This drop in normal force coefficient is related to wingtip stall effects which lead to loss of aerodynamic force production [50]. In Figure 4, the sections that show drop in normal force coefficient after mid half-stroke, i.e., when the normal force coefficient at = 4.9 becomes lower than that at = 4.8, are marked with the grey areas. The grey area region is found to increase from 31% to 57% of the wingspan as the aspect ratio increases from three to six. This confirms that higher aspect ratio wings are more susceptible to wingtip stall effects.
Figure 5 shows the surface pressure coefficient and flow structures at different time instances within a half-stroke for the different aspect ratio cases. For all aspect ratios, the LEV, the trailing-edge vortex (TEV), and the tip vortex (TV) quickly roll-up and stay close to the wing surface following the start of the half-stroke ( = 4.6–4.7). The LEV has larger size towards the wingtip, resulting in a conical shaped structure attached to the wing leading edge. At the end of the half-stroke = 5.0, the LEV is found to detach from the wing surface, and a region of high-pressure coefficient is found near the wingtip due to the wake capture effect. For = 4.5 and 6 cases, two notable differences in the flow structures are found compared to the = 3 case: (1) the LEV splits at approximately 60–70% of the wingspan at = 4.6; and (2) the LEV decreases in size near the wingtip at = 4.8–4.9, indicating detachment of the LEV near the wingtip for the higher aspect ratio cases.
The effect of aspect ratio on the average aerodynamic force production is shown via Figure 6. Here, to demonstrate the relevance of the different stroke stages, the averaging of the force coefficients was conducted over different periods including the whole flapping stroke, i.e., and ; the translational phase only, i.e., and ; and the rotational phase only (stroke reversal), i.e., and . The results show that the intermediate aspect ratio wing, = 4.5, leads to the highest average lift coefficient during the translational phase, , whereas both the = 4.5 and 6 wing cases result in the same average lift coefficient during the rotational phase, . Hence, the global average lift coefficient, , has its maximum value at = 4.5; that said, the difference between = 4.5 and 6 is negligibly small. Similarly, the average drag coefficient during the translational phase, , reaches its highest value at = 4.5. However, the average drag coefficient during the rotational phase, , is more dominant and decreases with the increase of aspect ratio, resulting in a consistently decreasing average drag coefficient, , with aspect ratio.
The current results on the effect of aspect ratio supports some of the insights from previous experimental and numerical studies [17,20,21,22,23,25], i.e., when aspect ratio increases, the LEV tends to breakdown and detach near the wingtip, which leads to reduced lift production, hence intermediate aspect ratios are a good choice when lift coefficient is concerned. However, here, we further show that the detachment of LEV for high aspect ratio wings mainly influences force production during the translational phase; for the rotational phase, increasing the aspect ratio results in minor differences in lift coefficient, but decreases the drag coefficient. This decrease in drag coefficient during the rotational phase is influential as it leads to a pronounced decrease in the overall drag coefficient with the increase of aspect ratio, for the cases considered in this study.
3.2. Interaction Effect of Stroke Amplitude and Aspect Ratio
In this section, the interaction effect of stroke amplitude and aspect ratio is investigated by varying the stroke amplitude for the different aspect ratio cases. The instantaneous lift and drag coefficients for these cases are shown in Figure 7. For all aspect ratios, the small stroke amplitude case ( = 60°) shows obvious peaks in lift/drag coefficients during the rotational phase, which are less obvious/negligible for the larger stroke amplitude cases. This indicates a higher wing rotational effect (hence unsteadiness) on aerodynamic force production for small stroke amplitude cases. During the translational phase, it is found that a higher stroke amplitude leads to faster growth of the lift coefficient, i.e., the lift coefficient reaches a stable value earlier during the translational phase. Hence, a higher stroke amplitude leads to higher lift coefficient values, but the difference between the various stroke amplitudes, becomes small/negligible at the end of the translational phase, Figure 7.
The average lift/drag coefficient and power factor values are further shown in Figure 8. For the small and intermediate aspect ratio cases, = 3 and 4.5, increasing the stroke amplitude increases the average lift coefficient during the translational phase, . For the aspect ratio case, = 6, first increases with the stroke amplitude until = 160°, and then decreases slightly when the stroke amplitude further increases to = 180°. On the other hand, the average lift coefficient during the rotational phase, , is found to decrease with the increase of the stroke amplitude for all aspect ratios. In fact, the variation of is more pronounced; hence, the global average lift coefficient, , decreases with the increase of stroke amplitude for all aspect ratios. This said, the variation of with stroke amplitude for = 120–180° is small. The average drag coefficient during the translational phase, , is found to first decrease with the increase of stroke amplitude until = 120°, and then keeps relatively constant. On the other hand, the average drag coefficient during the rotational phase, , is found to decrease with the increase of stroke amplitude for all aspect ratios, and again, the variation of is more evident. As such, the overall effect is that the global average drag coefficient, , decreases consistently with the increase of stroke amplitude. Notably with the increase of stroke amplitude, the decrease in the average drag coefficient, , is larger than the decrease in the average lift coefficient, . This results in increased values, hence aerodynamic efficiency, with the increase in stroke amplitude for all aspect ratios considered. However, the increase in with the stroke amplitude becomes smaller when the aspect ratio gets higher.
For all the aspect ratios considered, the aerodynamic force coefficients during the wing rotational phase decrease consistently with the increase of stroke amplitude. The reduced lift and drag coefficients during the wing rotational phase are due to the reduced wing pitching angular velocity with respect to the flapping angular velocity, hence a smaller wing rotational effect with respect to the wing translational effect for the larger stroke amplitude cases. Notably, the contribution of the wing rotational effect is also a function of the wing kinematics, i.e., a smaller wing rotation duration will lead to larger wing pitching angular velocity relative to the translational velocity and vice versa. As such, the contribution of wing rotational effect to the global aerodynamic force is defined by the combined effect of the stroke amplitude and the wing rotation duration. However, for real insect cases, the available data within the literature show no obvious relationship between the wing pitching duration and the stroke amplitude. In fact, a typical insect wing generally has its pitching rotation confined near stroke reversals, with supination or pronation durations lasting 10–20% of a full stroke [7] and can reach up to 30% for some insect species [52]. This suggests that insects may rely more on stroke amplitude to modulate the relative contribution of the rotational and translational effects for aerodynamic force production. In fact, there are some experimental studies showing that honeybees [29] and bumblebees [53] can change their stroke amplitude up to 50% in response to environmental changes, e.g., air density change, to modulate aerodynamic force production.
The flow evolutions of the different stroke amplitude cases near the middle and end of the half-stroke ( = 4.7 and 4.9) for the = 3, 4.5, and 6 cases are shown in Figure 9a–c. These time instances are chosen to best represent the LEV development process. Generally, in most cases, the = 60° flow structures show a closely attached LEV near the middle and end of a half-stroke; however, for the larger stroke amplitude cases, = 120–180°, a more developed LEV at the same time instances is found, which is detached near the wingtip near the end of a half-stroke. This is consistent with the variations in the force coefficients shown in Figure 7, where the larger stroke amplitude cases showed faster reach to a stable value in lift coefficient during the translational phase. It is also noted that when the stroke amplitude increases, the LEV detachment region near the wingtip increases for the = 6 cases. This was the reason behind the observed decrease in the average translational lift for the highest aspect ratio case at the largest stroke amplitude, shown in Figure 8.
The results, shown in this section, indicate that increasing the stroke amplitude increases the LEV development rate, hence the lift coefficient during the translational phase. However, this effect is countered by the effect of LEV detachment near the wingtip, which leads to reduced lift production for high stroke amplitudes. Nevertheless, since increasing the aspect ratio also leads to faster development of the LEV, the stroke amplitude for maximum translational lift decreases with the increase of aspect ratio. Therefore, for a given aspect ratio, the optimum stroke amplitude for translational lift should be large enough for the LEV development, whilst keeping the wingtip detachment effect small. For example, for the small aspect ratio case, = 3, no obvious detachment of the LEV is evident throughout the translational phase, hence the average translational lift coefficient increases with the increase of stroke amplitude; whereas, for the high aspect ratio case, = 6, it is found that the optimum stroke amplitude for translational lift is 160°, and further increasing the stroke amplitude leads to decreased average translational lift coefficient, Figure 8.
Notably, the interaction effect of aspect ratio and stroke amplitude can be correlated to the mean dimensionless stroke amplitude, , proposed by Ellington [54] (Note that is the dimensionless stroke amplitude, , proposed by Lentink and Dickinson [30], scaled by a factor of 0.5). Ellington showed that for typical hovering insect wings, falls within a range between three and six [54]. This supports the results for optimum translational lift found in the current study: small aspect ratio wings can benefit from larger stroke amplitudes, whereas large aspect ratio wings are constrained to a maximum stroke amplitude for optimum lift production. On the other hand, the current results also show that rotational drag significantly increases at small aspect ratio and stroke amplitude. This implies that insects with small aspect ratio wings while operating at small stroke amplitudes may rely more on the ‘drag based’ kinematics, rather than the ‘lift based’ kinematics for flight weight support.
3.3. Effect of Radial Centroid Location
In this section, the effect of the radial centroid location on aerodynamic force production is investigated, while fixing the stroke amplitude value to = 160° and the aspect ratio to its intermediate value of = 4.5. The normal force coefficient distributions along the wingspan throughout a half-stroke are shown in Figure 10. Again, for all radial centroid location cases, throughout = 4.7–4.9, the sections close to the wing root show continuously increasing normal force coefficient, whereas for the section closest to the wingtip, the normal force coefficients decrease. In Figure 10, the wing sections that have a decreasing normal force coefficient after mid half-stroke, i.e., when the normal force coefficient at = 4.9 becomes lower than that at = 4.8, are marked with the grey areas. It is evident that with the increase of the dimensionless radial centroid location from 0.4 to 0.6, the grey area region is decreased from 53% to 30% of the wingspan. This confirms that smaller radial centroid location wings are more susceptible to wingtip stall effects due to the smaller wing area near the wingtip.
The LEV structures at the different time instances for the dimensionless radial centroid locations = 0.4 and 0.6 are shown in Figure 11. Note that the same demonstration for the dimensionless radial centroid location of = 0.5 was previously shown in Figure 5b. The flow structures in Figure 11 show that the smaller radial centroid location results in earlier detachment of the LEV near the wingtip and that increasing the radial centroid location results in less LEV detachment, which is consistent with the reduced wingtip stall effects for the larger cases shown in Figure 10. Interestingly, the current results are consistent with the numerical study of Bhat et al. [55] for revolving wings, where an evolutionary optimization framework was employed to find the optimal planform shapes with respect to lift coefficient values. Their results showed that the optimum wing shapes have larger area near the wingtip, with dimensionless radial centroid locations varying between 0.68–0.71 for the different aspect ratios considered.
The average lift and drag coefficients for the different radial centroid location cases are presented in Figure 12. The results show that the average lift coefficient during the translational phase, , is highest for the intermediate dimensionless radial centroid location, = 0.5. Note that, although the wingtip stall effect is reduced for higher cases, the formation of LEV also gets delayed with the increase in [50]. Hence, the average translational lift for the highest case of 0.6 is in fact lower than the intermediate case of 0.5. Furthermore, increasing leads to a decreased average lift coefficient during the rotational phase, . As such, the global average lift coefficient values, , for both the = 0.4 and = 0.5 cases are similar, whereas the case = 0.6 results in the lowest . On the other hand, all average drag coefficient values (translational, rotational, and global) decrease consistently with the increase of radial centroid location.
3.4. Interaction Effect of Stroke Amplitude and Radial Centroid Location
The instantaneous lift and drag coefficients for the different stroke amplitudes and the three radial centroid locations considered in this study are shown in Figure 13. Here, for all results shown in this section, the aspect ratio is fixed at 4.5. The results show that for the smallest stroke amplitude value of = 60°, clear peaks of lift and drag coefficients are found during the wing rotational phase. It is also noted that increasing the radial centroid location tends to reduce the initial peak values. From Figure 13, the small dimensionless radial centroid location cases of 0.4 show notable differences in instantaneous lift and drag coefficients when compared with = 0.5 and 0.6 cases, as fluctuations in the force coefficients are found at the beginning of the wing translational phase for cases with stroke amplitudes greater than 120°. However, these fluctuations in lift and drag coefficients are not observed for the small stroke amplitude case with = 60°.
The average lift/drag coefficients and power factor values for the different stroke amplitude and radial centroid location cases are shown in Figure 14. For the small dimensionless radial centroid location case = 0.4, increasing the stroke amplitude first increases the average lift coefficient during the translational phase until = 160°; however, when the stroke amplitude further increases to = 180°, is slightly reduced. On the other hand, for = 0.5 and 0.6, increasing the stroke amplitude increases the average lift coefficient during the translational phase. For all radial centroid location cases, increasing the stroke amplitude decreases the average lift coefficients during the rotational phase, which leads to a decreased global average lift coefficient, , with the increase of stroke amplitude. On the other hand, the average drag coefficient during the translational phase, , generally decreases with the increase of stroke amplitude, but the variation of is small for the different stroke amplitude cases. However, significant decrease in the average drag coefficient during the wing rotational phase, , is found for all radial centroid location cases, which results in reduced global average drag coefficients, , with the increase of stroke amplitude. Finally, the aerodynamic efficiency, , is found to increase with the increase of stroke amplitude for all radial centroid locations, due to the larger decrease in the drag coefficient as the stroke amplitude increases.
Figure 15a,b show the flow evolutions of the different stroke amplitude cases near the middle and end of the half-stroke ( = 4.7 and 4.9) for the cases with = 0.4 and 0.6, respectively. The flow evolutions for = 0.4 cases show that at = 4.7, the LEV starts to detach from the wing surface near the wingtip. Moreover, at = 4.9, with the increase of stroke amplitude, the detachment/shedding region increases. On the other hand, Figure 15b shows no obvious detachment of the LEV at = 4.7 for the = 0.6 cases. However, at = 4.9, a similar trend of increased LEV detachment/shedding region near the wingtip is found for larger stroke amplitude cases.
The observed trend of flow evolution with stroke amplitude is similar to the different aspect ratio cases described in Section 3.2, i.e., for larger stroke amplitudes, the wing travels a larger distance within the same duration, which leads to a more developed LEV, and this leads to a higher lift coefficient during the wing translational phase for larger stroke amplitude cases. However, this effect is countered by the effect of wingtip stall which reduces the lift production near the wingtip. It is found that for larger radial centroid location cases, the larger wing area at the outboard wing serves to sustain a larger LEV before its boundary reaches the trailing edge and detach/shed from the wing surface, hence supports a larger LEV circulation at higher stroke amplitudes. For the small dimensionless radial centroid location of = 0.4, the small area near the wingtip leads to stronger detachment/shedding of the LEV. This leads to the fluctuation in lift/drag coefficients for the high stroke amplitude cases, as shown in Figure 13, and also the decreased average lift coefficient during the wing translational phase at the highest stroke amplitude of = 180°, as shown in Figure 14.
4. Conclusions
In this study, the combined effect of stroke amplitude and wing planform on the aerodynamic performance of insect wings was investigated. The flow around the wings at a Reynolds number of 100 was solved using the open-source finite volume solver OpenFOAM. Aerodynamic force coefficients and flow structures were considered for wing planforms defined using the beta-function distribution. Normal hovering kinematics defined using simple harmonic functions were employed within the simulations. The effects of the wing planform parameters of aspect ratio (varying between three and six) and dimensionless radial centroid location (varying between 0.4 and 0.6) as well as their interaction effects with stroke amplitude (varying between 60° and 180°) were investigated.
Considering the effect of aspect ratio, it was shown that for all aspect ratios considered, generally before stroke reversal, the wing sections close to the wing root have continuously increasing normal force coefficients, whereas the wing sections closest to the wingtip have continuously decreasing normal force coefficient. Moreover, increasing the aspect ratio was shown to increase the wingtip stall effects and resulted in stronger LEV detachment near the wingtip. When the interaction effect of aspect ratio and stroke amplitude was considered, it was shown that larger stroke amplitudes result in a more developed LEV, hence higher lift coefficients at the beginning of the translational phase for all aspect ratios. For aspect ratios of 3 and 4.5, increasing the stroke amplitude leads to increased average translational lift. However, for the high aspect ratio of 6, the average translational lift only increases up to a stroke amplitude of 160°. These results showed that for higher aspect ratio wings, a smaller stroke amplitude is required to enable the maximum translational lift, as further increasing the stroke amplitude leads to reduced translational lift due to the stronger wingtip stall effects.
Considering the effect of radial centroid location, it was found that for all radial centroid location cases considered, again, generally before stroke reversal, the wing sections close to the wing root have continuously increasing normal force coefficients, and that the sections closest to the wingtip have continuously decreasing normal force coefficients. Furthermore, increasing radial centroid location was shown to reduce wingtip stall effects and resulted in weaker LEV detachment. When the interaction effect of radial centroid location and stroke amplitude was considered, it was shown that, for the small dimensionless radial centroid location of 0.4, increasing the stroke amplitude increases the average translational lift coefficient only up to a stroke amplitude of 160°, due to the stronger wingtip stall effects at the highest stroke amplitude. However, for the larger dimensionless radial centroid locations of 0.5 and 0.6, increasing stroke amplitude leads to a consistently increasing average translational lift.
An important outcome of this work is the improved understanding of the distinct contributions of the translational and rotational phases of the stroke cycle and how these affect the global average aerodynamic coefficient values. Although the lift and drag coefficients during the translational phase were influenced by the LEV development and wingtip stall effects, it was found that the rotational phase plays a significant role in determining the global force production. When varying the aspect ratio while fixing the radial centroid location and stroke amplitude, the intermediate aspect ratio of 4.5 was found to have the highest global average lift coefficient; and the global average drag coefficient was found to decrease with the increase of aspect ratio, due to the decreased drag coefficient during the rotational phase. When changing the radial centroid location while fixing the aspect ratio and stroke amplitude, the intermediate dimensionless radial centroid location of 0.5 was found to have the highest global average lift coefficient; and increasing radial centroid location led to decreased global average drag coefficient. Overall, when the interaction effects were considered, it was found that for all aspect ratios and radial centroid locations, consistently decreasing global average lift and drag coefficients were found with the increase in stroke amplitude, due to the decreased average lift and drag coefficients during the rotational phase. Furthermore, the significant reduction in average drag coefficients led to a consistently increasing aerodynamic efficiency with the increase in stroke amplitude.
Author Contributions
Conceptualization, H.L. and M.R.A.N.; methodology, H.L. and M.R.A.N.; investigation, H.L. and M.R.A.N.; writing—original draft preparation, H.L.; writing—review and editing, M.R.A.N.; supervision, M.R.A.N.; project administration, M.R.A.N.; funding acquisition, M.R.A.N. All authors have read and agreed to the published version of the manuscript.
Funding
This research was funded by the Leverhulme Trust via Research Project Grant RPG-2019-366.
Institutional Review Board Statement
Not applicable.
Informed Consent Statement
Not applicable.
Data Availability Statement
The data presented in this study are available on request from the authors.
Conflicts of Interest
The authors declare no conflict of interest.
References
- Ma, K.Y.; Chirarattananon, P.; Fuller, S.B.; Wood, R.J. Controlled Flight of a Biologically Inspired, Insect-Scale Robot. Science 2013, 340, 603–607. [Google Scholar] [CrossRef] [PubMed]
- Lentink, D.; Jongerius, S.R.; Bradshaw, N.L. The Scalable Design of Flapping Micro-Air Vehicles Inspired by Insect Flight. In Flying Insects and Robots; Springer: Berlin/Heidelberg, Germany, 2009; pp. 185–205. ISBN 978-3-540-89392-9. [Google Scholar] [CrossRef]
- Keennon, M.; Klingebiel, K.; Won, H. Development of the Nano Hummingbird: A Tailless Flapping Wing Micro Air Vehicle. In Proceedings of the 50th AIAA Aerospace Sciences Meeting including the New Horizons Forum and Aerospace Exposition, Nashville, TN, USA, 9–12 January 2012; American Institute of Aeronautics and Astronautics: Reston, VA, USA, 2012. [Google Scholar] [CrossRef]
- Nabawy, M.R.A.; Marcinkeviciute, R. Scalability of Resonant Motor-Driven Flapping Wing Propulsion Systems. R. Soc. Open Sci. 2021, 8, 210452. [Google Scholar] [CrossRef] [PubMed]
- Chen, S.; Wang, L.; He, Y.; Tong, M.; Pan, Y.; Ji, B.; Guo, S. Aerodynamic Performance of a Flyable Flapping Wing Rotor with Passive Pitching Angle Variation. IEEE Trans. Ind. Electron. 2022, 69, 9176–9184. [Google Scholar] [CrossRef]
- Zhu, Z.; Zhao, J.; He, Y.; Guo, S.; Chen, S.; Ji, B. Aerodynamic Analysis of Insect-like Flapping Wings in Fan-Sweep and Parallel Motions with the Slit Effect. Biomim. Intell. Robot. 2022, 2, 100046. [Google Scholar] [CrossRef]
- Ellington, C.P. The Aerodynamics of Hovering Insect Flight.3. Kinematics. Philos. Trans. R. Soc. Lond. Ser. B Biol. Sci. 1984, 305, 41–78. [Google Scholar] [CrossRef]
- Maxworthy, T. Experiments on the Weis-Fogh Mechanism of Lift Generation by Insects in Hovering Flight Part 1. Dynamics of the ‘Fling.’ J. Fluid Mech. 1979, 93, 47–63. [Google Scholar] [CrossRef]
- Ellington, C.P.; van den Berg, C.; Willmott, A.P.; Thomas, A.L.R. Leading-Edge Vortices in Insect Flight. Nature 1996, 384, 626–630. [Google Scholar] [CrossRef]
- Dickinson, M.H.; Lehmann, F.O.; Sane, S.P. Wing Rotation and the Aerodynamic Basis of Insect Flight. Science 1999, 284, 1954–1960. [Google Scholar] [CrossRef]
- Nabawy, M.R.A.; Crowther, W.J. The Role of the Leading Edge Vortex in Lift Augmentation of Steadily Revolving Wings: A Change in Perspective. J. R. Soc. Interface 2017, 14, 20170159. [Google Scholar] [CrossRef]
- Nabawy, M.R.; Villamor, G.J.; Li, H. Aerodynamic Modelling of Insect Wings Using Joukowski Transformation. In Proceedings of the AIAA AVIATION 2021 FORUM, Virtual Event, 2–6 August 2021; American Institute of Aeronautics and Astronautics: Reston, VA, USA, 2021. [Google Scholar] [CrossRef]
- Bomphrey, R.J.; Nakata, T.; Phillips, N.; Walker, S.M. Smart Wing Rotation and Trailing-Edge Vortices Enable High Frequency Mosquito Flight. Nature 2017, 544, 92–95. [Google Scholar] [CrossRef]
- Li, H.; Nabawy, M.R. Wake Effects on Force Production of a Translating-Pitching Flat Plate. In Proceedings of the AIAA AVIATION 2021 FORUM, Virtual Event, 2–6 August 2021; American Institute of Aeronautics and Astronautics: Reston, VA, USA, 2021. [Google Scholar] [CrossRef]
- Nabawy, M.R.A.; Crowther, W.J. Optimum Hovering Wing Planform. J. Theor. Biol. 2016, 406, 187–191. [Google Scholar] [CrossRef] [PubMed]
- Usherwood, J.R.; Ellington, C.P. The Aerodynamics of Revolving Wings-II. Propeller Force Coefficients from Mayfly to Quail. J. Exp. Biol. 2002, 205, 1565–1576. [Google Scholar] [CrossRef]
- Kruyt, J.W.; Van Heijst, G.J.F.; Altshuler, D.L.; Lentink, D. Power Reduction and the Radial Limit of Stall Delay in Revolving Wings of Different Aspect Ratio. J. R. Soc. Interface 2015, 12. [Google Scholar] [CrossRef] [PubMed]
- Broadley, P.; Nabawy, M.R.; Quinn, M.K.; Crowther, W.J. Wing Planform Effects on the Aerodynamic Performance of Insect-like Revolving Wings. In Proceedings of the AIAA AVIATION 2020 FORUM, Virtual Event, 15–19 June 2020; American Institute of Aeronautics and Astronautics: Reston, VA, USA, 2020. [Google Scholar] [CrossRef]
- Broadley, P.; Nabawy, M.R. Effects of Wing Planform Shape on Low Reynolds Number Revolving Wings. In Proceedings of the AIAA AVIATION 2021 FORUM, Virtual Event, 2–6 August 2021; American Institute of Aeronautics and Astronautics: Reston, VA, USA, 2021. [Google Scholar] [CrossRef]
- Harbig, R.R.; Sheridan, J.; Thompson, M.C. Reynolds Number and Aspect Ratio Effects on the Leading-Edge Vortex for Rotating Insect Wing Planforms. J. Fluid Mech. 2013, 717, 166–192. [Google Scholar] [CrossRef]
- Phillips, N.; Knowles, K.; Bomphrey, R.J. The Effect of Aspect Ratio on the Leading-Edge Vortex over an Insect-like Flapping Wing. Bioinspir. Biomim. 2015, 10, 056020. [Google Scholar] [CrossRef] [PubMed]
- Phillips, N.; Knowles, K.; Bomphrey, R.J. Petiolate Wings: Effects on the Leading-Edge Vortex in Flapping Flight. Interface Focus 2017, 7, 20160084. [Google Scholar] [CrossRef]
- Han, J.S.; Chang, J.W.; Cho, H.K. Vortices Behavior Depending on the Aspect Ratio of an Insect-like Flapping Wing in Hover. Exp. Fluids 2015, 56, 181. [Google Scholar] [CrossRef]
- Luo, G.; Sun, M. Effects of Corrugation and Wing Planform on the Aerodynamic Force Production of Sweeping Model Insect Wings. Acta Mech. Sin. Xuebao 2005, 21, 531–541. [Google Scholar] [CrossRef]
- Shahzad, A.; Tian, F.-B.; Young, J.; Lai, J.C.S. Effects of Wing Shape, Aspect Ratio and Deviation Angle on Aerodynamic Performance of Flapping Wings in Hover. Phys. Fluids 2016, 28, 111901. [Google Scholar] [CrossRef]
- Bhat, S.S.; Zhao, J.; Sheridan, J.; Hourigan, K.; Thompson, M.C. Aspect Ratio Studies on Insect Wings. Phys. Fluids 2019, 31, 121301. [Google Scholar] [CrossRef]
- Sane, S.P.; Dickinson, M.H. The Control of Flight Force by a Flapping Wing: Lift and Drag Production. J. Exp. Biol. 2001, 204, 2607–2626. [Google Scholar] [CrossRef] [PubMed]
- Phillips, N.; Knowles, K. Reynolds Number and Stroke Amplitude Effects on the Leading-Edge Vortex on an Insect-like Flapping Wing. In Proceedings of the International Powered Lift Conference, Philadelphia, PA, USA, 5–7 October 2010; pp. 365–374. [Google Scholar]
- Altshuler, D.L.; Dickson, W.B.; Vance, J.T.; Roberts, S.P.; Dickinson, M.H.; Altshuler, D.L.; Dickinson, M.H. Short-Amplitude High-Frequency Wing Strokes Determine the Aerodynamics of Honeybee Flight. Proc. Natl. Acad. Sci. USA 2005, 102, 18213–18218. [Google Scholar] [CrossRef]
- Lentink, D.; Dickinson, M.H. Rotational Accelerations Stabilize Leading Edge Vortices on Revolving Fly Wings. J. Exp. Biol. 2009, 212, 2705–2719. [Google Scholar] [CrossRef]
- Ellington, C.P. The Aerodynamics of Hovering Insect Flight.2. Morphological Parameters. Philos. Trans. R. Soc. Lond. Ser. B Biol. Sci. 1984, 305, 17–40. [Google Scholar] [CrossRef]
- Broadley, P.; Nabawy, M.R.A.; Quinn, M.K.; Crowther, W.J. Dynamic Experimental Rigs for Investigation of Insect Wing Aerodynamics. J. R. Soc. Interface 2022, 19, 20210909. [Google Scholar] [CrossRef] [PubMed]
- Zhao, L.; Huang, Q.; Deng, X.; Sane, S.P. Aerodynamic Effects of Flexibility in Flapping Wings. J. R. Soc. Interface 2010, 7, 485–497. [Google Scholar] [CrossRef]
- Du, G.; Sun, M. Effects of Wing Deformation on Aerodynamic Forces in Hovering Hoverflies. J. Exp. Biol. 2010, 213, 2273–2283. [Google Scholar] [CrossRef]
- Toomey, J.; Eldredge, J.D. Numerical and Experimental Study of the Fluid Dynamics of a Flapping Wing with Low Order Flexibility. Phys. Fluids 2008, 20, 073603. [Google Scholar] [CrossRef]
- Eldredge, J.D.; Toomey, J.; Medina, A. On the Roles of Chord-Wise Flexibility in a Flapping Wing with Hovering Kinematics. J. Fluid Mech. 2010, 659, 94–115. [Google Scholar] [CrossRef]
- Yin, B.; Luo, H. Effect of Wing Inertia on Hovering Performance of Flexible Flapping Wings. Phys. Fluids 2010, 22, 111902. [Google Scholar] [CrossRef]
- Kang, C.; Shyy, W. Scaling Law and Enhancement of Lift Generation of an Insect-Size Hovering Flexible Wing. J. R. Soc. Interface 2013, 10, 20130361. [Google Scholar] [CrossRef]
- Nakata, T.; Liu, H. Aerodynamic Performance of a Hovering Hawkmoth with Flexible Wings: A Computational Approach. Proc. R. Soc. B Biol. Sci. 2012, 279, 722–731. [Google Scholar] [CrossRef] [PubMed]
- Shahzad, A.; Tian, F.-B.; Young, J.; Lai, J.C.S. Effects of Flexibility on the Hovering Performance of Flapping Wings with Different Shapes and Aspect Ratios. J. Fluids Struct. 2018, 81, 69–96. [Google Scholar] [CrossRef]
- Dai, H.; Luo, H.; Doyle, J.F. Dynamic Pitching of an Elastic Rectangular Wing in Hovering Motion. J. Fluid Mech. 2012, 693, 473–499. [Google Scholar] [CrossRef] [Green Version]
- Wang, L.; Tian, F.-B. Numerical Study of Sound Generation by Three-Dimensional Flexible Flapping Wings during Hovering Flight. J. Fluids Struct. 2020, 99, 103165. [Google Scholar] [CrossRef]
- Sridhar, M.; Kang, C. Aerodynamic Performance of Two-Dimensional, Chordwise Flexible Flapping Wings at Fruit Fly Scale in Hover Flight. Bioinspir. Biomim. 2015, 10, 036007. [Google Scholar] [CrossRef]
- Kang, C.-K.; Aono, H.; Cesnik, C.E.S.; Shyy, W. Effects of Flexibility on the Aerodynamic Performance of Flapping Wings. J. Fluid Mech. 2011, 689, 32–74. [Google Scholar] [CrossRef]
- Sun, M.; Tang, J. Unsteady Aerodynamic Force Generation by a Model Fruit Fly Wing in Flapping Motion. J. Exp. Biol. 2002, 205, 55–70. [Google Scholar] [CrossRef]
- Nabawy, M.R.A.; Crowther, W.J. Aero-Optimum Hovering Kinematics. Bioinspir. Biomim. 2015, 10, 044002. [Google Scholar] [CrossRef]
- Li, H.; Nabawy, M.R. The Combined Effect of Wing Planform and Stroke Kinematics on Aerodynamics of Flapping Insect Wings. In Proceedings of the AIAA SCITECH 2022 Forum, San Diego, CA, USA & Virtual Event, 3–7 January 2022; American Institute of Aeronautics and Astronautics: Reston, VA, USA, 2022. [Google Scholar] [CrossRef]
- Patankar, S.V.; Spalding, D.B. A Calculation Procedure for Heat, Mass and Momentum Transfer in Three-Dimensional Parabolic Flows. Int. J. Heat Mass Transf. 1972, 15, 1787–1806. [Google Scholar] [CrossRef]
- Issa, R.I. Solution of the Implicitly Discretised Fluid Flow Equations by Operator-Splitting. J. Comput. Phys. 1986, 62, 40–65. [Google Scholar] [CrossRef]
- Li, H.; Nabawy, M.R.A. Wing Planform Effect on the Aerodynamics of Insect Wings. Insects 2022, 13, 459. [Google Scholar] [CrossRef] [PubMed]
- Hunt, J.C.R.; Wray, A.A.; Moin, P. Eddies, Streams, and Convergence Zones in Turbulent Flows. Center for Turbulence Research, Proceedings of the Summer Program 1988. Document ID: 19890015184. pp. 193–208. Available online: https://www.researchgate.net/publication/234550074_Eddies_streams_and_convergence_zones_in_turbulent_flows (accessed on 2 July 2022).
- Cheng, X.; Sun, M. Wing-Kinematics Measurement and Aerodynamics in a Small Insect in Hovering Flight. Sci. Rep. 2016, 6, 25706. [Google Scholar] [CrossRef] [Green Version]
- Dillon, M.E.; Dudley, R. Surpassing Mt. Everest: Extreme Flight Performance of Alpine Bumble-Bees. Biol. Lett. 2014, 10, 20130922. [Google Scholar] [CrossRef]
- Ellington, C.P. The Aerodynamics of Hovering Insect Flight.4. Aerodynamic Mechanisms. Philos. Trans. R. Soc. Lond. Ser. B Biol. Sci. 1984, 305, 79–113. [Google Scholar] [CrossRef]
- Bhat, S.S.; Zhao, J.; Sheridan, J.; Hourigan, K.; Thompson, M.C. Evolutionary Shape Optimisation Enhances the Lift Coefficient of Rotating Wing Geometries. J. Fluid Mech. 2019, 868, 369–384. [Google Scholar] [CrossRef]
Figure 1.
Wing planform shapes employed in the numerical investigation.
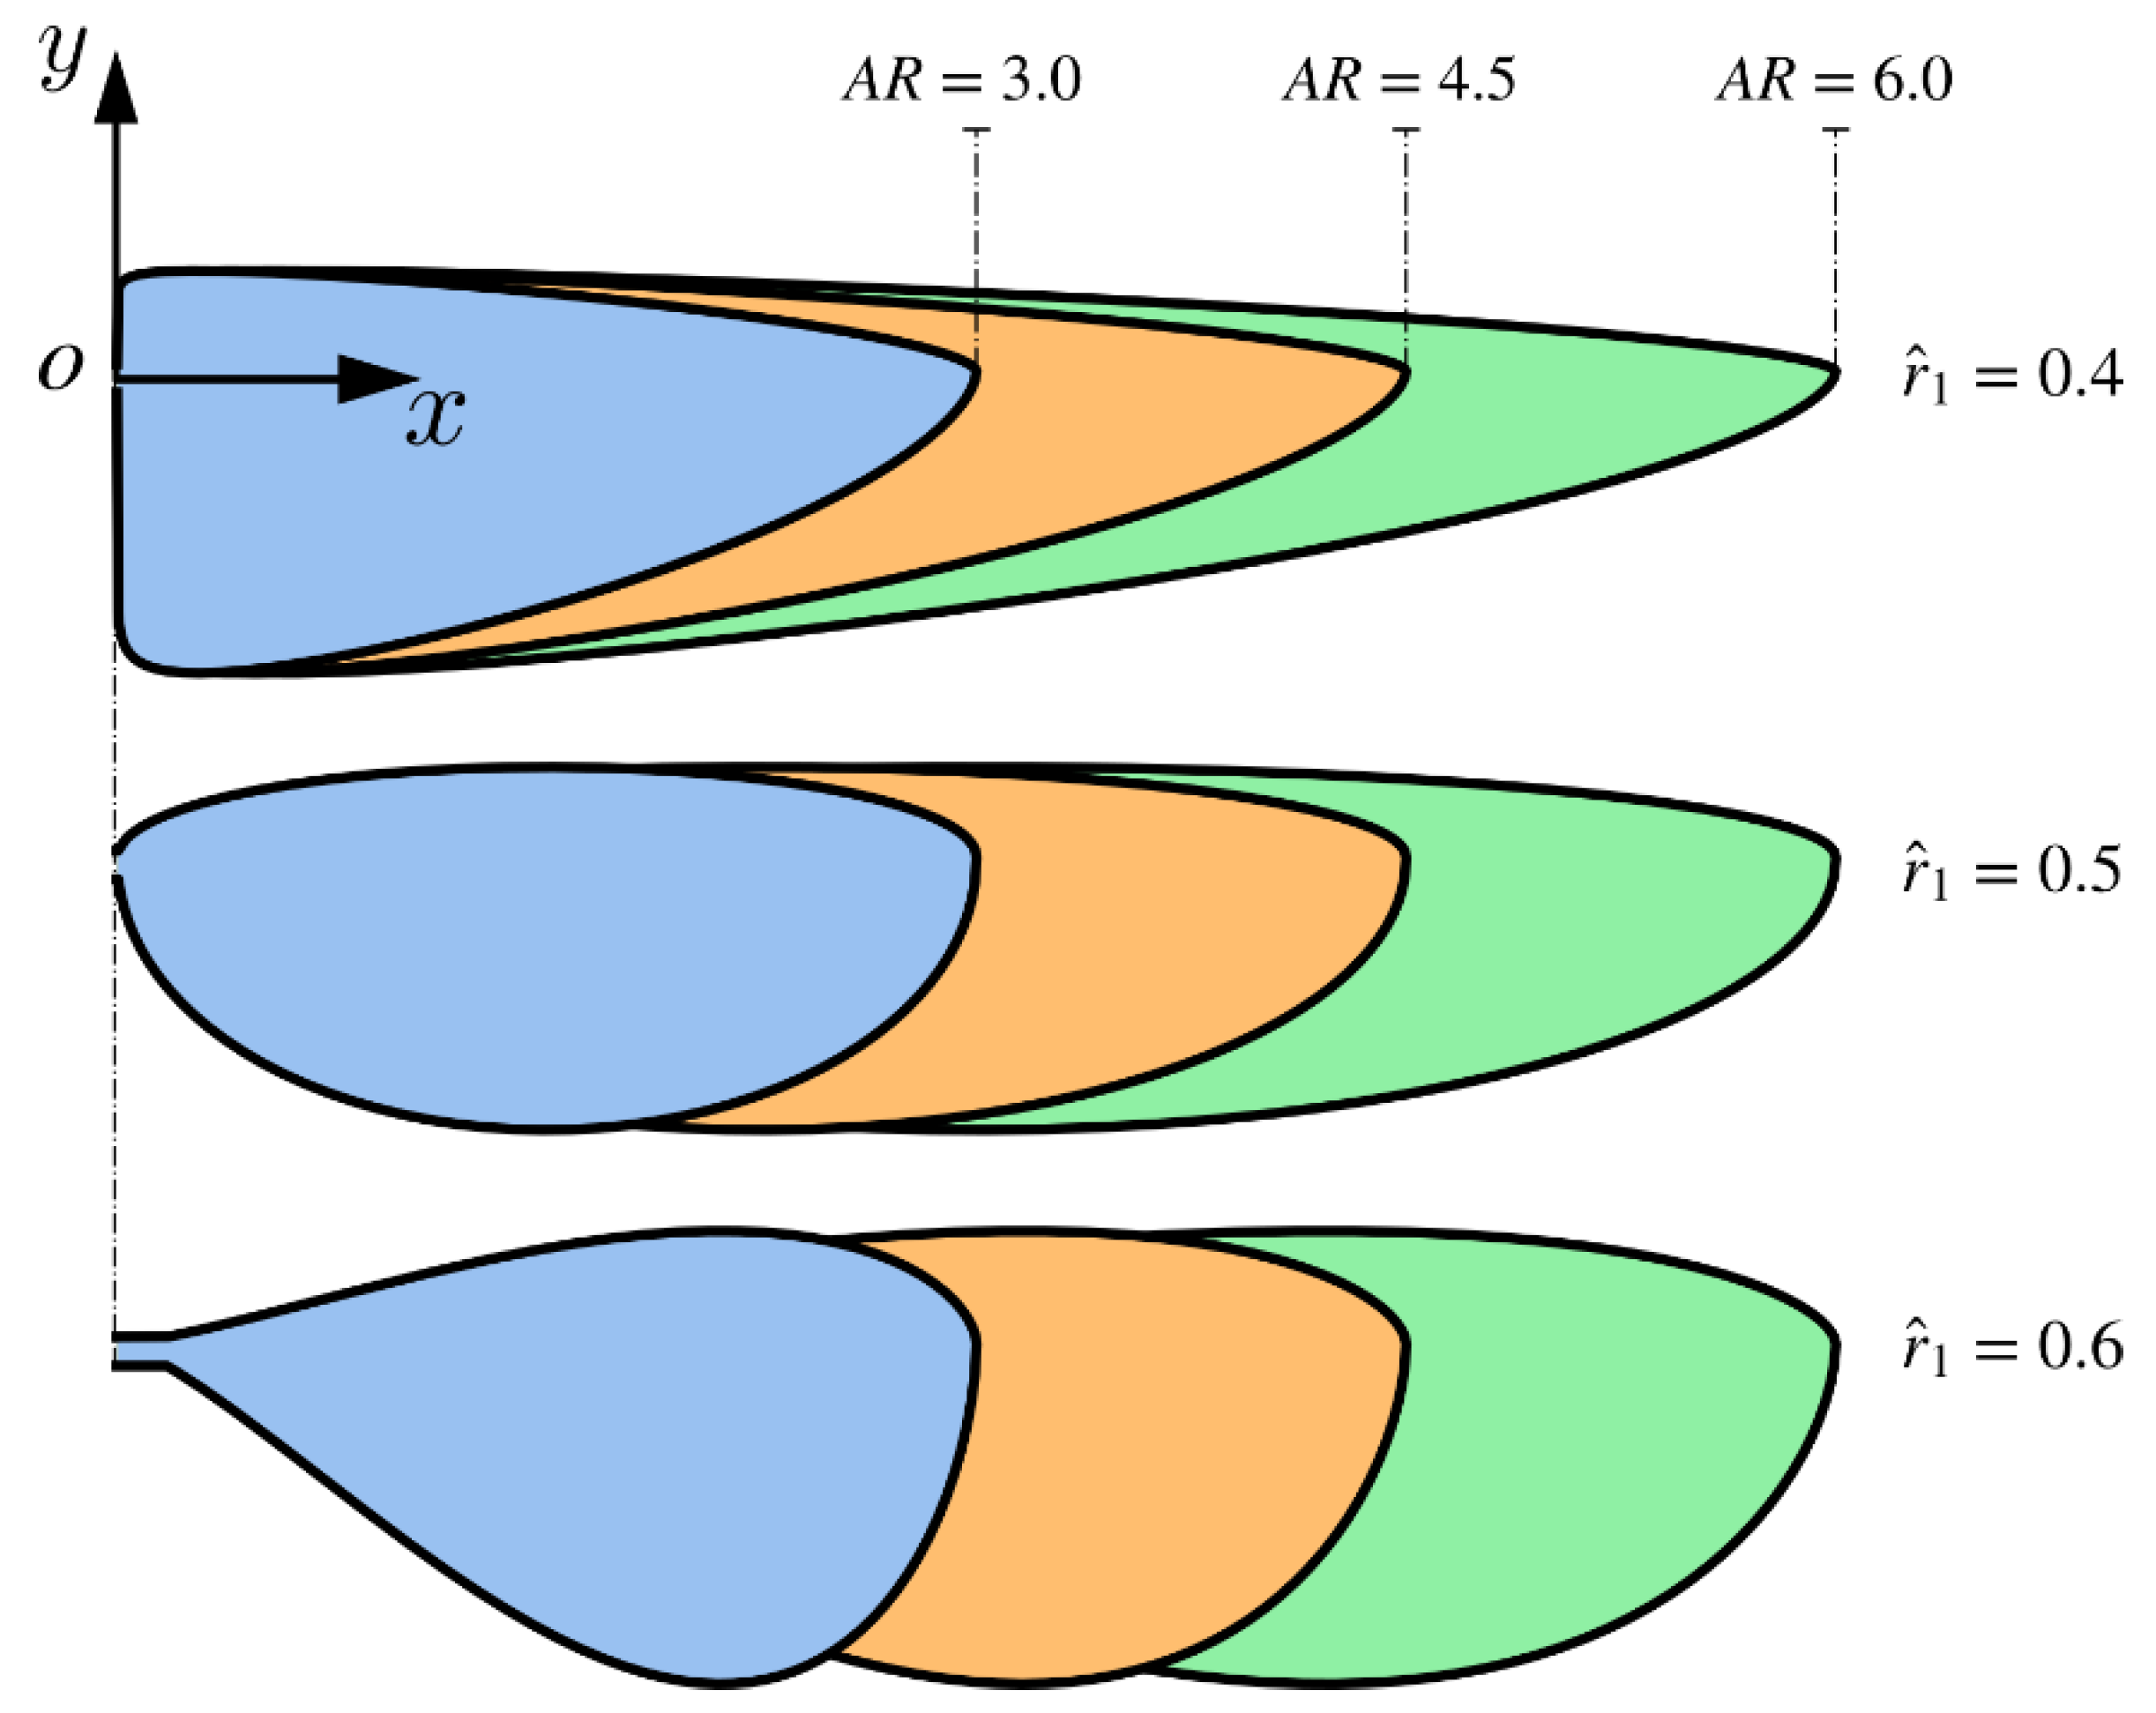
Figure 2.
Flapping angle, , and angle of attack, , variations employed in the current investigation. Regions with white color indicate wing translational phases, whereas regions with grey color indicate wing rotational phases.
Figure 2.
Flapping angle, , and angle of attack, , variations employed in the current investigation. Regions with white color indicate wing translational phases, whereas regions with grey color indicate wing rotational phases.

Figure 3.
(a) Simulation domain; and (b) planform view of an example mesh distribution.
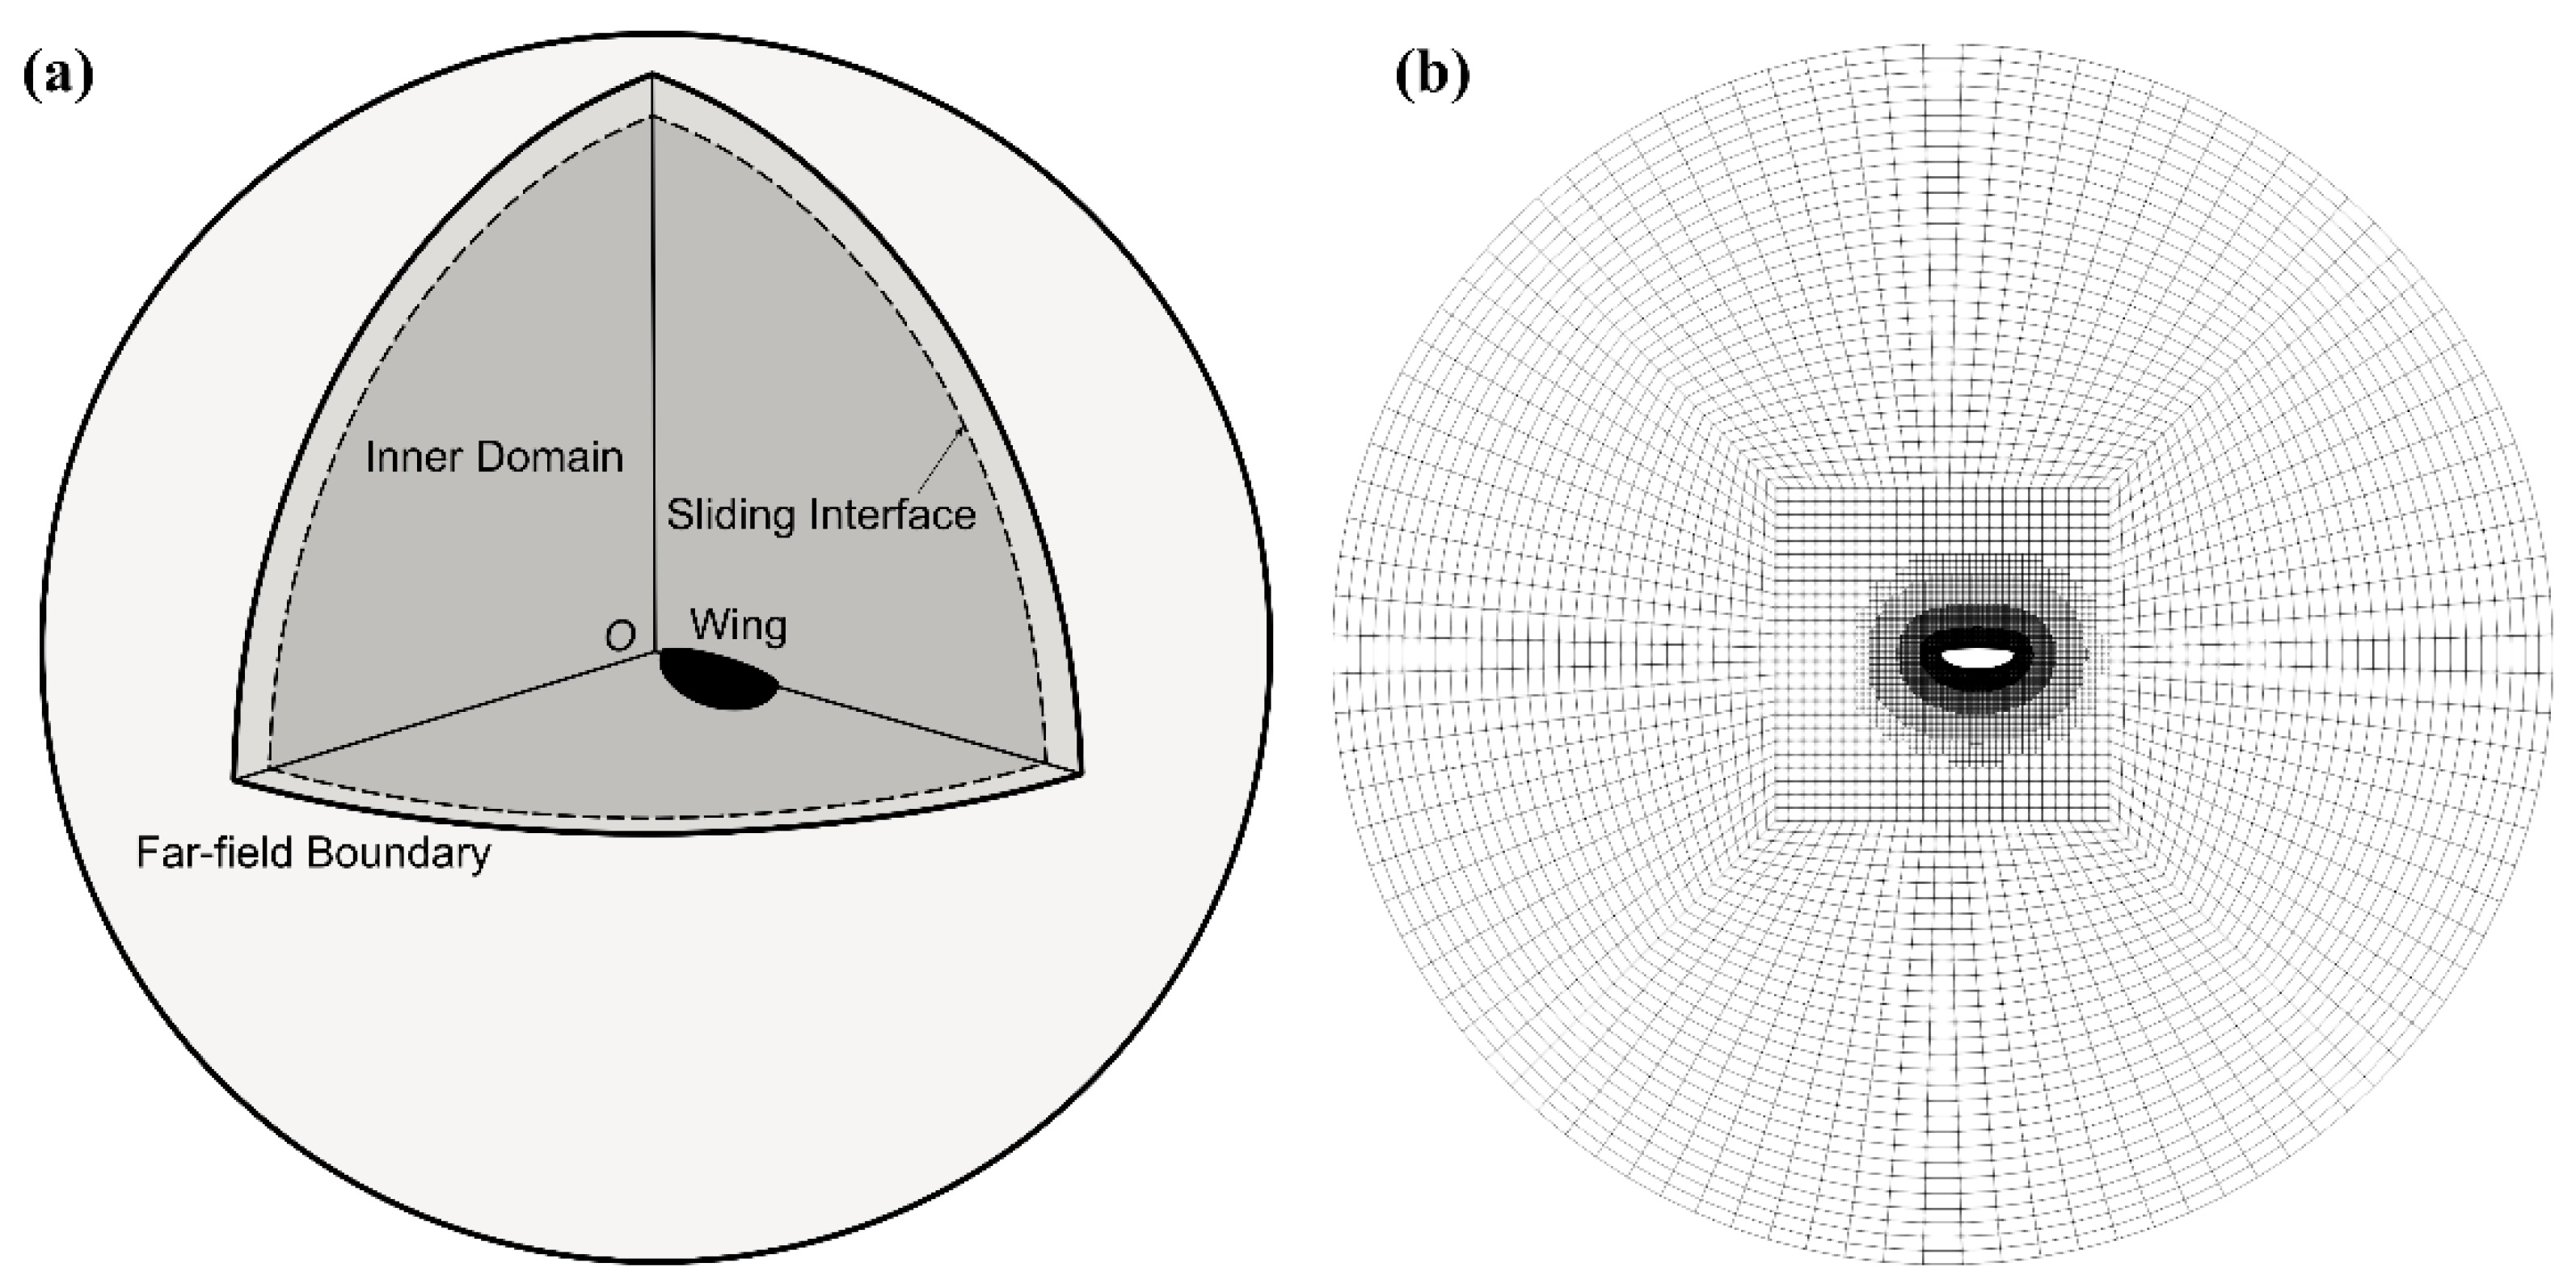
Figure 4.
Normal force coefficient distribution along the wingspan for wings with different aspect ratios. Grey areas represent regions where the normal force coefficient at = 4.9 becomes lower than that at = 4.8. Stroke amplitude is fixed to 160° and the dimensionless radial centroid location is fixed to 0.5.

Figure 5.
Flow evolution at different time instances for (a) = 3, (b) = 4.5, and (c) = 6. Red and blue colors indicate positive spanwise (from root to tip) and negative spanwise (from tip to root) rotating vortices, respectively. is the pressure coefficient: .
Figure 5.
Flow evolution at different time instances for (a) = 3, (b) = 4.5, and (c) = 6. Red and blue colors indicate positive spanwise (from root to tip) and negative spanwise (from tip to root) rotating vortices, respectively. is the pressure coefficient: .
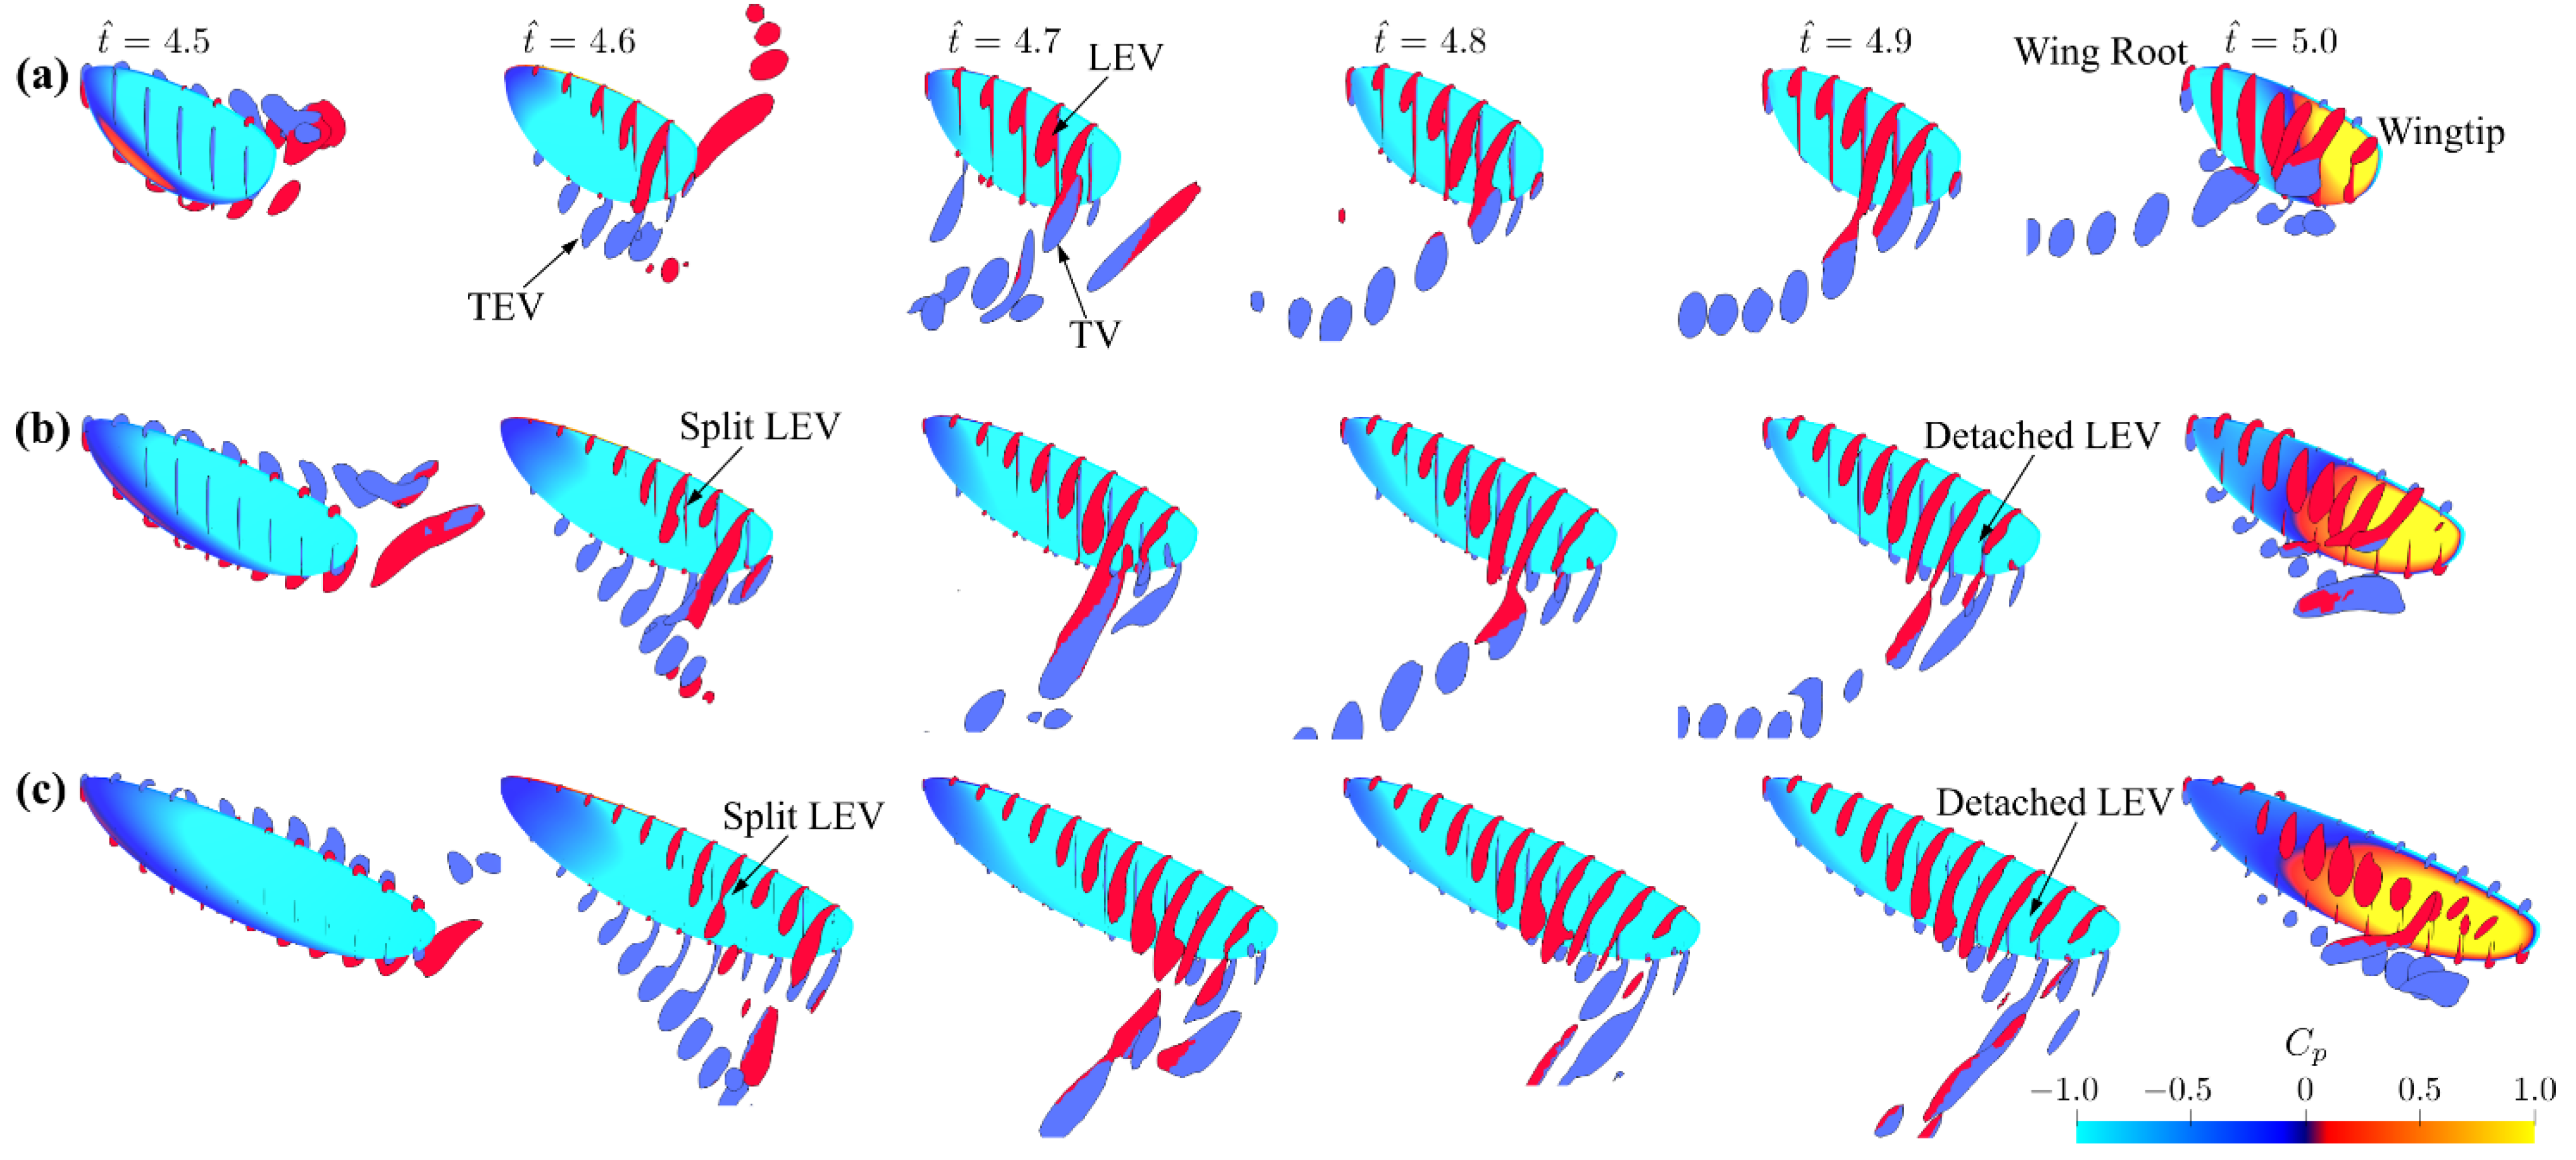
Figure 6.
Average lift and drag coefficients for the translational phase, rotational phase, and whole/global wing stroke, for the different aspect ratios.
Figure 6.
Average lift and drag coefficients for the translational phase, rotational phase, and whole/global wing stroke, for the different aspect ratios.
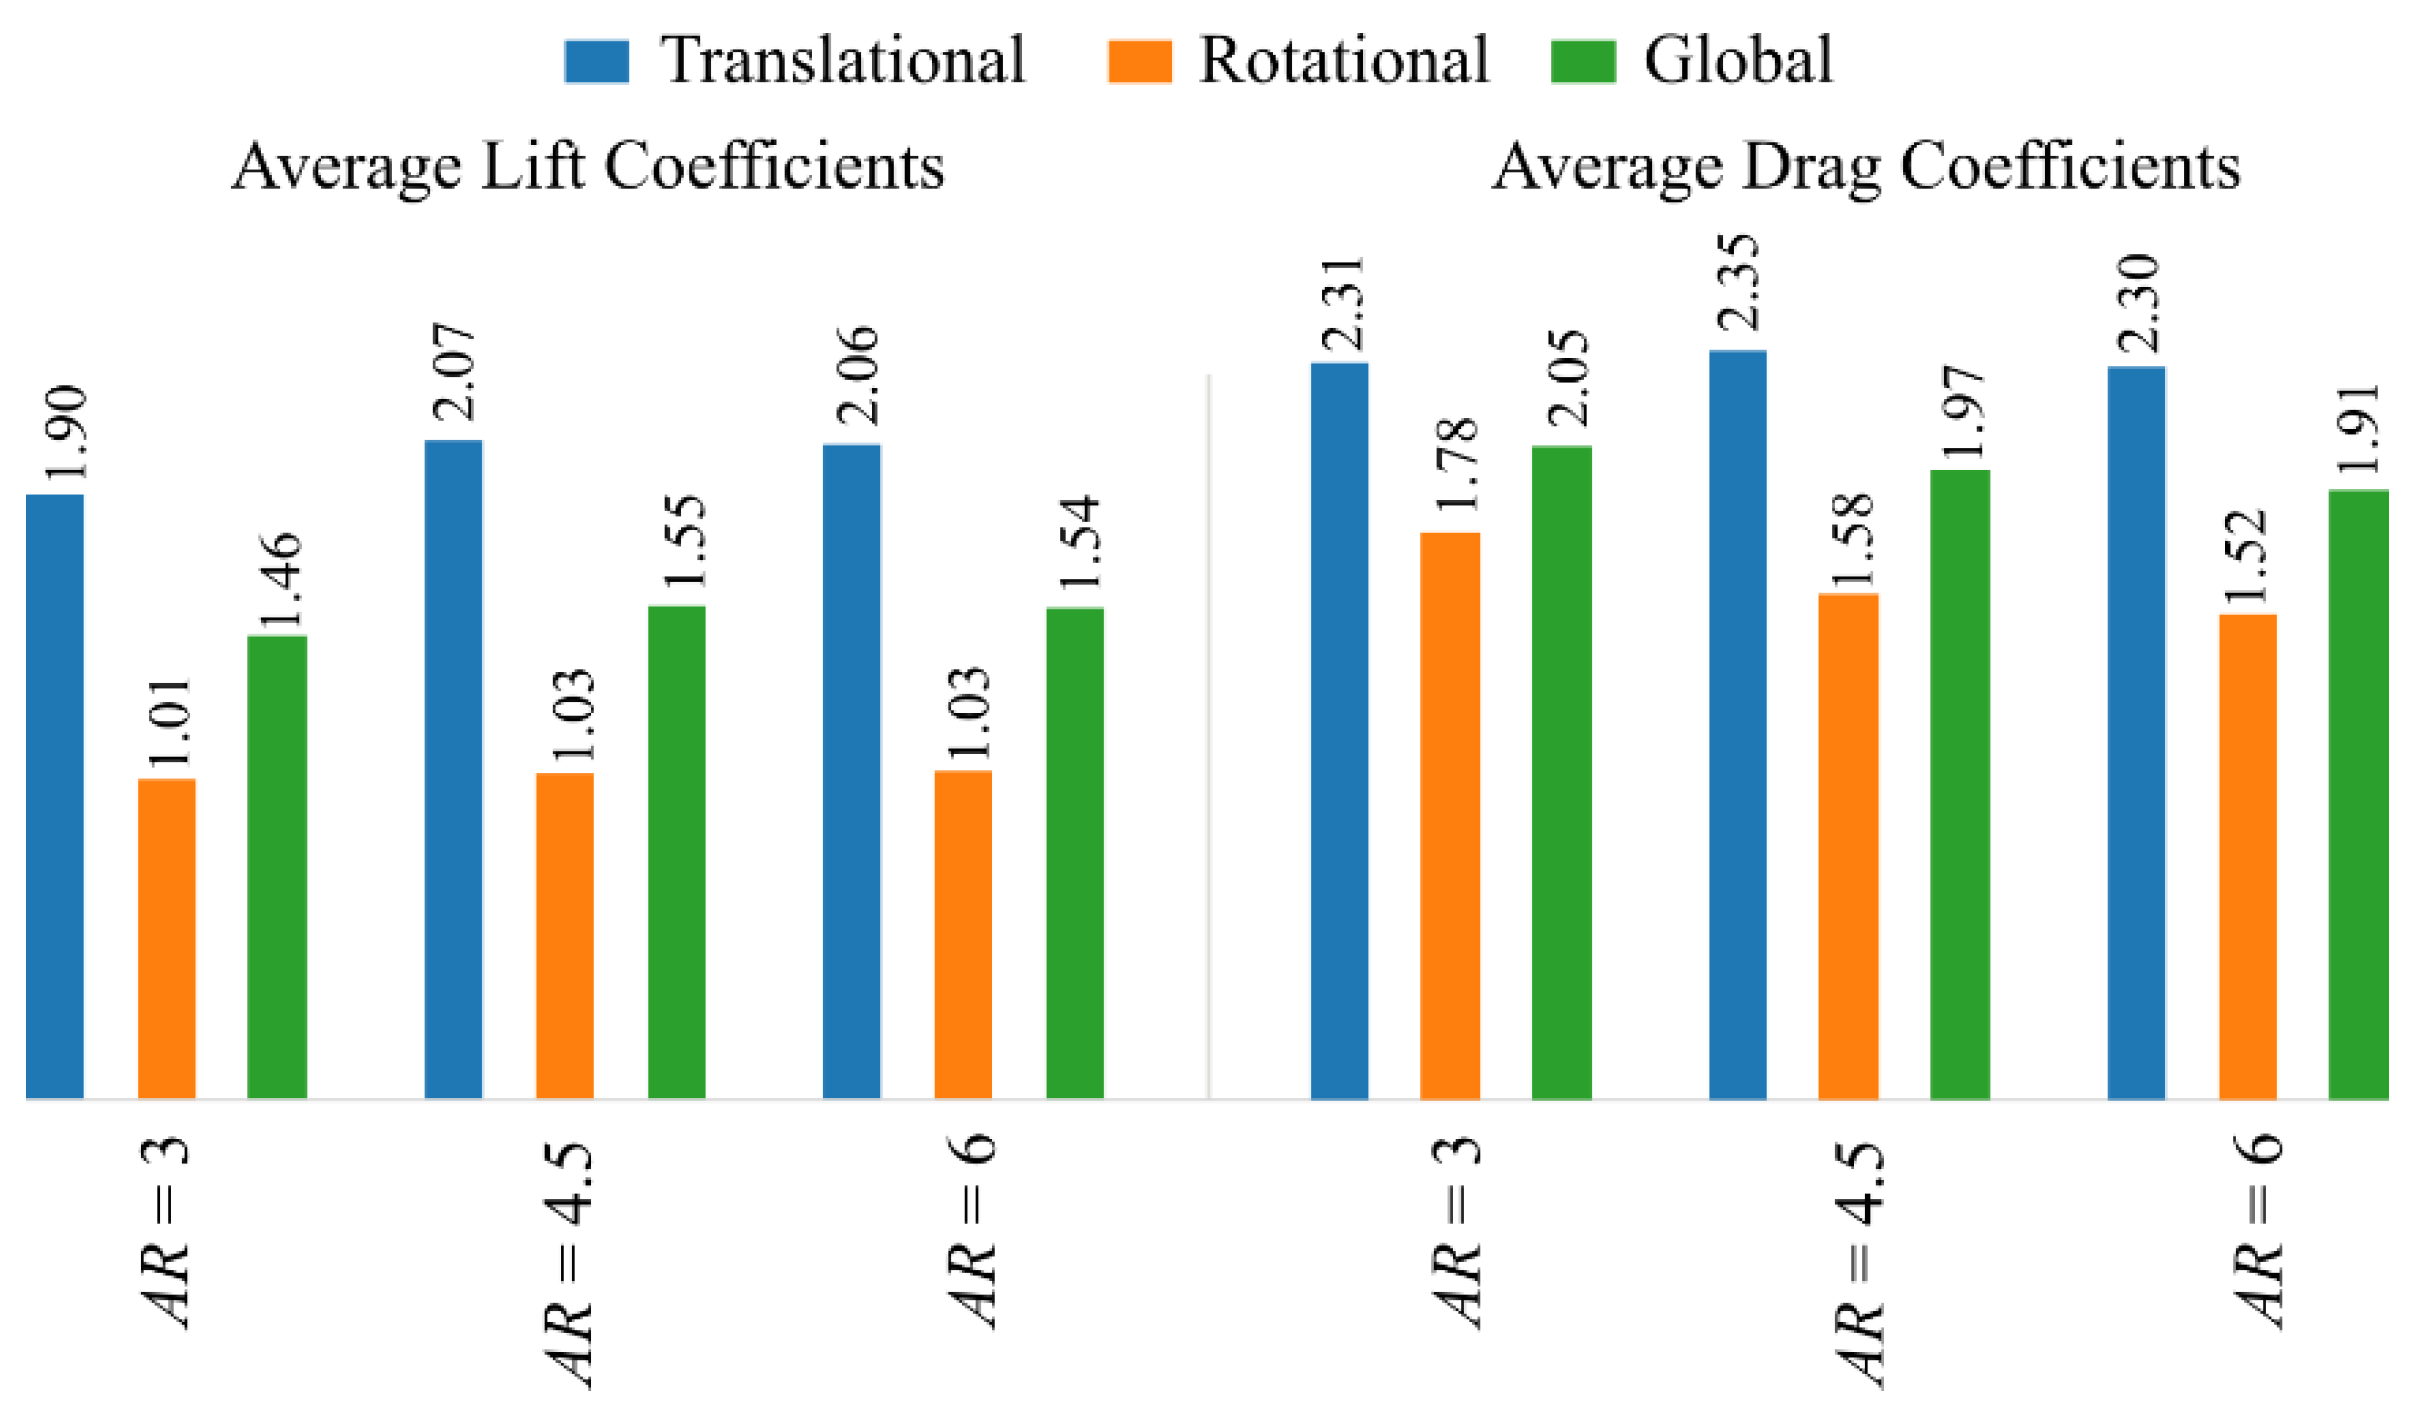
Figure 7.
Variations of the instantaneous lift and drag coefficients for the different stroke amplitude and aspect ratio cases. The dimensionless radial centroid location is fixed to 0.5. Wing translational phases are indicated by white shading; wing rotational phases are indicated by grey shading.
Figure 7.
Variations of the instantaneous lift and drag coefficients for the different stroke amplitude and aspect ratio cases. The dimensionless radial centroid location is fixed to 0.5. Wing translational phases are indicated by white shading; wing rotational phases are indicated by grey shading.
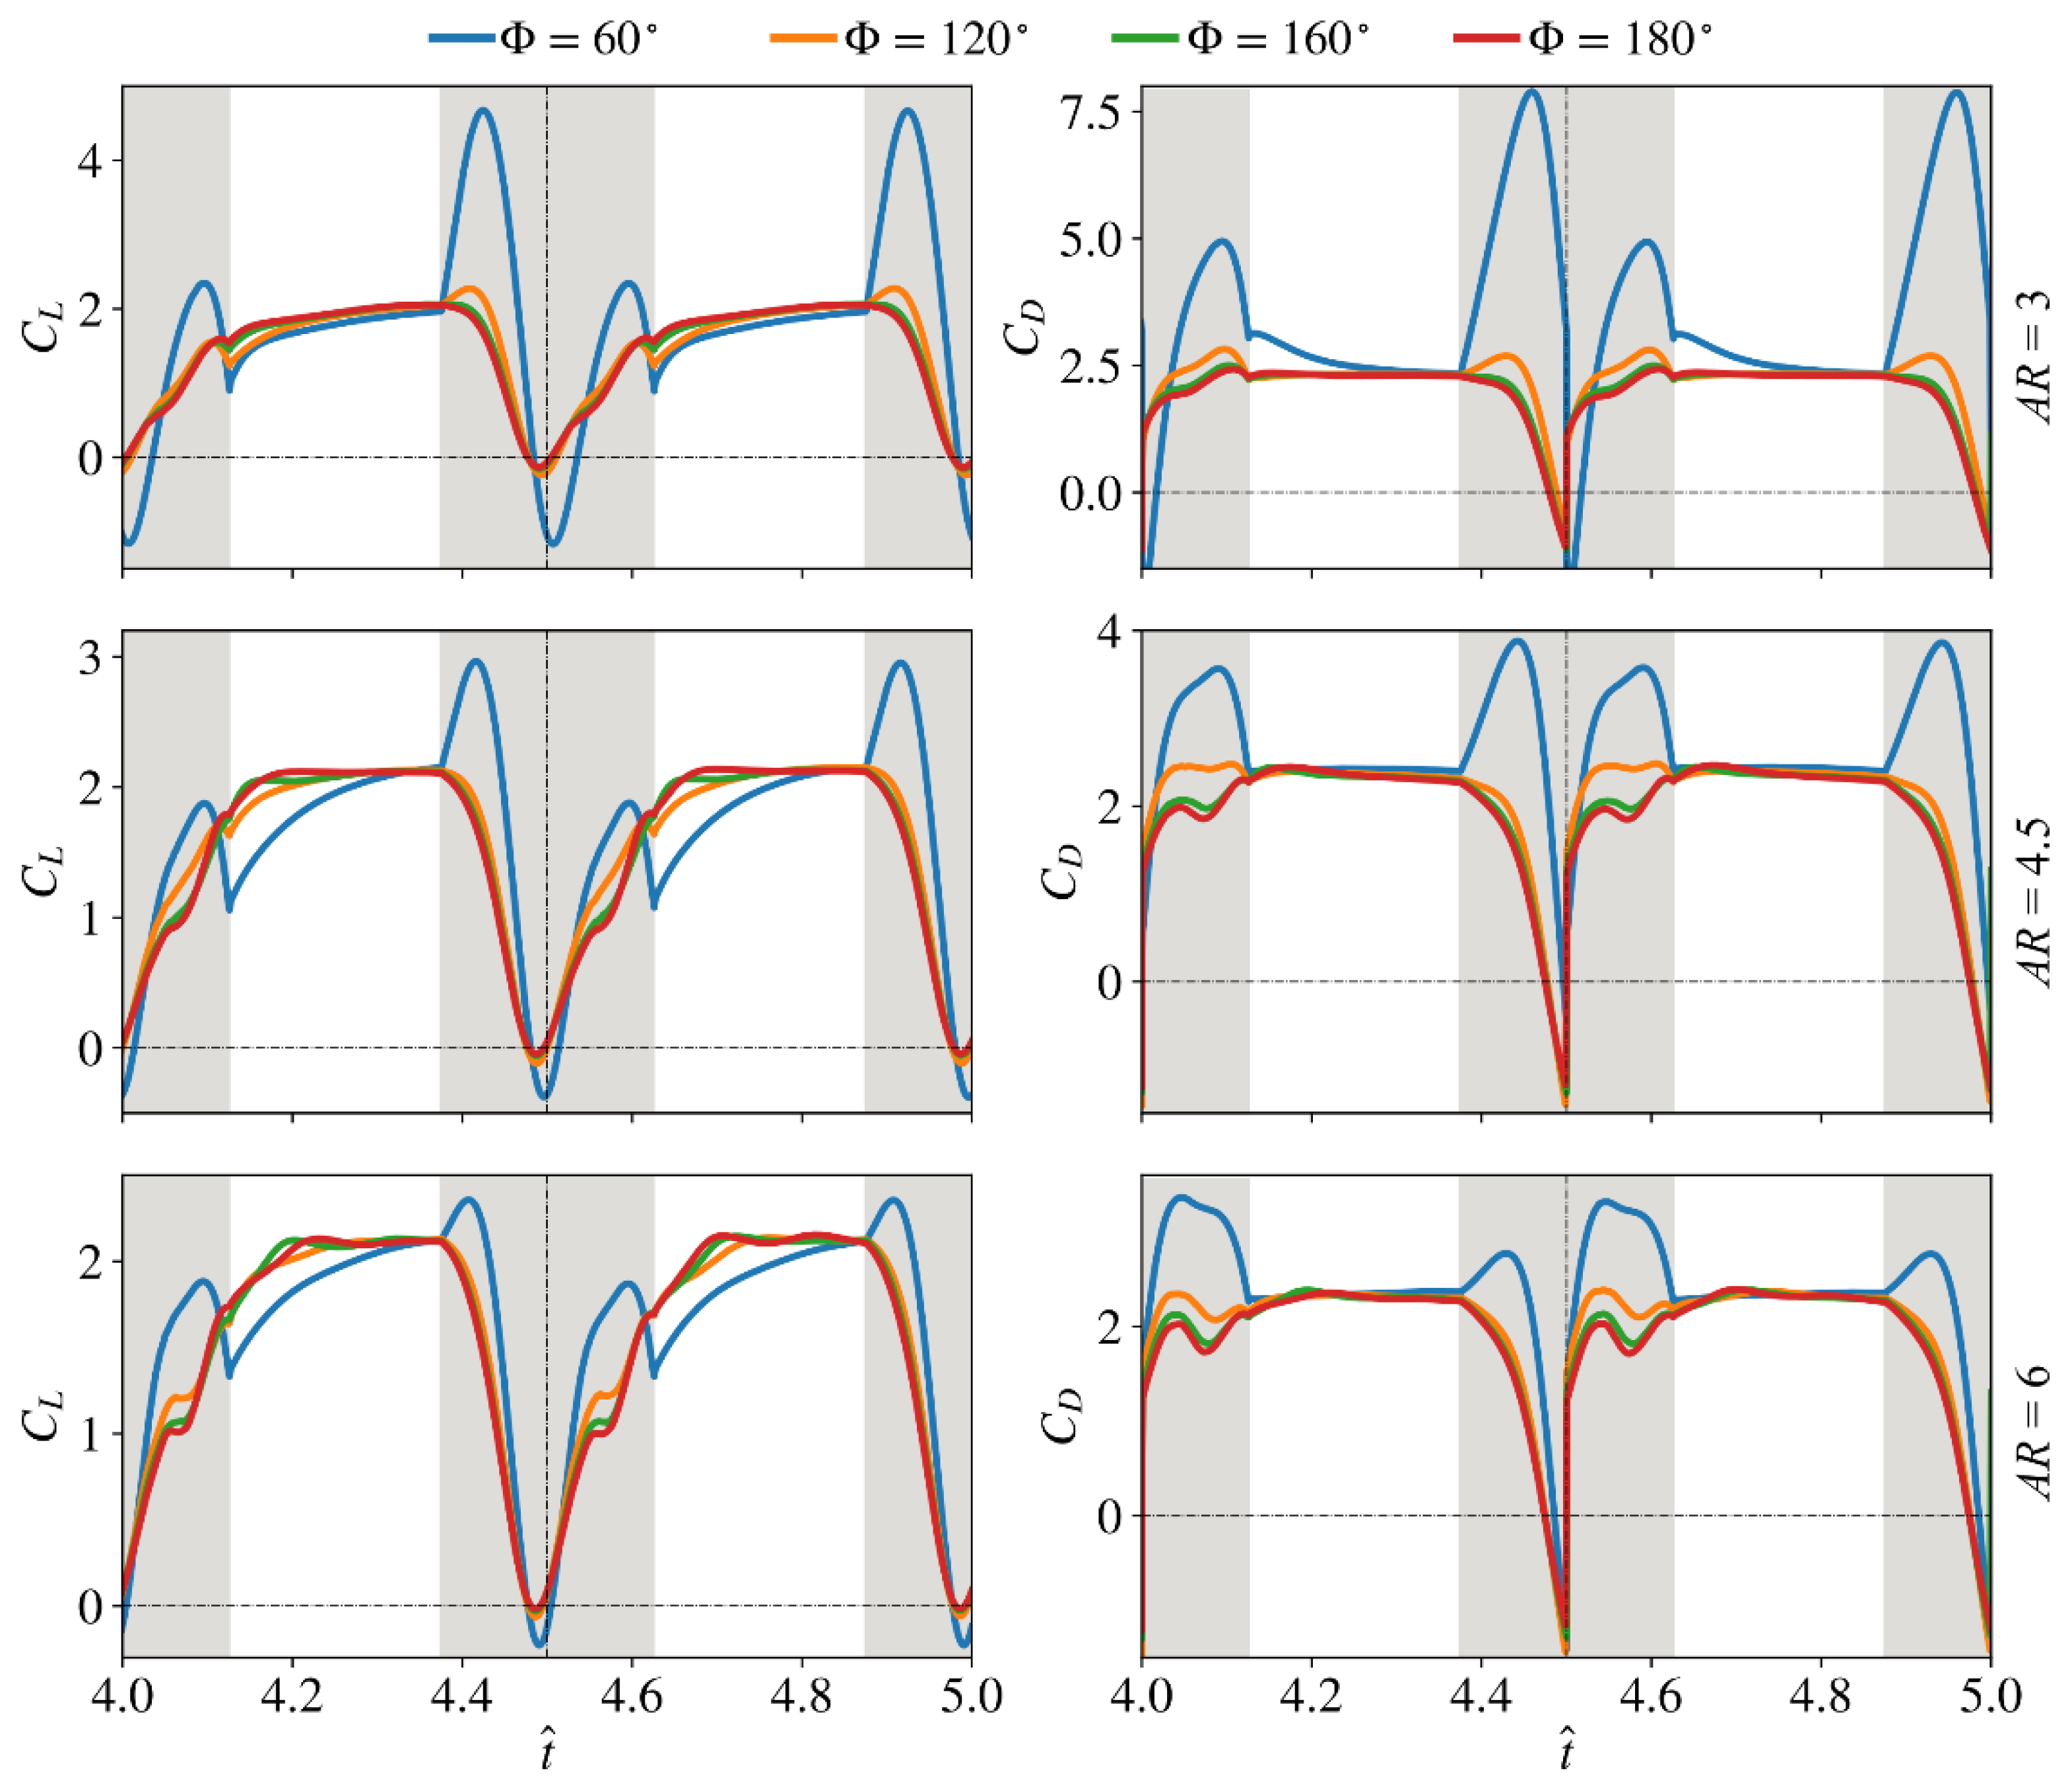
Figure 8.
Comparison of the average lift and drag coefficients as well as power factor for different stroke amplitudes and aspect ratios. The dimensionless radial centroid location is fixed to 0.5.
Figure 8.
Comparison of the average lift and drag coefficients as well as power factor for different stroke amplitudes and aspect ratios. The dimensionless radial centroid location is fixed to 0.5.
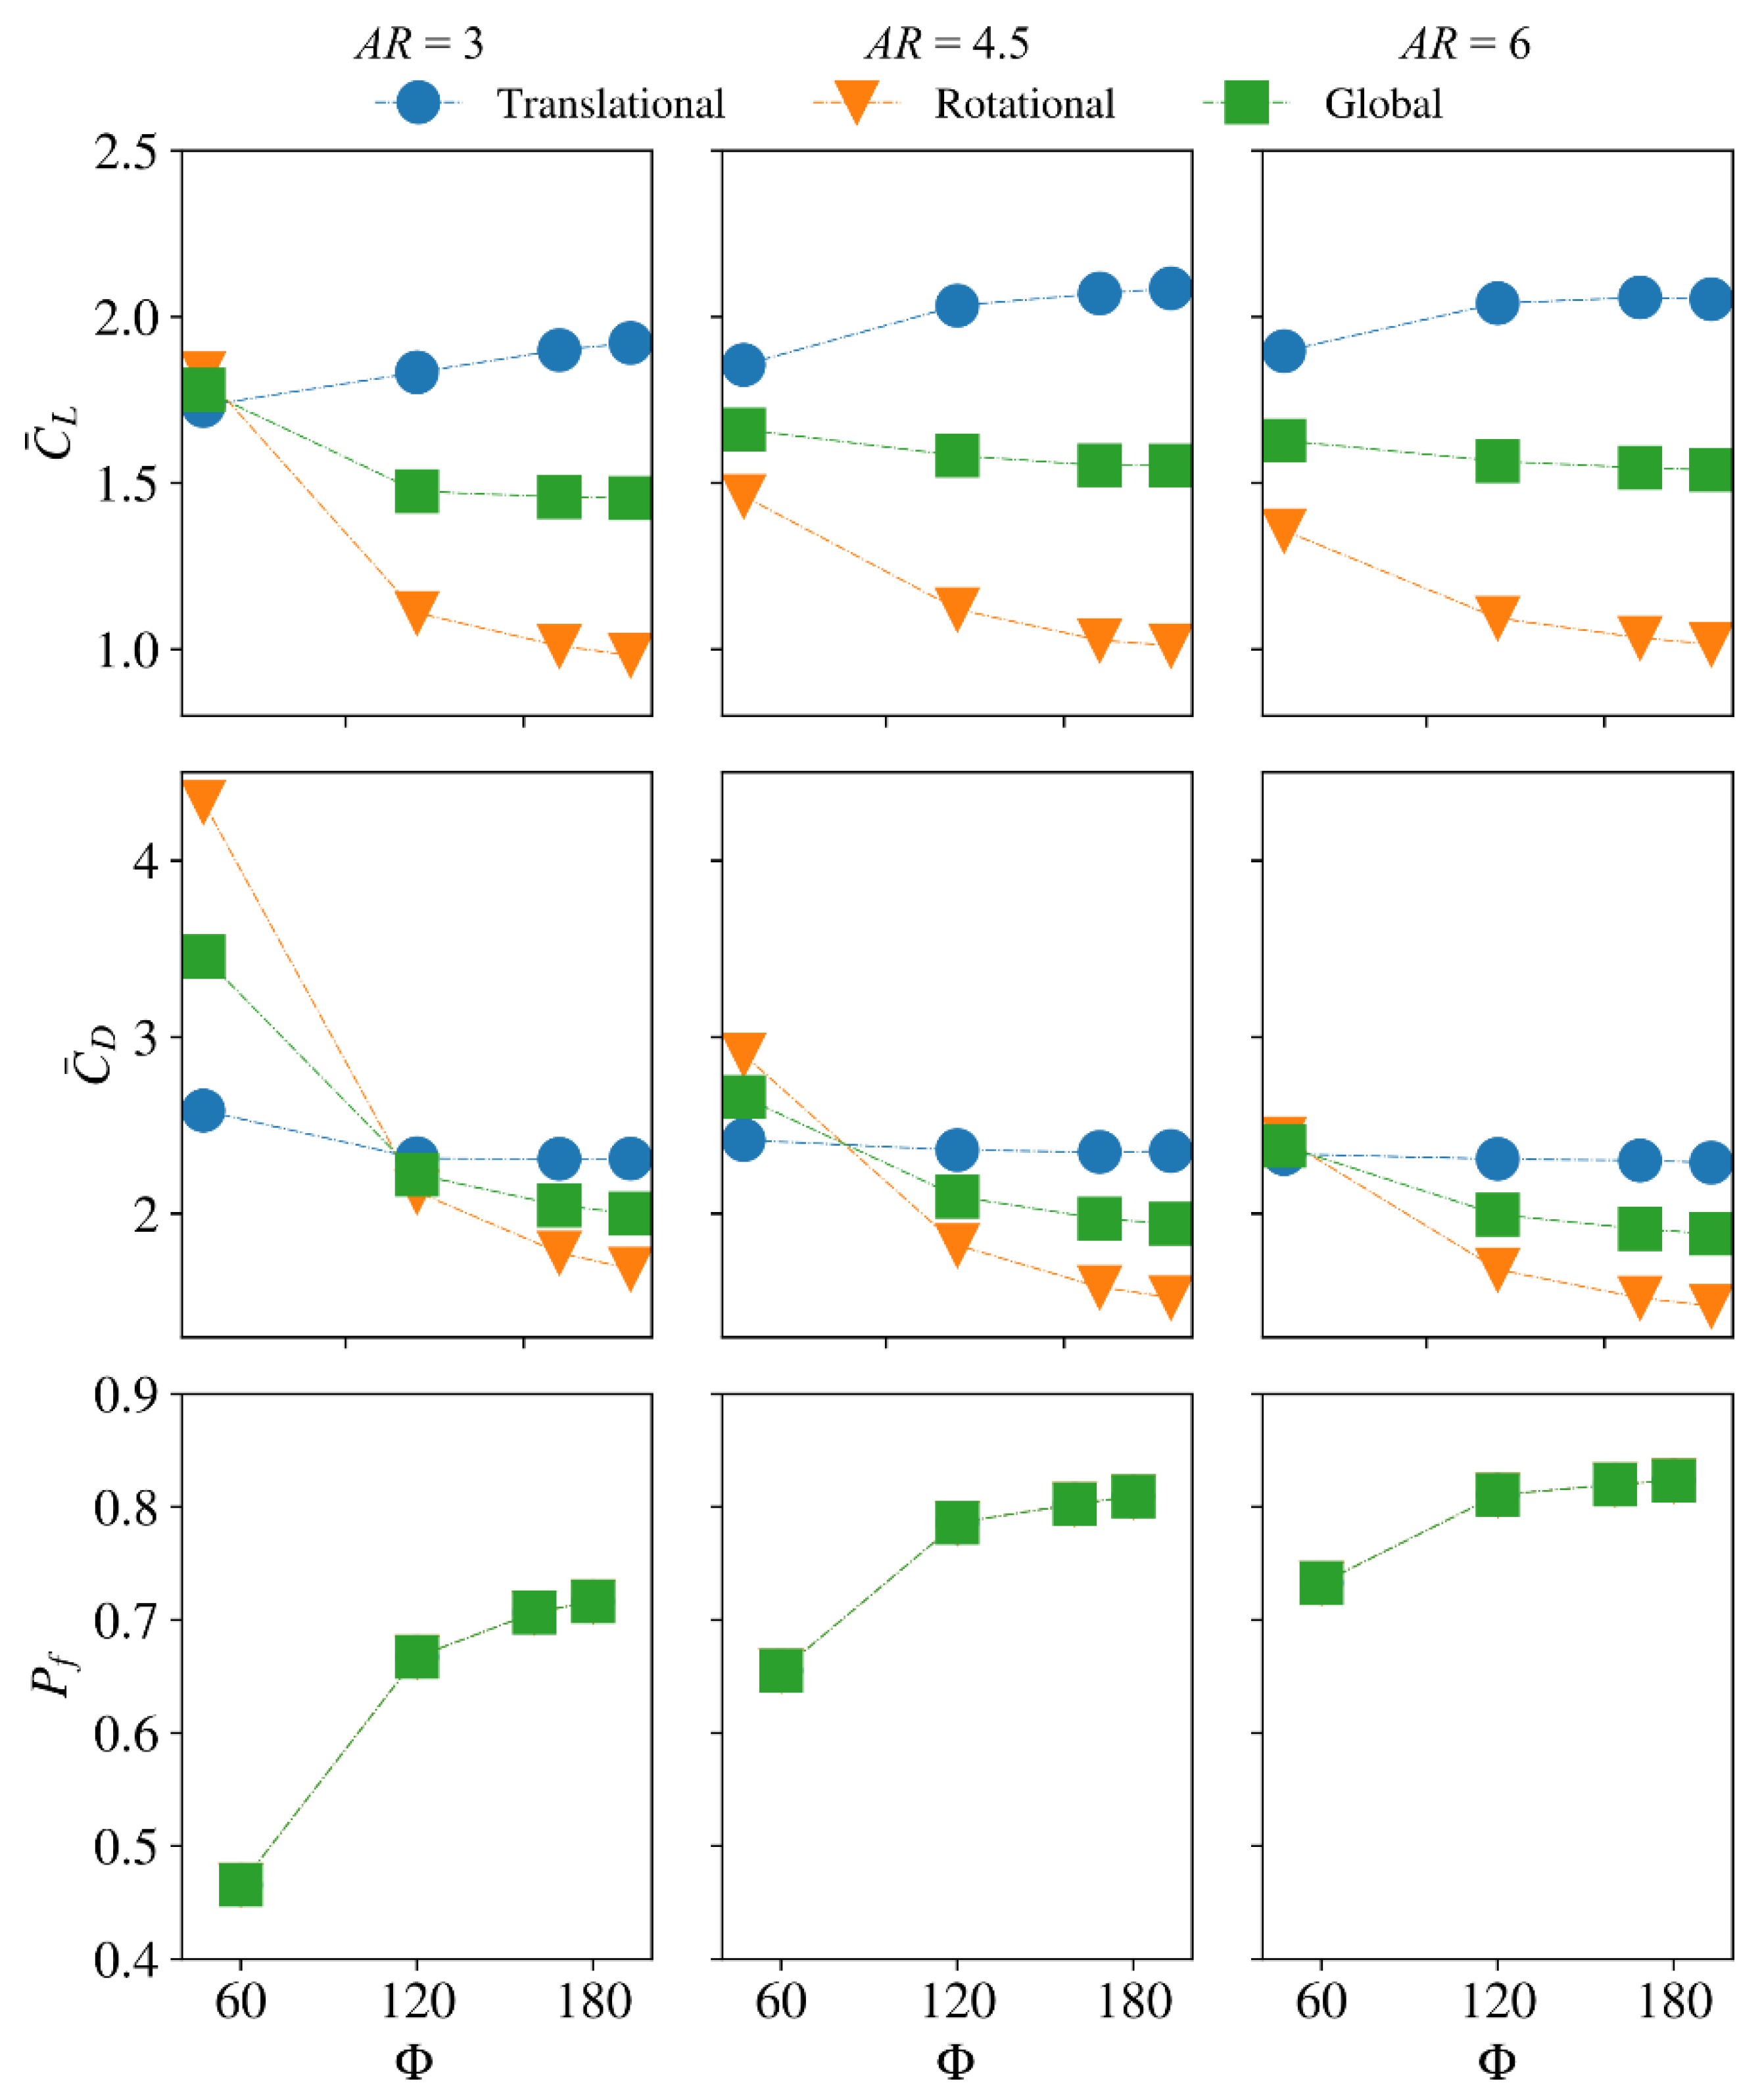
Figure 9.
Flow structures for the different stroke amplitudes for (a) = 3, (b) = 4.5, and (c) = 6.

Figure 10.
Normal force coefficient distribution along the wingspan for wings with different radial centroid locations. Grey areas represent regions where the normal force coefficient at = 4.9 becomes lower than that at = 4.8. Stroke amplitude is fixed to 160° and the aspect ratio is fixed to 4.5.
Figure 10.
Normal force coefficient distribution along the wingspan for wings with different radial centroid locations. Grey areas represent regions where the normal force coefficient at = 4.9 becomes lower than that at = 4.8. Stroke amplitude is fixed to 160° and the aspect ratio is fixed to 4.5.

Figure 11.
Flow evolution at different time instances for (a) = 0.4 and (b) = 0.6.
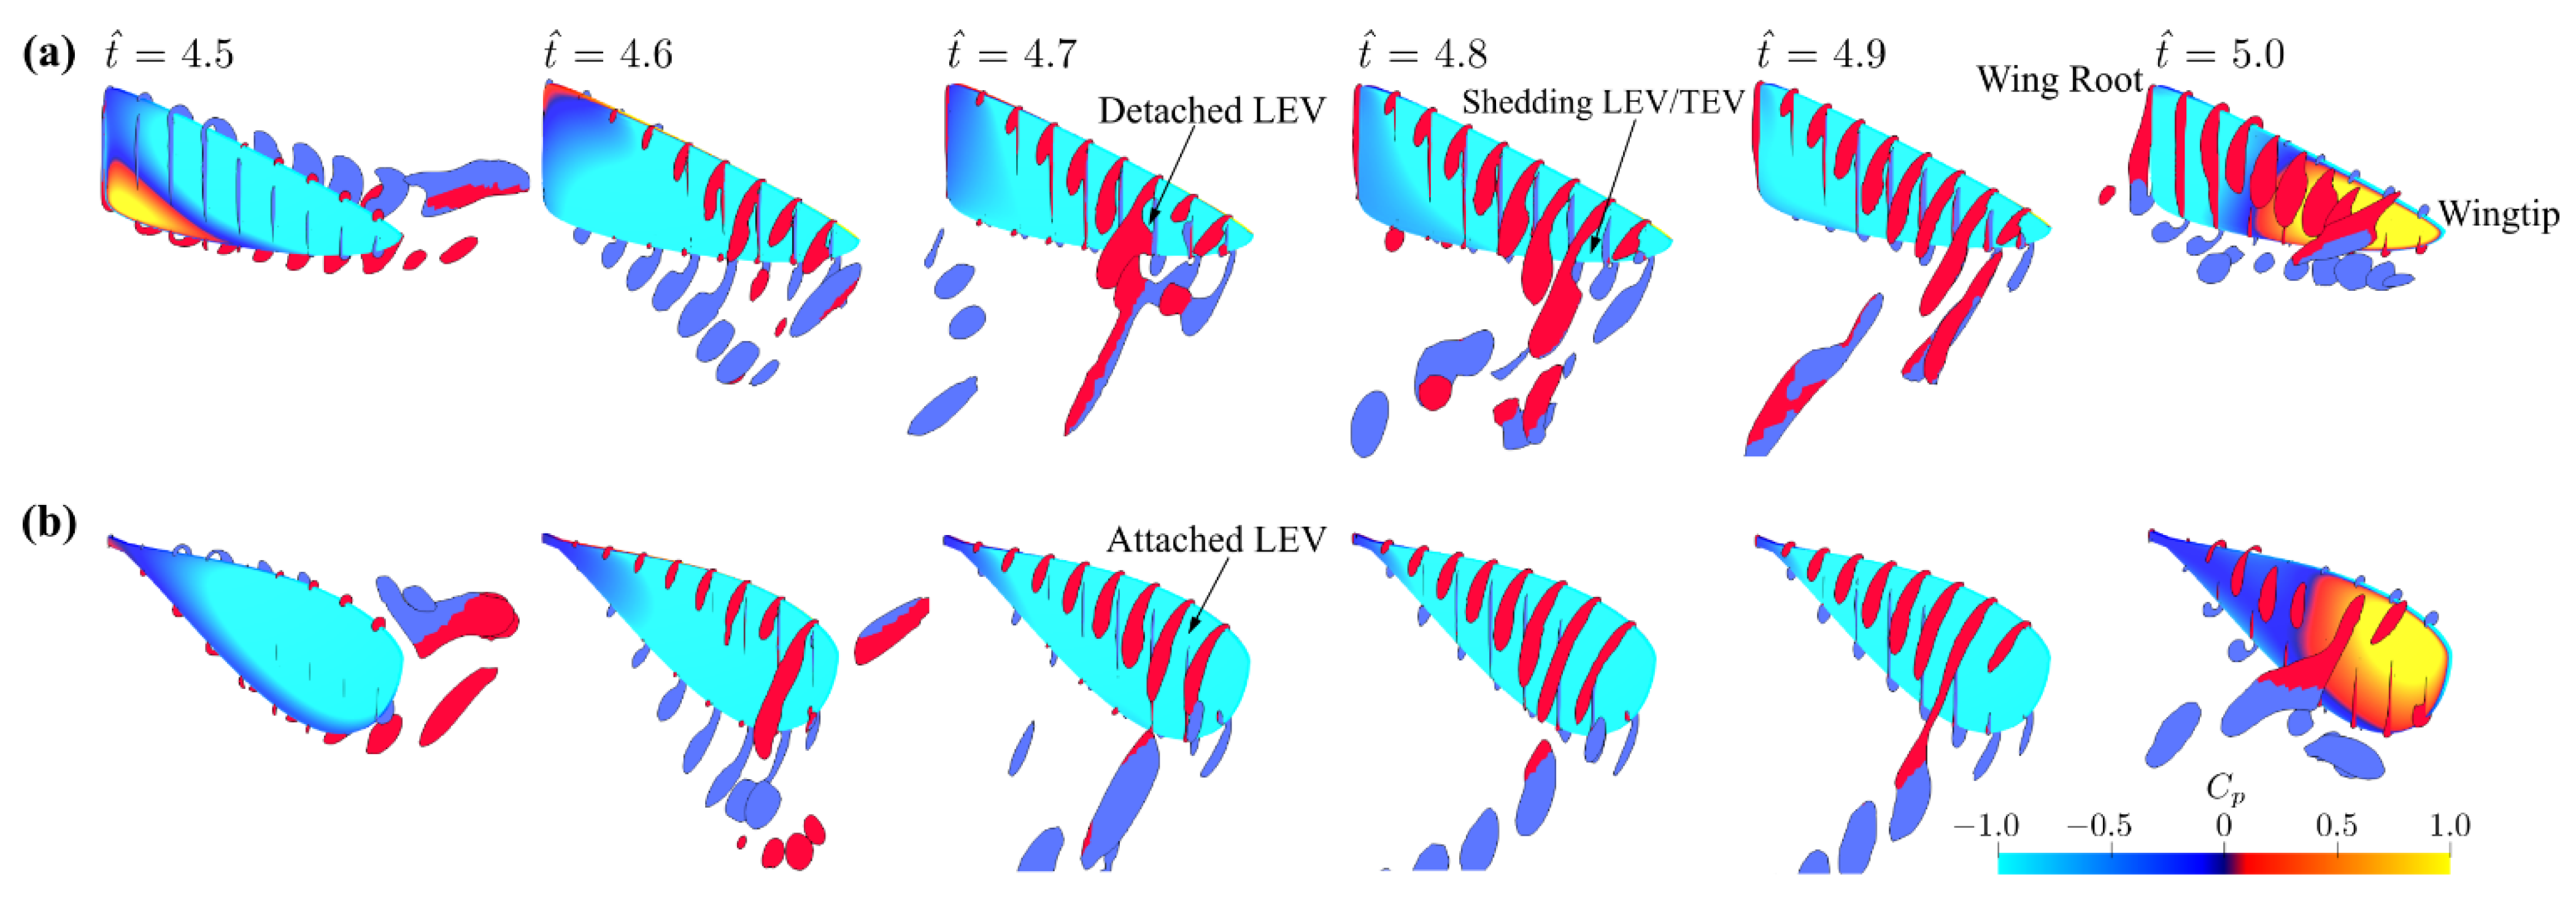
Figure 12.
Average lift and drag coefficients for the translational phase, rotational phase, and the whole/global wing stroke, for the different dimensionless radial centroid locations.
Figure 12.
Average lift and drag coefficients for the translational phase, rotational phase, and the whole/global wing stroke, for the different dimensionless radial centroid locations.
Figure 13.
Variations of the lift and drag coefficients for different stroke amplitudes and radial centroid locations. Wing translational phases are indicated by white shading; wing rotational phases are indicated by grey shading.
Figure 13.
Variations of the lift and drag coefficients for different stroke amplitudes and radial centroid locations. Wing translational phases are indicated by white shading; wing rotational phases are indicated by grey shading.
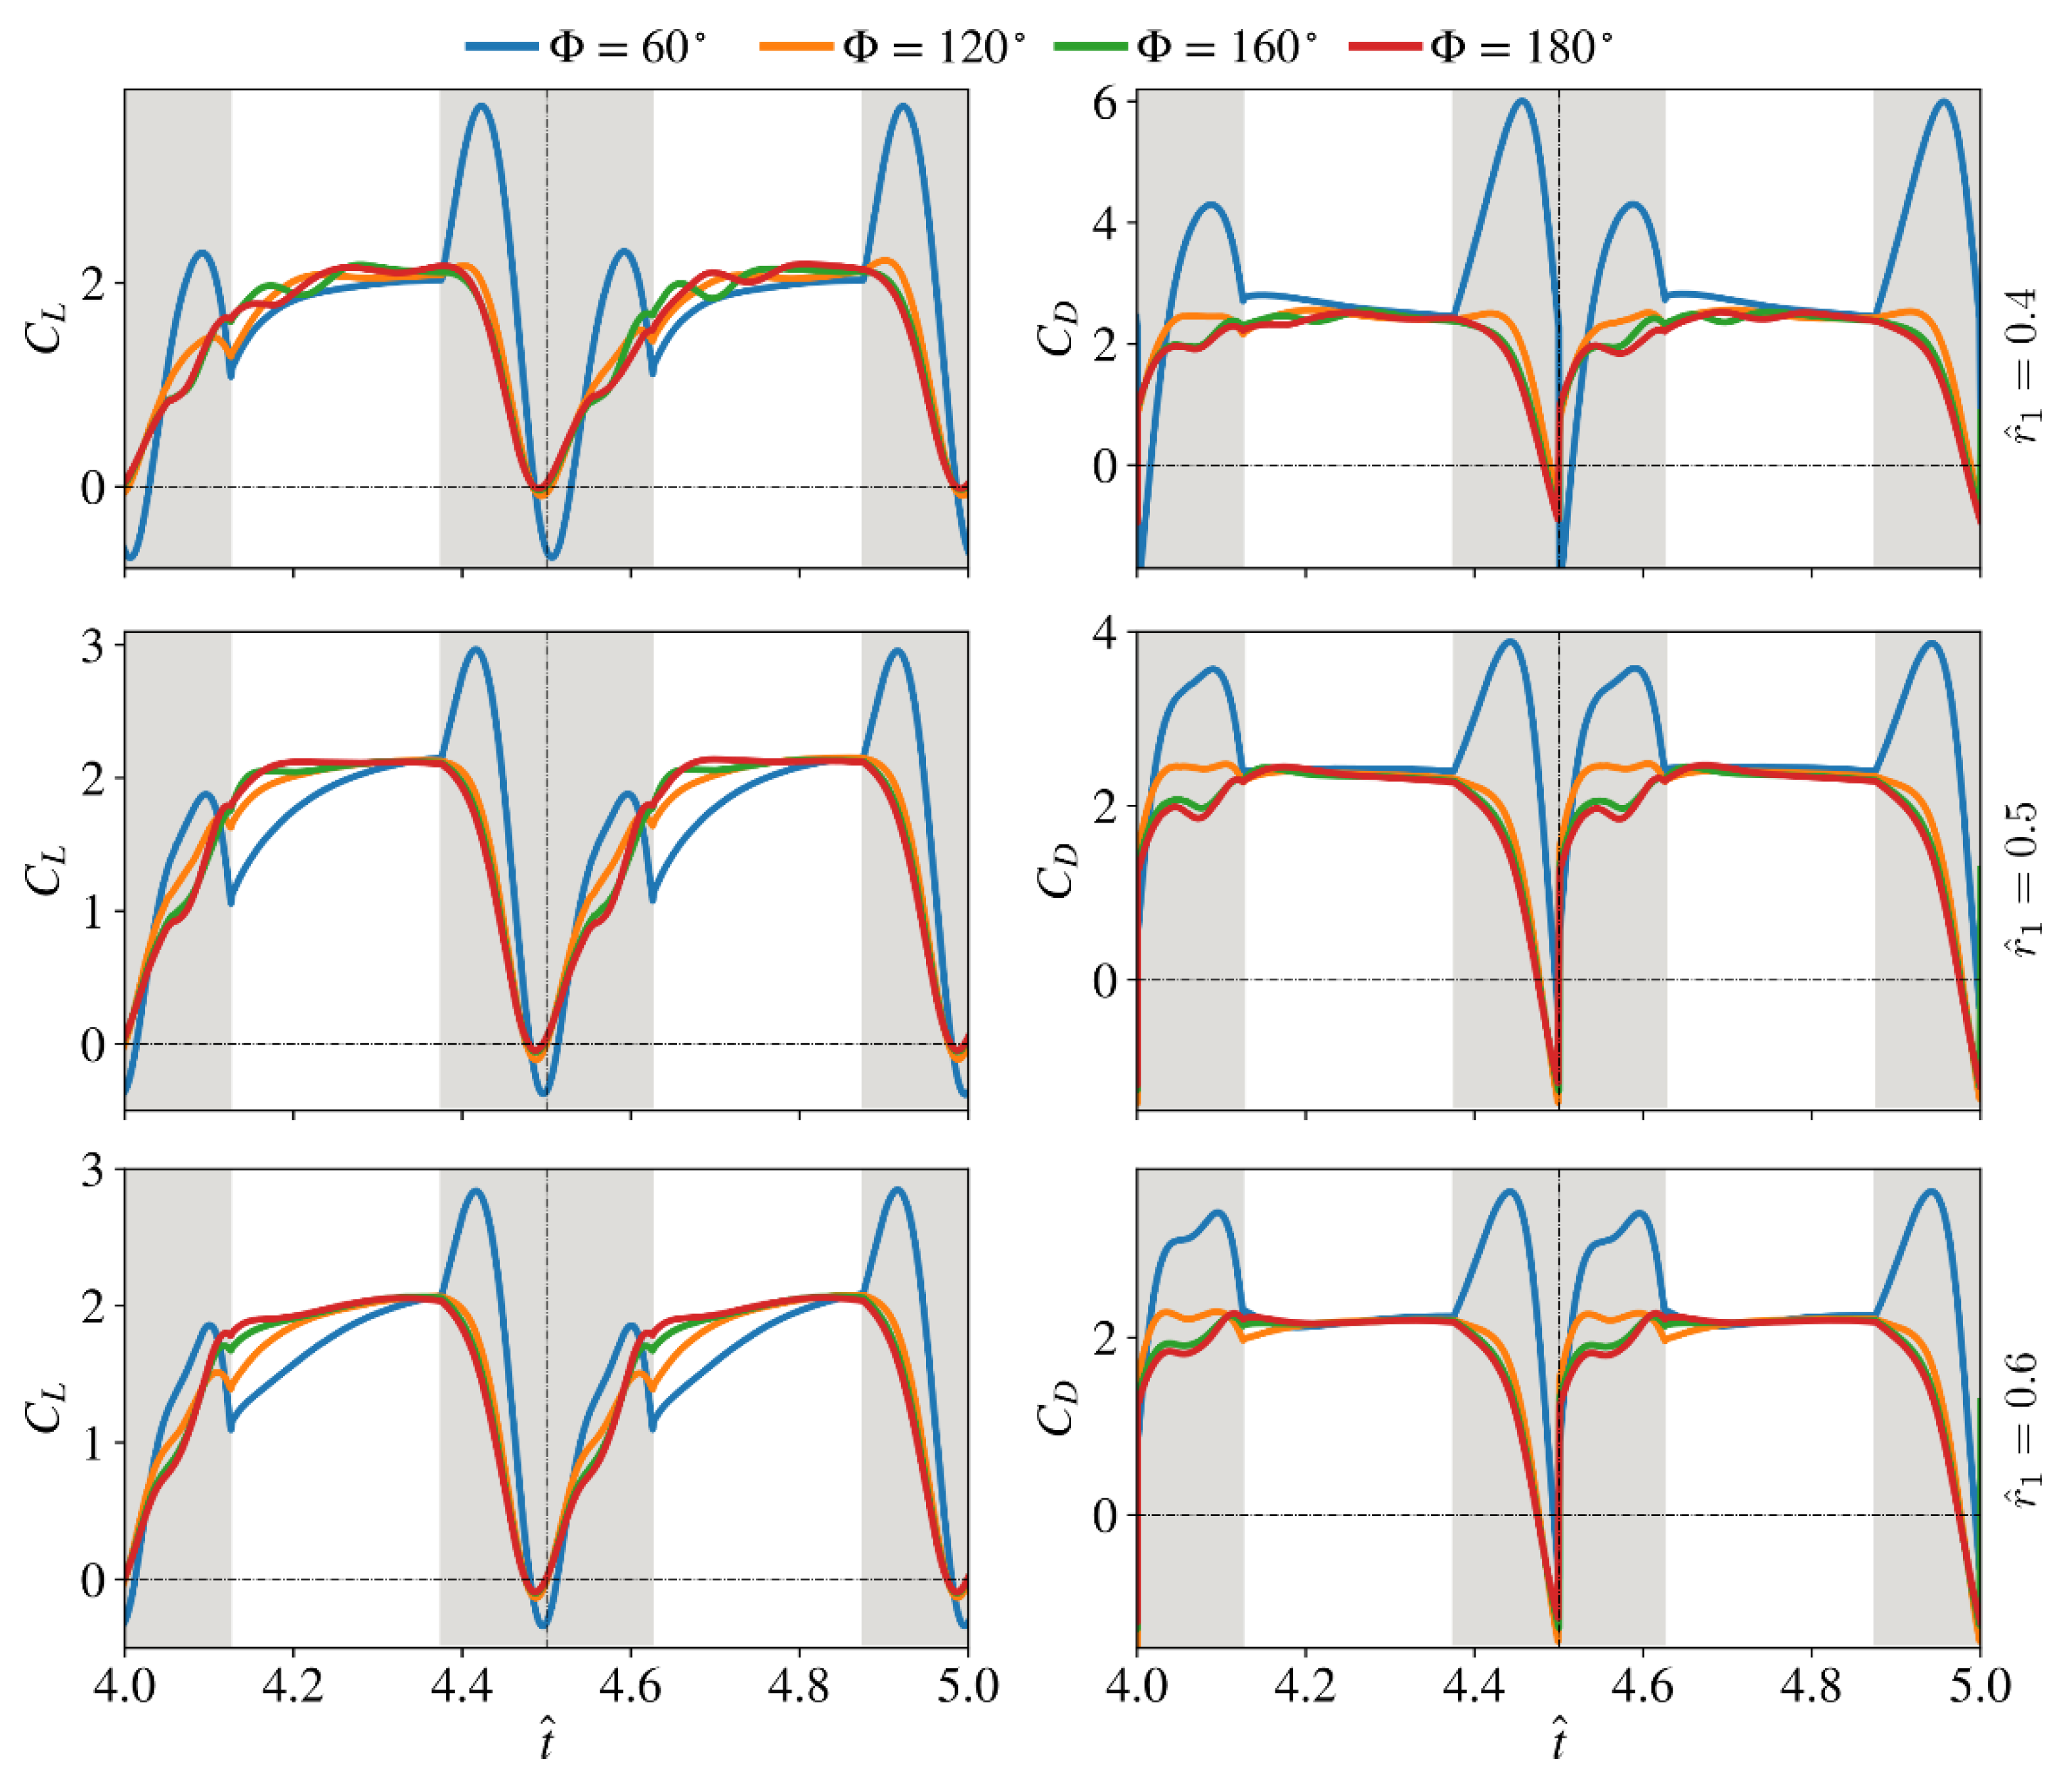
Figure 14.
Comparison of the average lift and drag coefficients as well as power factor for different stroke amplitudes and radial centroid locations. Aspect ratio is fixed at 4.5.
Figure 14.
Comparison of the average lift and drag coefficients as well as power factor for different stroke amplitudes and radial centroid locations. Aspect ratio is fixed at 4.5.
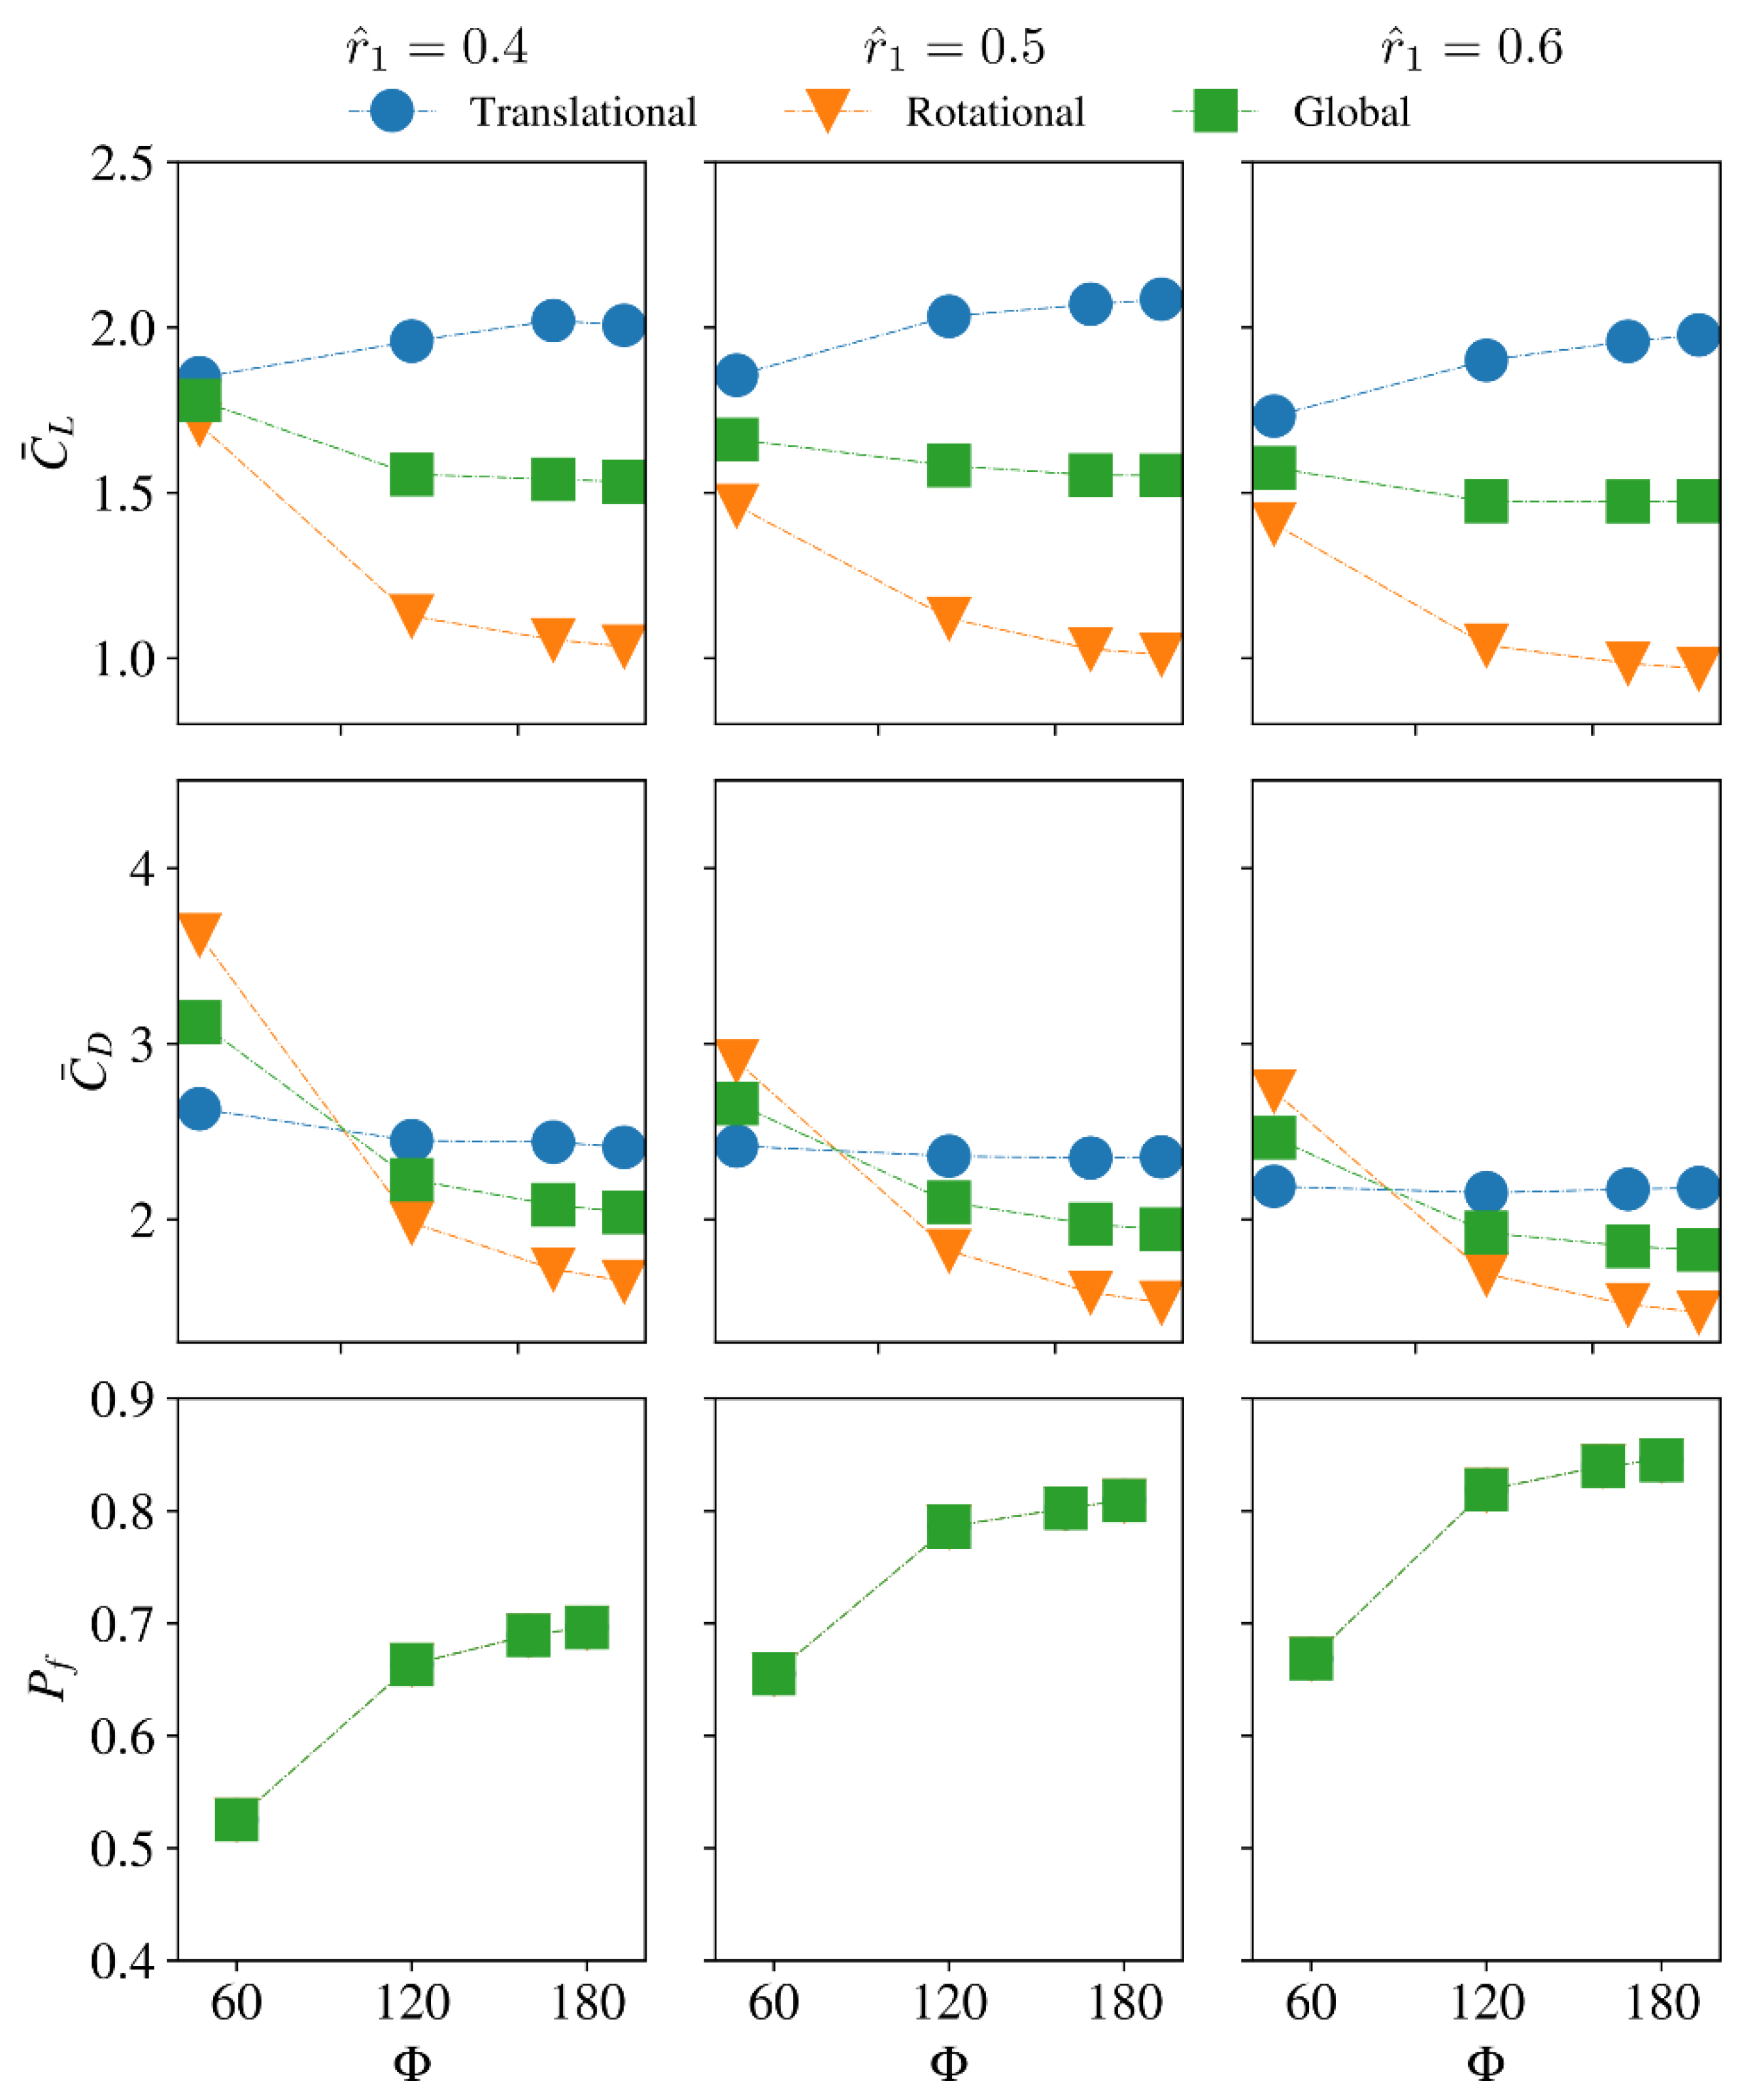
Figure 15.
Flow structures for different stroke amplitudes for (a) = 0.4, (b) = 0.6.

Publisher’s Note: MDPI stays neutral with regard to jurisdictional claims in published maps and institutional affiliations. |
© 2022 by the authors. Licensee MDPI, Basel, Switzerland. This article is an open access article distributed under the terms and conditions of the Creative Commons Attribution (CC BY) license (https://creativecommons.org/licenses/by/4.0/).
Share and Cite
MDPI and ACS Style
Li, H.; Nabawy, M.R.A. Effects of Stroke Amplitude and Wing Planform on the Aerodynamic Performance of Hovering Flapping Wings. Aerospace 2022, 9, 479. https://doi.org/10.3390/aerospace9090479
AMA Style
Li H, Nabawy MRA. Effects of Stroke Amplitude and Wing Planform on the Aerodynamic Performance of Hovering Flapping Wings. Aerospace. 2022; 9(9):479. https://doi.org/10.3390/aerospace9090479
Chicago/Turabian StyleLi, Hao, and Mostafa R. A. Nabawy. 2022. "Effects of Stroke Amplitude and Wing Planform on the Aerodynamic Performance of Hovering Flapping Wings" Aerospace 9, no. 9: 479. https://doi.org/10.3390/aerospace9090479
Note that from the first issue of 2016, this journal uses article numbers instead of page numbers. See further details here.