Article

Acoustic Similarity Predicts Vowel Phoneme Detection in an Unfamiliar Regional Accent: Evidence from Monolinguals, Bilinguals and Second-Language Learners

1
Linguistics Department, University of Potsdam, Karl-Liebknecht-Straße 24–25, 14476 Potsdam, Germany
2
The MARCS Institute for Brain, Behaviour and Development, Western Sydney University, Locked Bag 1797, Penrith, NSW 2751, Australia
*
Author to whom correspondence should be addressed.
Languages 2024, 9(2), 62; https://doi.org/10.3390/languages9020062
Submission received: 28 November 2023 / Revised: 25 January 2024 / Accepted: 31 January 2024 / Published: 14 February 2024
(This article belongs to the Special Issue An Acoustic Analysis of Vowels)

Abstract

:
When encountering an unfamiliar accent, a hypothesized perceptual challenge is associating its phonetic realizations with the intended phonemic categories. Greater accumulated exposure to the language might afford richer representations of phonetic variants, thereby increasing the chance of detecting unfamiliar accent speakers’ intended phonemes. The present study examined the extent to which the detection of vowel phonemes spoken in an unfamiliar regional accent of English is facilitated or hindered depending on their acoustic similarity to vowels produced in a familiar accent. Monolinguals, experienced bilinguals and native German second-language (L2) learners completed a phoneme detection task. Based on duration and formant trajectory information, unfamiliar accent speakers’ vowels were classed as acoustically “similar” or “dissimilar” to counterpart phonemes in the familiar accent. All three participant groups were substantially less sensitive to the phonemic identities of “dissimilar” compared to “similar” vowels. Unlike monolinguals and bilinguals, L2 learners showed a response shift for “dissimilar” vowels, reflecting a cautious approach to these items. Monolinguals displayed somewhat heightened sensitivity compared to bilinguals, suggesting that greater accumulated exposure aided phoneme detection for both “similar” and “dissimilar” vowels. Overall, acoustic similarity predicted the relative success of detecting vowel phonemes in cross-dialectal speech perception across groups with varied linguistic backgrounds.

1. Introduction

Although listeners regularly encounter speakers with accents they have rarely heard before, perceiving speech in an unfamiliar accent can present challenges. When the phonetic properties of a speaker’s speech deviate—often unpredictably so—from familiar or expected norms, it may be difficult to recognize the speaker’s intended message with certainty. To establish how challenging phonetic deviations from familiar or expected norms are, the present study applied the acoustic similarity or magnitude of phonetic distinction hypothesis (Escudero 2005; Escudero et al. 2014), which is an evidence-based approach originally developed for predicting performance in non-native or second-language (L2) vowel perception in both children and adults. It was hypothesized that the relative success of detecting vowel phonemes in an unfamiliar accent would be largely predictable based on how much the vowels diverge acoustically from the listener’s expectations of phoneme categories shaped during previous exposure to familiar accent speakers. Further expected was that the degree of accumulated exposure may modulate how well acoustic similarity can predict phoneme detection in an unfamiliar accent, as some listeners may have different knowledge of and commitment to phonemic categories of the familiar accent due to their linguistic background and age. More extensive accumulated exposure might lead to richer or more varied representations, which could provide a more effective resource for detecting the intended phonemes produced by speakers of an unfamiliar accent. In order to examine phoneme detection among individuals varying in experience with spoken English, performance by monolinguals, experienced bilinguals and native German L2 learners was tested.

1.1. Acoustic Similarity in Speech Perception by Inexperienced and L2 Listeners

Major theories of speech perception posit that native speech sound categories are used in the comprehension of incoming speech (e.g., Kuhl 1993; Best 1995; Escudero 2005). For phonetic segments such as vowels and consonants, it is generally assumed that the percepts are mapped onto abstract phonemic categories formed based on ambient speech input; that is, percepts are assigned to functionally equivalent classes (Holt and Lotto 2010). Early in life, infants possess an ability to discriminate most phonetic contrasts, including those which may not be used in ambient speech to distinguish words, and this ability declines into adulthood as speech perception becomes attuned toward a particular language or variety (e.g., Werker and Tees 1984; Werker and Lalonde 1988). When encountering a second language (L2) in adulthood, L2 segments are often categorized into (i.e., assimilated to) phonemic categories built due to L1 speech input (Strange et al. 2007; Best 1995; Escudero 2005). This manner of perceiving L2 speech segments often turns out to be insufficient (Lado 1957; Stockwell et al. 1965), requiring existing categories to be modified and/or new ones to be established (e.g., Escudero 2005; Yazawa et al. 2023). As perceptual classification is an important element of theorizing non-native speech perception and L2 speech learning (e.g., Flege and Bohn 2021; Best and Tyler 2007), much of the work in this context has focused on sensitivity to phonetic differences in the L2 which are likely to lead to success in perceiving L2 or non-native phonemic contrasts (e.g., Iverson et al. 2003; Best et al. 2001).
Acoustic similarity between the realizations of phonemes across native and non-native languages has been used to predict cross-language perceptual categorization, which in turn may reflect challenges in the perception of speech in the target non-native language (for a recent review, see Georgiou 2023). In the case of vowels, a line of studies has found that cross-language acoustic similarity predicts performance in speech perception tasks by individuals inexperienced in the target non-native language, as well as by L2 learners with some experience (e.g., Gilichinskaya and Strange 2010; Escudero and Vasiliev 2011; Escudero et al. 2012; Elvin et al. 2014; Strange et al. 2011; Georgiou 2023; Williams and Escudero 2014b). In a now established methodology, acoustic measurements, e.g., duration and first, second and third formant (F1, F2, F3) frequency values from tokens of native vowel categories act as input into a statistical classification model. Typically, the vowel tokens, from which measurements are taken, are spoken by multiple speakers in several phonetic contexts to approximate some of the natural phonetic variation found in speech production. Vowel tokens are then assigned probabilities of being members of the native vowel categories specified in the model. When the input tokens are assigned to their intended phonemic categories with high probabilities, it is assumed that the chosen acoustic parameters correspond to phonetic information highly relevant for accurately distinguishing native vowel categories by real listeners. The model trained on native vowel tokens can then be used to classify a set of non-native vowel tokens into native categories. The resulting classification probability patterns provide measures of how acoustically similar—and theoretically also how perceptually similar—the non-native vowel tokens are to native vowel categories.
As an example, by using duration values and F1, F2 and F3 frequency values from three time points (25%, 50% and 75%), Escudero and Vasiliev (2011) found that instances of non-native Canadian English /bɛg/ were classified as containing native Peruvian Spanish /e/ with a probability of 0.78, indicating relatively high cross-linguistic acoustic similarity, while instances of Canadian English /bæg/ were classified as containing Peruvian Spanish /e/ with a probability of 0.39, indicating lower acoustic similarity. In a perceptual categorization test by native Peruvian Spanish listeners, the model’s acoustic classification patterns were borne out: non-native Canadian English /bɛg/ was categorized as /e/ with a probability of 0.89, and Canadian English /bæg/ as /e/ with a probability of 0.45. Several studies have reported that cross-language acoustic and/or perceptual similarity patterns predict performance in other kinds of perceptual tasks (Escudero and Williams 2012; Elvin et al. 2014; Tyler et al. 2014; Alispahic et al. 2017; Georgiou 2022; Georgiou and Dimitriou 2023), highlighting the likely relevance of phonetic similarity in speech perception more generally. For example, even with a large vocabulary size, native Russian listeners struggled to perceive the L2 English contrast between /e/ and /æ/, since both are acoustically similar to the Russian vowel phoneme /e/ (Georgiou et al. 2020). Likewise, Baigorri et al. (2019) found that Spanish L2 learners of English performed poorly in discriminating English /ʌ/–/æ/ and /ʌ/–/ɑ/, as both contrasts were assimilated into the native Spanish /a/ category.

1.2. Speech Perception in Monolingual and Multilingual Populations

Phonetic realizations of phonemes naturally vary across different speakers or groups of speakers within a linguistic community. Common and sometimes quite extreme examples of phonetic variants in spoken English are observed in speech produced in different regional accents (e.g., Hillenbrand et al. 1995; Fox and Jacewicz 2009; Ferragne and Pellegrino 2010; Williams and Escudero 2014a). Some prior familiarity with an accent greatly enhances monolinguals’ perception of speech produced in that accent (Adank et al. 2009). As for unfamiliar accents, monolingual listeners have been shown to adapt to its phonetic properties; that is, adjust how they utilize phonetic information, thereby improving word recognition accuracy (Maye et al. 2008). Additionally, familiarity through prior exposure with similar accents can facilitate adaptation (Sumner and Samuel 2009; Le et al. 2007). In the absence of adaptation opportunities or feedback (cf., Kriengwatana et al. 2016), the unpredictability of how phonemic categories in an unfamiliar accent may be phonetically realized can pose a significant challenge when encountering the accent for the first time. For instance, Shaw et al. (2023) presented monolingual listeners with /zVbə/ utterances where /V/ was a vowel produced in various regional accents of English by multiple speakers. Listeners were instructed to choose the English vowel in the first syllable. Surprisingly, identification accuracy was well below ceiling, demonstrating the level of perceptual difficulty in associating the unfamiliar accent realizations with the phonemic categories intended by speakers. The authors interpreted this finding as “information loss” between the speaker and listener, as the acoustic signals for the vowel segments were compromised by being realized in unexpected or unusual ways. Without feedback (e.g., Kriengwatana et al. 2016) or additional clues, such as a semantic context or socio-indexical information, listeners were frequently unsure of which phonemic category had been intended by the speaker.
While progress is being made in understanding how accent-related phonetic variation is dealt with by monolinguals, much less is known about the case of multilingual listeners despite multilingualism being common globally. There is little reason to expect Shaw et al.’s (2023) general diagnosis—that the perceptual difficulty stems from information loss between the speaker and listener—will not generalize to multilingual listeners, such as L2 learners and experienced bilinguals (e.g., Kriengwatana et al. 2016). What remains particularly unclear is whether multilingual populations face less or more pronounced challenges and/or distinct challenges compared to monolinguals. Expectations in this issue may be garnered from the most extensively studied type of information loss between the speaker and listener, namely, degrading the acoustic speech signal by masking it with energetic noise (e.g., Mayo et al. 1997; Rogers et al. 2006; MacKay et al. 2001; Meador et al. 2000; Bradlow and Bent 2002; Quené and Van Delft 2010; Tabri et al. 2011; for reviews, see Mattys et al. 2013; Middlebrooks et al. 2017; Van Hedger and Johnsrude 2022). A repeated finding in such tasks is that L2 learners and experienced bilinguals perform somewhat worse than their monolingual counterparts in speech perception tasks affected by noise. That is, L2 learners and bilinguals are more adversely affected by the level of masking noise than monolinguals are (for reviews, see Lecumberri et al. 2010; Scharenborg and van Os 2019). Two further common findings are that experienced bilinguals tend to perform better than less experienced L2 learners (Mayo et al. 1997; Weiss and Dempsey 2008; Meador et al. 2000; MacKay et al. 2001), and that differences between monolinguals, L2 learners and experienced bilinguals may be reduced in tasks requiring attention to high-order linguistic clues (e.g., Flege and Liu 2001; MacKay et al. 2001; Cutler et al. 2004; Rogers et al. 2006).
Differences between linguistic populations in adverse listening conditions are typically attributed to hypothesized differences in neural commitment (i.e., the robustness of connectivity between neural populations associated with linguistic categories) and the quality of representations across phonological, lexical, syntactic and higher levels of linguistic processing (i.e., the precision with which a listener’s mental categories correspond to linguistic categories) (Mattys et al. 2013; Schmidtke 2016). Aside from the effects of noise itself, a primary proposal is that the formation of linguistic representations is influenced by the amount of accumulated exposure to speech in the target language (for a theoretical discussion, see Schmidtke 2016). L2 learners and, to a lesser extent, experienced bilinguals are hypothesized to accumulate less input of speech in a target language relative to monolinguals because they speak and hear the target language proportionately less often compared to monolinguals, who communicate exclusively in the target language. Thus, phonological category representations formed due to greater, and presumably also more varied, input may turn out to be richer with respect to likely or potential phonetic variants in the target language. Consequently, a greater amount of accumulated exposure to speech in the target language may increase the chance of recognizing the intended phonemic categories in adverse and “information-lossy” conditions. Conversely, lower experience with speech in the target language may lead to the formation of more limited, less robust or less varied category representations, resulting in a greater level of uncertainty and more frequent errors in adverse listening situations.

1.3. Present Study

Inspired by the theoretical and methodological approach developed in research examining non-native speech and L2 perception, the present study investigated whether perceptual difficulties when encountering an unfamiliar accent of English can be accounted for by acoustic similarity. Based on duration and formant frequency trajectory information, vowels produced in an unfamiliar accent were judged as acoustically “similar” or “dissimilar” to counterpart phonemes in a familiar accent of English. Lower acoustic similarity was hypothesized to lead to poorer-quality information about the phonemic identity intended by the speaker, resulting in greater difficulty in successfully detecting the intended phonemes. It was also conjectured that lower acoustic similarity may present less of a challenge to listeners with greater accumulated exposure to the target language. Native German L2 learners’ phoneme detection was tested in Experiment 1, while monolinguals and experienced bilinguals were examined and compared in Experiment 2. Results from both experiments were analyzed using signal detection theory (SDT), which provides a framework for assessing perceptual sensitivity separately from the response strategy (Macmillan and Creelman 1991) and will be described further in Section 2.5.

2. Experiment 1: L2 Learners

Experiment 1 investigated the effect of acoustic similarity on phoneme detection in an unfamiliar accent of English by individuals whose accumulated exposure to the speech in the target language was relatively limited, namely, native German L2 learners of English who had never spent an extended period in an L2-speaking country. The familiar accent was Standard Southern British English (S.Eng), which is the variety of English most commonly taught to learners in Germany. The unfamiliar accent was a variety of Northern British English (N.Eng) spoken in Yorkshire, UK, and was chosen due to its status as a regional accent unlikely to be encountered in language-learning settings and due to the variety displaying some substantial phonetic differences from the S.Eng accent (Williams and Escudero 2014a). Due to the practical constraint of assembling a monolingual group experienced with the S.Eng accent, we opted for a within-participants design in which L2 learners’ phoneme detection was compared between the familiar and unfamiliar accents (as opposed to a between-participants design in which performance was compared between less and more experienced listeners; cf., Experiment 2).

2.1. Participants

A total of 22 native speakers of Standard German took part (14 female; 8 male), who were students at the University of Potsdam, Germany, and all received either course credit or a small monetary sum for their participation. Individuals had a median age of 23 years (range: 18–35). All reported learning English as a L2 at school, modeled on a S.Eng accent, until the age of 18, and all reported that this was the accent of English with which they were most familiar. No participant self-reported familiarity specifically with the regional accents of Northern England. All participants reported speaking and hearing their L1 (German) more than their L2 (English), and none had spent more than one month in an English-speaking country. Participants self-rated their proficiency levels in English on a scale of 1 (very low proficiency) to 7 (native speaker), and the modal and median level was 5 (level 3: n = 3; level 4: n = 7; level 5: n = 10; level 6: n = 2). Performance was checked to ensure participants completed the task as intended.

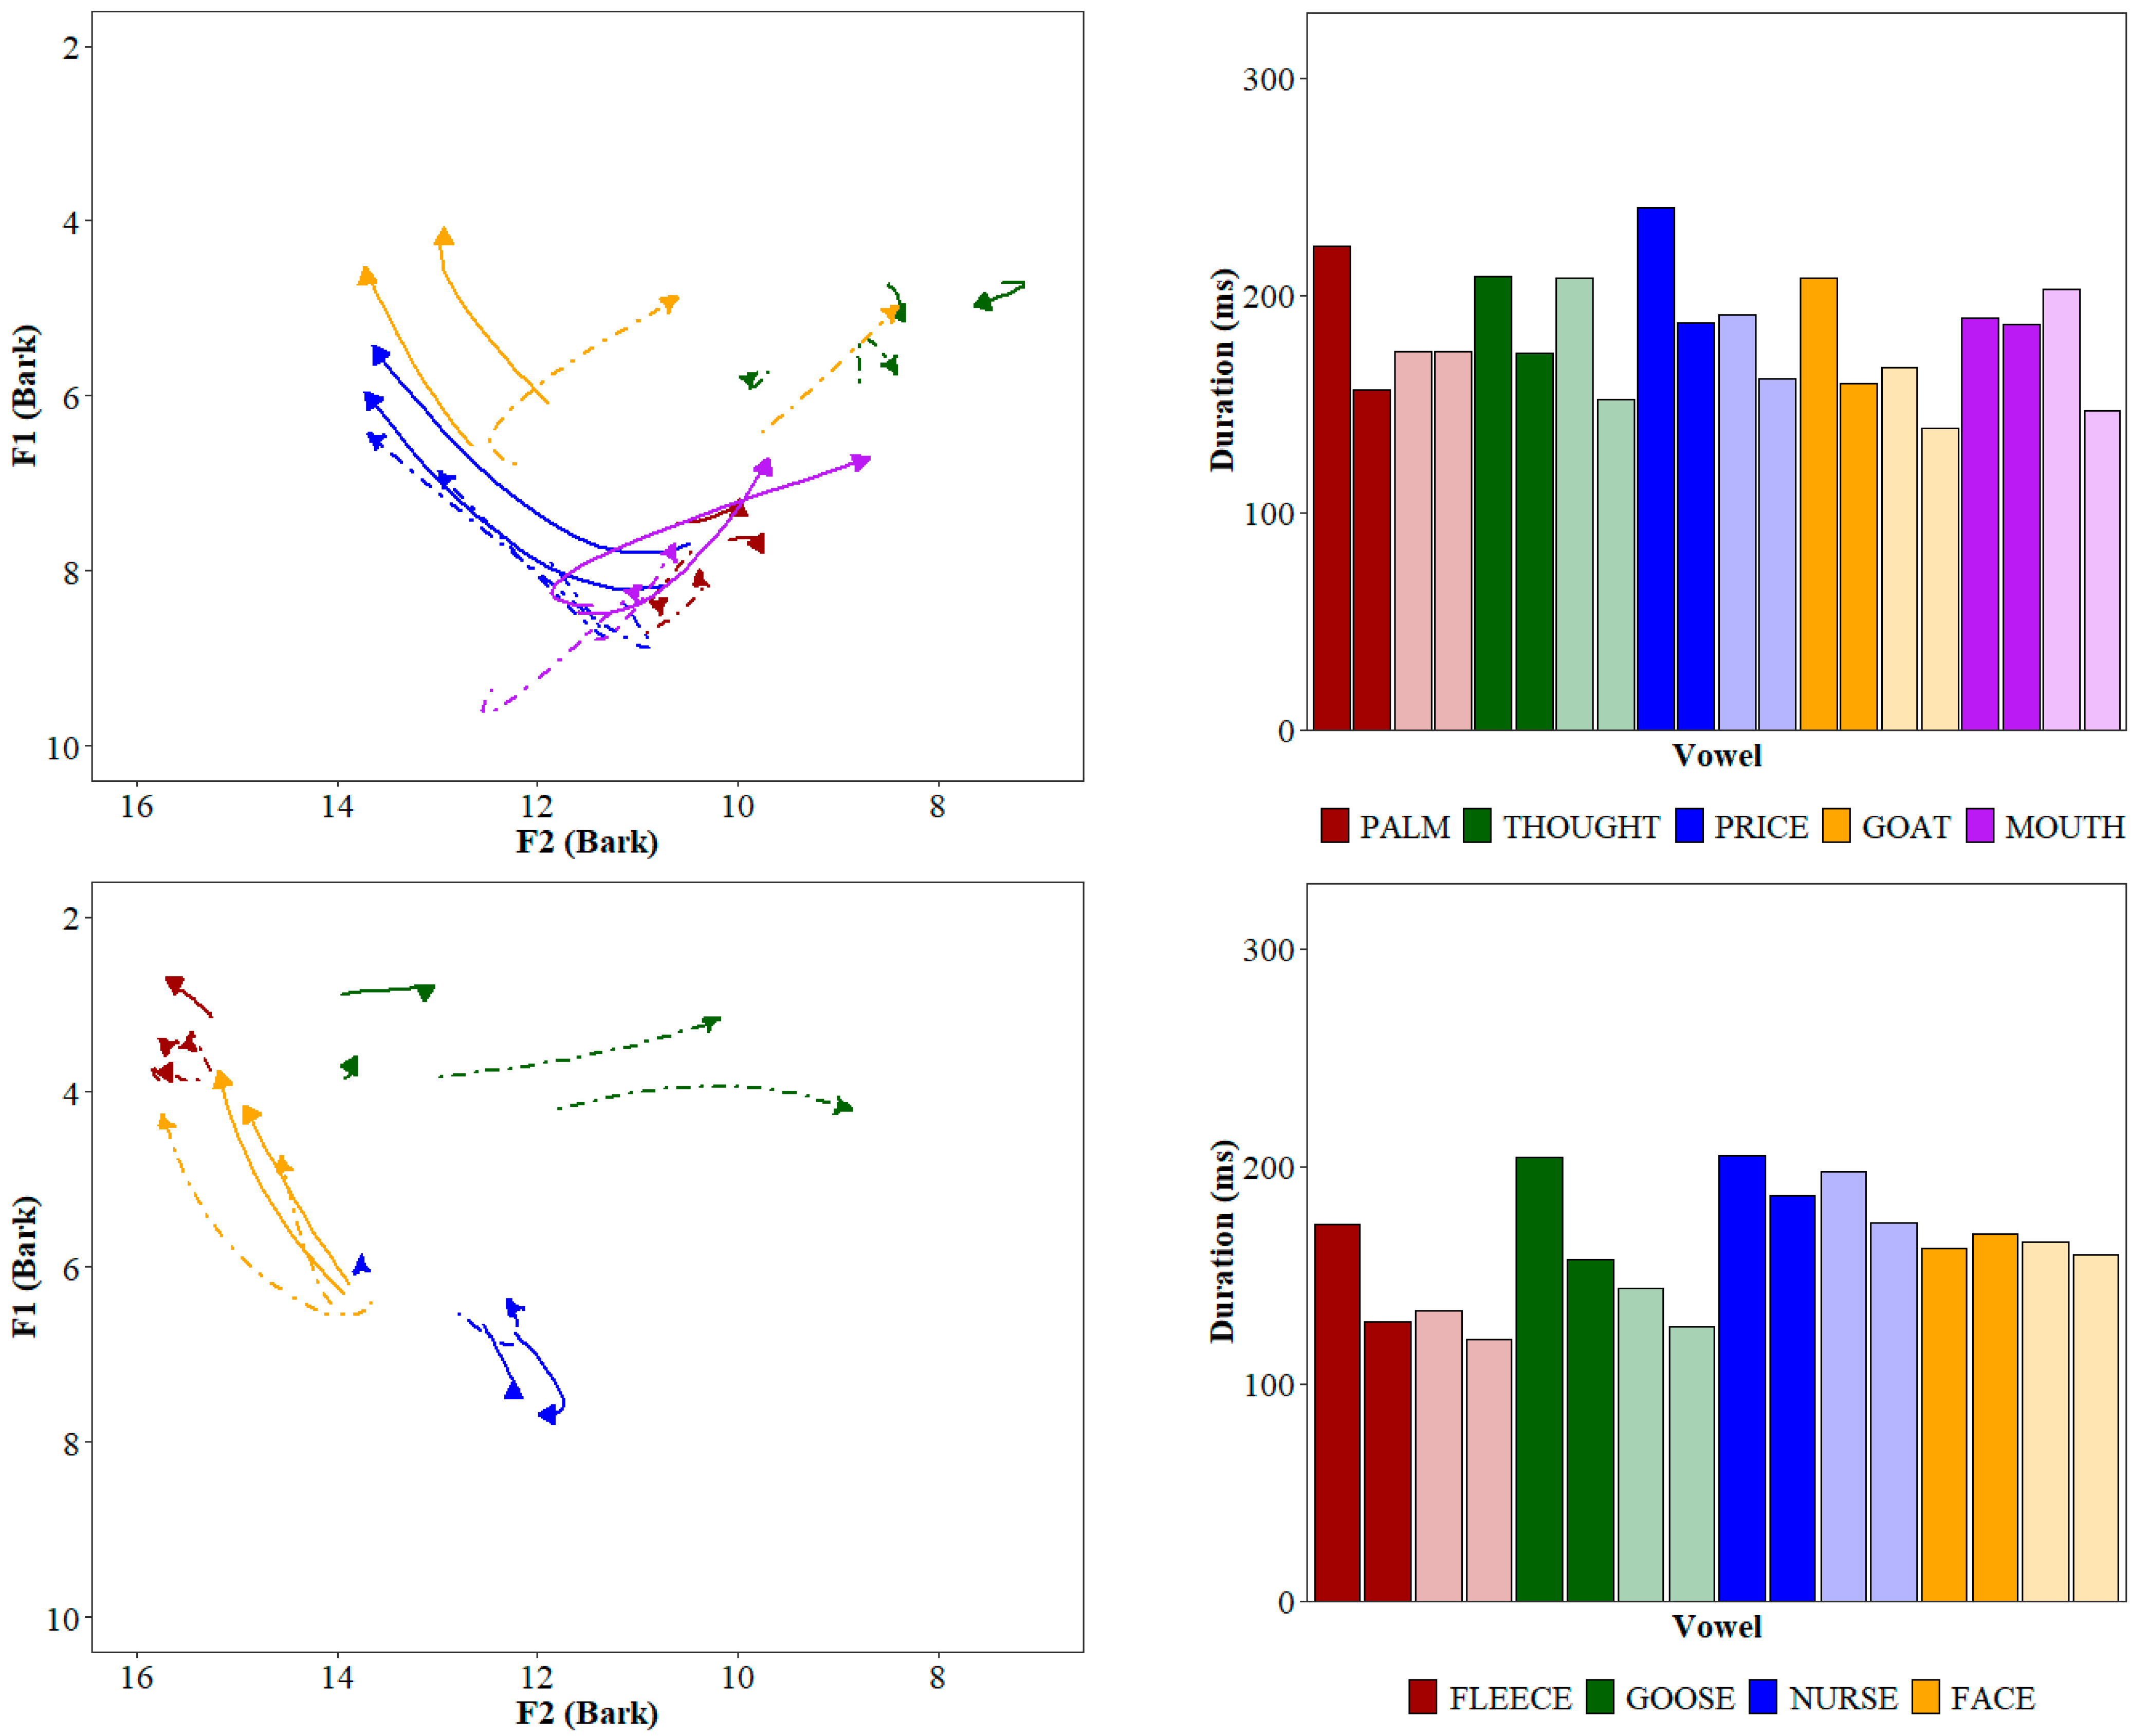
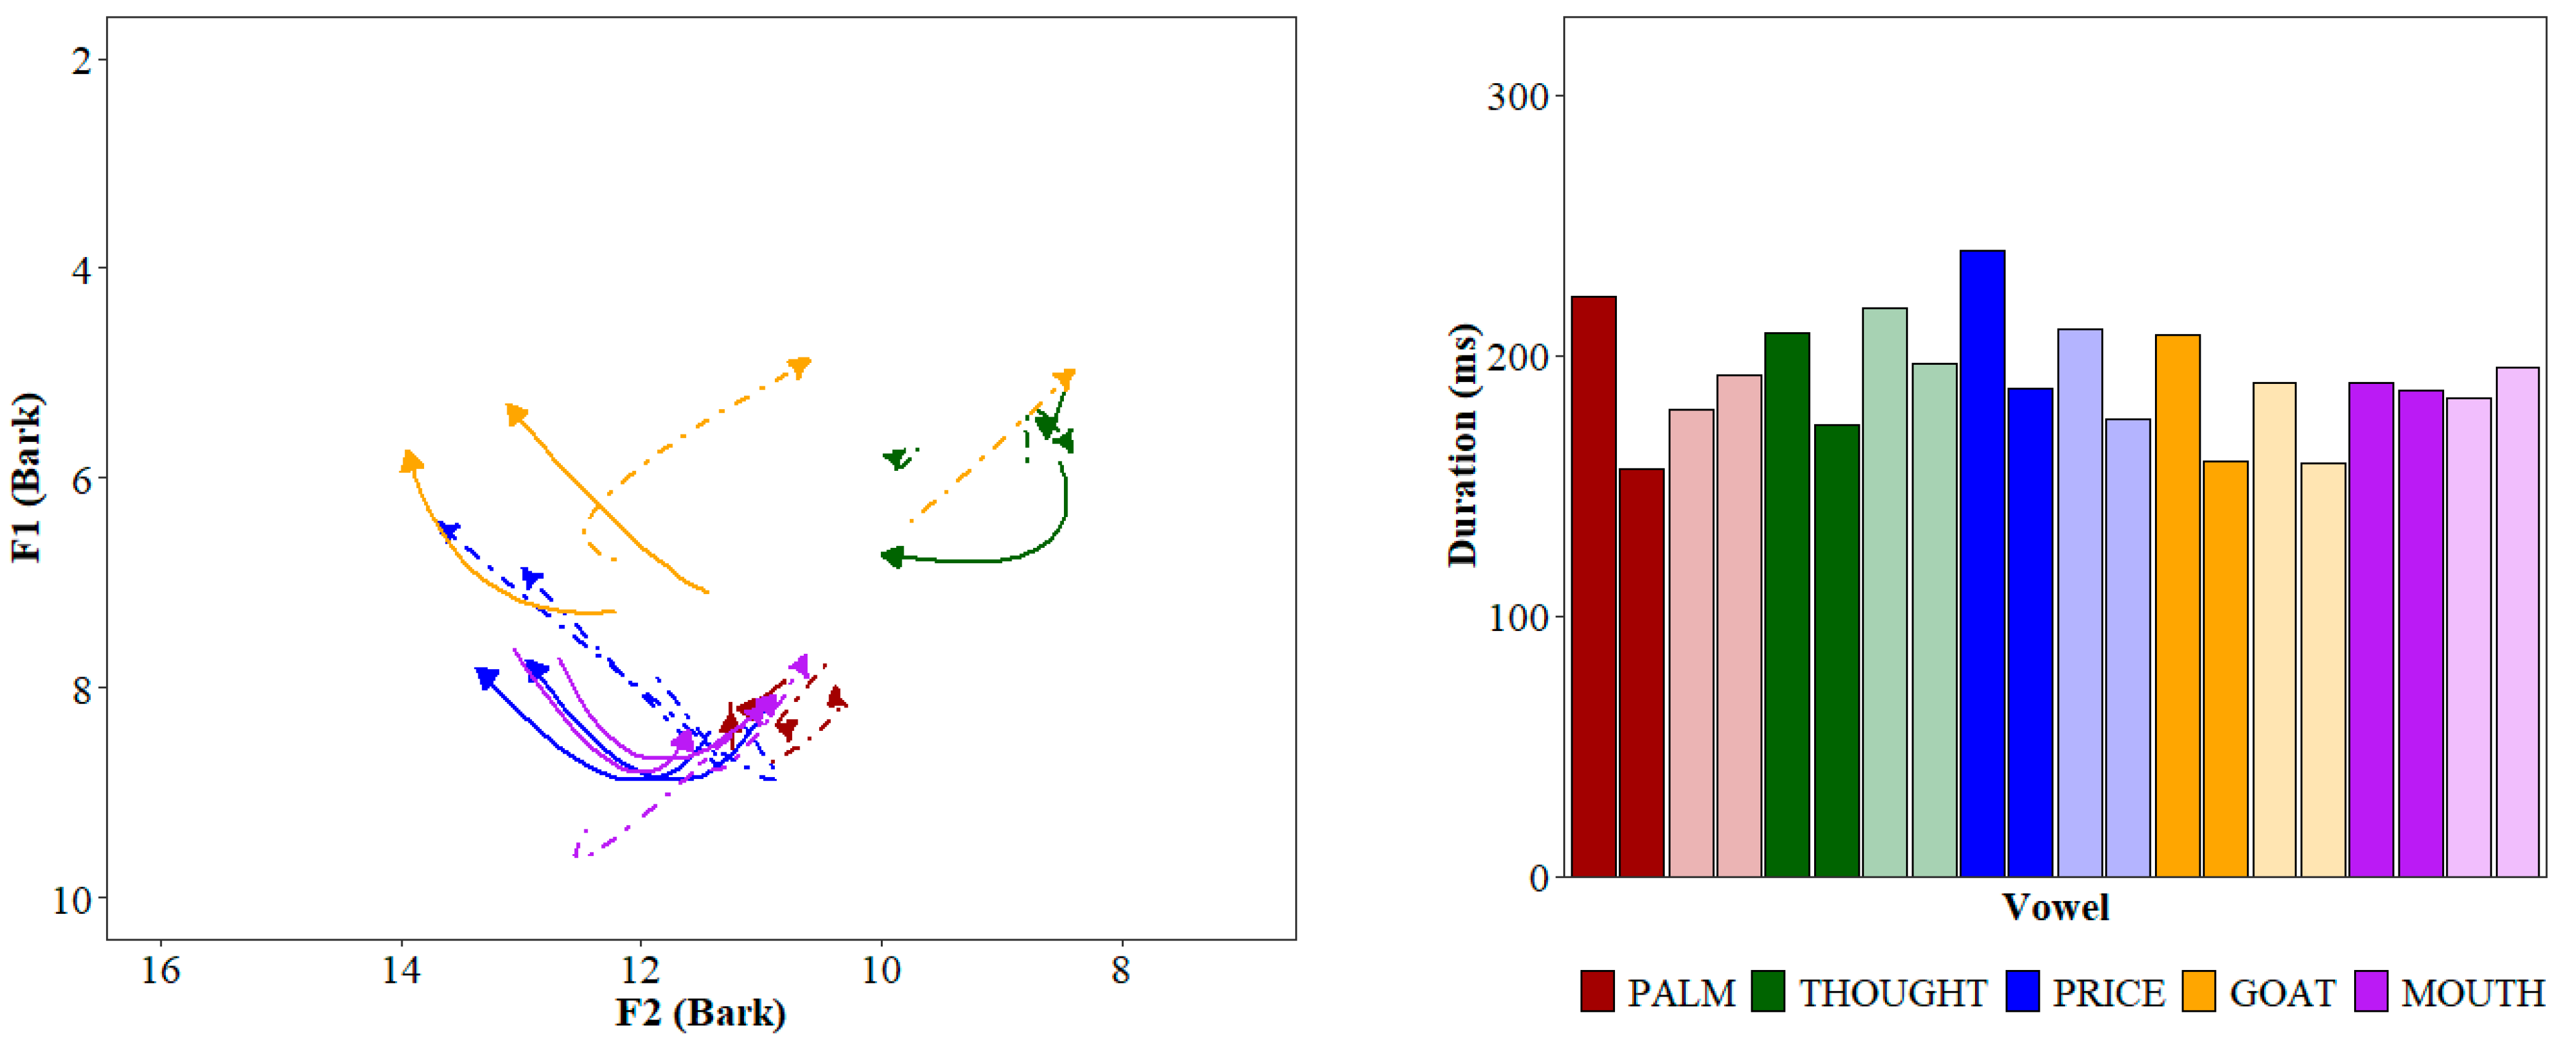
2.2. Auditory Syllables and Acoustic Similarity Procedure

To ensure auditory syllables incorporated multiple S.Eng vowel categories and several phonetic contexts, 14 phonemically different syllables1 were used: five were /bVp/ syllables, in which V was the vowel in palm, thought, price, goat or mouth, four were /dVk/ syllables, containing fleece, goose, nurse or face, and five were /fVf/ syllables featuring kit, trap, strut, lot or foot. Lexical set labels (Wells 1982) are used here to facilitate referring to phonemic categories across different English varieties. All 14 syllables were produced by 4 female speakers of English—2 speaking the familiar S.Eng accent and 2 speaking the unfamiliar N.Eng accent. In total, 56 auditory syllables (14 syllables × 2 N.Eng speakers and 14 syllables × 2 S.Eng speakers) were used to create the experiment items. Duration values and formant trajectory information of the 56 auditory syllables are illustrated in Figure 1.
To gauge the acoustic similarity of the realizations of the vowels in the 56 auditory syllables to their phonemic counterparts in the S.Eng accent, a Bayesian multinomial logistic regression was first trained on a small corpus of S.Eng vowel tokens produced by 10 female monolingual speakers (Williams and Escudero 2014a). The brms package (Bürkner 2017; Bürkner 2018) in the R program (R Core Team 2021) was used. The dependent variable comprised 16 S.Eng vowel categories (fleece, kit, dress, nurse, trap, palm, strut, lot, thought, foot, goose, face, mouth, price, goat, choice) and the predictors were duration and measures representing the mean, change and curvature of the trajectories of the first three formants (Williams and Escudero 2014a; Elvin et al. 2016). Further information on the procedure is provided in the Supplementary Materials, which also include details on the practicalities of setting up such a model (Gelman et al. 2008) and how to assess model convergence (Stan Development Team 2022). Next, the vowels from 56 auditory syllables (28 S.Eng and 28 N.Eng) were classified by the model and assigned classification probabilities. The results are summarized in Appendix A. The 28 vowels produced by the 2 S.Eng speakers were assigned to their intended phonemic categories with high probabilities (mean = 0.96). For the 28 vowels produced by the 2 N.Eng speakers, classification probabilities were lower (mean = 0.51), as several N.Eng realizations were acoustically very unlike their S.Eng phonemic counterparts. On the basis of the classification probabilities, the 28 N.Eng syllables were divided into 2 groups: those (n = 14) with a high probability of being assigned to the intended phonemic category (>0.5) were labeled as highly similar (“Similar”), while those (n = 14) receiving a low probability (<0.5) were judged as not similar to the intended category (“Dissimilar”).

2.3. Experiment Items

Experiment items comprised a pair of auditory syllables spoken by two different speakers. Participants were tasked with deciding whether the two speakers were saying the same syllable or different syllables. This design was chosen over one involving participants assigning orthographic category labels to spoken stimuli because English accents exhibit a relatively large number of vowel phonemes and conveying multiple possibilities for vowels at the same time with standard orthography can be problematic, e.g., an individual might use the same letters, oo, to indicate hearing the foot as well as the goose vowels (Shaw et al. 2023).
400 items (auditory syllable pairs) were presented to each participant. The 14 /CVC/ syllables were paired with themselves and every other syllable of the same consonantal frame to yield phonemically Matching (n = 14) and Mismatching (n = 26) pairs. Speakers in each item either spoke in the same accent (the two S.Eng speakers) or different accents (one S.Eng speaker and one N.Eng speaker). The order of speakers was counterbalanced, yielding 400 unique items: (40 syllable pairs (14 Matching and 26 Mismatching) × 5 speaker combinations (S.Eng1–S.Eng2, S.Eng1–N.Eng1, S.Eng1–N.Eng2, S.Eng2–N.Eng1 and S.Eng2–N.Eng2) × 2 speaker orders). The two auditory syllables were separated by 1000 ms of silence (cf., 1200 ms used by Flege and MacKay 2004), as a relatively long temporal interval is thought to encourage access to learned phonemic categories rather than promote auditory comparisons (Colantoni et al. 2021). The 400 items were grouped into three similarity conditions: 80 items (20%) contained instances of syllables produced only in the familiar S.Eng accent (Matching: n = 28; Mismatching: n = 52), 160 (40%) contained one S.Eng syllable and one Similar N.Eng syllable (Matching: n = 56; Mismatching: n = 104) and 160 (40%) contained one S.Eng syllable and one Dissimilar N.Eng syllable (Matching: n = 56; Mismatching: n = 104).

2.4. Experiment Procedure

The experiment session for the phoneme detection task was conducted entirely in English. The instructions informed participants that they would hear two speakers saying “new” English words (the /CVC/ syllables), and the goal was to decide whether the two speakers were saying the same new word or different new words. Participants were reminded to listen to the syllables being said and not to how the speakers sounded. Participants were instructed to respond as quickly as possible. Each trial began with a small fixation circle in the center of the screen on a white background. Over headphones with the volume set to a comfortable level, participants heard one of the 400 experiment items. The response screen displayed the text “The words are” at the top, and below this was a box on the left and a box on the right sides of the screen. One box contained the text “the same” and the other “different”. To give a response, participants pressed a left or right keyboard key corresponding to one of these two options. Once a response was selected, the response screen was replaced by the screen containing the fixation circle and the next trial started after 1000 ms. Each of the 400 items was presented once in a randomized order (which was different for each participant), and items could not be replayed. Breaks were given after blocks of 40 trials. A familiarization round of 12 trials comprising randomly selected items was conducted before the experiment. The task took participants around 35 min to complete.

2.5. Signal Detection Theory
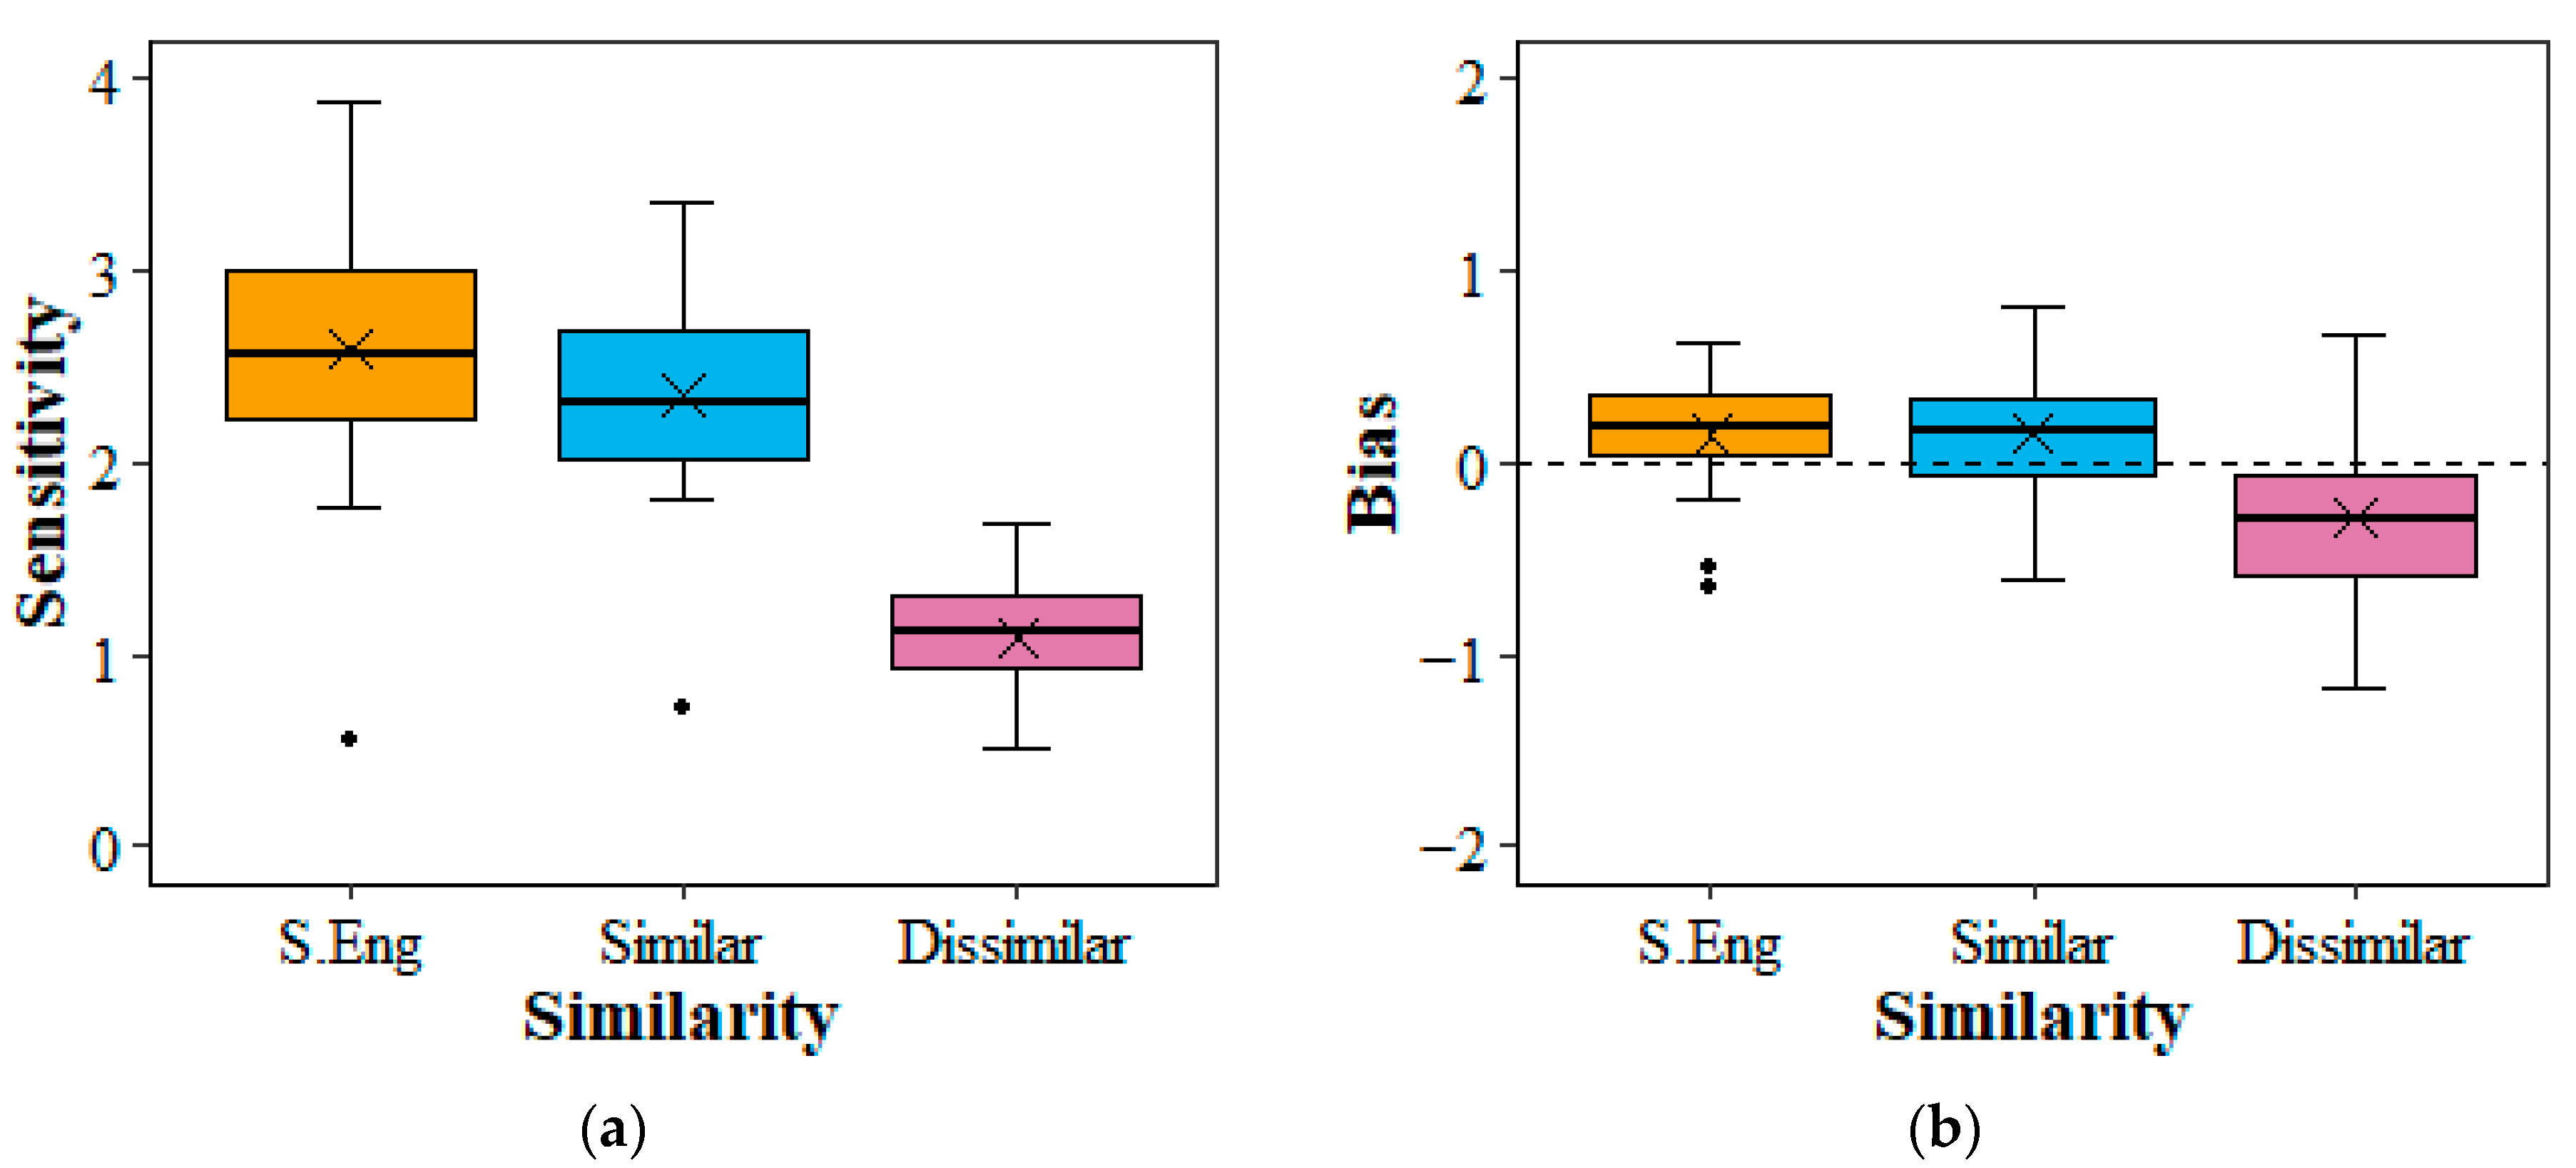
Signal detection theory (SDT) provides a framework for assessing performance according to perceptual sensitivity and a decision criterion (Macmillan and Creelman 1991). It combines the rates of “hits” (in the present task, proportion of Matching items for which matching phonemic identity was correctly labeled “same”) and “false alarms” (proportion of Mismatching items for which matching phonemic identity was incorrectly labeled “same”) into a single sensitivity or discriminability (“d-prime”) score and a separate score for subjective bias. When the difference between hit and false alarm rates is expressed as z-scores, as is customary (Keating 2005), sensitivity scores close to zero indicate that hit and false alarm rates are about equal, suggesting Matching items cannot be differentiated from Mismatching items, while sensitivity scores near 4.65 indicate near-perfect separation (Keating 2005). Response bias is defined here as the probability of selecting “same” averaged across response probabilities from Matching and Mismatching items (DeCarlo 1998). Scores close to zero indicate no particular preference, while more positive or negative scores indicate a preference for selecting one of the two response alternatives.

2.6. Results

Participants’ responses were screened to check they performed the task as intended, i.e., scored clearly above the chance level of 50% correct for two response alternatives. The inclusion criterion was thus a minimum of 60% correct responses averaged over Matching and Mismatching items in the S.Eng condition, which was expected to be easy for L2 learners with a reasonable level of proficiency. All 22 participants met this criterion: the mean percent correct score in the S.Eng condition was 88% (SD: 8%; range: 61–97%). Participants also responded accurately in the Similar condition (mean: 86%; SD: 7%; range: 64–95%), though accuracy fell in the Dissimilar condition (mean: 68%; SD: 6%; range: 55–77%).
Figure 2a displays sensitivity scores according to similarity condition. Mirroring accuracy, sensitivity was generally much higher in the S.Eng and Similar conditions than in the Dissimilar condition. As shown in Figure 2b, bias scores tended to fall around zero in the S.Eng and Similar conditions, indicating no obvious response preference. In the Dissimilar condition, bias scores tended to cluster somewhat below zero, indicating “same” was less likely to be selected.
When computing sensitivity and bias scores from response probabilities by aggregating over items within each participant, as in Figure 2, participant effects may be accounted for, but information regarding item effects is lost. With generalized linear regression modeling, participant and item effects can be modeled simultaneously using crossed group-level (“random”) participant and item effects (Barr et al. 2013). As the probit link function models the probabilities of a binary response with an inverse normal cumulative distribution, as is common when transforming response probabilities into z-scores (Keating 2005), sensitivity and bias scores can be estimated with a predictor denoting “signals” (Matching items) and “non-signals” (Mismatching items) (DeCarlo 1998).
To test for differences between similarity conditions, a Bayesian probit regression model was run with the package brms (Bürkner 2017, 2018) in the statistical software R (R Core Team 2020), with the responses “same” and “different” coded as 1 and 0. Further information on model fitting can be found in the Supplementary Materials. The population-level (“fixed”) predictors were item type (Mismatching or Matching), similarity condition (S.Eng, Similar or Dissimilar) and the interaction. The predictors of item type and similarity were difference-coded such that contrasts depicted differences between adjacent levels. The group-level (“random”) predictors were participant (intercepts for 22 participants with by-participant slopes for the population-level effects) and item (intercepts for 400 items). Further details on model fitting are provided in the Supplementary Materials. Analogous to the frequentist significance criterion of p < 0.05, an effect was assumed to exist when its probability of direction (PD) was > 0.975 (Makowski et al. 2019).
A summary of population-level results is presented in Table 1. The large and positive effect of item type (PD = 1.000) corresponds to the average sensitivity score across the three similarity conditions. Thus, L2 learners were evidently sensitive to phonemic identity because they were much more likely to label Matching items as “same” (hits) compared to Mismatching items (false alarms). The similarity × item type interactions describe how sensitivity scores varied between conditions. The Similarity-A interaction is the difference in sensitivity between the S.Eng and Similar conditions, which turned out to be virtually nonexistent (PD < 0.975). The Similarity-B interaction indicates the difference in sensitivity between the Similar and Dissimilar conditions and confirmed the substantial drop in the Dissimilar condition (PD = 1.000). Turning to response bias, the Similarity-A contrast showed no reliable difference between the S.Eng and Similar conditions (PD < 0.975), indicating L2 learners were just as likely to select “same” in these two conditions. The reliable and negative Similarity-B contrast (PD = 1.000) indicated that L2 learners were less likely to assign the “same” response to items in the Dissimilar condition compared to in the Similar condition (cf., Figure 2b).
The present results confirmed that the lower acoustic similarity of N.Eng realizations to S.Eng phonemic counterparts adversely affected L2 learners’ sensitivity to the phonemic category intended by the speaker. When faced with greater uncertainty about phonemic identity in the Dissimilar condition, L2 learners were less likely to respond “same”, suggesting their strategy to minimize the chance of an incorrect response was to choose “same” only when certain. In sum, the challenges faced by L2 learners in the Dissimilar condition can be attributed to reduced sensitivity to phonemic identity and to a rather conservative response strategy.

3. Experiment 2: Monolinguals and Experienced Bilinguals

The second experiment tested whether acoustic similarity to familiar or expected norms could predict phoneme detection in an unfamiliar accent by participants with considerably more experience of speech in the target language. The N.Eng auditory syllables from Experiment 1 were re-used for the unfamiliar accent, while the familiar accent was the Australian English (Aus.Eng) accent, as all participants resided in Australia. As for Experiment 1, phoneme detection was expected to be more challenging in the Dissimilar condition compared to the Similar condition. Additionally, participants were split into two groups, differing in the number of languages they spoke (monolinguals or experienced bilinguals). Monolinguals’ linguistic background might increase the chance of successfully detecting the phonemic identity of the more challenging Dissimilar realizations on the assumption that a greater amount of accumulated exposure to speech in the target language provides for richer or more varied representations of phonetic variants of phonemic categories.

3.1. Participants

Participants were 20 Aus.Eng monolinguals (13 female; 7 male) and 20 Aus.Eng experienced bilinguals (12 female; 8 male). The former group reported speaking only one language, while the latter group reported speaking two main languages (one of which was Aus.Eng) at near-native or native levels. No participant had spent more than one month in an English-speaking country other than Australia. No participant reported familiarity specifically with the regional accents of Northern England. Responses from one bilingual were excluded due to not meeting the inclusion criterion (see further below). Aside from English, the languages spoken by the remaining 19 bilinguals were typologically diverse: Indo-European languages (n = 7) included Afrikaans, Bulgarian, Greek, Spanish and Hindi, while other languages (n = 12) were Arabic, Somali, Cambodian, Korean, Tagalog and Turkish. Most bilinguals (n = 16) reported equal or stronger comprehension abilities in Aus.Eng compared to their other language, and all reported speaking and hearing English more frequently than their other language. All participants were students at Western Sydney University with a median age of 21 years (range: 17–27), and participants received course credit or a small monetary sum for taking part.

3.2. Auditory Syllables

The same 14 /CVC/ syllables from Experiment 1 were produced by 4 speakers—the 2 female N.Eng speakers from Experiment 1 and 2 female speakers of the familiar Aus.Eng accent—which yielded 56 auditory syllables (14 syllables × 2 N.Eng speakers and 14 syllables × 2 Aus.Eng speakers). Duration and formant trajectory information of the 56 auditory syllables’ vowels are illustrated in Figure 3. Acoustic similarity of the realizations of the vowels in the 56 auditory syllables to their phonemic counterparts in the familiar Aus.Eng accent was gauged. A multinomial logistic regression model was trained on a small corpus of vowel tokens produced by 12 female monolingual speakers of Aus.Eng (Elvin et al. 2016) in the same manner as for Experiment 1 (see the Supplementary Materials). The dependent variable comprised 16 Aus.Eng vowel categories (fleece, kit, dress, nurse, trap, palm, strut, lot, thought, foot, goose, face, mouth, price, goat, choice), and the predictors were duration and measures representing the mean, change and curvature of the trajectories of the first three formants (Elvin et al. 2016). The vowels from the 56 auditory syllables (28 Aus.Eng and 28 N.Eng) were tested on the trained model. The 28 Aus.Eng vowels were assigned to their intended phonemic categories with high probabilities (mean correct probability = 0.94), as shown in Appendix B. For the 28 N.Eng realizations (Appendix B), classification probabilities were lower (mean correct probability = 0.60). Based on the probability of being correctly categorized, 17 N.Eng syllables were classed as “Similar” (probability > 0.5) and the remaining 11 were classed as “Dissimilar” (probability < 0.5).

3.3. Experiment Items

Items were created by pairing together syllables of the same consonantal frame, as in Experiment 1. Since monolinguals and bilinguals’ proficiency was not a likely concern for being able to detect phonemes in the familiar Aus.Eng accent, the condition featuring only familiar accent speakers was not required. The order of speakers within syllable pairs was counterbalanced, yielding 320 items: (40 syllable pairs (14 Matching and 26 Mismatching) × 4 speaker combinations (Aus.Eng1–N.Eng1, Aus.Eng1–N.Eng2, Aus.Eng2–N.Eng1 and Aus.Eng2–N.Eng2] × 2 speaker orders). Auditory syllables within each item were separated by 1000 ms of silence. The 320 items were grouped into two similarity conditions: 196 (61%) contained one N.Eng syllable classed as Similar (Matching: n = 68; Mismatching: n = 128), while the remaining 124 (39%) contained one N.Eng syllable classed as Dissimilar (Matching: n = 44; Mismatching: n = 80).

3.4. Experiment Procedure
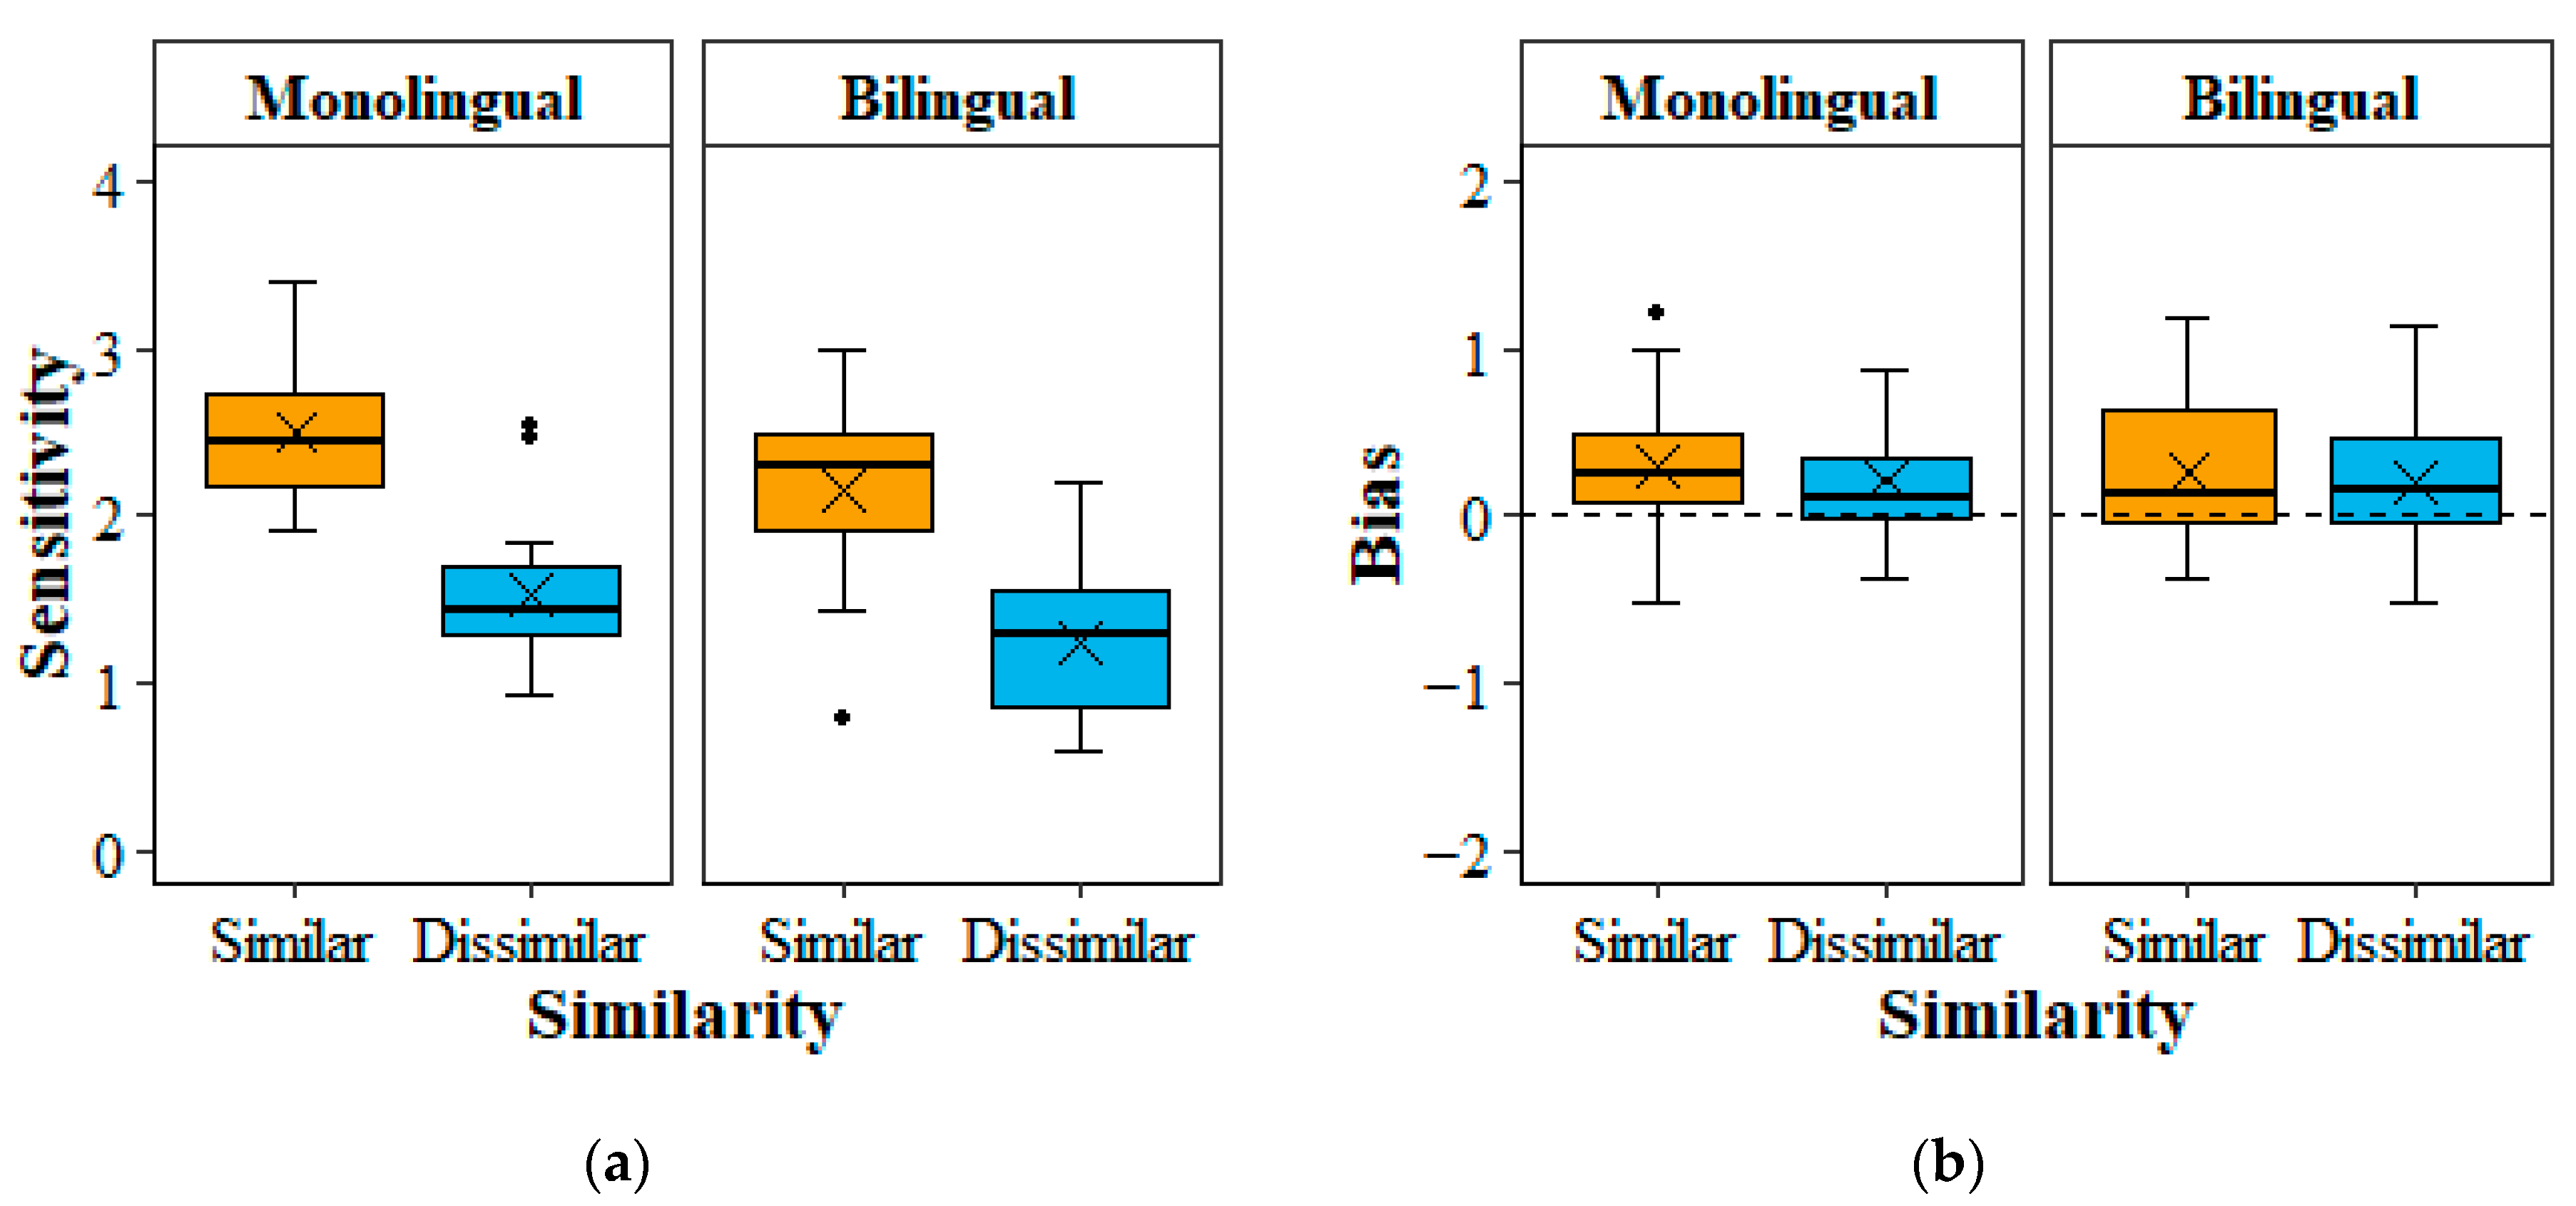
The procedure was identical to Experiment 1. The experiment lasted approximately 25 min.

3.5. Results

Prior to analysis, responses were screened to ensure that participants performed the task as intended. As for Experiment 1, the inclusion criterion was a minimum of 60% correct responses averaged over item type in the condition that was expected to be very easy, namely, the Similar condition. All 20 monolingual listeners fulfilled this criterion: their average percent correct score in this condition was 87% (SD: 5%; range: 71–94%). As noted earlier, one bilingual participant was excluded for an accuracy score below 60% in the Similar condition. The remaining 19 bilinguals’ average percent correct score in the Similar condition was 83% (SD: 8%; range: 62–93%). Percent correct scores were lower in the Dissimilar condition for both monolinguals (mean: 76%; SD: 5%; range: 62–84%) and bilinguals (mean: 71%; SD: 7%; range: 58–83%).
Figure 4 displays participant responses as sensitivity and bias scores computed from response proportions within participants. Mirroring accuracy, sensitivity scores fell in the Dissimilar condition for both monolinguals and bilinguals, and bilinguals’ sensitivity scores tended to be slightly lower overall. As for bias, both groups’ scores clustered slightly above zero, indicating “same” was somewhat more likely to be selected.
Model fitting was almost identical to Experiment 1. The population-level predictors were item type (Mismatching or Matching), similarity (Similar or Dissimilar), group (Monolingual or Bilingual) and interactions. Predictors were difference-coded such that contrasts depicted differences in response probabilities between adjacent levels. The group-level (“random”) predictors were participant (intercepts for 39 participants with by-participant slopes for item type, similarity and the interaction) and item (intercepts for 320 items and by-item slopes for group). A summary of population-level effects is presented in Table 2.
The effect of item type is the average sensitivity score across conditions and groups. Its large and positive value demonstrated that participants preferred to select “same” for Matching items (hits) over Mismatching items (false alarms). The reliable similarity × item type interaction (PD = 1.000) confirmed that sensitivity fell for N.Eng realizations acoustically unlike familiar Aus.Eng phonemic counterparts, echoing the finding observed earlier for L2 learners. The reliable group × item type interaction (PD = 0.997) indicated that bilinguals’ sensitivity to phonemic identity was somewhat lower than that of monolinguals in both similarity conditions. The practically nonexistent three-way interaction (PD ≈ 0.500) indicated that the drops in sensitivity between similarity conditions did not differ between monolinguals and bilinguals. With respect to response bias, the effects of similarity, group and their interaction were unreliable (PDs < 0.975), indicating no clear differences in the preference for selecting “same” between the similarity conditions or between monolinguals and bilinguals.
Both monolinguals and bilinguals showed reduced sensitivity to the intended phonemic identity when the acoustic similarity between the unfamiliar N.Eng speakers’ vowels and their Aus.Eng phonemic counterparts was lower, highlighting the perceptual challenge even for those with substantial accumulated exposure to the target language (cf., Shaw et al. 2023). Although formal comparisons with Experiment 1 were not possible due to the different familiar accents, the drop in sensitivity between the Similar and Dissimilar conditions was numerically smaller in Experiment 2 for monolinguals and bilinguals. Unlike L2 learners (Experiment 1), the response strategies of monolinguals and bilinguals did not shift, indicating the latter groups were not averse to responding “same” when phonemic identity was less certain; in fact, the latter participants slightly preferred responding “same” in general, as indicated by the moderately positive intercept term in Table 2. Overall, monolinguals displayed somewhat heightened sensitivity to phonemic identity relative to that of bilinguals, but there was no evidence that monolinguals were impacted any less adversely by lower acoustic similarity despite greater accumulated exposure to speech in English.

4. Discussion

Phoneme detection in an unfamiliar regional accent of English was tested with three participant groups (L2 learners, monolinguals and experienced bilinguals). It was expected that participants would meet a perceptual challenge in associating phonetic variants produced by unfamiliar accent speakers with the phonemic categories intended by those speakers. Motivated by studies investigating non-native speech perception, the acoustic realizations of vowels spoken in an unfamiliar accent were compared to phonemic counterparts from a very familiar accent of English. Prompted by past work on speech perception in adverse listening conditions, it was conjectured that the challenge posed by lower acoustic similarity may be less pronounced in those with a greater amount of accumulated exposure to the target spoken language. All three participant groups, and particularly L2 learners, showed substantial drops in sensitivity to the phonemic identity of vowels produced in the unfamiliar accent, which were acoustically unlike those in the familiar accent. That is, the difference between the rates of hits (responding “same” to Matching items) and false alarms (responding “same” to Mismatching items) was smaller in the Dissimilar condition. Despite greater accumulated exposure to speech in the target language, monolinguals were just as affected by lower similarity as bilinguals, though monolinguals were somewhat more sensitive to phonemic identity overall. Finally, L2 learners adopted a cautious strategy for responding to the most challenging items in the phoneme detection task, as conveyed by the lower probability of selecting “same” in the Dissimilar condition.
Recall that cross-language acoustic similarity has been studied mainly to identify potential challenges in perceiving vowels by non-native and occasionally L2 listeners (Georgiou 2023). This endeavor has generally been motivated by the notion that acoustic classification patterns approximate patterns of perceived phonetic similarity. Fostering a comparable approach, the present results confirmed that cross-accent acoustic similarity can identify those unfamiliar accent vowels whose intended phonemic identities are more challenging to detect. The present results, thus, have implications for how theories of cross-language (non-native) speech perception may be extended to speech perception in varieties of a single language (cf., Shaw et al. 2023). For instance, in common with other theories of speech perception, the perceptual assimilation model (PAM) posits that non-native listeners attempt to assimilate incoming spoken vowels in terms of native phonemic categories (Best 1995). In the present experiments, the participant groups were assumed to be inexperienced in a particular accent (N.Eng) rather than an unknown or non-native language. In contrast to cross-language perception, the phonemic vowel categories across accents are structurally equivalent; that is, their categories largely exhibit identical lexical distributions (appear in the same words) despite some phonetic differences (Williams and Escudero 2014b). Additionally, categories in the present experiments were not strictly native for all three participant groups, as these were second-language (L2) categories for learners (discussed further below). Despite these contextual differences, the perceptual assimilation mechanisms proposed by the PAM could, nonetheless, be very pertinent given that not all phonetic variants in another accent are realized in ways typical or in accordance with the linguistic norms expected by listeners (such as in a non-native language). PAM proposes that non-native phonetic segments are regarded as “good” or “poor” instances of a category depending on the degree of perceived similarity. In the task of associating unfamiliar accent realizations with the phonemic categories intended by speakers, listeners may assign realizations considered “good” (i.e., typical or familiar) to the intended phoneme with greater confidence than those considered “poor” (i.e., atypical or deviant with respect to expected norms), resulting in higher identification accuracy for the former compared to the latter, which would be reflected in greater sensitivity scores. PAM also posits the possibility that some non-native phonetic segments may not be assimilated to any particular phonemes. The equivalent scenario in cross-accent perception would be phonemic ambiguity, i.e., when a phonetic segment is perceived as a possible (albeit poor) instance of two or more categories, as posited by the Second-Language Linguistic Perception (L2LP) model’s multiple-category-assimilation or subset scenario (Escudero 2005; Van Leussen and Escudero 2015), thereby resulting in a low probability of being associated with the intended category and lower sensitivity scores.
Turning to acoustic similarity more specifically, this has mostly been examined in the past to garner expectations about the perceptual performance of functional monolinguals (e.g., Gilichinskaya and Strange 2010; Escudero and Vasiliev 2011; Escudero et al. 2012; Elvin et al. 2014; Strange et al. 2011). In the present study, vowels were classified into their intended phonemic categories in order to predict phoneme detection performance by two participant groups (L2 learners and bilinguals) who, unlike monolinguals, knew an additional language. Can perceptual performance be better approximated by incorporating information about listeners’ additional languages in acoustic comparisons? According to Grosjean’s (2001) language mode hypothesis, L2 learners and bilinguals’ two languages and language processing mechanisms are activated at different points of time, prompted by psychosocial and linguistic factors, e.g., the language of task instructions. Language modes are construed in a continuum-like fashion: at one end is “monolingual mode”, in which one language is activated, while the other is present but inactive; at the other end is “bilingual mode”, in which both languages are activated. Evidence for language modes comes from within-bilingual shifts in behavior in perceptual tasks conducted in different languages but featuring the same auditory stimuli (e.g., Yazawa et al. 2020). Besides the language of the items in the present study’s experiments, English was used throughout the experiment sessions, including in communications outside of it. It is reasonable to assume that the language chosen by L2 and bilingual participants at the time of the phoneme detection task (“base language”) was English. It logically follows that the language mode was monolingual (Grosjean 2001). Accordingly, the phonemic categories most activated for performing the task would be English, while categories from an additional language would be inactive or barely active. In a similar vein, the acoustic parameters employed in the classification models were likely appropriate not only for monolinguals and experienced bilinguals with substantial exposure to the target language, but also for L2 learners’ vowel perception, despite L2 learners never having spent an extended time in an L2-speaking country. This is because German L2 learners of English tend to score very highly in the perceptual identification of S.Eng vowels (Iverson and Evans 2007) and even those with less experience successfully learn English vowels (Bohn and Flege 1992).
The present findings concur with the hypothesis that encountering speech spoken in other accents can lead to information loss between the speaker and listener; in the present case, this was restricted to phonemic identity (Shaw et al. 2023). As outlined in the Introduction, L2 learners and experienced bilinguals commonly display greater difficulty relative to monolinguals in speech perception tasks in adverse listening conditions, which is posited to be related to differences in neural commitment and the quality of representations built up due to accumulated exposure to speech in the target language (e.g., Schmidtke 2016). Experiment 2 directly compared monolinguals and experienced bilinguals’ sensitivity to phonemic identity. Unlike several past findings, which showed that bilinguals are more adversely affected by the level of degradation than monolinguals are (e.g., Lecumberri et al. 2010; Scharenborg and van Os 2019), Experiment 2’s results showed that bilinguals were not more adversely affected than monolinguals were by the level of “deviance” in the unfamiliar accent speakers’ vowels. Instead, bilinguals were overall slightly less sensitive to the intended phonemic identity. To put the group × item type interaction in Table 2 into context, expressed as response proportions, the estimated difference between hit and false alarm rates for bilinguals was around 10% (CI: 5%, 17%) lower than that for monolinguals. As the experiment included only two levels of similarity, it is possible that the experiment could not determine finer-grained influences of this manipulation on perceptual sensitivity. Indeed, differences between bilinguals and monolinguals due to the level of a degradation manipulation tend to emerge only when there are several (i.e., three or more) levels of “difficulty” (e.g., Lecumberri et al. 2010; Scharenborg and van Os 2019; Schmidtke 2016; Rogers et al. 2006), suggesting that differences between monolingual and bilingual listeners may be relatively subtle. Experiment 1 showed the drop in sensitivity to phonemic identity was numerically larger for L2 learners. However, a limitation of the present study was that L2 learners’ performance could not be formally compared to that of monolinguals and experienced bilinguals, and this remains to be directly tested in a future study (cf., Kriengwatana et al. 2016). Beyond a possible difference in perceptual sensitivity, L2 learners’ response strategy in the phoneme detection task was clearly more cautious, as they preferred to use the “same” option conservatively in the Dissimilar condition rather than hazard a guess. This is probably related to the fact that L2 learners resided in a L1-speaking country and communicated far less often in their L2, which may have led to generally lower internal confidence in their judgments about L2 phonemic identity. As a strategy to maximize response accuracy, L2 learners may thus have been less inclined to respond based on mere guesses. Had L2 learners performed an equivalent task in German (their L1), they may have adopted a less conservative approach toward more challenging items.
Finally, while the present study found that acoustic similarity can predict the relative success of phoneme detection in a regional accent with which listeners are inexperienced, it should be noted that acoustic similarity patterns can provide only a relatively broad indication of perceptual similarity patterns. This is due to the inherent limitations of assembling training corpora (for acoustic classification models) that adequately reflect or represent the speech patterns in the environments of listeners. For example, the L2 learners in Experiment 1 may have additionally been very familiar with the S.Eng accent spoken by L2 German speakers. Likewise, the experienced bilinguals in Experiment 2 may have been familiar with varieties of Aus.Eng more common in various multilingual communities in Australia. In both experiments, the unfamiliar accent’s vowels were compared in a model trained on speech samples from corpora of only monolingual speakers. A linguistically more diverse set of speakers could be selected when assembling training corpora to better reflect the linguistic norms expected to be most relevant to listeners (for examples, see Williams and Escudero 2014b; Escudero et al. 2012). Additionally, determining listeners’ familiarity with the tested familiar and unfamiliar accents is not a straightforward task. Although no participants reported familiarity specifically with regional accents of Northern England, it cannot be ruled out that some participants may have had at least some prior exposure to the N.Eng accent or similar accents, e.g., through media consumption (cf., Williams and Escudero 2014b). Presumably, possible effects on responses due to between-participant differences in prior exposure can be accounted for by the participant effects in regression modeling.

5. Conclusions

The present study has shown that a challenge when perceiving speech in an unfamiliar accent is associating phonetic realizations with the phonemic categories intended by speakers, which—in the case of vowels—can be largely predicted based on acoustic similarity to counterparts in a very familiar accent. Moreover, patterns of perceptual difficulty persisted across monolinguals, bilinguals and L2 learners, demonstrating the challenge even for those possessing greater accumulated exposure. Future studies employing a greater number of experimental conditions are likely to provide more nuanced insights into the potential differences faced by different kinds of listeners in cross-dialectal speech perception.

Supplementary Materials

The following supporting information can be downloaded at: https://www.mdpi.com/article/10.3390/languages9020062/s1: Full descriptions of statistical models (Experiments 1 and 2); full summary of Experiment 1 multinomial logistic regression; full summary of Experiment 1 probit regression; full summary of Experiment 2 multinomial logistic regression; full summary of Experiment 2 probit regression; Experiment 1 trial data; Experiment 2 trial data.

Author Contributions

Conceptualization, D.W. and P.E.; methodology, D.W. and P.E.; formal analysis, D.W.; writing—original draft preparation, D.W., T.A., A.G. and P.E.; writing—review and editing, D.W., T.A., A.G. and P.E.; visualization, D.W. All authors have read and agreed to the published version of the manuscript.

Funding

This research was funded by the Ministry for Science, Research and Culture (MWFK) in (Brandenburg, Germany), the Australian Research Council, grant number CE140100041, and the European Research Council, grant number 249440.

Institutional Review Board Statement

The study was conducted in accordance with the Declaration of Helsinki, and approved by the Human Research Ethics Committee of Western Sydney University (H11022, March 2015), and by the Ethics Commission of University of Potsdam for studies involving humans (59/201, November 2019).

Informed Consent Statement

Informed consent was obtained from all subjects involved in the study.

Data Availability Statement

Data supporting the reported results can be found in the Supplementary Materials.

Conflicts of Interest

The authors declare no conflicts of interest. The funders had no role in the design of the study; in the collection, analyses, or interpretation of data; in the writing of the manuscript, or in the decision to publish the results.

Appendix A

Table A1. The table presents the acoustic similarity of the vowels in the 56 auditory syllables to the phonemic category intended by the speaker based on acoustic values from a corpus of 10 S.Eng speakers. “Prob.” refers to the estimated probability that the realization belonged to the intended category. “Group” refers to the similarity group, in which “Sim.” indicates that the realization displayed high acoustic similarity, i.e., probability > 0.50, and “Dis.” refers to a realization with low acoustic similarity, i.e., probability < 0.50.
FramePhonemic CategorySpeaker
S.Eng1S.Eng2N.Eng1N.Eng2
Prob.GroupProb.GroupProb.GroupProb.Group
/bVp/palm1.00Sim.1.00Sim.0.90Sim.0.15Dis.
thought1.00Sim.1.00Sim.0.45Dis.0.01Dis.
price1.00Sim.1.00Sim.1.00Sim.0.85Sim.
goat1.00Sim.0.89Sim.0.00Dis.0.02Dis.
mouth1.00Sim.1.00Sim.0.90Sim.0.94Sim.
/dVk/fleece0.99Sim.0.59Sim.0.44Dis.0.93Sim.
goose1.00Sim.0.98Sim.0.00Dis.0.03Dis.
nurse1.00Sim.0.99Sim.0.99Sim.0.20Dis.
face1.00Sim.1.00Sim.0.99Sim.1.00Sim.
/fVf/kit0.99Sim.0.92Sim.0.97Sim.0.89Sim.
trap0.87Sim.1.00Sim.1.00Sim.0.83Sim.
strut0.89Sim.1.00Sim.0.11Dis.0.59Sim.
lot0.87Sim.0.94Sim.0.01Dis.0.00Dis.
foot0.99Sim.1.00Sim.0.00Dis.0.00Dis.

Appendix B

Table A2. The table presents the acoustic similarity of the vowels in the 56 auditory syllables to the phonemic category intended by the speaker based on acoustic values from a corpus of 12 Aus.Eng speakers. “Prob.” refers to the estimated probability that the realization belonged to the intended category. “Group” refers to the similarity group, in which “Sim.” indicates that the realization displayed high acoustic similarity, i.e., probability > 0.50, and “Dis.” refers to a realization with low acoustic similarity, i.e., probability < 0.50.
FramePhonemic CategorySpeaker
Aus.Eng1Aus.Eng2N.Eng1N.Eng2
Prob.GroupProb.GroupProb.GroupProb.Group
/bVp/palm0.78Sim.0.99Sim.0.63Sim.1.00Sim.
thought1.00Sim.0.99Sim.0.92Sim.1.00Sim.
price1.00Sim.1.00Sim.0.99Sim.1.00Sim.
goat0.96Sim.0.82Sim.0.64Sim.0.01Dis.
mouth0.84Sim.0.97Sim.0.11Dis.0.21Dis.
/dVk/fleece0.99Sim.0.97Sim.1.00Sim.1.00Sim.
goose1.00Sim.0.81Sim.0.01Dis.0.02Dis.
nurse0.98Sim.0.99Sim.0.95Sim.0.97Sim.
face0.81Sim.0.97Sim.0.25Dis.0.88Sim.
/fVf/kit0.99Sim.1.00Sim.1.00Sim.0.99Sim.
trap0.94Sim.0.87Sim.0.85Sim.0.47Dis.
strut0.97Sim.0.93Sim.0.01Dis.0.00Dis.
lot0.97Sim.0.98Sim.0.01Dis.0.00Dis.
foot0.90Sim.0.94Sim.0.95Sim.0.90Sim.

Note

1
The 14 syllables formed meaningless non-words with three potential exceptions. First, a variant common in North America for the English word duke, ‘nobleman’, corresponds to the syllable /dVk/, in which V is the goose vowel. Second, the syllable /dVk/, in which V is the nurse vowel corresponds to the regional word dirk, ‘dagger’, found in some Scottish dialects. Third, the syllable /fVf/, in which V is the trap vowel corresponds to the regional word faff, ‘unnecssary effort’, in informal British English. It is uncertain whether native German L2 learners residing in Germany or Aus.Eng listeners residing in Australia would be aware of these possible semantic associations.

References

  1. Adank, Patti, Bronwen G. Evans, Jane Stuart-Smith, and Sophie K. Scott. 2009. Comprehension of familiar and unfamiliar native accents under adverse listening conditions. Journal of Experimental Psychology: Human Perception and Performance 35: 520–29. [Google Scholar]
  2. Alispahic, Samra, Karen E. Mulak, and Paola Escudero. 2017. Acoustic properties predict perception of unfamiliar Dutch vowels by adult Australian English and Peruvian Spanish listeners. Frontiers in Psychology 8: 52. [Google Scholar] [CrossRef] [PubMed]
  3. Baigorri, Miriam, Luca Campanelli, and Erika S. Levy. 2019. Perception of American–English vowels by early and late Spanish–English bilinguals. Language and Speech 62: 681–700. [Google Scholar] [CrossRef] [PubMed]
  4. Barr, Dale J., Roger Levy, Christoph Scheepers, and Harry J. Tily. 2013. Random effects structure for confirmatory hypothesis testing: Keep it maximal. Journal of Memory and Language 68: 255–78. [Google Scholar] [CrossRef] [PubMed]
  5. Best, Catherine T. 1995. A direct realist view of cross-language speech perception. In Speech Perception and Linguistic Experience: Issues in Cross-language Speech Research. Edited by Winifred Strange. Baltimore: York Press, pp. 171–203. [Google Scholar]
  6. Best, Catherine T., and Michael D. Tyler. 2007. Nonnative and second-language speech perception: Commonalities and complementarities. In Language Experience in Second Language Speech Learning: In Honor of James Emil Flege. Edited by Ocke-Schwen Bohn and Murray J. Munro. Amsterdam and Philadelphia: John Benjamins, pp. 13–34. [Google Scholar]
  7. Best, Catherine T., Gerald W. McRoberts, and Elizabeth Goodell. 2001. Discrimination of non-native consonant contrasts varying in perceptual assimilation to the listener’s native phonological system. Journal of the Acoustical Society of America 109: 775–94. [Google Scholar] [CrossRef] [PubMed]
  8. Bohn, Ocke-Schwen, and James Emil Flege. 1992. The production of new and similar vowels by adult German learners of English. Studies in Second Language Acquisition 14: 131–58. [Google Scholar] [CrossRef]
  9. Bradlow, Ann R., and Tessa Bent. 2002. The clear speech effect for non-native listeners. Journal of the Acoustical Society of America 112: 272–84. [Google Scholar] [CrossRef] [PubMed]
  10. Bürkner, Paul-Christian. 2017. brms: An R package for Bayesian multilevel models using Stan. Journal of Statistical Software 80: 1–28. [Google Scholar] [CrossRef]
  11. Bürkner, Paul-Christian. 2018. Advanced Bayesian multilevel modeling with the R Package brms. The R Journal 10: 395–411. [Google Scholar] [CrossRef]
  12. Colantoni, Laura, Paola Escudero, Victoria Marrero-Aguiar, and Jeffrey Steele. 2021. Evidence-based design principles for Spanish pronunciation teaching. Frontiers in Communication 6: 639889. [Google Scholar] [CrossRef]
  13. Cutler, Anne, Andrea Weber, Roel Smits, and Nicole Cooper. 2004. Patterns of English phoneme confusions by native and non-native listeners. Journal of the Acoustical Society of America 116: 3668–78. [Google Scholar] [CrossRef]
  14. DeCarlo, Lawrence T. 1998. Signal detection theory and generalized linear models. Psychological Methods 3: 186–205. [Google Scholar] [CrossRef]
  15. Elvin, Jaydene, Daniel Williams, and Paola Escudero. 2016. Dynamic acoustic properties of monophthongs and diphthongs in Western Sydney Australian English. Journal of the Acoustical Society of America 140: 576–81. [Google Scholar] [CrossRef] [PubMed]
  16. Elvin, Jaydene, Paola Escudero, and Polina Vasiliev. 2014. Spanish is better than English for discriminating Portuguese vowels: Acoustic similarity versus vowel inventory size. Frontiers in Psychology 5: 1188. [Google Scholar] [CrossRef]
  17. Escudero, Paola, and Daniel Williams. 2012. Native dialect influences second-language vowel perception: Peruvian versus Iberian Spanish learners of Dutch. Journal of the Acoustical Society of America 131: EL406–12. [Google Scholar] [CrossRef] [PubMed]
  18. Escudero, Paola, and Polina Vasiliev. 2011. Cross-language acoustic similarity predicts perceptual assimilation of Canadian English and Canadian French vowels. Journal of the Acoustical Society of America 130: EL277–83. [Google Scholar] [CrossRef]
  19. Escudero, Paola. 2005. Linguistic Perception and Second Language Acquisition: Explaining the Attainment of Optimal Phonological Categorization. Utrecht: LOT. [Google Scholar]
  20. Escudero, Paola, Catherine T. Best, Christine Kitamura, and Karen E. Mulak. 2014. Magnitude of phonetic distinction predicts success at early word learning in native and non-native accents. Frontiers in Psychology 5: 1059. [Google Scholar] [CrossRef]
  21. Escudero, Paola, Ellen Simon, and Holger Mitterer. 2012. The perception of English front vowels by North Holland and Flemish listeners: Acoustic similarity predicts and explains cross-linguistic and L2 perception. Journal of Phonetics 40: 280–88. [Google Scholar] [CrossRef]
  22. Ferragne, Emmanuel, and François Pellegrino. 2010. Formant frequencies of vowels in 13 accents of the British Isles. Journal of the International Phonetic Association 40: 1–34. [Google Scholar] [CrossRef]
  23. Flege, James Emil, and Ian R. A. MacKay. 2004. Perceiving vowels in a second language. Studies in Second Language Acquisition 26: 1–34. [Google Scholar] [CrossRef]
  24. Flege, James Emil, and Ocke-Schwen Bohn. 2021. The revised speech learning model (SLM-r). In Second Language Speech Learning: Theoretical and Empirical Progress. Edited by Ratree Wayland. Cambridge: Cambridge University Press, pp. 3–83. [Google Scholar]
  25. Flege, James Emil, and Serena Liu. 2001. The effect of experience on adults’ acquisition of a second language. Studies in Second Language Acquisition 23: 527–52. [Google Scholar] [CrossRef]
  26. Fox, Robert Allen, and Ewa Jacewicz. 2009. Cross-dialectal variation in formant dynamics of American English vowels. Journal of the Acoustical Society of America 126: 2603–18. [Google Scholar] [CrossRef] [PubMed]
  27. Gelman, Andrew, Aleks Jakulin, Maria Grazia Pittau, and Yu-Sung Su. 2008. A weakly informative default prior distribution for logistic and other regression models. Annals of Applied Statistics 2: 1360–83. [Google Scholar] [CrossRef]
  28. Georgiou, Georgios P. 2022. The acquisition of /ɪ/–/iː/ is challenging: Perceptual and production evidence from Cypriot Greek speakers of English. Behavioral Sciences 12: 469. [Google Scholar] [CrossRef] [PubMed]
  29. Georgiou, Georgios P. 2023. Comparison of the prediction accuracy of machine learning algorithms in crosslinguistic vowel classification. Scientific Reports 13: 15594. [Google Scholar] [CrossRef] [PubMed]
  30. Georgiou, Georgios P., and Dimitra Dimitriou. 2023. Perception of Dutch vowels by Cypriot Greek listeners: To what extent can listeners’ patterns be predicted by acoustic and perceptual similarity? Attention, Perception, & Psychophysics 85: 2459–74. [Google Scholar]
  31. Georgiou, Georgios P., Natalia V. Perfilieva, and Maria Tenizi. 2020. Vocabulary size leads to better attunement to L2 phonetic differences: Clues from Russian learners of English. Language Learning and Development 16: 382–98. [Google Scholar] [CrossRef]
  32. Gilichinskaya, Yana D., and Winifred Strange. 2010. Perceptual assimilation of American English vowels by inexperienced Russian listeners. Journal of the Acoustical Society of America 128: EL80–85. [Google Scholar] [CrossRef]
  33. Grosjean, François. 2001. The bilingual’s language modes. In One Mind, Two Languages: Bilingual Language Processing. Edited by Janet Nicol. Oxford: Blackwell, pp. 37–66. [Google Scholar]
  34. Hillenbrand, James, Laura A. Getty, Michael J. Clark, and Kimberlee Wheeler. 1995. Acoustic characteristics of American English vowels. Journal of the Acoustical Society of America 97: 3099–111. [Google Scholar] [CrossRef]
  35. Holt, Lori L., and Andrew J. Lotto. 2010. Speech perception as categorization. Attention, Perception, & Psychophysics 72: 1218–27. [Google Scholar]
  36. Iverson, Paul, and Bronwen G. Evans. 2007. Learning English vowels with different first-language vowel systems: Perception of formant targets, formant movement, and duration. Journal of the Acoustical Society of America 122: 2842–54. [Google Scholar] [CrossRef] [PubMed]
  37. Iverson, Paul, Patricia K. Kuhl, Reiko Akahane-Yamada, Eugen Diesch, Andreas Kettermann, and Claudia Siebert. 2003. A perceptual interference account of acquisition difficulties for non-native phonemes. Cognition 87: B47–57. [Google Scholar] [CrossRef] [PubMed]
  38. Keating, Pat. 2005. D-Prime (Signal Detection) Analysis. UCLA Phonetics Laboratory. Available online: http://phonetics.linguistics.ucla.edu/facilities/statistics/dprime.htm (accessed on 1 November 2023).
  39. Kriengwatana, Buddhamas, Josephine Terry, Kateřina Chládková, and Paola Escudero. 2016. Speaker and accent variation are handled differently: Evidence in native and non-Native Listeners. PLoS ONE 11: e0156870. [Google Scholar] [CrossRef] [PubMed]
  40. Kruschke, John. 2014. Doing Bayesian Data Analysis: A Tutorial with R, JAGS, and Stan. London: Academic Press. [Google Scholar]
  41. Kuhl, Patricia K. 1993. Innate predispositions and the effects of experience in speech perception: The native language magnet theory. In Developmental Neurocognition: Speech and Face Processing in the First Year of Life. Edited by Bénédicte de Boysson-Bardies, Scania de Schonen, Peter Jusczyk, Peter MacNeilage and John Morton. Dordrecht: Springer, pp. 259–74. [Google Scholar]
  42. Lado, Robert. 1957. Linguistics across Cultures: Applied Linguistics for Language Teachers. Ann Arbor: University of Michigan Press. [Google Scholar]
  43. Lecumberri, Maria Luisa Garcia, Martin Cooke, and Anne Cutler. 2010. Non-native speech perception in adverse conditions: A review. Speech Communication 52: 864–86. [Google Scholar] [CrossRef]
  44. Le, Jennifer T., Catherine T. Best, Michael D. Tyler, and Christian Kroos. 2007. Effects of non-native dialects on spoken word recognition. In Eighth Annual Conference of the International Speech Communication Association: Interspeech 2007. Adelaide: Causal Productions, pp. 1592–98. [Google Scholar]
  45. MacKay, Ian R. A., James Emil Flege, Thorsten Piske, and Carlo Schirru. 2001. Category restructuring during second-language speech acquisition. Journal of the Acoustical Society of America 110: 516–28. [Google Scholar] [CrossRef] [PubMed]
  46. Macmillan, Neil A., and C. Douglas Creelman. 1991. Detection Theory: A User’s Guide. Cambridge: Cambridge University Press. [Google Scholar]
  47. Makowski, Dominique, Mattan S. Ben-Shachar, S. H. Annabel Chen, and Daniel Lüdecke. 2019. Indices of Effect Existence and Significance in the Bayesian Framework. Frontiers in Psychology 10: 2767. [Google Scholar] [CrossRef]
  48. Mattys, Sven L., Matthew H. Davis, Ann R. Bradlow, and Sophie K. Scott. 2013. Speech recognition in adverse conditions: A review. Language and Cognitive Processes 27: 953–78. [Google Scholar] [CrossRef]
  49. Maye, Jessica, Richard N. Aslin, and Michael K. Tanenhaus. 2008. The weckud wetch of the wast: Lexical adaptation to a novel accent. Cognitive Science 32: 543–62. [Google Scholar] [CrossRef]
  50. Mayo, Lynn Hansberry, Mary Florentine, and Søren Buus. 1997. Age of second-language acquisition and perception of speech in noise. Journal of Speech, Language, and Hearing Research 40: 686–93. [Google Scholar] [CrossRef]
  51. Meador, Diane, James E. Flege, and Ian R. A. MacKay. 2000. Factors affecting the recognition of words in a second language. Bilingualism: Language and Cognition 3: 55–67. [Google Scholar] [CrossRef]
  52. Middlebrooks, John C., Jonathan Z. Simon, Arthur N. Popper, and Richard R. Fay. 2017. The Auditory System at the Cocktail Party. New York: Springer. [Google Scholar]
  53. Quené, Hugo, and L. E. Van Delft. 2010. Non-native durational patterns decrease speech intelligibility. Speech Communication 52: 911–18. [Google Scholar] [CrossRef]
  54. R Core Team. 2021. R: A Language and Environment for Statistical Computing (Version 4.1.2). Available online: https://www.R-project.org/ (accessed on 9 January 2022).
  55. Rogers, Catherine L., Jennifer J. Lister, Dashielle M. Febo, Joan M. Besing, and Harvey B. Abrams. 2006. Effects of bilingualism, noise, and reverberation on speech perception by listeners with normal hearing. Applied Psycholinguistics 27: 465–85. [Google Scholar] [CrossRef]
  56. Scharenborg, Odette, and Marjolein van Os. 2019. Why listening in background noise is harder in a non-native language than in a native language: A review. Speech Communication 108: 53–64. [Google Scholar] [CrossRef]
  57. Schmidtke, Jens. 2016. The bilingual disadvantage in speech understanding in noise is likely a frequency effect related to reduced language exposure. Frontiers in Psychology 7: 678. [Google Scholar] [CrossRef] [PubMed]
  58. Shaw, Jason A., Paul Foulkes, Jennifer Hay, Bronwen G. Evans, Gerard Docherty, Karen E. Mulak, and Catherine T. Best. 2023. Revealing perceptual structure through input variation: Cross-accent categorization of vowels in five accents of English. Laboratory Phonology 14: 1–38. [Google Scholar] [CrossRef]
  59. Stan Development Team. 2022. Stan User’s Guide and Stan Language Reference Manual. Available online: https://mc-stan.org/ (accessed on 19 October 2023).
  60. Stockwell, Robert P., J. Donald Bowen, and John W. Martin. 1965. The Grammatical Structures of English and Spanish. Chicago: University of Chicago Press. [Google Scholar]
  61. Strange, Winifred, Andrea Weber, Erika S. Levy, Valeriy Shafiro, Miwako Hisagi, and Kanae Nishi. 2007. Acoustic variability within and across German, French, and American English vowels: Phonetic context effects. Journal of the Acoustical Society of America 122: 1111–29. [Google Scholar] [CrossRef] [PubMed]
  62. Strange, Winifred, Miwako Hisagi, Reiko Akahane-Yamada, and Rieko Kubo. 2011. Cross-language perceptual similarity predicts categorial discrimination of American vowels by naïve Japanese listeners. Journal of the Acoustical Society of America 130: EL226–31. [Google Scholar] [CrossRef] [PubMed]
  63. Sumner, Meghan, and Arthur G. Samuel. 2009. The effect of experience on the perception and representation of dialect variants. Journal of Memory and Language 60: 487–501. [Google Scholar] [CrossRef]
  64. Tabri, Dollen, Kim Michelle Smith Abou Chacra, and Tim Pring. 2011. Speech perception in noise by monolingual, bilingual and trilingual listeners. International Journal of Language & Communication Disorders 46: 411–22. [Google Scholar]
  65. Tyler, Michael D., Catherine T. Best, Alice Faber, and Andrea G. Levitt. 2014. Perceptual assimilation and discrimination of non-native vowel contrasts. Phonetica 71: 4–21. [Google Scholar] [CrossRef] [PubMed]
  66. Van Hedger, Stephen C., and Ingrid S. Johnsrude. 2022. Speech perception under adverse listening conditions. In Speech Perception: Springer Handbook of Auditory Research. Edited by Lori L. Holt, Jonathan E. Peelle, Allison B. Coffin, Arthur N. Popper and Richard R. Fay. Cham: Springer International Publishing, pp. 141–71. [Google Scholar]
  67. Van Leussen, Jan-Willem, and Paola Escudero. 2015. Learning to perceive and recognize a second language: The L2LP model revised. Frontiers in Psychology 6: 1000. [Google Scholar] [CrossRef]
  68. Weiss, Deborah, and James J. Dempsey. 2008. Performance of bilingual speakers on the English and Spanish versions of the Hearing in Noise Test (HINT). Journal of the American Academy of Audiology 19: 5–17. [Google Scholar] [CrossRef]
  69. Wells, John C. 1982. Accents of English: Volume 1. Cambridge: Cambridge University Press, vol. 1. [Google Scholar]
  70. Werker, Janet F., and Chris E. Lalonde. 1988. Cross-language speech perception: Initial capabilities and developmental change. Developmental Psychology 24: 672–83. [Google Scholar] [CrossRef]
  71. Werker, Janet F., and Richard C. Tees. 1984. Cross-language speech perception: Evidence for perceptual reorganization during the first year of life. Infant Behavior and Development 7: 49–63. [Google Scholar] [CrossRef]
  72. Williams, Daniel, and Paola Escudero. 2014a. A cross-dialectal acoustic comparison of vowels in Northern and Southern British English. Journal of the Acoustical Society of America 136: 2751–61. [Google Scholar] [CrossRef]
  73. Williams, Daniel, and Paola Escudero. 2014b. Influences of listeners’ native and other dialects on cross-language vowel perception. Frontiers in Psychology 5: 1065. [Google Scholar] [CrossRef] [PubMed]
  74. Yazawa, Kakeru, James Whang, Mariko Kondo, and Paola Escudero. 2020. Language-dependent cue weighting: An investigation of perception modes in L2 learning. Second Language Research 36: 557–81. [Google Scholar] [CrossRef]
  75. Yazawa, Kakeru, James Whang, Mariko Kondo, and Paola Escudero. 2023. Feature-driven new sound category formation: Computational implementation with the L2LP model and beyond. Frontiers in Psychology 2: 1303511. [Google Scholar] [CrossRef]
Figure 1. (a) F1 and F2 (Bark) and (b) duration (ms) values of the 28 N.Eng and the 28 S.Eng auditory syllables’ vowels according to the consonantal frame: /bVp/ in the upper row, /dVk/ in the center row and /fVf/ in the lower row. Vowel categories are denoted by the colors indicated in the legend for each row. The two N.Eng speakers’ formant trajectories are shown as arrows with dashed lines and the two S.Eng speakers’ trajectories are shown as arrows with solid lines. The two N.Eng speakers’ vowel durations are shown with darker bars and the two S.Eng speakers’ durations are shown with lighter bars.
Languages 09 00062 g001aLanguages 09 00062 g001b
Figure 2. Boxplots of L2 learners’ sensitivity (a) and bias (b) scores in the three similarity conditions. Lower and upper box edges correspond to the first and third quartiles. Whiskers extend to the most extreme datapoints, 1.5 times the interquartile range, and the black circles represent datapoints beyond the whiskers. The horizontal line and cross within a box depict the median and mean values.
Languages 09 00062 g002
Figure 3. (a) F1 and F2 (Bark) and (b) duration (ms) values of the 28 N.Eng and the 28 Aus.Eng auditory syllables’ vowels according to the consonantal frame: /bVp/ in the upper row, /dVk/ in the center row and /fVf/ in the lower row. Vowel categories are denoted by the colors indicated in the legend for each row. The two N.Eng speakers’ formant trajectories are shown as arrows with dashed lines and the two Aus.Eng speakers’ trajectories are shown as arrows with solid lines. The two N.Eng speakers’ vowel durations are shown with darker bars and the two Aus.Eng speakers’ durations are shown with lighter bars.
Languages 09 00062 g003aLanguages 09 00062 g003b
Figure 4. Boxplots of monolinguals and bilinguals’ sensitivity (a) and bias (b) scores in the two similarity conditions. Lower and upper box edges correspond to the first and third quartiles. Whiskers extend to the most extreme datapoints, 1.5 times the interquartile range, and the black circles represent datapoints beyond the whiskers. The horizontal line and cross within a box depict median and mean values.
Languages 09 00062 g004
Table 1. Population-level effects from the probit regression on responses from Experiment 1. The median and 89% credible intervals (CI) describe the posterior distribution in probits (Kruschke 2014). Probability of direction (PD) indicates the proportion of the posterior samples displaying the same sign as the median, and its Bayesian p-value equivalent is also displayed (Makowski et al. 2019).
SDT ComponentPredictorMedianCIPDp
Response biasIntercept−0.08−0.32, 0.150.7160.567
Similarity-A *0.06−0.20, 0.320.6510.698
Similarity-B **−0.55−0.77, −0.331.000<0.001
SensitivityItem type2.712.40, 3.011.000<0.001
Similarity-A * × Item type−0.13−0.67, 0.390.6610.678
Similarity-B ** × Item type −1.70−2.14, −1.241.000<0.001
* S.Eng versus Similar. ** Similar versus Dissimilar.
Table 2. Population-level effects from the probit regression on responses from Experiment 2. The median and 89% credible intervals (CI) describe the posterior distribution in probits (Kruschke 2014). Probability of direction (PD) indicates the proportion of the posterior samples displaying the same sign as the median, and its Bayesian p-value equivalent is also displayed (Makowski et al. 2019).
SDT ComponentPredictorMedianCIPDp
Response biasIntercept0.270.11, 0.440.9940.012
Similarity−0.06−0.23, 0.110.7090.581
Group−0.03−0.33, 0.250.5690.862
Similarity × Group−0.02−0.16, 0.100.6060.788
SensitivityItem type2.302.08, 2.511.000<0.001
Similarity × Item type−0.99−1.32, −0.641.000<0.001
Group × Item type−0.51−0.80, −0.210.9960.007
Similarity × Group × Item type0.00−0.30, 0.300.5070.986
Disclaimer/Publisher’s Note: The statements, opinions and data contained in all publications are solely those of the individual author(s) and contributor(s) and not of MDPI and/or the editor(s). MDPI and/or the editor(s) disclaim responsibility for any injury to people or property resulting from any ideas, methods, instructions or products referred to in the content.

