The Development of 1Balance: A Connected Medical Device for Measuring Human Balance


1
Faculty of Engineering Science and Technology, Norwegian University of Science and Technology, Richard Birkelandsvei 2B, 7491 Trondheim, Norway
2
TCSI, Department of Mathematics, University of Turku, 20500 Turku, Finland
3
Department of Psychology and Logopedics, University of Helsinki, 00100 Helsinki, Finland
*
Author to whom correspondence should be addressed.
Technologies 2018, 6(2), 53; https://doi.org/10.3390/technologies6020053
Submission received: 15 April 2018
/
Revised: 20 May 2018
/
Accepted: 24 May 2018
/
Published: 26 May 2018
(This article belongs to the Special Issue Physiological Monitoring Technologies)
Abstract
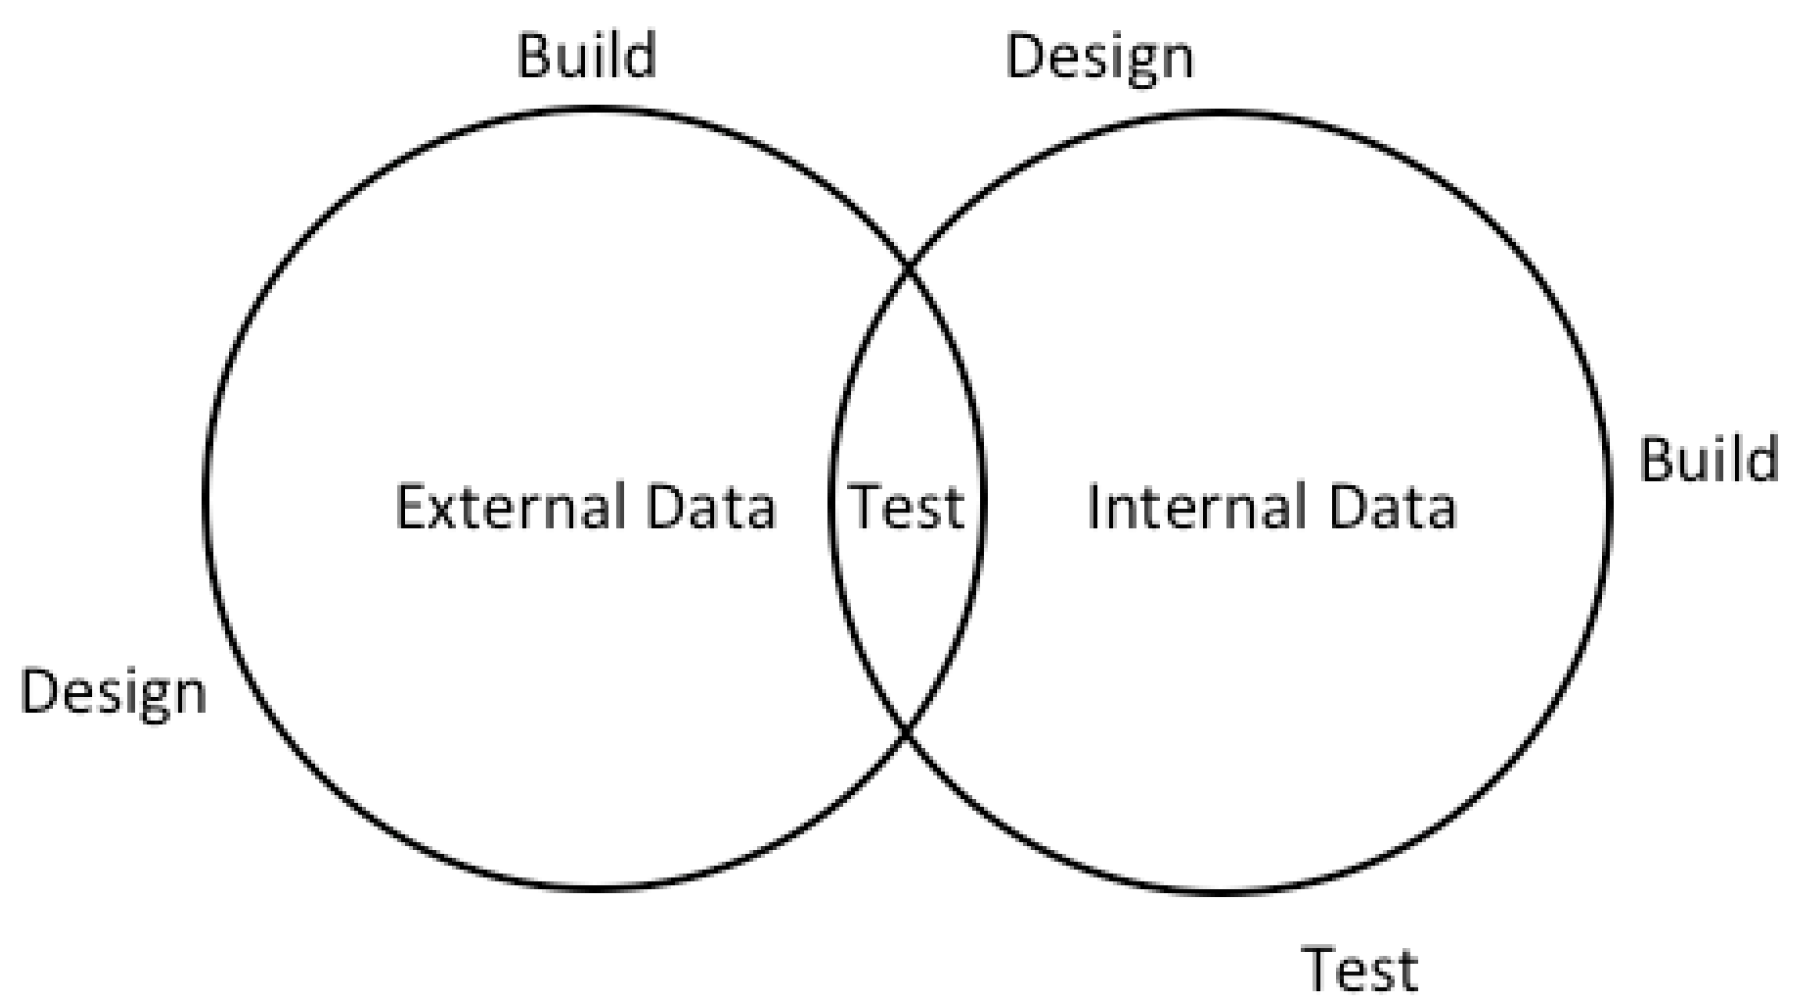
:Prototyping (iterative loops of design–build–test) is a proven method of efficiently developing new products. Developing products not only quickly, but that are also fit for purpose, implies engaging the end users and iterating the technology at hand. However, there is currently little research on how engineering design can approach developing connected devices. The purpose of this paper is to distinguish and discuss design approaches that are suitable for connected devices. Internet of Things devices consist of both the physical products themselves and the data that is coming out of the products, which we define as the external and internal data, respectively. They both can be prototyped separately, but since the data acquired can influence the design of the device and vice versa, we propose to link these two together in the product development process. This issue becomes more apparent when designing networks of sensors, e.g., for complex artificial intelligence (AI) databases. We explain the principle by describing the development of 1Balance through six different prototypes for human balance measurement. Technologically quantifying balance is an underused approach for objectively evaluating the state of a human’s performance. The authors have developed a mobile application for monitoring balance as a physiological signal (amount of sway) via a compact wireless inertial measurement unit (IMU) sensor strapped to the body of the subject for the duration of the measurement. We describe the design process for developing this connected medical device, as well as how the acquired data was used to improve the design of the product. In conclusion, we propose conceptually connecting the external and internal data prototyping loops.
Keywords:
prototyping; data; engineering design; methodology; Wayfaring; connected devices; Internet of Things1. Introduction
Designing with data in mind is one of the main challenges in our present and future society. More and more companies are acknowledging that their main assets are data, and at the same time an increasing amount of data is created, with Internet of Things products soon to exceed all other data sources. This is a fascinating opportunity for engineering design and the early part of product development—the fuzzy front-end concept creation phase—where the requirements of the product are not yet fixed [1,2]. The definition of the term “Internet of Things” (IoT) has also developed during its existence. We are increasingly seeing the IoT as an extension to the existing Internet that allows us to use different sensors as a source for more complicated inference [3]. While books and research on how to design for data-driven products are available, a gap lies in what methodologies to use and how they are different from traditional products when creating new concepts of these connected devices. Developing new products remains integral to this field, but our focus has been on how to prototype and incorporate the interplay between data and the physical product. In order to demonstrate this relationship, the authors developed six staged prototypes in order to create a novel concept for quantifying human balance.
Balance is defined as the ability to maintain the body in control with minimal body sway (line of gravity within their base of support) whereby all of the acting forces are cancelled by each other, resulting in a stable balanced system. The central nervous system (CNS) receives feedback about the body orientation from three main sensory systems (somatosensory, vestibular, and visual systems), integrates this sensory feedback, and subsequently generates a corrective, stabilizing body by selectively activating muscles. Therefore, balance testing is an important part of neurological tests [4]. In order to measure the capacity of these systems or differentiate between them, we have to use different postures and conditions such as: feet together, tandem and one leg stance, eyes open and closed, on a soft or firm surface. The results of these tests can be used in conjunction with prognosis and assessments of the human condition, contributing to decision-making around a human’s capability to work, or early detection of neurological diseases. For example, following concussion, communication between these sensory systems can be disrupted, causing postural instability [5]. A traditional Romberg test is used as a part of concussion assessment, where the individual stands as still as possible without deviating with different visual sensory conditions, either eyes closed or eyes open [6]. The influence of vision on stability can be expressed using the Romberg’s quotient (RQ) [7,8,9,10]. Romberg tests are normally conducted using a stopwatch and error grading, but the same test positions (feet together, tandem, one-leg, and double-leg stance) are also used in computerized balance tests [11]. Computerized boards offer more precise and objective measurement of performance. RQ has been used in detecting elderly falls [12], balance disturbances in multiple sclerosis [13], and has shown promising results in the measurement of concussions sustained during sport [14]. Although measurement is more accurate when computerized balance boards are used, it is difficult to compare results across studies that have used different devices. Common denominators, such as the RQ, are thus needed. The goal of this project is to develop a solution that is easy to use, anywhere at any time, while giving accurate results about changes in human performance.
The overall aim of the project is to investigate the most effective way of researching balance by measuring large numbers of balance tests (with affordable cost) for athletes, elderly people, and concussion patients, and then implement a mobile system that will allow doctors, physicians, and sports trainers to easily implement the solution in their daily work. A patient or an athlete completes a set of movements or exercises while wearing the sensor, which captures precise measurements that would have been previously unavailable to healthcare professionals or coaches. With the data, performance can be monitored accurately and objectively. Before we can get there, in the research, we need to develop new tools for making these tests available for a larger audience. This paper is about the prototyping process, and the interaction of data and the product itself. In order for the reader to understand the project, we must first explain the explorative nature of our product development of this connected medical device (1Balance) and underline how the data has had a significant role throughout the project alongside the different prototypes. Then, in future work, the effectiveness of the new system can be evaluated by running a pilot study that collects feedback from real users. In order to achieve scientific credibility for the system, the technical feasibility can be assessed by comparing the results of the author’s system to an existing and scientifically proven method of quantifying balance, such as the equipment used in the study of balance fallers and non-fallers [15].
2. Materials and Methods
This section will elaborate on the design–build–test loop iterative design methodology by going through a real world development project of our connected medical device, and conclude with lessons learned on the way from the initial idea to a pilot application. Our research methodologies were built on theory from case studies treating each of the prototypes as a case of its own [16] and participatory action research, which is an extension of action research, that means that the researchers act both as the key team members in the project as well as the researchers of the same case. This allows the researchers to see the process in much more detail in terms of the problems and the solutions at hand. The method aims to benefit practitioners by extracting scientific findings from university and industry collaboration [17]. The case was examined by reflecting on the work done during the development period. We chose the topic because there is currently very little research on how engineering design can approach developing these new connected devices, which is in itself a very multidisciplinary field. Knowledge of mechanics, electronics, firmware, software, connectivity, cloud solutions, information design, business models, and data science, at the very least, is required to create systems of connected devices. Depending on the core field of the measured phenomena, even more disciplines are present during the development process, in our case involving medical personnel during the whole development period.
2.1. Wayfaring with the Data
The methodology of iterative prototyping loops, called Wayfaring, is a way to approach complex and unknown problems in engineering design [18]. Development starts with a vision of the required solution, and cannot be solved simply by asking various subject matter experts what the best solutions are for a particular problem. This is because solutions for these kinds of problems often require using unproven or unknown concepts for their developers. Inside a single domain, the problems can be relatively straightforward to resolve, but it is the multidisciplinary nature of the projects that make them interdependent on each other. While the most effective way to communicate would be for everyone to know everything about the project at the same time, this is difficult to achieve in practice, since the understanding of one knowledge domain might differ a great deal within the product development team. For this reason, creating prototypes in different domains and integrating them creates new information for each team member. Wayfaring with the data means creating prototypes that yield different kinds of results or insights that will act as a feedback for all of the other designers of the system. We applied the prototyping loop to the internal data throughout the whole process.
2.2. Arduino Prototype
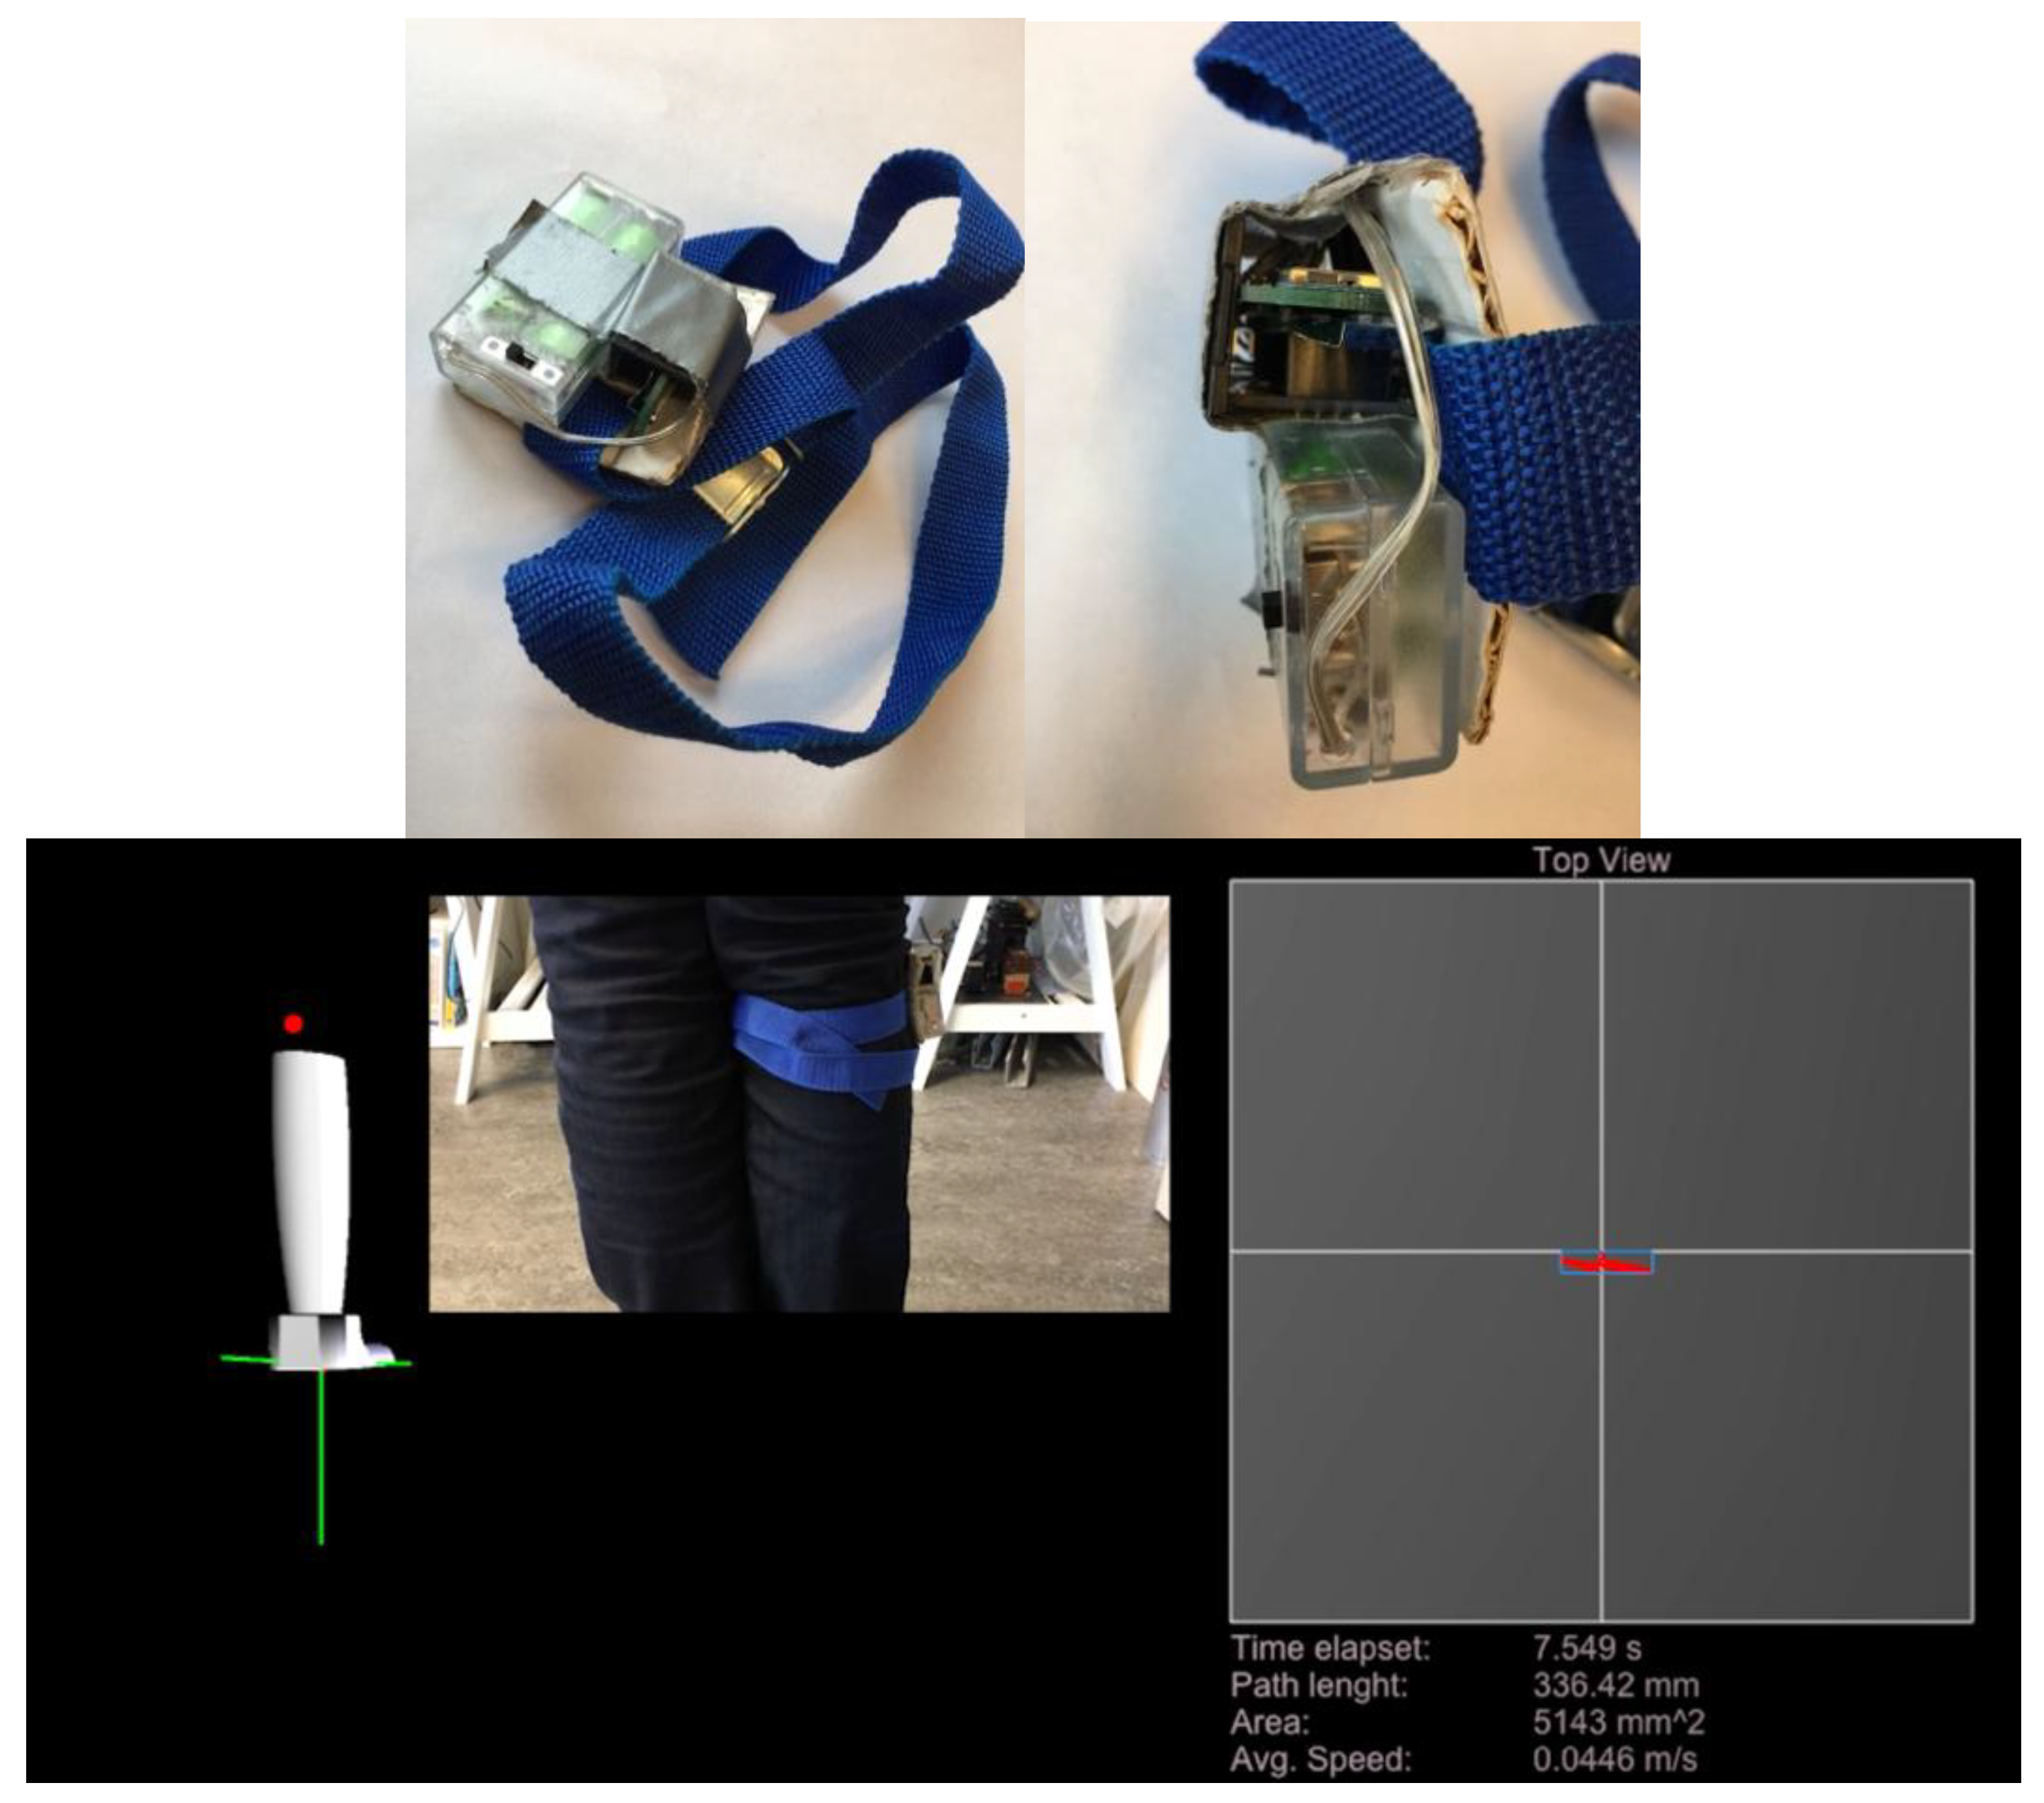
The design journey started with a very simple wireless Arduino-based prototype that was constructed from different modular parts readily available for anyone to purchase through webstores. The resolution of the prototype can be seen in Figure 1. While the external appearance of the prototype was rough, it was still adequate to produce the data for the confirmation of the underlying principle behind balance measuring. The hardware elements of the system were:
- A Light Blue Bean (Punch Through Design, San Francisco, CA, USA), an Arduino microcontroller with embedded Bluetooth radio
- Adafruit BNO055 (Bosch, Stuttgart, Germany) Absolute Orientation Sensor
- AA-battery holder
- Cardboard frame
- Piece of duct tape
- Redundant SD card
- A fabric strap
The Software libraries used were as follows:
- Processing 3
- Arduino IDE
- Bean Loader (a serial wrapper for Bluetooth)
- Adafruit_BNO055 libraries for Arduino
The data produced by the prototype:
- Measurement time
- Traveled path length of the sensor
- Area of the sensor visited
- Standard deviation of the velocity
- The Romberg’s quotients (RQs) of the aforementioned attributes
The purpose of this prototype was to ascertain that this kind of solution was possible to build from existing and commercially available components. Since it was only a proof-of-concept prototype, it was important that the cost and time that were used for the prototype were well managed. We were able to re-use a lot of the open source code around the sensor, and thus speed up the development time. Also, the sensor fusion of the accelerometer, gyroscope, and magnetometer was calculated by the BNO055 absolute orientation sensor, and thus provided accurate angular data for our use without needing any low-level firmware programming. The wireless sensor was integrated with a program created in Processing that translated the Euler-angles to XY-plane coordinates and provided the user interface. This prototype taught us how the bandwidth of the Bluetooth connection was able to handle real-time positioning of a knee in 3D space, and provided a pleasant enough user experience. The sample rate of the prototype was around 10 Hz. The data was mainly used to visualize the projected route of the knee to a two-dimensional (2D) plane and to move a 3D model of a leg accordingly, but also calculated some of the key figures that would be needed in the future prototypes, as shown in Figure 1. The data was cross-validated against a force plate without scientific control, but allowed the developers to visually estimate that the developed system gives very similar results. This also acted as a benchmark for future systems, indicating that the principle of sensor fusion of the accelerometer, gyroscope, and magnetometer works, and thus can be used if similarly functioning commercially available hardware is found.
2.3. Lunge Prototype
For the next-generation prototype, the most important thing was to find a suitable hardware supplier that would be a long-term partner, providing cost-efficient, high-quality sensors. Fortunately, Amer Sports had just started their beta program, developing a programmable inertial measurement unit (IMU) sensor based on well-established Suunto hardware (one of their other subsidiaries), so that the authors took the opportunity to be one of the first to develop software for this new sensor platform [19,20]. The next step was to validate whether the hardware would be suitable for our purposes. We decided to assess this by creating a new prototype that could measure the stability of a lunge exercise. The lunge is one of the most demanding exercises regarding dynamic balance, and thus was picked as the representative subject for the demonstration model. So, we reasoned, if this could be done, then all of the technically less demanding measurements would be doable as well. This was also the first time we made use of the Movesense sensor platform, which offered a mobile library and an example app to subscribe and operate different sensors on the platform [21]. Here, the first tests with the raw data were stored to a local file and analyzed using the MATLAB program. The main purpose of this testing was to be able to reliably distinguish whether the person wearing the sensor was lunging on a soft or hard surface. Again, an iterative process with small step prototypes was used as the methodology to realize the vision. The physical sensors were connected to a knee, as shown in Figure 2a and the simple interface in Figure 2b. From the data collected, we learned that an accelerometer alone was not enough to track the position of the knee, since the horizontal visualization of the position of the knee in the user interface revealed the level of precision. The double integration of the location would also square the error and thus rapidly cause the system to drift [22]. This needed to be tackled in the following prototypes.
2.4. Data Collection Prototype
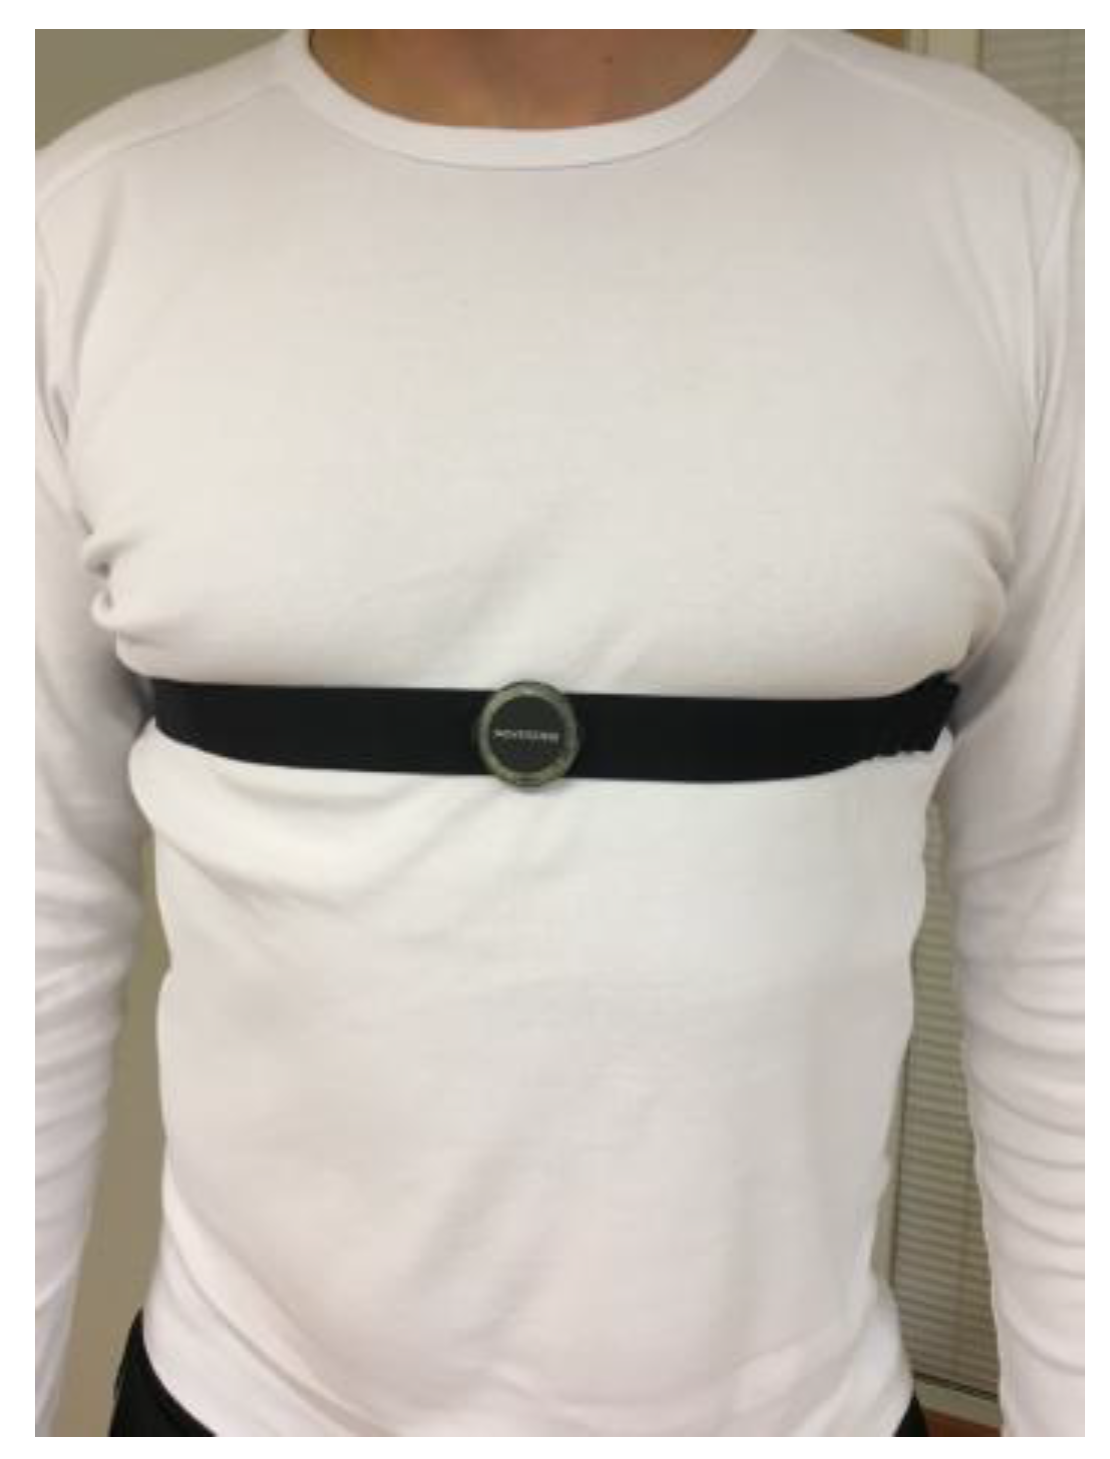
The main purpose of this prototype was to test and evaluate the hardware and software integration created for this research. Also, it tested the application with the cloud storage and the complete connectivity pipeline. From now on, every time that there was a chance to record the data on a force plate, we collected the data produced by the accelerometer and gyroscope. With this approach, we would gradually create a cross-validation dataset for the technological approach of the product. This was also the time when the point where the sensor was attached to the body was changed from the leg to the chest, with the assumption that the sway would be visible both in the lower parts of the body as well as in the upper body. The new position is shown in Figure 3.
For control purposes, we used one of the standard balance tests. Balance control was measured using both a portable computerized platform (standard strain gauge force plate connected to laptop via USB, model Balance trainer BT4) at the same time as our prototype. In these tests, Romberg test stance conditions were used on both hard surface and soft foam (40 cm × 40 cm × 4 cm). The participants stood still on the platform for 30 s in each of the four conditions with a closed stance: (i) eyes open on hard surface; (ii) eyes closed on hard surface; (iii) eyes open on soft foam, and (iv) eyes closed on soft foam. Arms were held at the sides of the body. In each of the balance conditions, the platform measured the center of pressure via the force plate, revealing body sway, while the attached sensor calculated its attitude and drew an imaginary line, the end of which is tracked as the amount of sway. Examined parameters for sway were: length (mm), area (mm2), and standard deviation of velocity (VelocitySD, mm/s). A relative balance change Romberg quotient (RQ) was assessed by calculating the ratio between comparable eyes open and eyes closed parameters (eyes closed divided by eyes open) on a hard surface (RQ1) and soft foam (RQ2). The Romberg quotients were computed for length, area, and VelocitySD.
In testing this prototype, several programming failures were found in the beta firmware. Thus, trying out several different applications and informing the manufacturer also sped up the overall system development. The aim was to start collecting data as a base for machine learning purposes, and it transpired that the data model needed to be prototyped as well. As we shared our thoughts with the medical part of our development team, we were taking steps to ascertain what possible value there was in this approach. For example, it would be valuable to get different reference values for how much different activity levels have an effect on the amount of sway. It also raised some questions: should we collect a subjective estimate of the balance of each subject that was measured in order to be able to classify their balance similarly to how physician does during an appointment? Or should we use regression to automatically determine the “good” and “bad” balance based only on the sway amount and meta information? We tested the device quite extensively, and produced a dataset of 80 healthy individuals who train in some competitive sport.
2.5. The Game Prototype
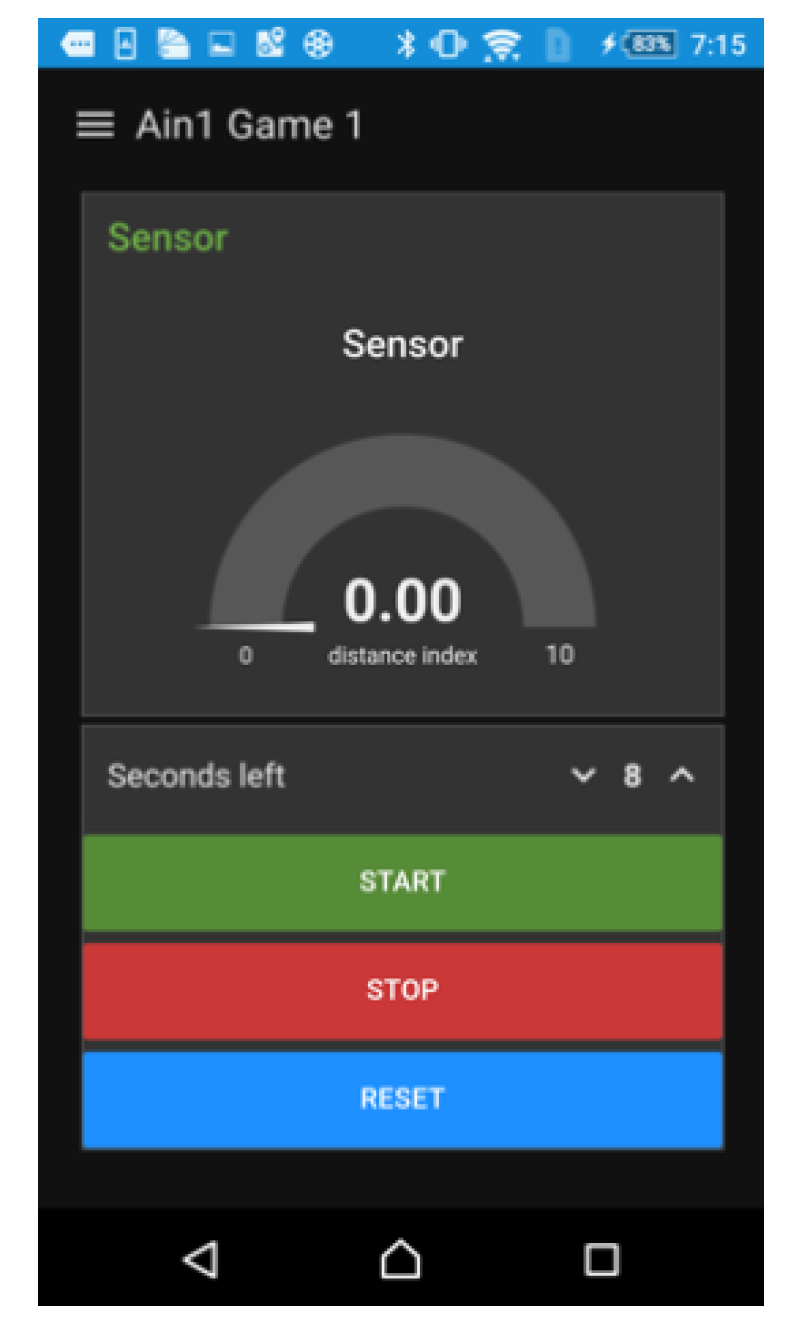
The game prototype was an opportunistic side step created for an event based on the demand for the device in the partner network. This prototype was required to create something engaging for a crowd of people, based on the same technology. The prototype was turned into a balance game where the person with the least sway would win after a session of measurements. During this event, we were able to trial how the application and the physical setup worked with hundreds of people, one after another. By showing the data of sway for the users, it became obvious that it can be used as a very engaging way of measuring and training balance. The data presented in the interface of the app is depicted in Figure 4. Also, a dashboard of results was created in order to compete in real time. The tandem stance, i.e., standing one foot after another, was chosen for the test position in order to create significant differences between different subjects, yet still remaining suitable for any kind of audience in terms of age or body control.
2.6. CES Demo Prototype
All of the prototypes described above focus on testing functions of the end product. The CES demo prototype is a so-called alpha prototype, which is one step closer to the end product, in this case by having a specially designed user interface for the Android tablet. The name of the prototype came from an event called the CES (Consumer Electronics Show) [23], where the demo was presented alongside the hardware manufacturer. The target was to have first use and usability tests of the end product, in order to get feedback. Tests were completed by the authors to see how different parts of the user interface worked in action while showing the demo at the CES. Therefore, this prototype didn’t have a back end to connect to, and did not save the data on the device or in the cloud. The CES prototype also tested how the complete integration of the sensor, tablet, application, and algorithms worked.
The application calculated the path length of the sway of the subject, the standard deviation of the sway velocity and the sway area, and the Romberg’s quotients of the aforementioned attributes of two sequential measurements. The CES demo prototype’s hardware, software, and data elements were:
- Hardware:
- ○
- 9.7” Samsung Galaxy S3 tablet with Android 7 (Nougat)
- ○
- Movesense sensor and a chest strap
- Software:
- ○
- Android Studio
- ○
- Movesense sensor’s Android libraries
- ○
- 1Balance user interface for Android devices
- Data:
- ○
- Raw data:
- ▪
- Accelerometer
- ▪
- Gyroscope
- ▪
- Magnetometer
- ○
- Calculated data
- ▪
- Subject’s sway
- Path length
- VelocitySD
- Area
- ▪
- Romberg’s quotients of the aforementioned attributes
- ○
- Subject data:
- ▪
- Age
- ▪
- Height
- ▪
- Weight
- ▪
- Gender
- ▪
- Dominant foot
The 1Balance Android application was built on top of Suunto’s Movesense sample application. The sensory integration filter designed by Madgwick was used for getting the orientation and thus the 2D coordinates from the raw values of the IMU [24]. This prototype was already able to demonstrate its usefulness to an audience, as it enabled us to calculate the RQ value of any given two stances measured in a row. The scientific validation of the application was left for the future studies to judge.
2.7. Pilot Prototype
The basic idea of the pilot prototype, also known as the beta prototype, is to test the designed functionalities of the final production version. This includes testing or piloting the product with end users. Therefore, the design, use, and usability of the application should be close to the end product. Due to this, the user experience design and production of the pilot prototype’s user interface was outsourced. Data from the pilots were saved both locally into the tablet and uploaded to the cloud. The back end communication was only one-directional, since the feedback was not a crucial function of the pilot prototype. The pilot prototype’s hardware, software, and data elements were:
- Hardware:
- ○
- Android compatible tablet
- ○
- Movesense sensor and chest strap
- Software:
- ○
- Android Studio
- ○
- Movesense sensor’s Android libraries
- ○
- 1Balance user interface for Android devices
- ○
- IBM backend and cloud for saving the measurement data from the pilots
- Data:
- ○
- Raw data:
- ▪
- Accelerometer
- ▪
- Gyroscope
- ▪
- Magnetometer
- ○
- Calculated data
- ▪
- Subject’s sway
- Path length
- VelocitySD
- Area
- ▪
- Romberg’s quotients of the aforementioned attributes
- ○
- Subject data:
- ▪
- Age
- ▪
- Height
- ▪
- Weight
- ▪
- Gender
- ▪
- Dominant foot
- ▪
- Consent for system to store the personal information
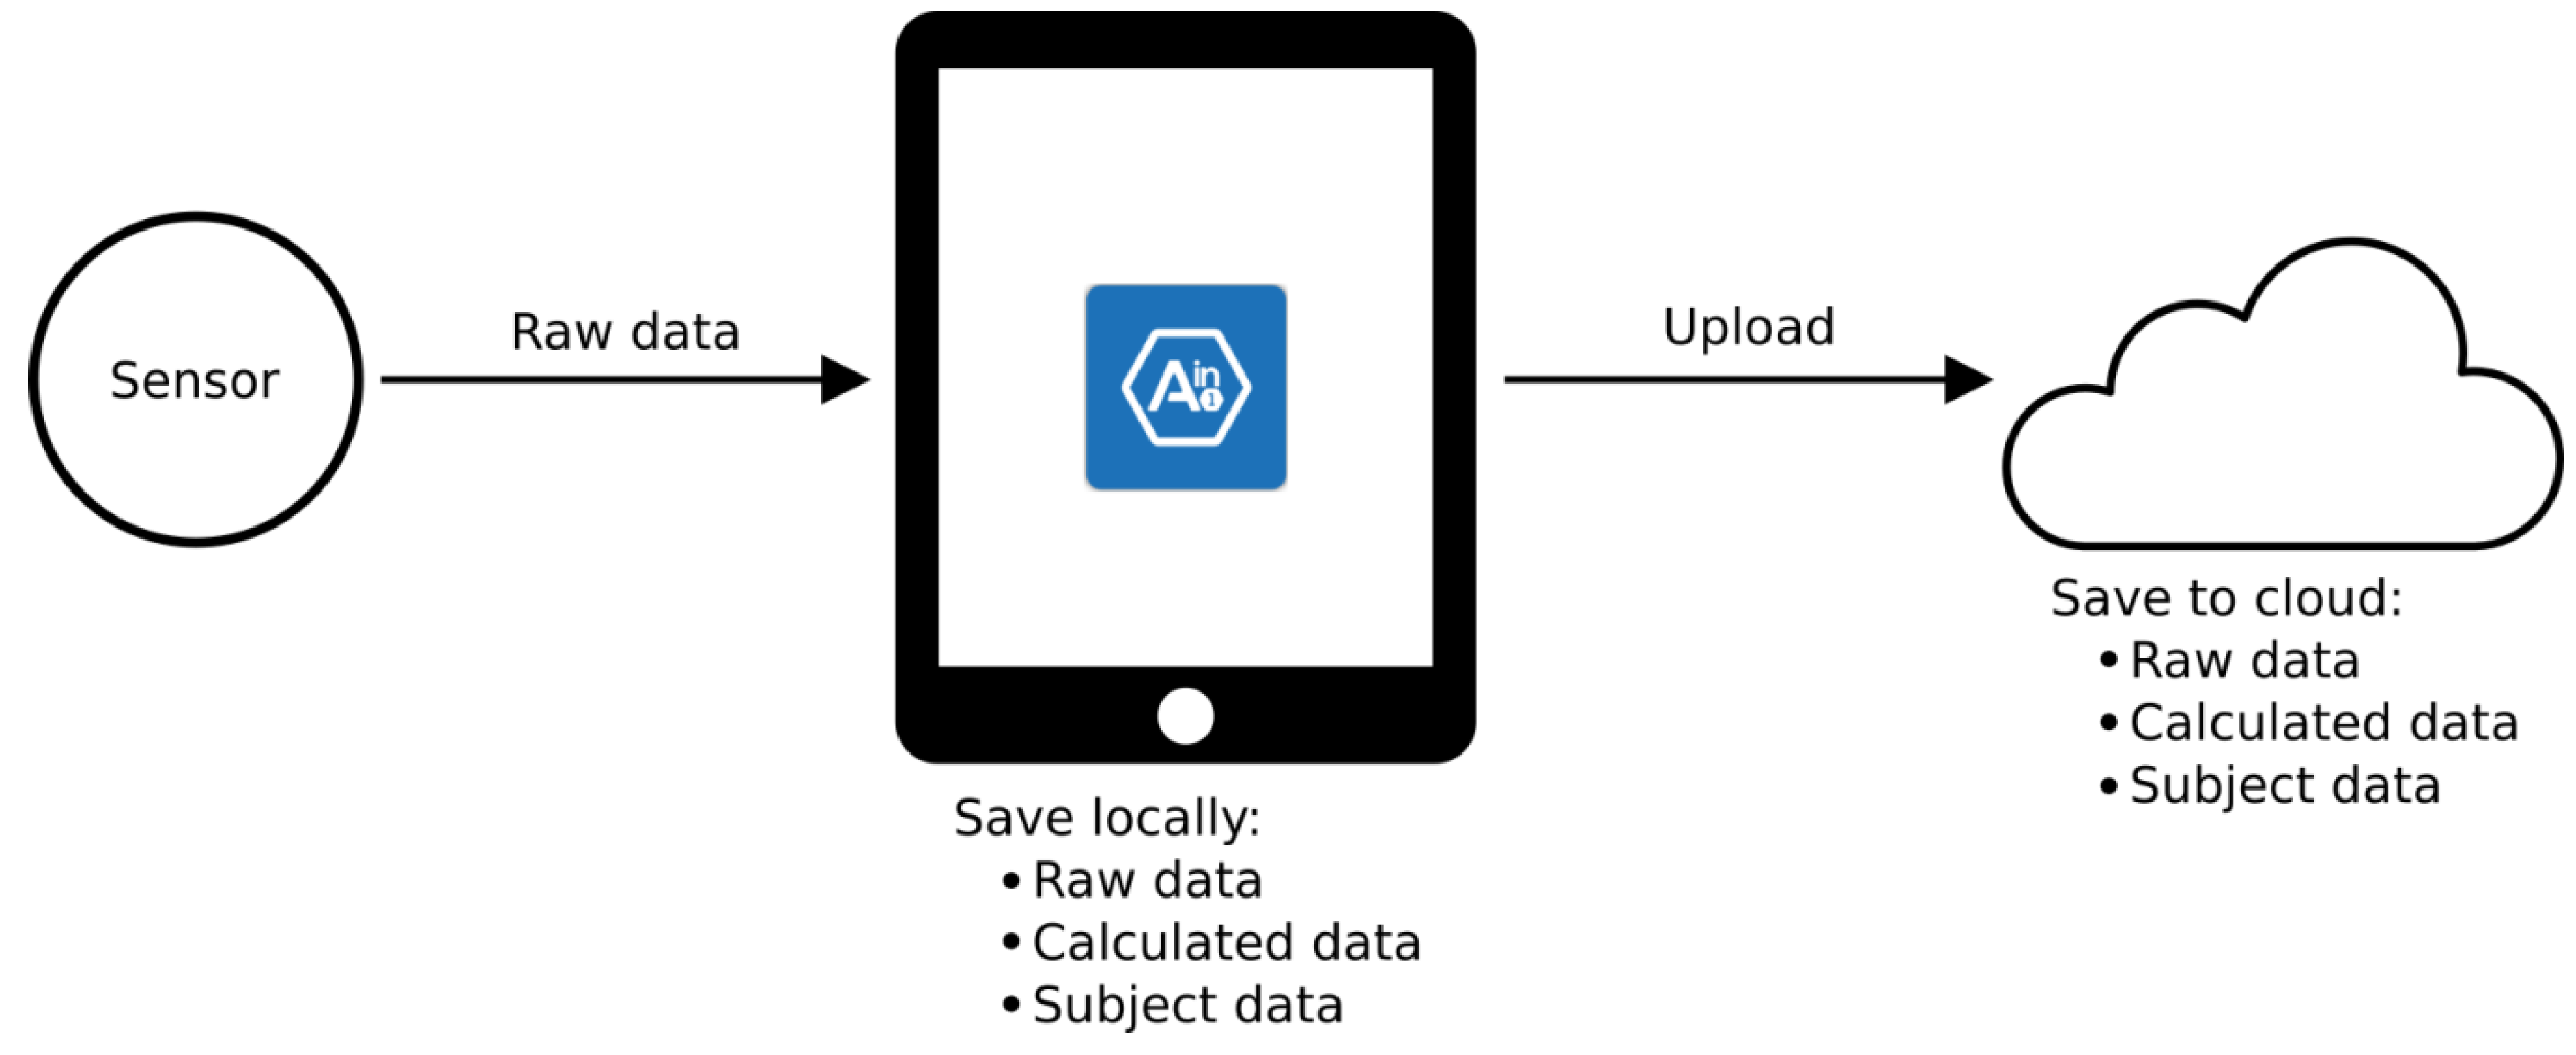
Since the intended use of the device is ultimately medical, we had some regulations to follow, as well as the European Union’s new General Data Protection Regulation (GDPR), which had an effect on our design [25], namely: how to ask and store consents on the system, and how to incorporate a flexible approach that allows users to be forgotten, receive their data in machine-readable form, or share it with the party that they want. These were all factors that needed to be addressed and exist in the system by design. Figure 5 shows how the internal data travels from the sensor to the cloud storage service created for the application. The pilot prototype enables the team to create new studies that serve the overall goal of figuring out the balance as a factor of human performance.
3. Results
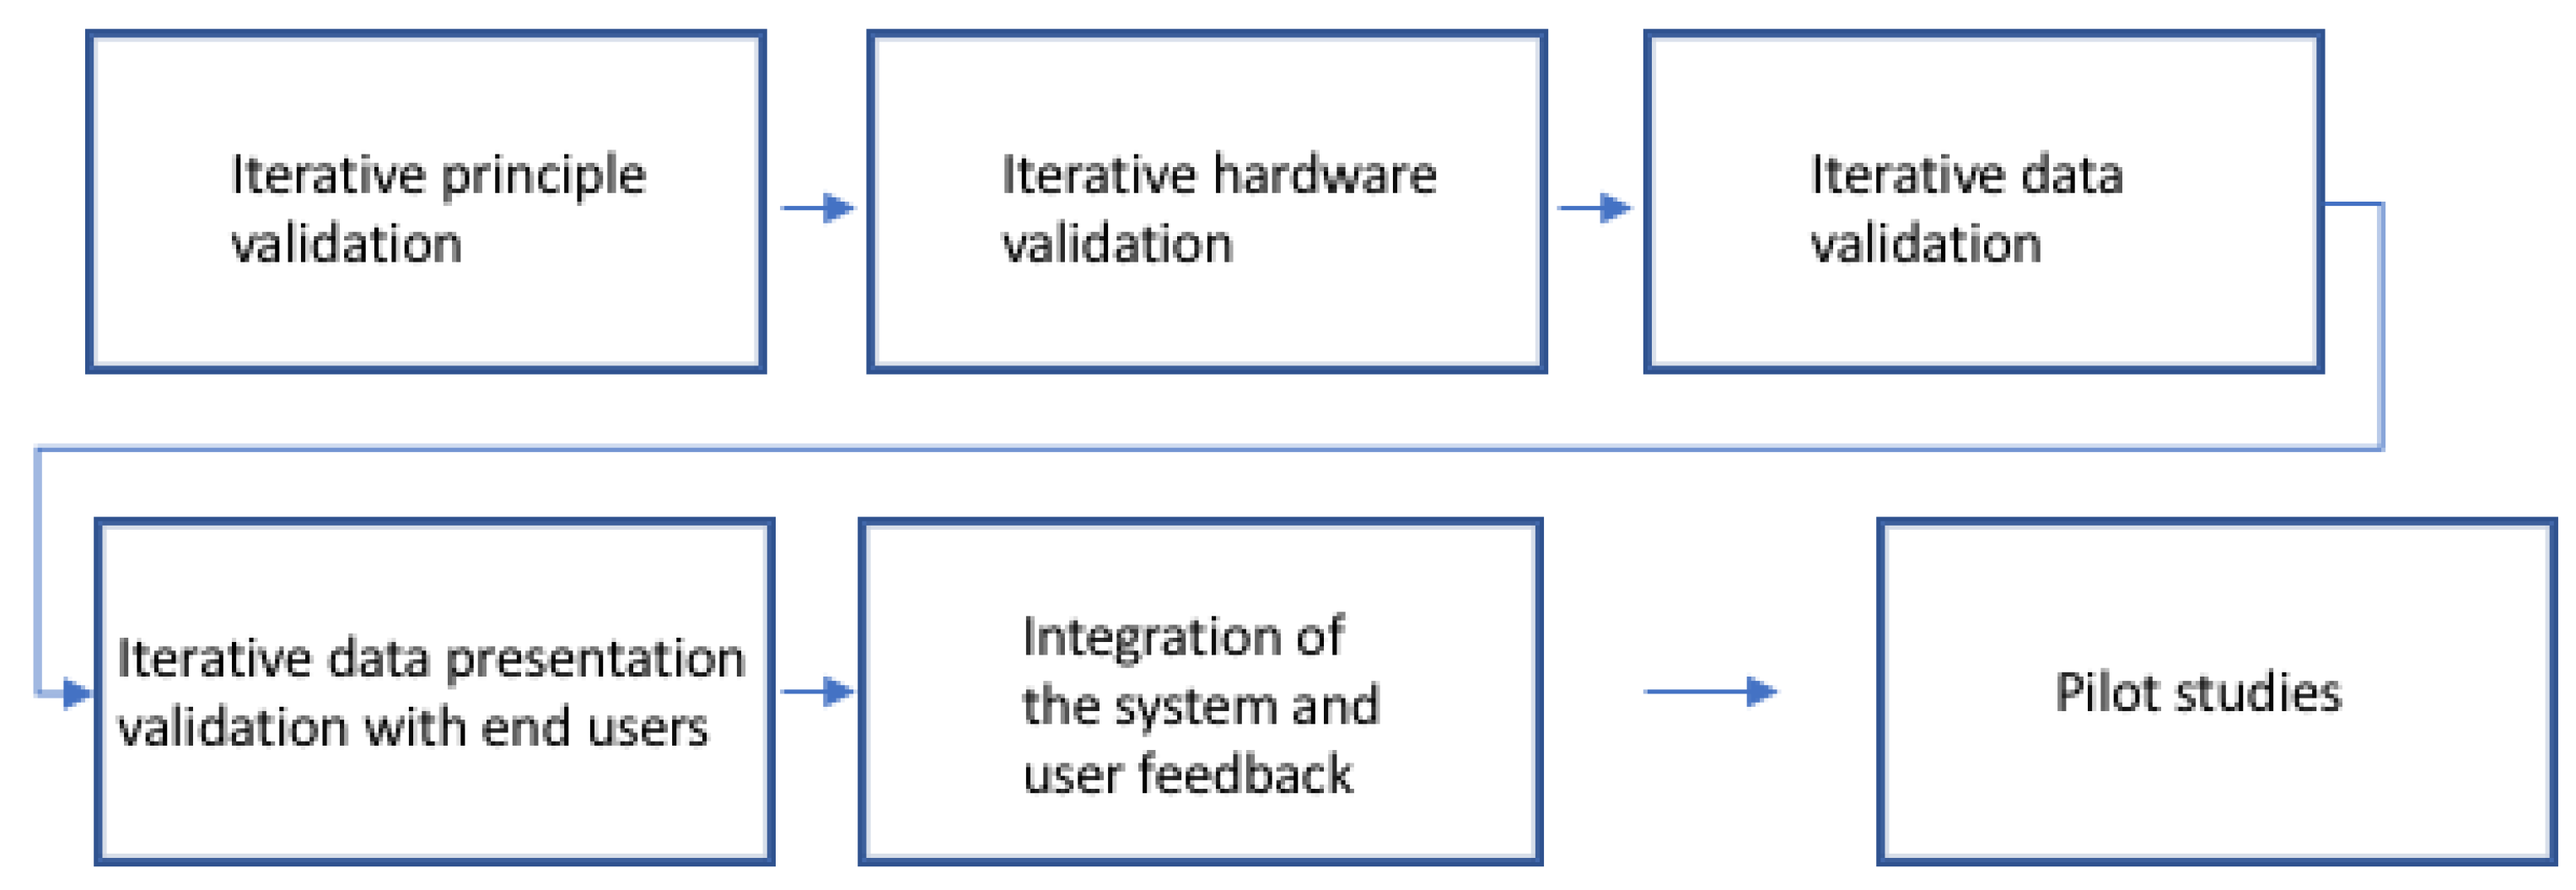
The developments project started without knowledge of what would be the end product, but a vision of how a balance could be quantified with one wearable sensor. In an iterative process, it is much easier to see in hindsight how the questions developed from one prototype to another. In Figure 6, the oversight is given, and each box is elaborated below.
Our results were captured during the process from the data perspective. The first proof-of-concept prototype (the Arduino prototype) yielded a confirmation that the basic principle of collecting angular data from a wireless IMU sensor works as an indicator of human balance. Further investigations would be focused on which of the ways to describe the balance would make most sense, and also how to make this method so easy and cost-effective that it would lead to large numbers of users and measurements. The second prototype (the Lunge prototype) collected and visualized data from a lunge exercise, and confirmed that a newly designed hardware/firmware would work for us. Also, we learned how unprecise the accelerometer-only data was with a low sampling rate, due to the well-known double integration error involving the noise of the sensor. The visualization of the internal data confirmed the error. The third prototype was the data collection prototype, and its purpose was to show that the system could be cross-validated against an existing solution of a different principle. We also began to iterate over the algorithm that would fuse the sensor values, and hypothesized ways that the data would be ideal to collect for the planned machine learning purposes. The fourth prototype (the game prototype) gave a lot of insight as to whether this approach would easily measure large quantities of people. In data terms, the game prototype underlined the importance of an easy interpretation of the data. Even if it is not that descriptive of the physical phenomena, it is easier as an end user to understand, for example, the concept of lowering a score from a number 10 to a number 8, rather than lowering the standard deviation of your sway. As the end result achieved the desired effect, this justified the simplification of the data output. The fifth prototype (the CES Demo prototype) was made to integrate everything learned from the process into one prototype, and show it to potential users and get ideas and feedback about the concept. The CES Demo prototype enabled us to receive feedback about the user interface, such as what was difficult or whether the application logic was understandable, but also whether we were on the right track with the data gathering. One concrete example was that when the RQs were calculated, there was a pre-assumption embedded in the application logic, so that the first measurement of the two-part measurement session was always worse in terms of amount of sway. This is not always true, especially when comparing the balance between two legs of the same person without knowing which of them has better control. On this note, the design was changed to accept measurements with an arbitrary order, visualizing the results consistently and pointing out the order of the measurements. In addition, this event gave us user insights and hinted toward our customers that they needed to use multiple devices for simultaneous testing. The sixth and last prototype before production (the Pilot prototype) was designed to make one fully functioning version that would act as a real research tool and give feedback from complete test projects where this system is used as the tool for measuring balance.
4. Discussion
This case of developing the connected medical device described will help scholars discuss what the special requirements are for future approaches when developing connected devices. Development projects of connected devices are naturally multidisciplinary, since the knowledge required for making the whole pipeline of data from a sensor to actionable insights goes across subject domains. Generally, there is some kind of phenomena on the subject of measurement and interpretation in connected devices, which is in this case the medical field and balance. We argue that communicating between disciplines is a demanding task that can be eased through prototyping and showing the abstract thinking in concrete prototypes that manifest the idea and the value, albeit not always the looks. The contribution to the theory based on this case is that the internal data produced by the devices should be prototyped very early on as well, as the intended value from the data has an effect on the design of the device, i.e., external data. Also by doing so, it enables the development team to ideate on possible different outcomes that could be achieved with the same or a similar hardware setup. This is the process that is abstracted in Figure 7.
In the case of the 1Balance device, we showed six different examples of using data during the development that could be tested if they were utilized in similar projects:
- To confirm that the technical principle is true in context.
- To confirm that the hardware and software work together, producing data as intended
- To collect data in quantities and test connectivity
- To test the physical functionality of the device and visualize the data
- To create a test setup for prototyping the pipeline from sensor values to insights
- To make a research tool for collecting data for statistical analysis and machine learning purposes
These examples were brought forward in order to underline the importance of internal data as the value of the system. The reason for people to use the system is the actionable insights that it will provide. At the beginning of the development project, there is probably an idea or vision of what the product should provide, but after creating the first data and sharing this with the development team, the original idea might change, or is at least refined. The difference here is to conceptually take the data into the iteration loops and use it to act as feedback and inspiration to the system design. The same applies to the development of the usage of a system. Many might understand what value this product gives to the end user without a deeper understanding of how it is technically achieved. This also enables the non-technical part of the development team to comment on what is designed before the development goes further. For the same reason, a prototype system should be created in order to get similar data to that which is intended in the actual product. This also prevents overworking some details that might not end up as originally imagined. We continually learned something additional to the answers for our original questions with each prototype, which reinforces the benefits of the approach. In our case, the Arduino prototype acted as an example of the importance of showing the data early on. After creating the Arduino prototype, the whole development team was on the same page regarding what was possible and how it should be done. In the physical context where there are medical devices attached to a body, the data is wirelessly transferred to a tablet, and then further to a cloud in order to enrich the information gathered; then, it is finally presented on the interface. As a result, there are many points that can go wrong; thus, testing should begin as early as possible. These complex situations are almost impossible to imagine perfectly without testing, and that is why we argue for this approach for connected devices, as we have seen in the development of 1Balance.
Author Contributions
Conceptualization, H.S., J.K., M.V and M.S; Methodology, H.S.; Software, H.S and J.K.; Validation, H.S., J.K. and M.V.; Formal Analysis, H.S.; Investigation, H.S.; Resources, M.S. and M.V.; Data Curation, H.S., J.K. and M.V; Writing-Original Draft Preparation, H.S., J.K and M.V; Writing-Review & Editing, H.S., J.K., M.V. and M.S; Visualization, H.S. and J.K.; Supervision, M.S.; Project Administration, H.S..; Funding Acquisition, M.S.
Acknowledgments
This research is funded by the Research Council of Norway (RCN) through its user-driven research (BIA) funding scheme, project number 236739/O30.
Conflicts of Interest
The authors declare no conflict of interest.
References
- Elverum, C.W.; Welo, T.; Steinert, M. The fuzzy front end: Concept development in the automotive industry. In ASME 2014 International Design Engineering Technical Conferences and Computers and Information in Engineering Conference; American Society of Mechanical Engineers: New York, NY, USA, 2014. [Google Scholar]
- Reime, T.; Sjöman, H.; Gerstenberg, A.; Abrahamsson, P.; Steinert, M. Bridging tangible and virtual interaction: Rapid prototyping of a gaming idea. In International Conference on Entertainment Computing; Springer: Cham, Switzerland, 2015; pp. 523–528. [Google Scholar]
- Ibarra-Esquer, J.E.; González-Navarro, F.F.; Flores-Rios, B.L.; Burtseva, L.; Astorga-Vargas, M.A. Tracking the Evolution of the Internet of Things Concept across Different Application Domains. Sensors 2017, 17, 1379. [Google Scholar] [CrossRef] [PubMed]
- Gurley, J.M.; Hujsak, B.D.; Kelly, J.L. Vestibular rehabilitation following mild traumatic brain injury. NeuroRehabilitation 2013, 32, 519–528. [Google Scholar] [PubMed]
- Guskiewicz, K.M. Balance assessment in the management of sport-related concussion. Clin. Sports Med. 2011, 30, 89–102. [Google Scholar] [CrossRef] [PubMed]
- Murray, N.; Salvatore, A.; Powell, D.; Reed-Jones, R. Reliability and validity evidence of multiple balance assessments in athletes with a concussion. J. Athl. Train. 2014, 49, 540–549. [Google Scholar] [CrossRef] [PubMed]
- Dornan, J.; Fernie, G.R.; Holliday, P.J. Visual input: Its importance in the control of postural sway. Arch. Phys. Med. Rehabil. 1978, 59, 586–591. [Google Scholar] [PubMed]
- Morioka, S.; Okita, M.; Takata, Y.; Miyamoto, S.; Itaba, H. Effects of changes of foot position on Romberg’s quotient of postural sway and leg muscles electromyographic activities in standing. J. Jpn. Phys. Ther. Assoc. 2000, 3, 17–20. [Google Scholar] [CrossRef] [PubMed]
- Lê, T.-T.; Kapoula, Z. Role of ocular convergence in the Romberg quotient. Gait Posture 2008, 27, 493–500. [Google Scholar] [CrossRef] [PubMed]
- Kapoula, Z.; Gaertner, C.; Yang, Q.; Denise, P.; Toupet, M. Vergence and standing balance in subjects with idiopathic bilateral loss of vestibular function. PLoS ONE 2013, 8, e66652. [Google Scholar] [CrossRef] [PubMed]
- De Kegel, A.; Dhooge, I.; Cambier, D.; Baetens, T.; Palmans, T.; Van Waelvelde, H. Test–retest reliability of the assessment of postural stability in typically developing children and in hearing impaired children. Gait Posture 2011, 33, 679–685. [Google Scholar] [CrossRef] [PubMed]
- Howcroft, J.; Lemaire, E.D.; Kofman, J.; McIlroy, W.E. Elderly fall risk prediction using static posturography. PLoS ONE 2017, 12, e0172398. [Google Scholar] [CrossRef] [PubMed]
- Kalron, A. The Romberg ratio in people with multiple sclerosis. Gait Posture 2017, 54, 209–213. [Google Scholar] [CrossRef] [PubMed]
- Vartiainen, M.; Holm, A.; Koskinen, S.; Hokkanen, L. The feasibility of romberg quotient in assessment of balance after sport concussion. Br. J. Sports Med. 2017, 51, A57–A58. [Google Scholar] [CrossRef]
- Borg, F.; Laxåback, G.; Björkgren, M. Comparison of Balance and Some Other Physical Characteris-Tics between Elderly Fallers and Non-Fallers; University of Jyväskylä, Chydenius Institute: Kokkola, Finland, 2008. [Google Scholar]
- Eisenhardt, K.M.; Graebner, M.E. Theory building from cases: Opportunities and challenges. Acad. Manag. J. 2007, 50, 25–32. [Google Scholar] [CrossRef]
- Ottosson, S. Participation action research-: A key to improved knowledge of management. Technovation 2003, 23, 87–94. [Google Scholar] [CrossRef]
- Gerstenberg, A.; Sjöman, H.; Reime, T.; Abrahamsson, P.; Steinert, M. A Simultaneous, Multidisciplinary Development and Design Journey–Reflections on Prototyping. In International Conference on Entertainment Computing; Springer: Cham, Switzerland, 2015; pp. 409–416. [Google Scholar]
- Amer Sports. Available online: https://www.amersports.com/ (accessed on 14 April 2018).
- Suunto. Available online: https://www.amersports.com/brand/suunto/ (accessed on 14 April 2018).
- Movesense. Available online: https://www.movesense.com/ (accessed on 13 April 2018).
- Thong, Y.K.; Woolfson, M.S.; Crowe, J.A.; Hayes-Gill, B.R.; Challis, R.E. Dependence of inertial measurements of distance on accelerometer noise. Meas. Sci. Technol. 2002, 13, 1163. [Google Scholar] [CrossRef]
- CES—The Global Stage for Innovation—CES 2018. Available online: https://www.ces.tech/ (accessed on 13 April 2018).
- Madgwick, S.O.; Harrison, A.J.; Vaidyanathan, R. Estimation of IMU and MARG orientation using a gradient descent algorithm. In Proceedings of the 2011 IEEE International Conference on Rehabilitation Robotics (ICORR), Zurich, Switzerland, 27 June–1 July 2011; pp. 1–7. [Google Scholar]
- Data Protection in the EU. European Commission. Available online: https://ec.europa.eu/info/law/law-topic/data-protection/data-protection-eu_en (accessed on 13 April 2018).
Figure 1.
External design of the sensor platform of the Arduino prototype and the user interface with visualized (internal) data.
Figure 1.
External design of the sensor platform of the Arduino prototype and the user interface with visualized (internal) data.

Figure 2.
(a) Positioning of the sensor. (b) User interface of the application.

Figure 3.
The position of the sensor was changed to the chest of the subject.

Figure 4.
Screenshot of the software for the game prototype.

Figure 5.
Data handling of the pilot prototype.

Figure 6.
The retrospective view of the development process.

Figure 7.
Abstraction of the consequent external and internal data iteration loops.

© 2018 by the authors. Licensee MDPI, Basel, Switzerland. This article is an open access article distributed under the terms and conditions of the Creative Commons Attribution (CC BY) license (http://creativecommons.org/licenses/by/4.0/).
Share and Cite
MDPI and ACS Style
Sjöman, H.; Kalasniemi, J.; Vartiainen, M.; Steinert, M. The Development of 1Balance: A Connected Medical Device for Measuring Human Balance. Technologies 2018, 6, 53. https://doi.org/10.3390/technologies6020053
AMA Style
Sjöman H, Kalasniemi J, Vartiainen M, Steinert M. The Development of 1Balance: A Connected Medical Device for Measuring Human Balance. Technologies. 2018; 6(2):53. https://doi.org/10.3390/technologies6020053
Chicago/Turabian StyleSjöman, Heikki, Jani Kalasniemi, Matti Vartiainen, and Martin Steinert. 2018. "The Development of 1Balance: A Connected Medical Device for Measuring Human Balance" Technologies 6, no. 2: 53. https://doi.org/10.3390/technologies6020053
Note that from the first issue of 2016, this journal uses article numbers instead of page numbers. See further details here.