Article

Seasonality of Discrepancies between Admission and Discharge Diagnosis for Medicare Patients

1
Department of Computer Science and Engineering, University of Texas, Arlington, TX 76010, USA
2
School of Health Sciences, Central Michigan University, Mount Pleasant, MI 48859, USA
*
Author to whom correspondence should be addressed.
Technologies 2018, 6(4), 111; https://doi.org/10.3390/technologies6040111
Submission received: 2 November 2018 / Revised: 20 November 2018 / Accepted: 22 November 2018 / Published: 27 November 2018
(This article belongs to the Special Issue The PErvasive Technologies Related to Assistive Environments (PETRA))

Abstract

:
Admission and discharge diagnoses of in-hospital patients are often in discord. Incorrect admission diagnoses are related to an increased cost of care and patient safety. Additionally, due to the seasonality of many conditions, this discord may vary across the year. In this paper, we used medical claims data to develop a methodological framework that examines these differences for Medicare beneficiaries. We provide examples for pneumonia, which is a condition with seasonal implications, and aneurysm, where early detection can be lifesaving. Following a Bayesian approach, our work quantifies and visualizes with time-series plots the degree that any clinical condition is correctly diagnosed upon admission. We examined differences in weekly intervals over a calendar year. Furthermore, the median length of stay and the mean hospital charges were compared between matching and non-matching {admission, discharge Dx} pairs, and 95% confidence intervals of the difference were estimated. We applied statistical process control methods, and then visualized the differences among the hospital charges and the length of stay, per week, with time-series plots. Our methodology and the visualizations underline the importance of a rigorous and non-delayed diagnostic process upon admission, since there are significant implications in terms of hospital outcomes and cost of care.

1. Introduction

Today, hospitals generate large amounts of data that are kept in large data warehouses. This has enabled data scientists to mine useful information for clinical decision making. Data-driven systems utilize a number of clinical attributes, including laboratory, radiology tests, patient history, and more. There are many implementations of clinical decision support systems that predict the patient diagnosis, identify high-risk patients, and provide treatment insights. Many of these examples rely on data analytics and large secondary datasets [1,2]. Examples include the identification of clinical events [3], the evaluation of medical device effectiveness [4], and the understanding of patterns in rare conditions [5]. A number of research examples utilized claims data from the Centers for Medicare and Medicaid Services (CMS) [6]. CMS describe their data to be intended for “important research that will lay the foundation for better quality and lower costs in the healthcare system”.
Newly admitted patients at the hospital are assigned with an admission diagnosis (Dx) upon hospitalization. This admission Dx code on the medical claim indicates the initial Dx that the beneficiary was given, at the time of admission. The principal exit Dx is the condition that occasioned the need for hospitalization, and is determined after the patient has been thoroughly examined and completed any medical tests. There is published evidence that the admission and discharge Dxs are often in discord. Researchers have studied theses discrepancies and their effect on outcomes of care [7]. Since long ago, researchers have started to study these discrepancies and the characteristics of patients with high rates of admission-discharge Dx discrepancies. Leske found that discrepancies existed in 26.8% of all hospital admissions, and are most frequent in medical, pediatric, and neurological patients [8]. In another research that examined the coding accuracy of hospital discharge data in cardiac care units, it was found that the sensitivity of the examined diagnoses was 60.7% [9]. It is reasonable to hypothesize that discrepancies between admission and discharge Dx can lead to unwanted medical examinations, incorrect treatments, or delays in delivering care. There are also patient safety implications, such as negative hospital outcomes of care, inefficiencies to the process of care delivery, and the increased cost of care. The latter, subsequently, is often transferred to patients and their payers in the form of increased hospital charges. Finally, existing approaches for the quantification of discrepancies {admission, discharge Dx} focus on measuring the overall effect on outcomes or finding patient profiles where these discrepancies appear in high frequency [7,8,9]. Since it is likely for hospitalized patients to be assigned the incorrect admission Dx code, the thorough and non-sporadic use of diagnostic protocols and differential diagnosis tools are important for improved diagnosis accuracy [10,11].
The seasonal aspect of diagnosis discrepancies is reasonable to be examined, considering how seasonality plays a role in the prevalence of some diseases, such as respiratory ones. Research rarely addresses the seasonal aspect of diagnosing diseases. During the year, a given symptom may lead to a diagnosis with variable probability. For instance, it is more frequent for cough to be associated with seasonal flu during winter rather than during the summer months.
This paper, which is an extension of our previous research work [12], the admission-discharge Dx discrepancies are examined in a temporal manner in weekly intervals. We had presented an approach to examine the seasonal variation of discrepancies. Now, we are quantifying these discrepancies in a temporal manner, and furthermore examining their associations with the length of stay and hospital charges. We define, as discrepancy, the mismatch between admission and discharge Dx.
Therefore, in this paper, we present a methodological framework to calculate and visualize the strength of the “admission Dx→discharge Dx” relationship for each of the 52 weeks of a calendar year. We examine the degree to which clinical decision makers did not “label” the patient with the diagnosis that was finally given as a primary exit Dx, on discharge. Therefore, we want to quantify the conditional probability P (AD = k | PED = k), and not the inverse P (PED = k | AD = k): Our goal is not to predict the exit Dx based on the admission Dx, but rather examine the probability of a diagnosis to be set correctly early on, during admission. We also introduce two measures: length of stay (LOS) and Claims Payment Amount to measure and visualize with time-series plots how the diagnosis discrepancies are associated with increased hospital charges and prolonged hospital stay. In order to demonstrate our methodology, we provide exemplified time-series plots for two conditions: pneumonia, a respiratory condition with seasonal implications, and aneurysm, a life-threatening condition that is crucial to be detected in a non-delayed manner. For the purpose of this study, we transformed International Classification of Diseases (ICD) 9-CM codes to Clinical Classification Software (CCS) codes developed by the Agency for Healthcare Research and Quality (AHRQ) [13]. With this grouping, we are more confident that a non-matching admission-discharge Dx is a real mismatch: different CCS codes describe different clinical conditions, at least sufficiently. In contrast, due to the ICD specificity, two ICD-9-CM codes may describe almost identical conditions, and therefore, an ICD-9-CM admission-discharge mismatch would not necessarily imply failure to recognize the condition.
Our work does not examine confounding factors such as the geography of hospitalization, the beneficiary age, gender, or type of hospital admission, since the objective is not the causation of discrepancies, but rather their prevalence and association with two outcomes. Further research can focus on aspects of care and patient characteristics that act as burdening factors to admission-discharge diagnosis discrepancies, such as in the work of Johnson et al. [14], where the authors examined how these discrepancies are predictors of the length of stay, via a Generalized Linear Regression (GLR) model, adjusting for patient factors.
The paper begins by introducing to the reader important terminologies, and then discusses our replicable methodological framework that can be applied to firstly measure discrepancies in a temporal manner, and secondly compare and visualize (with time-series plots) differences to outcomes of care between correct and incorrect admission Dxs. Finally, the paper uses our framework for pneumonia and aneurysm, and visualizes the degree to which the diagnosis discrepancies lead to increased hospital charges and prolonged hospital stay. This research aims to raise awareness of the importance of an evidence-based and robust diagnosis triage process upon admission, and the uninterrupted and thorough application of up-to-date diagnosis protocols during the clinical encounter. This is, in turn, anticipated an improvement in patient safety aspects and a reduction in the cost of care.

2. Terminologies

International Classification of Diseases (ICD): The nomenclature system for diseases standardized by the World Health Organization (WHO) for reporting diseases, injuries, disorders, and other medical conditions. Both the admission and principal exit Dx attributes in our dataset were coded using ICD-9-CM, which is the clinical modification of the ninth ICD revision [15].
Clinical Classification of Software Codes (CCS): The CCS classifies each ICD-9 code into broader disease categories. Since there are more than 14,000 different ICD-9 codes, CCS groups ICD codes into a smaller number of exclusive disease categories. The CCS to ICD-9 mapping is available from the Healthcare Cost and Utilization Project (HCUP) [16]. The cardinality of the relationship between the ICD and CCS is N-1. For example, ‘481′ is the ICD-9 code for ‘Pneumonia due to Streptococcus pneumoniae’, while ‘483′ is an ICD-9 code for ‘Pneumonia due to other specified organism’. Both would be grouped under the same CCS code (CCS = 122).
Admission Diagnosis (AD): This is an ICD code on the medical claim that indicates the initial Dx that the beneficiary was assigned with, at the time of hospital admission. The admission diagnosis can be considered as the initial diagnostic evaluation of the patient.
Principal Exit Diagnosis (PED): This is an ICD code on the medical claim that is determined after the patient has been thoroughly examined and has completed any laboratory and radiology tests. The Principal Exit Diagnosis indicates what occasioned the need for hospitalization. In this work, this is our ground truth variable.

3. Materials and Methods

3.1. Data and Attributes

The research uses the SynPUF dataset. This is publicly available from the Centers for Medicare and Medicaid Services (CMS), in order to facilitate research efforts. SynPUF is a synthetic medical claims dataset that simulates real hospital admissions data. The SynPUF data include the same patterns and trends that can be found in non-synthetic datasets. Non-synthetic datasets are available for purchase by CMS. The SynPUF data includes the following information: claim period, provider number, claim payment, primary and secondary diagnoses, medical procedure codes, Diagnostic Related Group (DRG) codes and price, utilization day count, and the coinsurance deductible amount. CMS makes 20 different subsets of SynPUF data available. We used the Inpatient Claims SynPUF files, since our focus is on inpatient admissions, so as to study the nature of discrepancies between admission Dx and the Principal Exit Dx. The most recent SynPUF data made available by CMS consist of three years of simulated data for patients admitted between 2008–2010. Each sample consisted of approximately 65,000 records, and as we merged 10 sample datasets as mentioned in Supplementary Materials section, the final number of records was approximately 650,000 records. The attributes that we used for this study are shown in Table 1 [17].

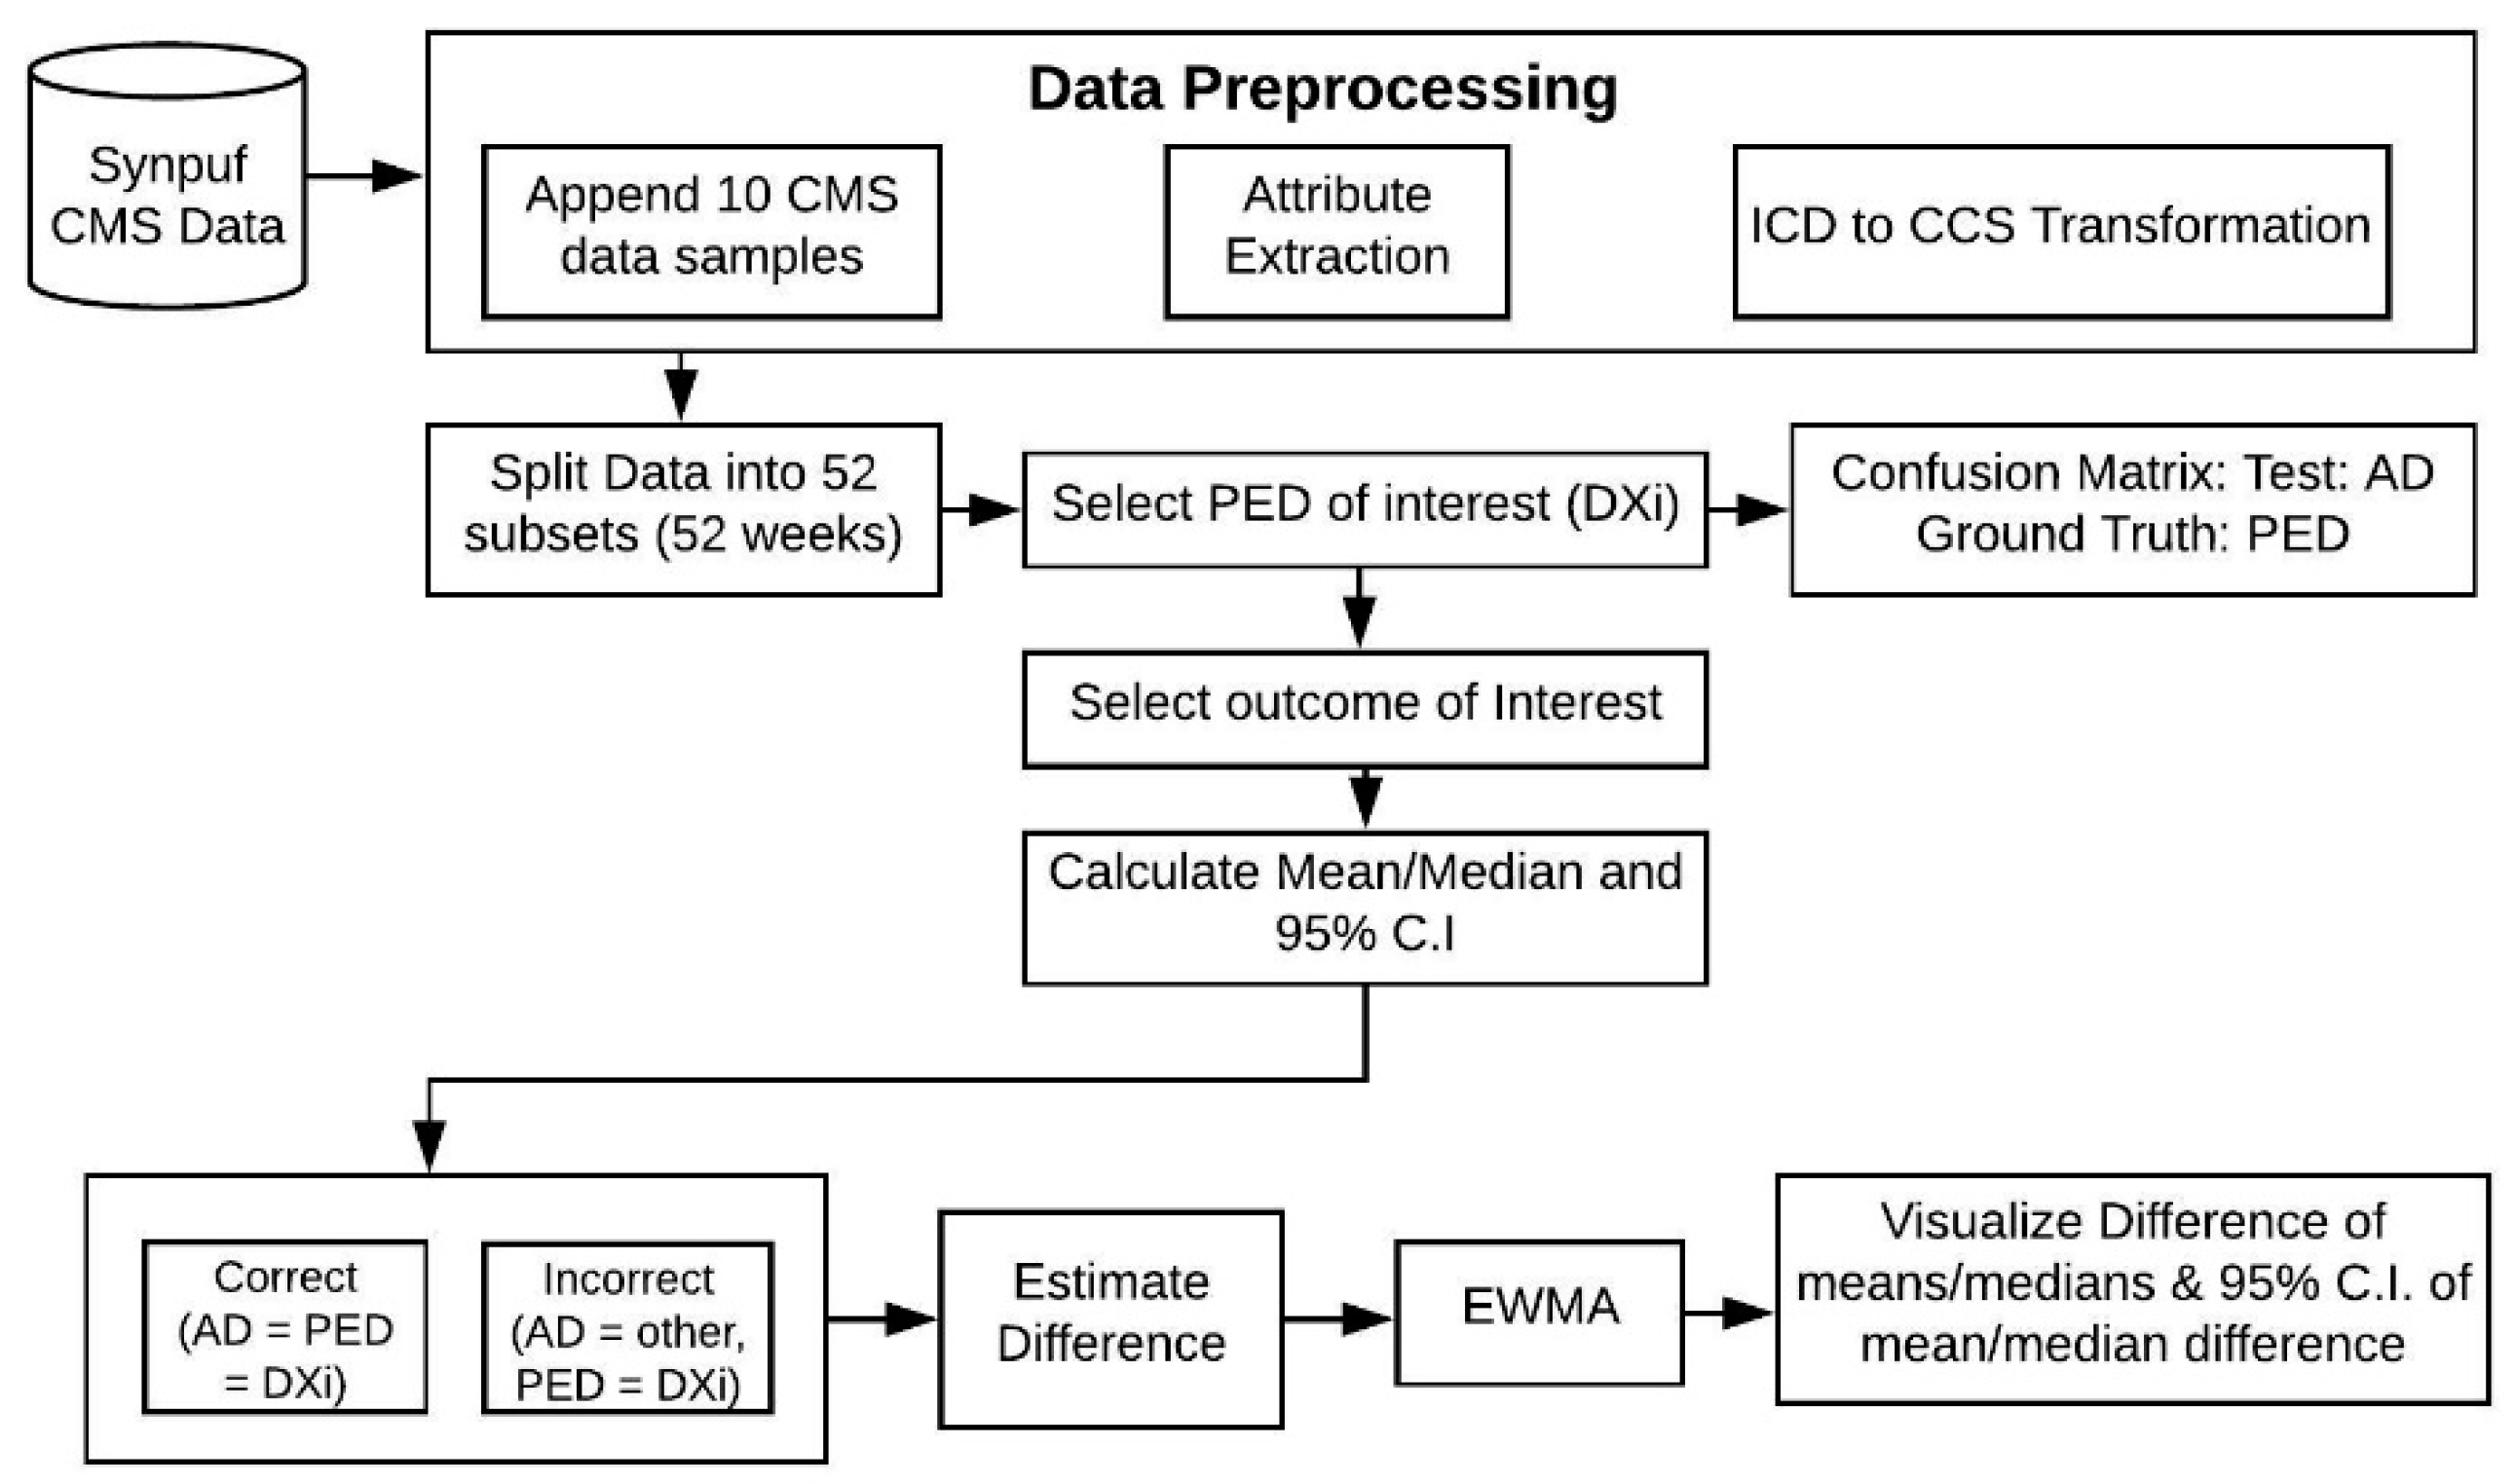
3.2. Methodological Framework

We started by appending the 10 SynPUF data samples; then, we extracted the attributes of interest (Table 1), and finally joined the resulting dataset with CCS codes to group various diseases into one single bucket. By joining with the CCS code set, 3888 different admission Dx codes were grouped under 245 unique CCS categories, whereas 4723 different Principal Exit Dx codes were grouped under 251 unique CCS categories. We then replaced the admission date information with the calendar week, and hence, the data were categorized under 52 different week categories.
Prior to investigating the {AD, PED} discrepancies, we were interested to learn about the frequency of each CCS code during the calendar year, in a temporal manner, per week. The result of Formula (1) is the percent of Principal Exit Diagnosis of pneumonia over the total number of admissions, during week w:
P ( w ) = P ( PED = Pneumonia ) P ( PED i ) × 100
where w is a calendar year week; PED = Principal Exit Diagnosis; P(PEDi) is probability for any PED for week w (total admissions for week w).
The next step involves the calculation for every PED of (i) the number of cases where the AD matches the PED and (ii) the number of cases where the AD and PED mismatch (AD = other, PED = Dx of interest). These calculations were made for the entire year, as well as per week separately. With this information, it now becomes possible to calculate the precision and recall of the admission diagnosis for any PED of interest, and prepare confusion matrices accordingly. Obviously, in our approach, the test variable is the AD, and the ground truth variable is the PED.
Formula (2), below, is the probability for pneumonia to be correctly diagnosed upon admission. Formula (3), on the other hand, is the probability for pneumonia to be incorrectly mislabeled as any other condition during the admission phase. These probabilities are complementary, and inform us “what physicians initially thought while trying to diagnose a later-known patient diagnosis”.
{ P ( AD = Pneumonia   | PED = Pneumonia ) }
{ P ( AD = Other   Diagnosis   | PED = Pneumonia ) }
We then compared the matching versus mismatching {AD, PED} pairs in terms of the length of stay (LOS) and the hospital charges. We calculated, for the hospital charges, the mean and 95% CI of the hospital charges for the matching and the mismatching cases separately. In the case of the LOS, we used a non-parametric approach, and the median instead of the mean, since the LOS does not follow a normal distribution, and is log skewed to the right. For both hospital charges and the LOS, the comparison was made in a temporal manner, for the 52 calendar weeks. Then, we subtracted the two means/medians, in order to find the difference of means/medians and the 95% CI of the difference of means/medians. Formula (4) shows the calculation of the difference for the charges:
Diff = x mismatch x match
where:
x mismatch = 1 n mismatch k = 1 n x k
x match = 1 n match k = 1 n x k
The aforementioned differences were calculated per week, thus generating a temporal dataset of 52 data points per Principal Exit Diagnosis. The final step involves the application of statistical process control (SPC) methods in order to smoothen the temporal data packets and reduce the effect of random spikes on the visualized time series plots. The SPC method that we used is the Exponential Weighted Moving Average (EWMA) algorithm (Formula (5)). While other control charts treat rational subgroups of samples individually, the EWMA chart tracks the exponentially-weighted moving average of all prior sample means. EWMA weights samples in geometrically decreasing order, so that the most recent samples are weighted most highly, while the most distant samples contribute very little. After experimenting with different depth of memory values during our smoothing effort, we decided to use a smoothing factor λ = 0.3, and therefore, the EWMA transformations and time-series plots are generated accordingly:
EWMA i = λ Y t + ( 1 λ ) EWMA t 1 for   t = 1 ,   2 , , n
where EWMA 0 is the mean of historical data (target); Y t is the observation at time t; n is the number of observations to be monitored including EWMA 0 ; and 0 < λ ≤ 1 is a constant that determines the depth of memory of the EWMA.
The difference of the means (e.g., mean LOS for non-matching {AD, PED} minus the mean LOS for matching {AD, PED}) per week were finally used to generate time-series plots. These plots visualize the raw differences, as well as the EWMA-smoothened differences. Figure 1 illustrates and summarizes our replicable methodological framework.

4. Results

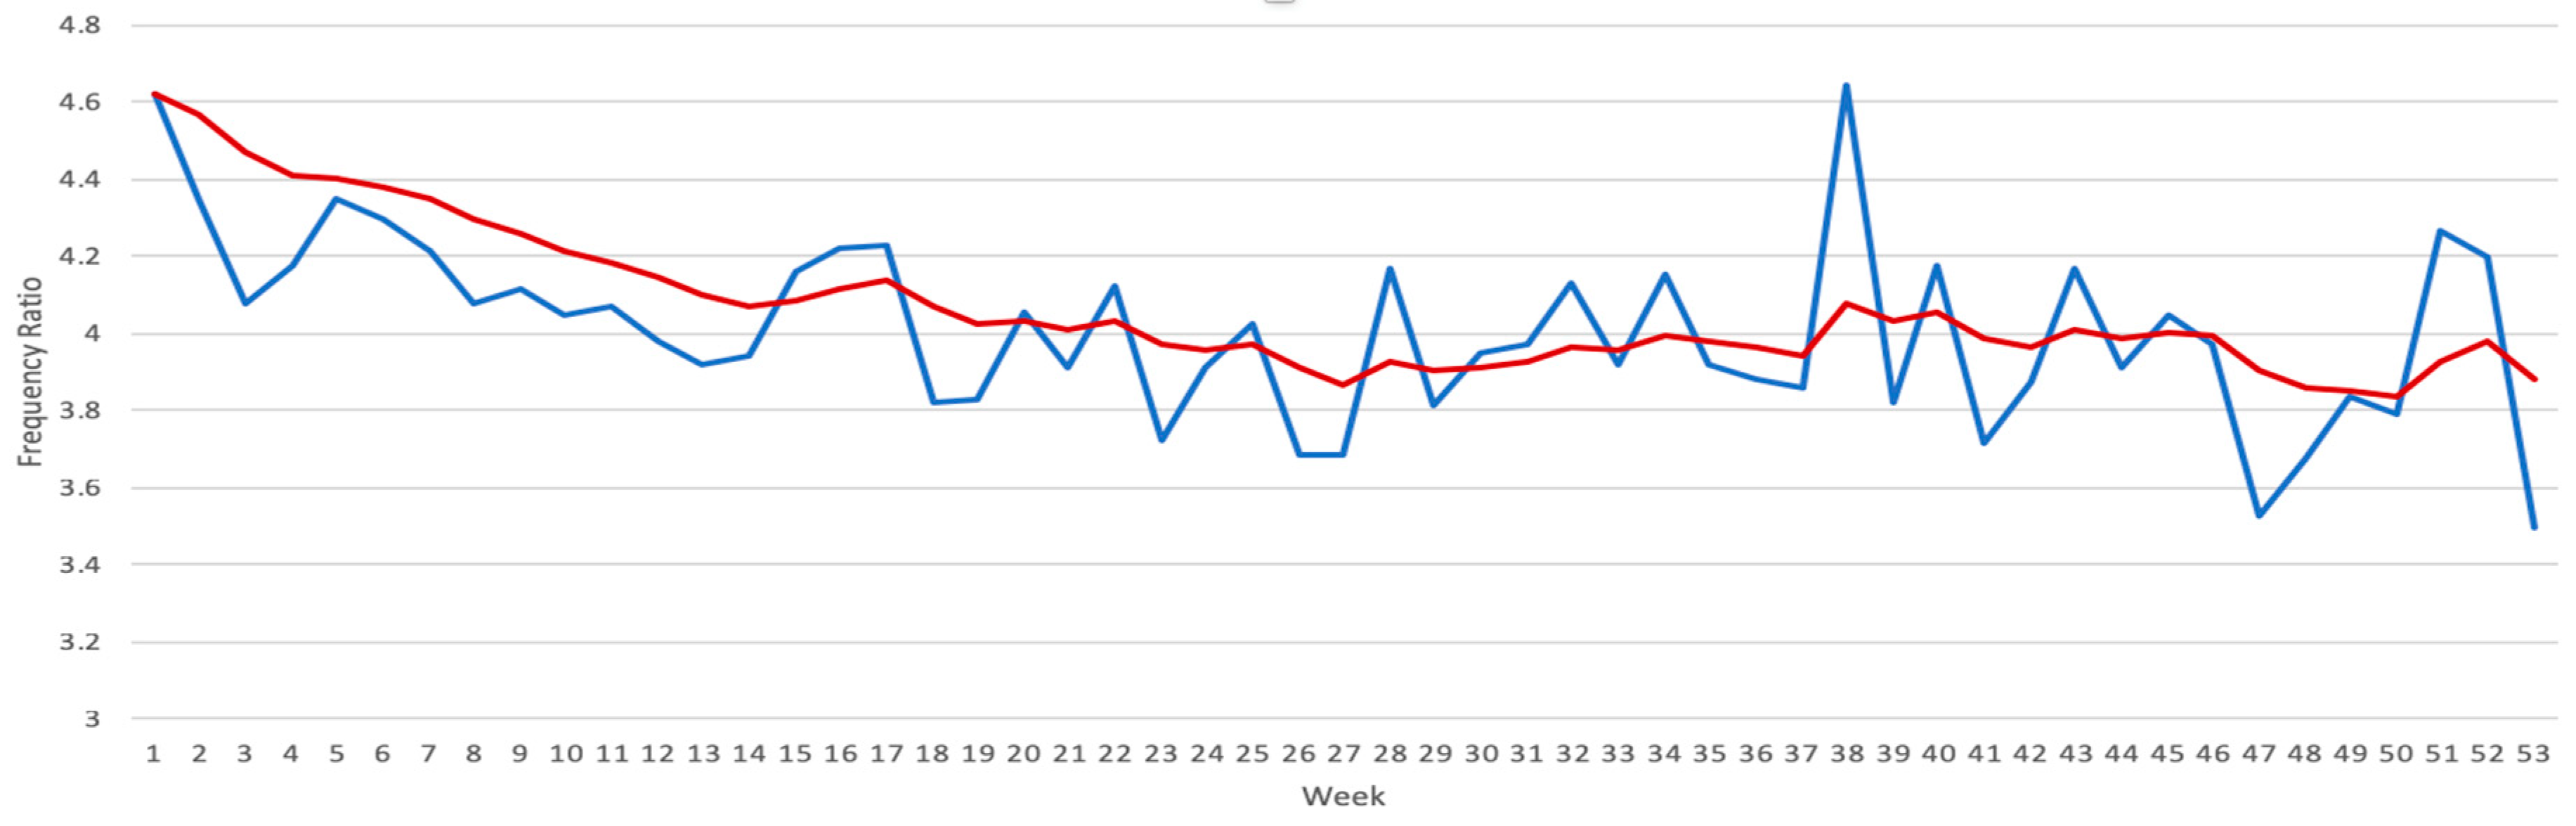
4.1. Seasonal Variations of Disease Frequency

We selected two example diagnoses in order to illustrate our methodology: pneumonia, a respiratory disease with seasonal implications, and aneurysm, a life-threatening condition. The results section presents examples for these two conditions. By using our replicable framework, similar output can be generated for any diagnosis of interest. Below, in Figure 2, pneumonia is visualized to demonstrate the seasonal aspect of this disease. We provide time-series plots of the raw frequency ratio (%) (blue line), and then, we smoothened the time-series plot (red line), using EWMA with a depth of memory λ between 0.2–0.3.
Examining the EWMA line plot (Figure 2), the ratio of pneumonia gradually increases during winter until mid-February (week seven), and then gradually decreases when approaching the summer months. The decrease is especially steady during weeks seven through 14 (mid-February to early April), with a peak low of 3.68% in week 27 (early July). In a similar manner, the frequency of any diagnosis of interest can be visualized to examine disease-specific temporal patterns.

4.2. Mismatch between Admission and Principal Exit Diagnosis

We estimated the percent of mismatch between AD and PED. In order to examine the seasonal aspect of this mismatch, we herein grouped data into four calendar seasons and calculated confusion matrices for each season. Our ground truth is the PED, and we are interested in learning the accuracy of the admitting diagnosis. The average percent of matching {AD, PED} pairs, for all 249 CCS Dx codes was only 21.67%. The 25th quartile of this distribution was 4.54%, the median = 12.5%, and the 75th quartile was found to be 34.96%. Table 2 shows the percent where AD matched the PED for the 20 most frequent PEDs.
We conducted correlation analysis using the Pearson coefficient to examine the relationship between the disease (PED) frequency and the correctness (AD:PED) ratio, and found a statistically significant, moderate to strong positive correlation (R = 0.454, p < 0.001) between these two variables: the higher the frequency of a CCS code, the higher the probability that it is correctly classified on admission.
Table 3 and Table 4 show the confusion matrices and the recall, precision, and F-Score for pneumonia. The precision and recall were both consistent across the four seasons (Recall = 51%, Precision = 59%), with very minor differences. According to results, during admission, half of pneumonia cases are misclassified by physicians as other conditions (recall = 51%). The precision was found to be higher, at 59%; out of 10 admission diagnoses of pneumonia, six were truly pneumonia, according to the PED.
Table 5 and Table 6 show the confusion matrices and the recall, precision, and F-Score for aneurysm. The precision and recall were similar across the four seasons (recall = 39.7% in summer versus 42.7% in winter, precision = 44.6% in summer versus 46.7% in winter). According to results, six out of 10 aneurysm cases are misclassified by physicians as other conditions on admission. The precision was found to be slightly higher: out of 10 admission diagnoses of aneurysm, four to five were truly aneurysm.

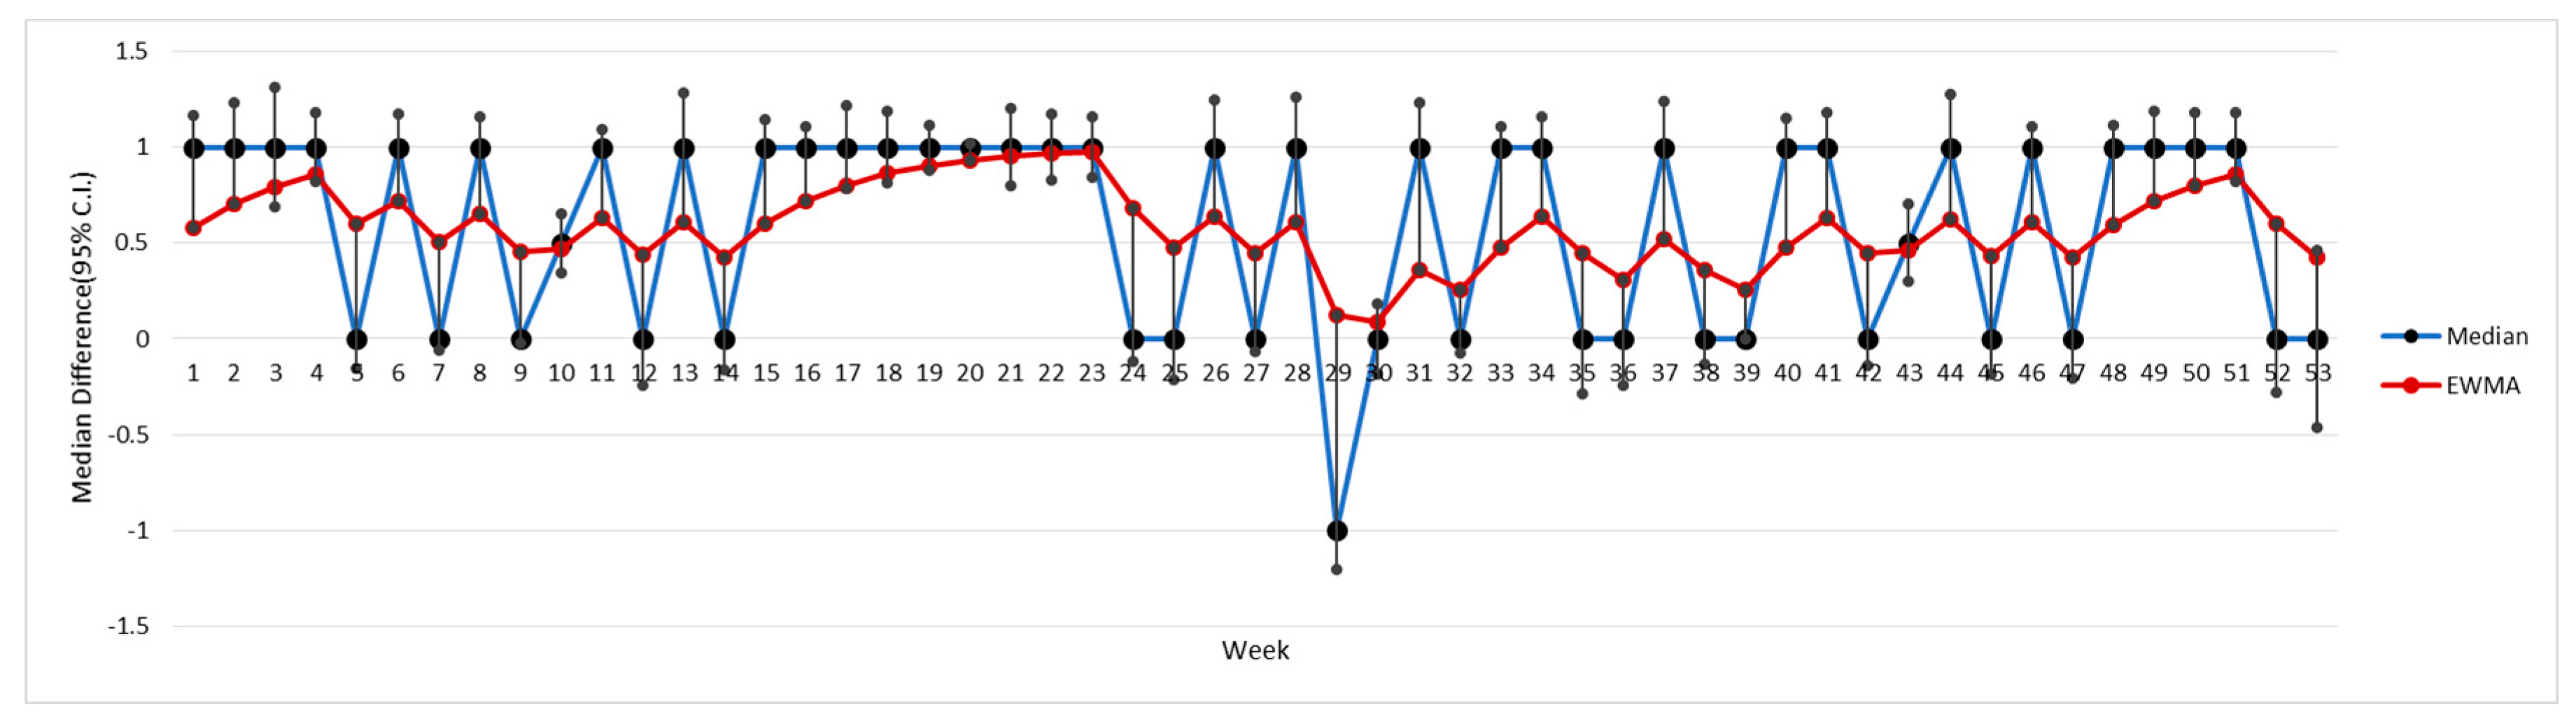
4.3. Seasonal Comparison of LOS between Correct–Incorrect Diagnoses

4.3.1. Example 1: Pneumonia

For each week, two median LOS values were calculated: the median LOS when pneumonia was correctly diagnosed on admission (AD = PED = pneumonia), and the median LOS when pneumonia was misclassified as a different condition on admission (AD = other Dx, PED = pneumonia). The difference of these two medians and the 95% CI of the difference of medians was then estimated and visualized with time-series plots (Figure 3). For all 52 weeks, the LOS difference was positive and varied between 0–1 days. The 95% CI of the difference of medians also remains consistently positive across the entire calendar year. This is a significant difference from the health systems management perspective.

4.3.2. Example 2: Aneurysm

In a similar manner, for each week, two median LOS values were calculated: the median LOS when aneurysm was correctly diagnosed on admission (AD = PED = aneurysm), and the median LOS when aneurysm was misclassified as a different condition of admission (AD = other Dx, PED = aneurysm). The difference of these two medians and the 95% CI of the difference of medians was then estimated and visualized with time-series plots (Figure 4). For the majority of the 52 weeks, the LOS difference was positive, and varied between 0 and four days. The 95% CI of the difference of medians also remained consistently positive during the majority of the weeks. From the time-series plot below, the difference of the LOS medians appears to be gradually higher during early summer and lower during spring.
These interesting fluctuations need to be further examined, so as to gain an understanding how seasonality may have an effect on prolonged hospital stays when health systems fail to detect conditions in a timely manner upon admission.

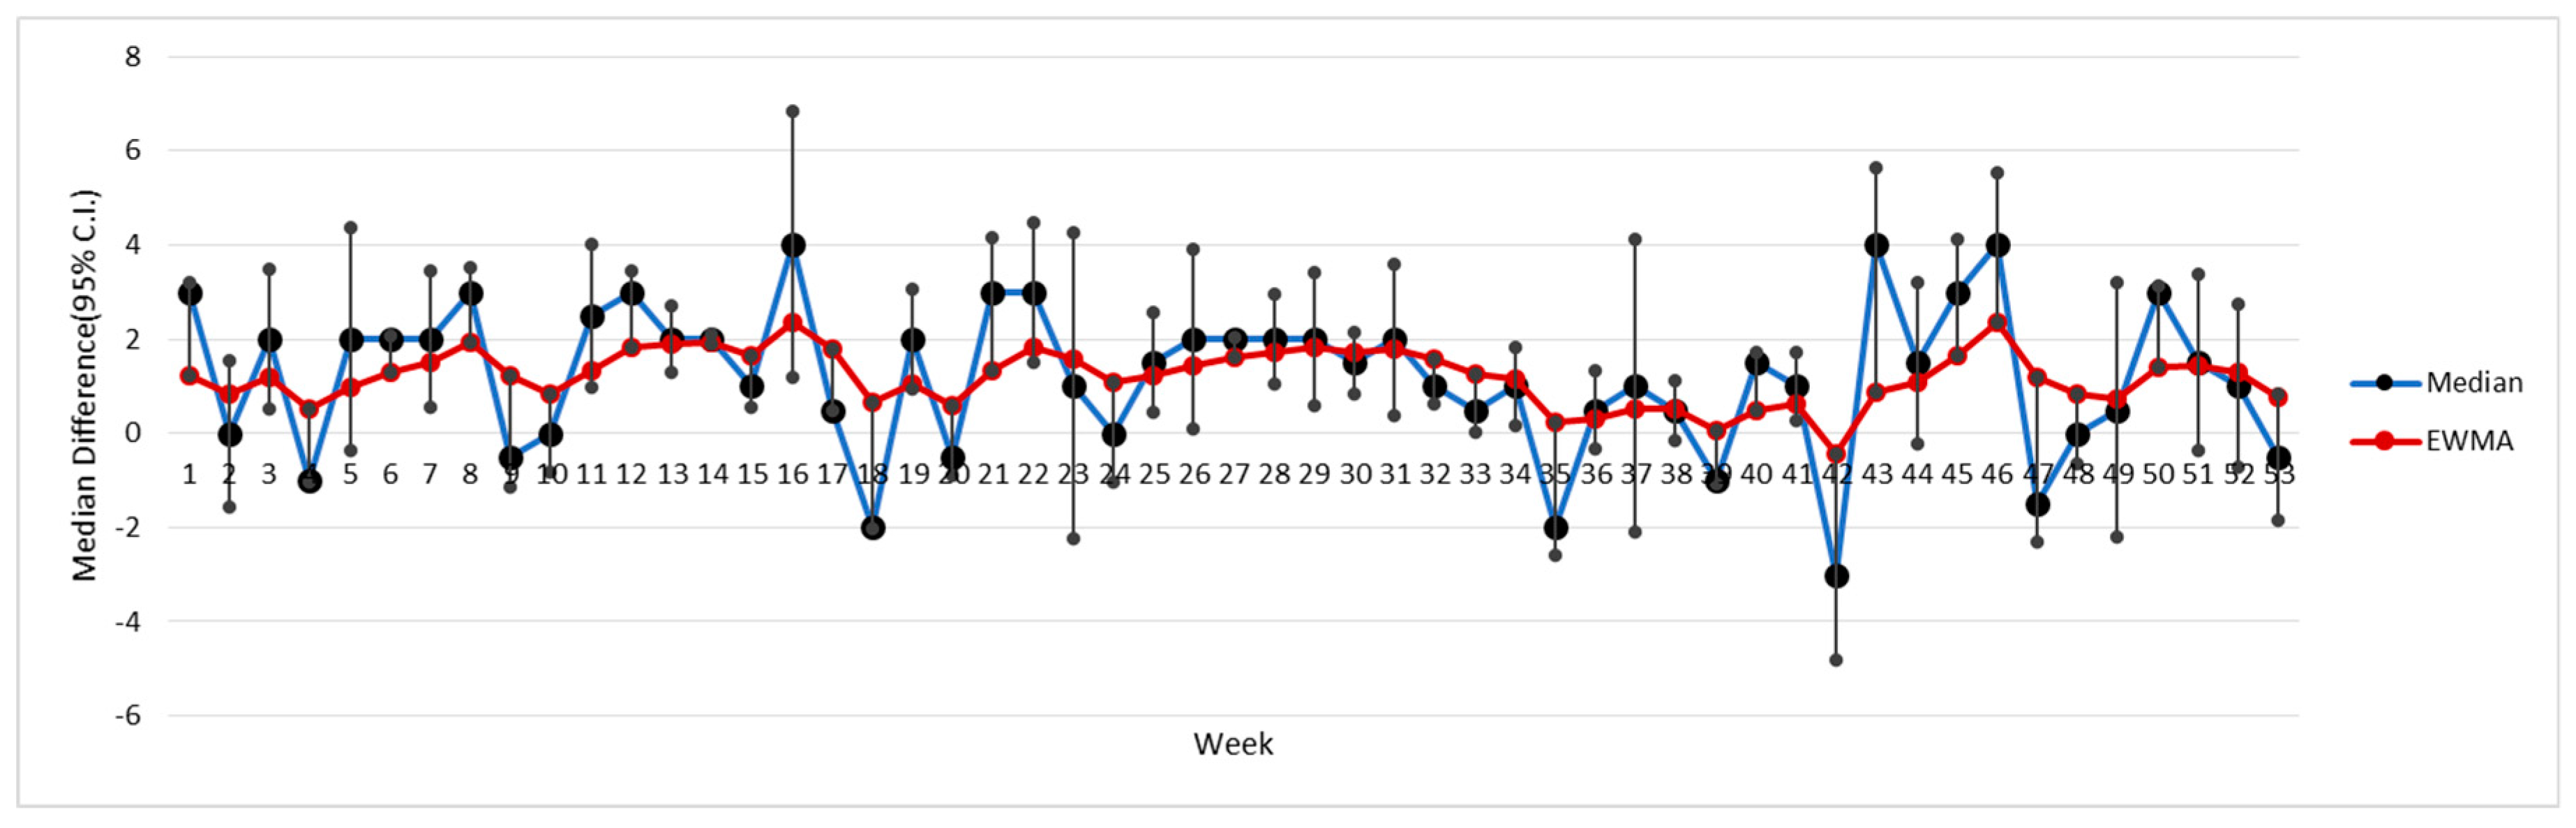
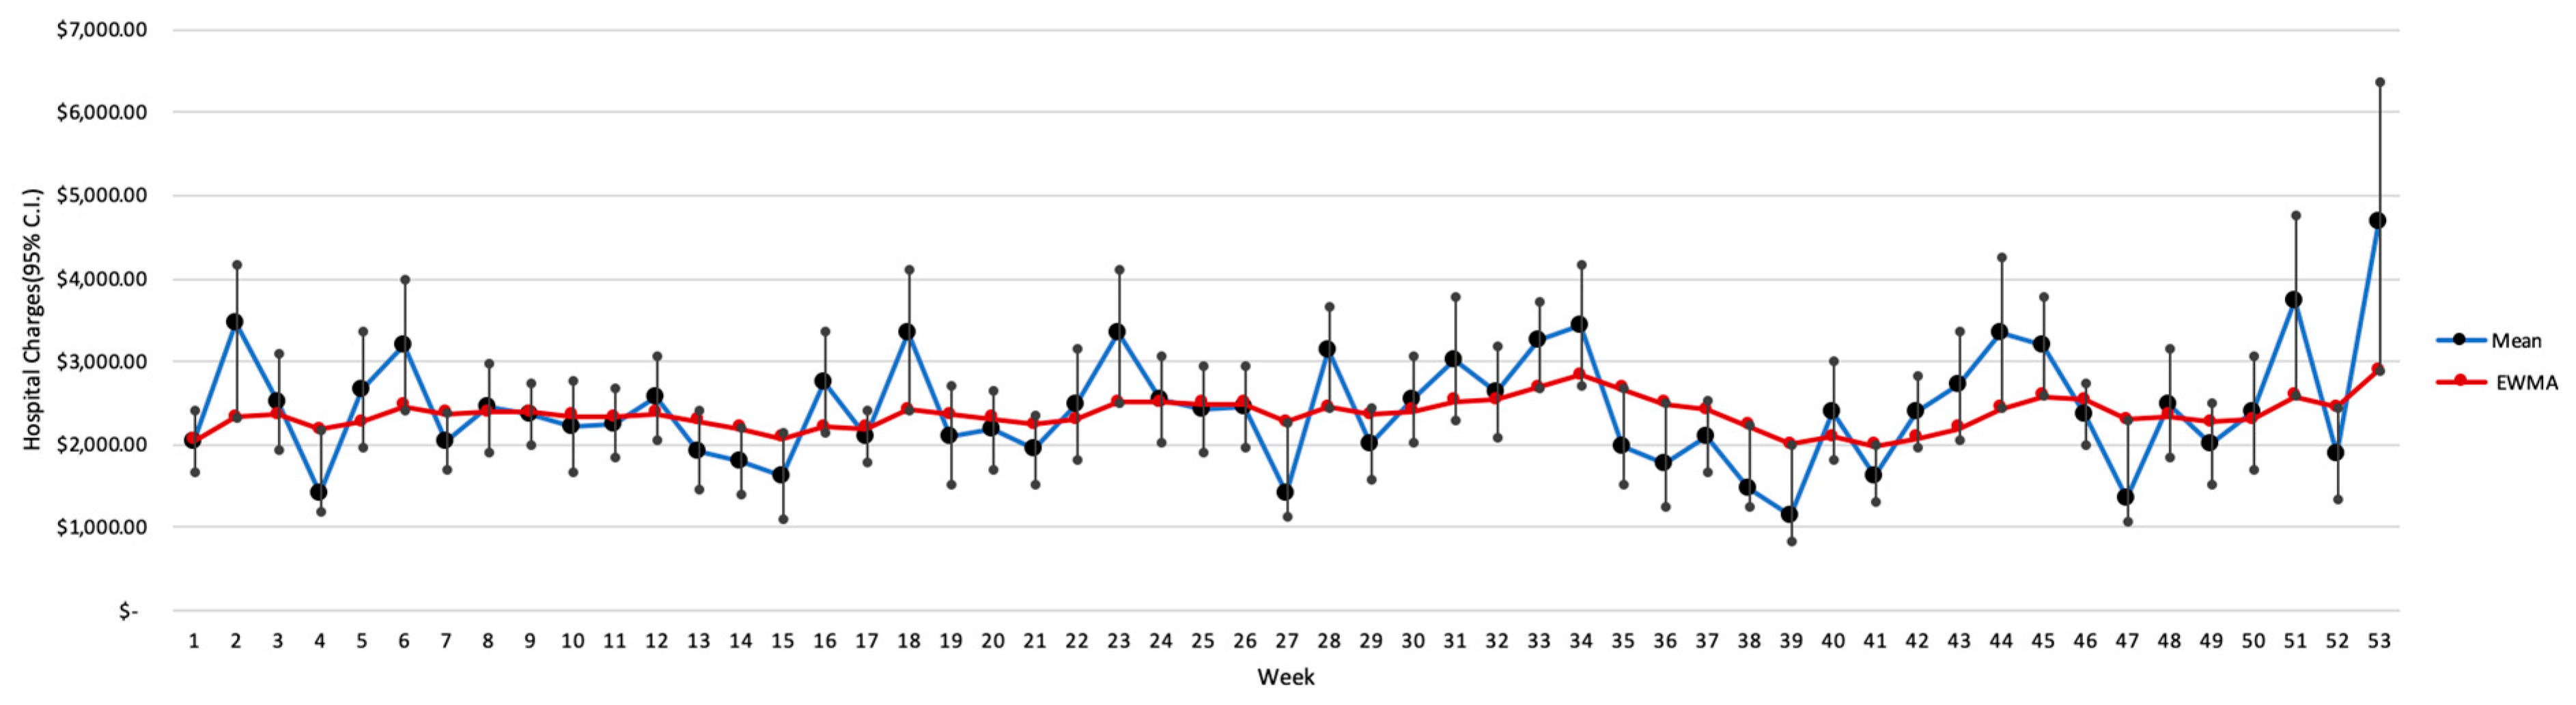
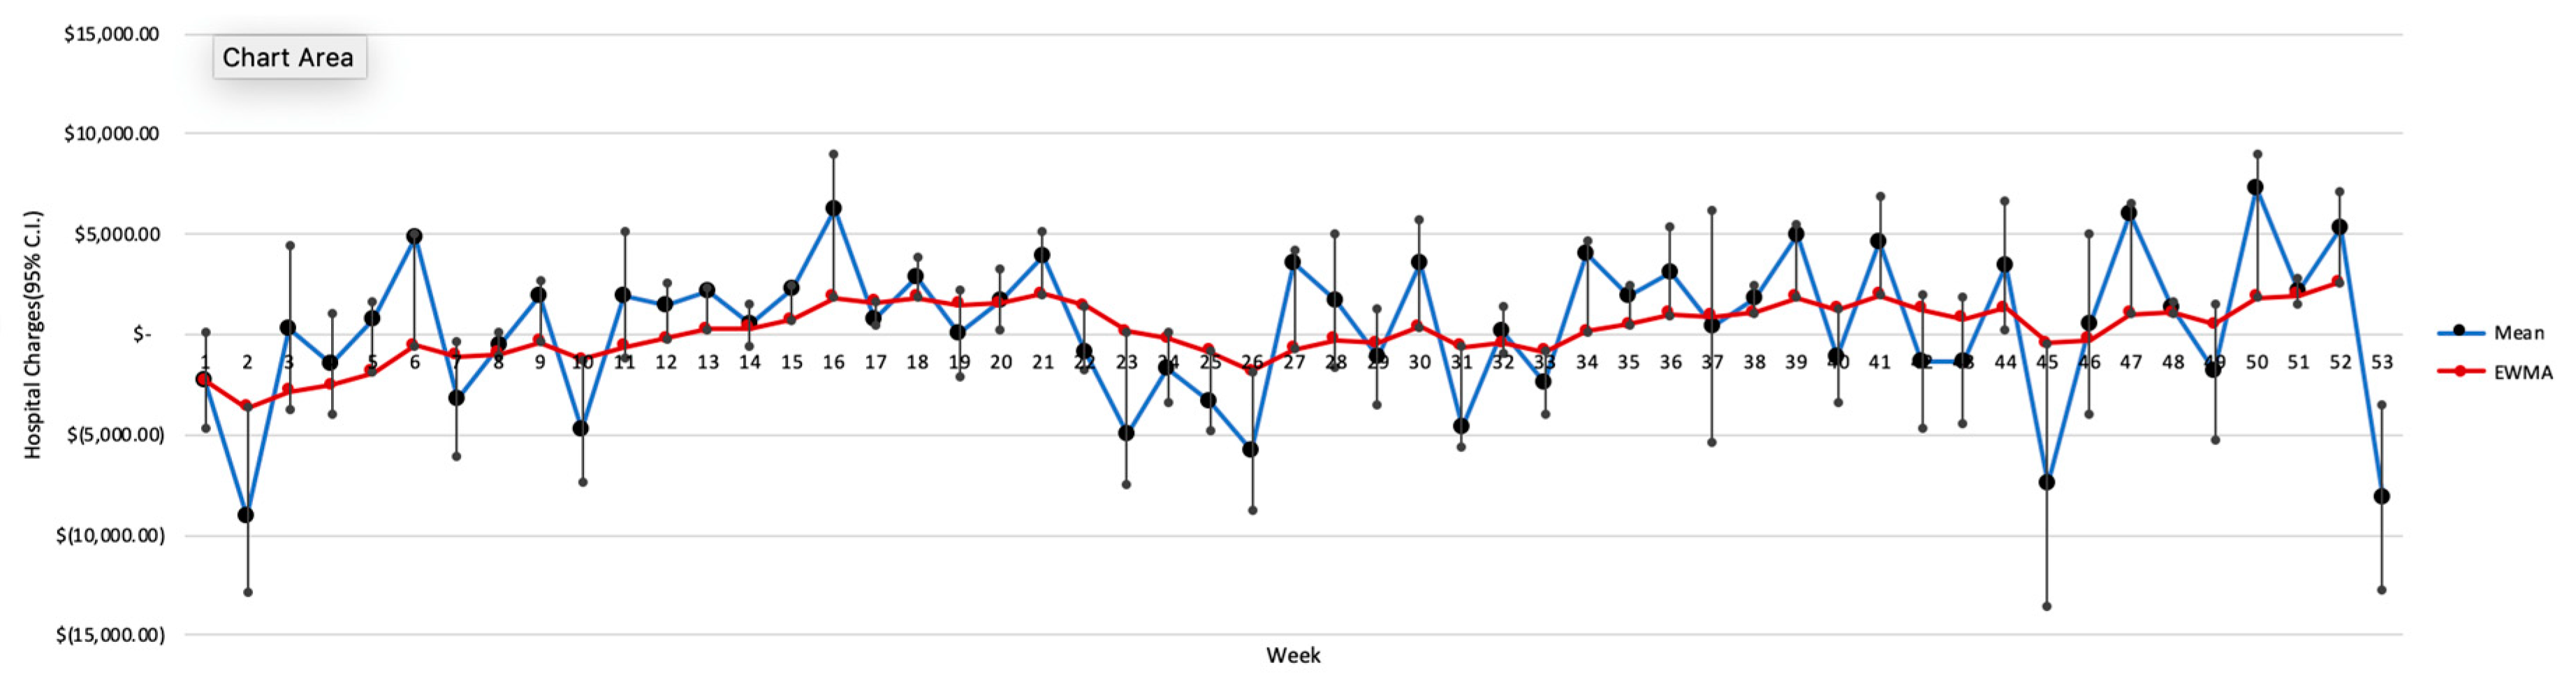
4.4. Seasonal Comparison of Charges between Correct–Incorrect Dxs

4.4.1. Example 1: Pneumonia

For each week, we calculated the mean hospital charges when pneumonia was correctly diagnosed on admission (AD = PED = pneumonia) and the mean hospital charges when pneumonia was misclassified as a different condition of admission (AD = other Dx, PED = pneumonia). The difference of these two means and the 95% CI of the difference of means was then estimated and visualized with time-series plots (Figure 5). For all 52 weeks, the hospital charges difference was positive and varied between $1000–4000. The 95% CI of the difference of means also remained consistently positive across the entire calendar year.

4.4.2. Example 2: Aneurysm

Similarly, for aneurysm, for each week, two mean hospital charges values were calculated: the mean hospital charges when aneurysm was correctly diagnosed on admission (AD = PED = aneurysm) and the mean LOS when aneurysm was misclassified as a different condition of admission (AD = other Dx, PED = aneurysm). The difference of these two means and the 95% CI of the difference of means was then estimated and visualized with time-series plots (Figure 6). In the case of aneurysm, the mean difference was mainly positive, although not consistently. The lower count of aneurysm cases per week results in wider 95% CI ranges.

5. Discussion

This research presented a methodological framework to quantify and visualize, using time-series plots, the admission and discharge diagnosis discrepancies for Medicare patients. This approach examines the uncertainty of diagnostic decisions during the admission phase. Due to the seasonality of a number of conditions (such as respiratory ones), we hypothesized that clinical decision makers face challenges in recognizing those conditions during different calendar year periods. Additionally, our approach examines the temporal relationship between outcomes of care and the correct identification of a Dx on admission. By examining these differences, we can shed light on the temporal patterns of these discrepancies and their burden on the cost and quality of care. We presented examples for two important health systems parameters: hospital charges and length of stay.
Our results show that only the 21.67% of cases are identified correctly on admission, while there is a moderate to strong correlation between the frequency of the final diagnosis and the aforementioned ratio. Clinical decision makers do not correctly recognize uncommon and rare conditions early on admission. This finding needs to be further investigated to examine whether this is an inherent problem with rare diseases (difficulty of differentially diagnosing them) or whether it holds implications regarding the degree of preparedness of the health systems to detect rare and uncommon conditions. Additionally, further examination is needed to see if the observed correlation is simply due to the uneven number of cases grouped together during the CCS binning. Our methodology is anticipated to be useful for health systems to understand these discrepancies for any condition of interest, and for any outcome of interest, contingent to data availability. In addition, time-series plots provide insights about seasonal trends and patterns that may need to be examined case-by-case in a more focused manner. As our examples indicate, discrepancies have an effect on the cost of care and the LOS, while they often show interesting patterns over the course of the year, and have variable effects on clinical outcomes.
The presented methodological framework, and our examples, not only add to existing knowledge that there are discrepancies between admission and discharge Dxs, they also provide insights on the seasonal aspects of these discrepancies as far as outcomes and cost of care are concerned. Physicians at hospitals are typically the ones who assign admission diagnoses. Themselves, as well as hospital administrators and hospital quality committees, should be aware that the correct Dx identification on admission holds significant cost and quality implications. The authors believe that admission diagnosis verification systems should be included in the functionality of future implementations of clinical decision support systems. Those systems can integrate discrepancy-specific differential diagnosis information [18]. For instance, physicians who select an admission Dx code that often leads to a different Principal Exit Dx, would be presented with differential diagnosis resources that would pinpoint to aspects of care that may be further examined. These resources can include: (i) adjusted probabilities for other candidate diagnoses that appear more frequently in historical data, (ii) differential diagnosis criteria, and (iii) links to knowledge resources that are tailored to the specific diagnostic problem.

6. Limitations

Our work did not include confounding factors such as the geography of hospitalization, the beneficiary characteristics, or hospital structural attributes. Our objective was to describe and visualize discrepancies and their bivariate association with the hospital length of stay and hospital charges. Therefore, the associations presented in this manuscript, do not necessarily mean causation, as there are several confounders that need to be corrected for. Therefore, in the light of results reported here, further studies are required in order to validate these findings. We also acknowledge that these discrepancies differ in terms of the admission-discharge similarity and the level of risk from a delayed diagnosis. For these reasons, we studied discrepancies after having binned the ICD-9-CM codes into broader Clinical Classification Software (CCS) codes by using ICD to CCS Conversion table mentioned in Supplementary Materials section. With this grouping, we are more confident that a mismatching admission and discharge Dx is a real mismatch. The trade-off for this grouping is lost information due to binning, but this is an inherent problem for any research that utilizes diagnostic binning.
Finally, while SynPUF data simulate the patterns of the real data, its inference value is comparatively lower compared to the real claims data. Future research and the extension of this work will need to be based on recent purchased medical claims data. With such data, additionally, it will be possible to examine seasonal variations state by state; the frequency of various conditions varies in different climates. For instance, the propagation of flu, a seasonal respiratory disease, is different in the east versus the west coast during the flu season.

7. Conclusions

Hospitals need to prioritize conducting cost-benefit analyses to consider investing in more thorough initial patient assessment systems and process flows. Investment considerations may include the recruitment of specialty physicians for teleconsultation during the initial patient assessment [19,20], and the purchase of new diagnostic equipment to improve the diagnostic accuracy. Continuing professional development and medical education and training should be factored in during these efforts. Finally, the authors believe that the integration of differential diagnosis protocols and verification systems to existing electronic health records and the utilization of healthcare analytics [21] that model a multitude of patient attributes to provide assistive diagnosis would contribute to an improved initial diagnosis accuracy.

Supplementary Materials

The following are available online at https://www.mdpi.com/2227-7080/6/4/111/s1.

Author Contributions

D.Z. co-supervised the project completion and wrote significant portion of the paper and completed data preparation. A.S. prepared the code for the data analysis and contributed to paper edits. L.F. supervised the project completion.

Funding

This research received no external funding.

Conflicts of Interest

The authors declare no conflict of interest.

References

  1. Simpao, A.F.; Ahumada, L.M.; Rehman, M.A. Big data and visual analytics in anaesthesia and health care. Br. J. Anaesth. 2015, 115, 350–356. [Google Scholar] [CrossRef] [PubMed]
  2. Raghupathi, W.; Raghupathi, V. Big data analytics in healthcare: Promise and potential. Health Inf. Sci. Syst. 2014, 2, 3. [Google Scholar] [CrossRef] [PubMed]
  3. Kucharska-Newton, A.M.; Heiss, G.; Ni, H.; Stearns, S.C.; Puccinelli-Ortega, N.; Wruck, L.M.; Chambless, L. Identification of Heart Failure Events in Medicare Claims: The Atherosclerosis Risk in Communities (ARIC) Study. J. Card. Fail. 2016, 22, 48–55. [Google Scholar] [CrossRef] [PubMed] [Green Version]
  4. Estep, J.D.; Starling, R.C.; Horstmanshof, D.A.; Milano, C.A.; Selzman, C.H.; Shah, K.B.; Loebe, M.; Moazami, N.; Long, J.W.; Stehlik, J.; et al. ROADMAP Study Investigators Risk Assessment and Comparative Effectiveness of Left Ventricular Assist Device and Medical Management in Ambulatory Heart Failure Patients: Results from the ROADMAP Study. J. Am. Coll. Cardiol. 2015, 66, 1747–1761. [Google Scholar] [CrossRef] [PubMed]
  5. Rostomyan, L.; Daly, A.F.; Petrossians, P.; Nachev, E.; Lila, A.R.; Lecoq, A.-L.; Lecumberri, B.; Trivellin, G.; Salvatori, R.; Moraitis, A.G.; et al. Clinical and genetic characterization of pituitary gigantism: An international collaborative study in 208 patients. Endocr. Relat. Cancer 2015, 22, 745–757. [Google Scholar] [CrossRef] [PubMed]
  6. Fry, D.E.; Pine, M.; Nedza, S.M.; Locke, D.G.; Reband, A.M.; Pine, G. Risk-adjusted outcomes in Medicare inpatient nephrectomy patients. Medicine (Baltimore) 2016, 95, e4784. [Google Scholar] [CrossRef] [PubMed] [Green Version]
  7. Diagnosis Discrepancies and LOS|Journal of Hospital Medicine. Available online: https://www.journalofhospitalmedicine.com/jhospmed/article/127663/diagnosis-discrepancies-and-los (accessed on 2 November 2018).
  8. Leske, M.C.; Sorensen, A.A.; Zimmer, J.G. Discrepancies between admission and discharge diagnoses in a university hospital. Med. Care 1978, 16, 740–748. [Google Scholar] [CrossRef] [PubMed]
  9. Austin, P.C.; Daly, P.A.; Tu, J.V. A multicenter study of the coding accuracy of hospital discharge administrative data for patients admitted to cardiac care units in Ontario. Am. Heart J. 2002, 144, 290–296. [Google Scholar] [CrossRef] [PubMed]
  10. Maude, J. Differential diagnosis: The key to reducing diagnosis error, measuring diagnosis and a mechanism to reduce healthcare costs. Diagnosis 2014, 1, 107–109. [Google Scholar] [CrossRef] [PubMed]
  11. Feldman, M.J.; Hoffer, E.P.; Barnett, G.O.; Kim, R.J.; Famiglietti, K.T.; Chueh, H.C. Impact of a computer-based diagnostic decision support tool on the differential diagnoses of medicine residents. J. Grad. Med. Educ. 2012, 4, 227–231. [Google Scholar] [CrossRef] [PubMed]
  12. Shrestha, A.; Fegaras, L.; Zikos, D. Temporal Modification of Apriori to Find Seasonal Variations Between Symptoms and Diagnoses. In Proceedings of the 11th PErvasive Technologies Related to Assistive Environments Conference, PETRA’18, Corfu, Greece, 26–29 June 2018; ACM: New York, NY, USA, 2018; pp. 490–494. [Google Scholar]
  13. Healthcare Cost and Utilization Project. Clinical Classifications Software (CCS) for ICD-9-CM. Available online: https://www.hcup-us.ahrq.gov/toolssoftware/ccs/ccs.jsp (accessed on 1 November 2018).
  14. Johnson, T.; McNutt, R.; Odwanzy, R.; Patel, D.; Baker, S. Discrepancy between admission and discharge diagnoses as a predictor of hospital length of stay. J. Hosp. Med. 2009, 4, 234–239. [Google Scholar] [CrossRef] [PubMed]
  15. World Health Organization. World Health Organization International Classification of Diseases: 9th Revision, Basic Tabulation List with Alphabetic Index; World Health Organization: Geneva, Switzerland, 1978. [Google Scholar]
  16. UMLS Metathesaurus—CCS (Clinical Classifications Software)—Synopsis. Available online: https://www.nlm.nih.gov/research/umls/sourcereleasedocs/current/CCS/ (accessed on 2 November 2018).
  17. Centers for Medicare and Medicaid Services (CMS) Linkable 2008–2010 Medicare Data Entrepreneurs’ Synthetic Public Use File (DE-SynPUF). Available online: https://www.cms.gov/Research-Statistics-Data-and-Systems/Downloadable-Public-Use-Files/SynPUFs/DE_Syn_PUF.html (accessed on 1 November 2018).
  18. Aggarwal, R.; Ringold, S.; Khanna, D.; Neogi, T.; Johnson, S.R.; Miller, A.; Brunner, H.I.; Ogawa, R.; Felson, D.; Ogdie, A.; et al. Distinctions Between Diagnostic and Classification Criteria? Arthritis Care Res. (Hoboken) 2015, 67, 891–897. [Google Scholar] [CrossRef] [PubMed]
  19. Sorknaes, A.D.; Madsen, H.; Hallas, J.; Jest, P.; Hansen-Nord, M. Nurse tele-consultations with discharged COPD patients reduce early readmissions—An interventional study. Clin. Respir. J. 2011, 5, 26–34. [Google Scholar] [CrossRef] [PubMed]
  20. Müller, K.I.; Alstadhaug, K.B.; Bekkelund, S.I. Acceptability, Feasibility, and Cost of Telemedicine for Nonacute Headaches: A Randomized Study Comparing Video and Traditional Consultations. J. Med. Internet Res. 2016, 18, e140. [Google Scholar] [CrossRef] [PubMed]
  21. Sakhnini, A.; Saliba, W.; Schwartz, N.; Bisharat, N. The derivation and validation of a simple model for predicting in-hospital mortality of acutely admitted patients to internal medicine wards. Medicine (Baltimore) 2017, 96, e7284. [Google Scholar] [CrossRef] [PubMed]
Figure 1. Overview of the methodological framework.
Technologies 06 00111 g001
Figure 2. Proportion of patients with pneumonia over total admissions.
Technologies 06 00111 g002
Figure 3. LOS difference of medians and 95% CI between correct and incorrect Dx of pneumonia on admission.
Technologies 06 00111 g003
Figure 4. LOS difference of median and 95% CI between correct and incorrect Dx’s of aneurysm on admission.
Technologies 06 00111 g004
Figure 5. Hospital charges difference of means and 95% CI between correct and incorrect Dx of pneumonia.
Technologies 06 00111 g005
Figure 6. Hospital charges difference of means and 95% CI between correct and incorrect Dx‘s of aneurysm.
Technologies 06 00111 g006
Table 1. Attributes used in this study. ICD: International Classification of Diseases.
SynPUF AttributeDescriptionComments
Admitting ICD-9 Diagnosis CodeInitial Dx code on the institutional claim indicating the beneficiary’s initial diagnosis at the time of admission, before any further patient investigation took placeReferred to as AD
(Admission Diagnosis)
ICD-9 Diagnosis Code 1The beneficiary’s principal exit diagnosis. It typically represents the health problem that caused the need for hospitalization. This attribute is our ground truthReferred to as PED
(Principal Exit Diagnosis)
Claims Admission DateThe date the beneficiary was admitted to the hospital or skilled nursing facilityTo calculate the length of stay
(LOS, based on the discharge-admission dates)
Beneficiary Discharge DateThe date when the patient was discharged from the hospital
Claim Payment AmountThe amount of payment made from the Medicare trust fund for the services covered by the claim recordThe amount (USD) associated with the diagnostic-related groups
Description of all SynPUF attributes can be found in the CodeBook as mentioned in the Supplementary Materials section.
Table 2. Correct diagnosis % (admission = discharge Dx), for the 20 most frequent Clinical Classification Software (CCS) Principal Exit Diagnoses.
Discharge DxNP (AD = PED)Discharge DxNP (AD = PED)
Congestive heart failure32,36747.13Acute Cardiovasc.14,41948.36
Pneumonia29,61952.20Fluid/electrolytes Dx12,78445.43
Osteoarthrosis23,87072.26Respiratory failure12,45843.30
Dysrhythmia23,00756.52Hip fracture12,31644.85
Chronic Obstr. Pulm. Disease20,68045.18Acute renal failure12,05136.32
Coronary atheromatosis19,06427.04Back problem11,20774.82
Rehabilitation17,32482.87Chest pain11,17081.34
Medical Device Compl.16,52625.09Skin infection10,22068.80
Urinary Tract Infection16,38645.45Gastroint. hemorr.975071.74
Acute Myocard. Infraction16,21423.84Mood disorders961340.27
Table 3. Confusion matrices for the admission → discharge discrepancies of pneumonia.
SpringPrincipal Exit DXFallPrincipal Exit DX
PneumoniaOther PneumoniaOther
Admission DXPneumonia43172912Admission DXPneumonia33992356
Other Dx398917,3046Other Dx3161140,855
SummerPrincipal Exit DXWinterPrincipal Exit Dx
PneumoniaOtherPneumoniaOther
Admission DXPneumonia39302715Admission DXPneumonia38162587
Other Dx3771163,843Other Dx3547147,968
Table 4. Recall, precision and F-Score of the admission diagnosis for pneumonia.
SpringSummerFallWinter
Recall [TP/(TP + FN)]0.51970.51030.51810.5183
Precision [TP/(TP + FP)]0.59720.59140.59060.5960
F-Score [2TP/(2TP + FP + FN)]0.55580.54790.55200.5544
Table 5. Confusion matrices for the admission → discharge discrepancies of aneurysm.
SpringPrincipal Exit DXFallPrincipal Exit DX
AneurysmOther AneurysmOther
Admission DXAneurysm325396Admission DXAneurysm229275
Other Dx447183,096Other Dx347148,920
SummerPrincipal Exit DXWinterPrincipal Exit Dx
AneurysmOtherAneurysmOther
Admission DXAneurysm274340Admission DXAneurysm266304
Other Dx415173,230Other Dx356156,992
Table 6. Recall, precision and F-Score of the admission diagnosis for aneurysm.
SpringSummerFallWinter
Recall [TP/(TP + FN)]0.42100.39770.39760.4277
Precision [TP/(TP + FP)]0.45080.44630.45440.4667
F-Score [2TP/(2TP + FP + FN)]0.43540.42060.42410.4463

