
A Fractional Order Model to Study the Effectiveness of Government Measures and Public Behaviours in COVID-19 Pandemic


1
Department of Mathematics, Indian Institute of Engineering Science and Technology, Shibpur, Howrah 711103, India
2
Institute of Research and Development of Processes, University of the Basque Country, 48940 Leioa, Spain
*
Author to whom correspondence should be addressed.
Mathematics 2022, 10(16), 3020; https://doi.org/10.3390/math10163020
Submission received: 26 July 2022
/
Revised: 17 August 2022
/
Accepted: 19 August 2022
/
Published: 22 August 2022
(This article belongs to the Special Issue Mathematical and Computational Methods in Systems Biology)
Abstract
:In this work, we emphasise the dynamical study of spreading COVID-19 in Bangladesh. Considering the uncertainty caused by the limited coronavirus (COVID-19) information, we have taken the modified Susceptible-Asymptomatic-Infectious-Hospitalised-Recovered (SAIHR) compartmental model in a Caputo fractional order system. We have also introduced public behavioural and government policy dynamics in our model. The dynamical nature of the solutions of the system is analysed and we have also calculated the sensitivity index of different parameters. It has been observed that public behaviour and government measures play an important role in controlling the pandemic situation. The government measures (social distance, vaccination, hospitalisation, awareness programme) are more helpful than only public responses to the eradication of the COVID-19 pandemic.
Keywords:
Caputo fractional differential equation; COVID-19; SAIHR compartmental model; stability; sensitivity indexMSC:
9208; 26A33; 37C751. Introduction
Severe Acute Respiratory Syndrome Coronavirus 2 (SARS-CoV-2) is the infectious agent that causes Coronavirus Disease 2019 (COVID-19), which was initially discovered in China in early December 2019. Since then, it has spread worldwide, destroying the health, economy, and lives of billions of people. This has made it clear how important it is to accurately represent infectious illnesses. In reality, statistical studies are generally based on nonlinear mathematical models, which deal with epidemiology, and mostly determine worldwide government policies.
The COVID-19 pandemic was first confirmed in Bangladesh on 8 March 2020. The Health and Family Welfare department, Government of the People’s Republic of Bangladesh, has confirmed a total of 1,962,213 COVID-19 positive cases and 29,135 deaths from 3 January 2022 to 23 June 2022 [1]. A total of 274,923,522 vaccine doses have been administrated. The government of Bangladesh took actions, such as social distancing, mask-wearing, travelling restrictions, lockdowns, vaccination, and hospitalisation, to control the COVID-19 situation [2].
Fractional calculus is a parallel branch of calculus that cannot be considered a generalised version of integer order calculus [3,4]. Fractional order systems are more appropriate than integer order systems in many fields and can express phenomena that are linked to memory and affected by hereditary properties [5,6]. In endemic and epidemic areas, people’s awareness of infection will reduce the rate of contact between various compartments, such as between humans and mosquitoes in the dengue SIR-SI model [7], whereas in the epidemic model with vaccination, people who have received vaccinations have a stronger tendency to be aware of previous epidemics than people who are susceptible. In order for specialists to gain the most knowledge from the available data before making major judgments, there should be a systematic way to combine the models and observations. This overview refers to some obstacles in these models and looks at some intriguing approaches focusing on the development of general structures for such models, and proposes an alternative approach, namely fractional calculus, whose main contrast to integer order models is where such effects are overlooked or difficult to integrate. The fractional derivative formalism of epidemic models provides a useful tool for incorporating memory and hereditary features of systems. Furthermore, the fractional models have one more degree of freedom than the integer order model for fitting data. Examining numerous papers on fractional epidemic models and count models based on dynamics with fractional order derivatives, we have proposed several mathematical models on epidemiology and suggest that developing numerical tools for fitting mathematical models to actual data will assist concerned authorities in avoiding or control infectious disease outbreaks. Aside from these benefits, there are some drawbacks to using the Caputo fractional system.
- Finding analytical solutions is difficult for Caputo differential systems.
- There are many concepts, such as bifurcation theory, parametric optimisation, persistence, etc., that have not yet been developed for Caputo fractional order systems.
- The numerical algorithms for delayed systems and stochastic fractional systems have not yet been developed.
Considering all of the above facts, we have constructed our model in the Caputo differential framework. In this context, the works of Das et al. [8] and Das and Samanta [9,10,11] on fractional order dynamics may be mentioned. Significant contributions have recently been made by several researchers to the various COVID-19 models in both integer and fractional order systems [12,13,14,15,16,17,18].
Fractional order modelling is a useful approach for studying the nature of diseases because it is an extension of the integer-order derivative. The fractional order system also adds an extra parameter that can be used to improve numerical simulations. In this model, we have considered a new infection function that includes the strength of the government action and the strength of public response. This infection function has not yet been used in previous works of fractional order systems. We have also studied the public response to the spreading of COVID-19 disease. Our main objective is to study the effect of public behaviour and governmental measures on disease spreading. We have modified the contemporary SAIHR model by constructing a new infection function and introducing a new state variable depicting social behavioural dynamics of public awareness. There are several models on COVID-19, but our model is truly different from the others and may answer new queries. We have taken Caputo fractional derivative because the proposed system is autonomous in nature, which has been made physically meaningful by dimensional homogeneity among the fractional order Caputo derivatives and the parameters used in the system. The Caputo system can be simulated easily using Adams devised technique (FDE12) for finding approximate solutions of fractional Caputo ordinary differential equations.
In this work, a modified SAIHR model is formulated emphasising how the government measures and public behaviour control the disease spread. Section 2 contains the proposed model on COVID-19 with non-negative initial conditions. Section 3 describes the dynamical nature of solutions in two different scenarios. Section 4 deals with the sensitivity indices of different parameters. Section 5 shows numerical evidence of the dynamical nature of the proposed model supporting analytical results. The work ends with a brief conclusion.
2. Model Construction
A five compartmental model under a Caputo fractional order framework has been constructed, and the model is composed of susceptible , asymptomatically infected , symptomatically infected , hospitalised and recovered classes. In the context of COVID-19, the infected class is divided into two sub-classes, namely asymptomatic and symptomatic, they are denoted by and , respectively. According to some reports, recovery from the disease does not guarantee permanent recovery, so some of the recovered people revert back to the susceptible class at a constant rate [19]. The model is given by
where we have defined an infection function as follows:
In this function, represents the strength of government action, and represents the strength of public response. It is worth noting that Q is a new state variable that represents the social behavioural dynamics. The term d represents the strength of the public perception of risk, is the mean period of public response, and the model takes into account the fact that public reaction will increase as more people become infected and will naturally decrease over time. denotes the Caputo fractional derivative with initial time . Here all equations of system (1) are balanced with respect to the time dimension. For the sake of simplicity, we discard all the powers from the parameters. All parameters containing as power trace are taken into account for an impact in numerical analysis. We have discarded the power for analytical purposes only. The descriptions of all parameters are given in Table 1.
3. Basic Nonlinear Analysis
Definition 1
([4]).The Caputo fractional derivative operator of order ε for an absolutely continuous function) is defined as:
whereis the Gamma function,, and n is a natural number. In particular, for:
Theorem 1
([4]).Consider:
with,. The equilibrium points (of this system) are solutions of the equation. If for all eigenvalues () of the Jacobian matrix J,the equilibrium is locally asymptotically stable, whereis calculated at the equilibrium point.
3.1. Case 1: Model without Control
In this case, we can omit the last equation of system (1), and the infection function is taken as:
The equilibrium points of the system (1) are mentioned below.
- Disease-free equilibrium:
- Endemic equilibrium:
Here
where
The necessary and sufficient conditions for the existence of in the feasible region in , are as follows: and or, and . Here, is the reproduction number for the uncontrolled scenario calculated at disease-free equilibrium by the next-generation matrix method. The next-generation matrix at disease-free equilibrium is given as follows [22]:
Thus, we get
Theorem 2.
The disease-free equilibriumis asymptotically stable if the roots (η) of the following equation satisfy:
Proof.
To study the local stability of disease-free equilibrium point , we have to compute Jacobian matrix J at .
The characteristic equation of is
where
The three roots of the characteristic Equation (6) are , the disease-free equilibrium is stable if , where are the roots of . □
To analyse the local stability of endemic equilibrium , we need the following:
Definition 2.
For , we have and .
Hence
Theorem 3
([24]).Ifis the discriminant of the characteristic equationof the Jacobian matrix of systemevaluated at the endemic equilibrium point, where
then the system is asymptotically stable if any of the following conditions hold:
- and
- and
- and.
3.2. Case 2: Model with Effects of Governmental Action and Additional Control
Let us consider the combined effects of government action along with public perceptivity of risk regarding severe and critical cases. The variable Q is added to the model (system 1), which represents the public perception of risk. The value of Q increases when more infection occurs and decreases naturally. The intensity of perception of risk (d) is connected to the intensity of population (public) response . The infection function is mentioned in (2).
Theorem 4.
If the intensity of public perception has no impact, the steady-state endemic state is as follows:
Proof.
The steady-state conditions lead to
Substituting the value of into Equations (10) and (11), we arrive at a transcendental equation that would not lead to an explicit expression of . In this context, we limit the analysis for . In this situation, we have found the following steady-state:
provided
□
4. Sensitivity Analysis
To examine the sensitivity of to any parameter (say, θ), a normalised forward sensitivity index with respect to each parameter has been computed as follows [22,25]:
In a numerical (or other) model, sensitivity analysis (SA) is a technique that measures how the effects of uncertainties in one or more input variables can lead to uncertainties in the output variables. The values of sensitivity indexes for the parameters corresponding to Table 1 is given in Table 2. From Table 2, it is clear that is more sensitive than apart from Λ, and σ is more sensitive than .
5. Numerical Simulations
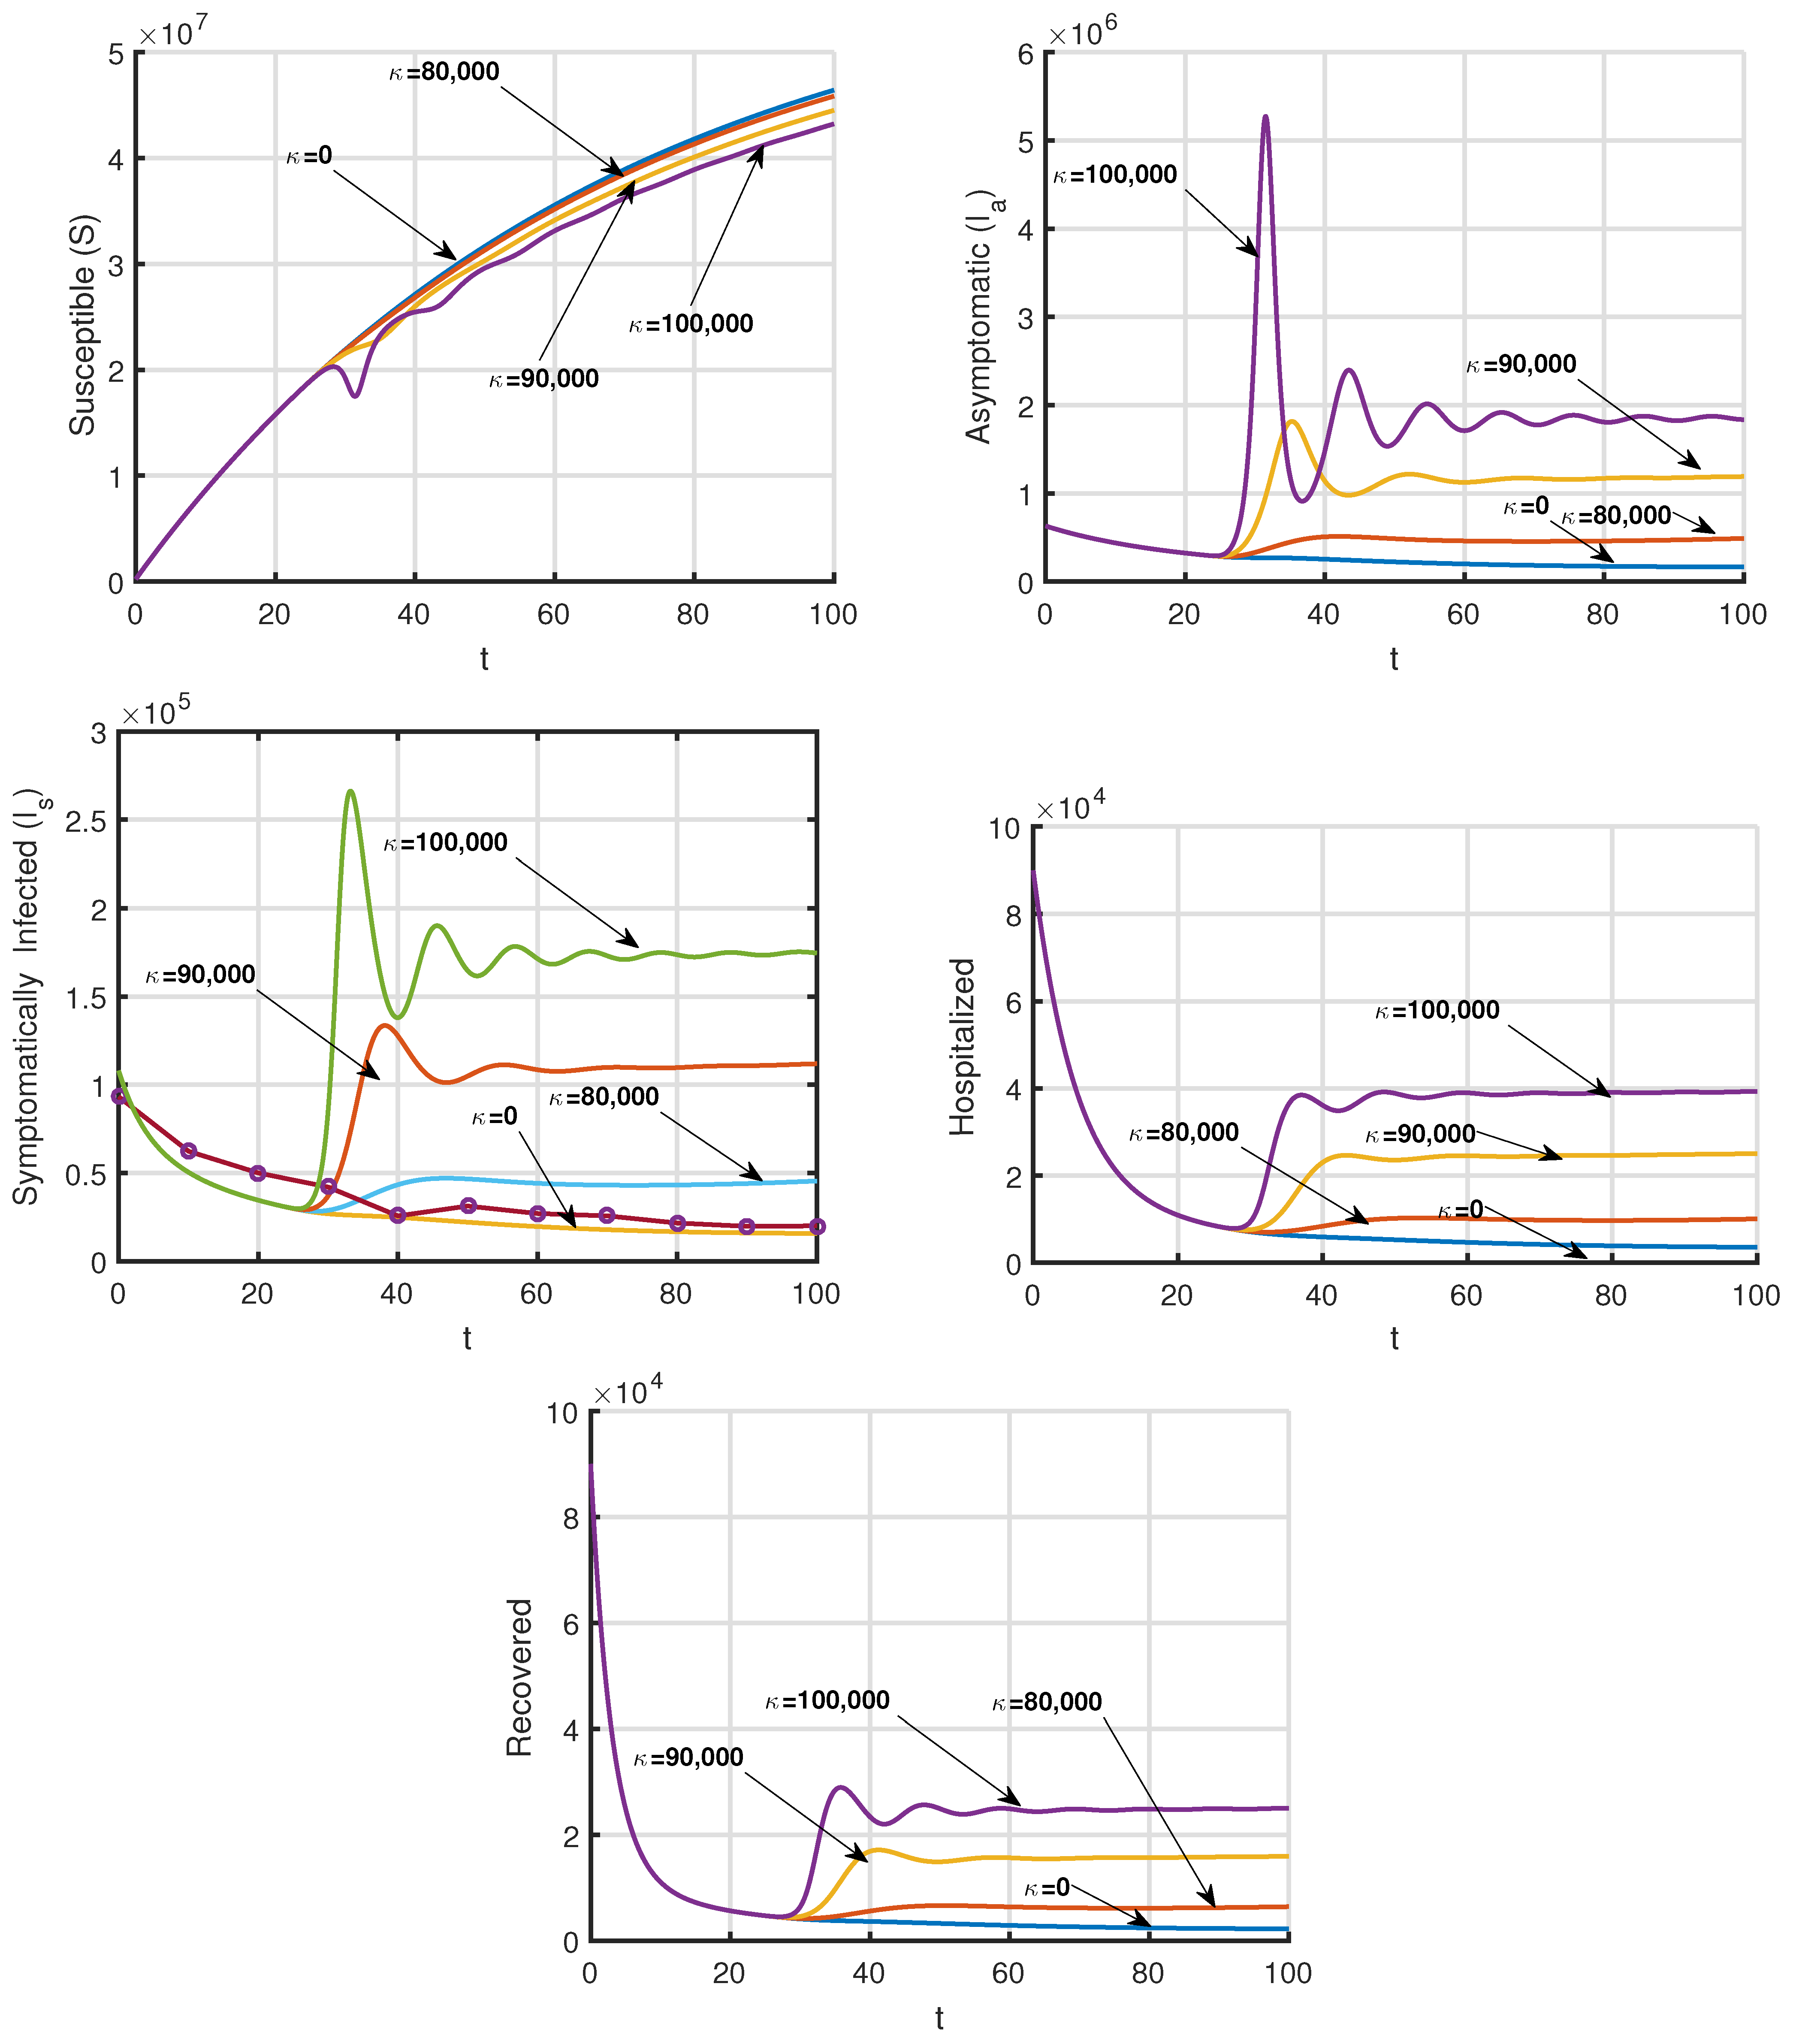
In the numerical study, the predictor-corrector PECE method (mentioned in Appendix A) for fractional differential equations has been applied in the MATLAB software platform [26]. Table 3 depicts the scenario of Bangladesh as a result of COVID-19 from 1 March to 10 June 2022. We ran numerical simulations to compare our model’s results to real data from various reports published by the WHO [1] and worldometer [27]. The value of the basic reproduction number is 1.2610, according to Table 1. Considering the demography of Bangladesh [28] and present covid situation, we have assumed 6,000,000, 600,000. 90,000, 80,000, 80,000, . Initially, we performed a simulation of system (1) without government measures ( but ), depicted in Figure 1 and Figure 2. We have taken for simulations. It is found that the symptomatically infected population will be drastically increased if no action is taken by the government (Figure 1). Therefore, a large proportion of the population needs to be hospitalised, and this will create a massacre in the Health department of Bangladesh (Figure 1). It is also observed that the social behaviour variable Q is diminished around 20 days from 1 March 2022 (Figure 2). Figure 3 and Figure 4 depict the model with the control (both government measures and public behaviour) scenario, which shows that the model fits well with real-world scenarios of the pandemic situation in Bangladesh. Figure 5 portrays the variation of the time series of for different values of the order of derivatives (0.5, 0.6, 0.7, 0.8, 0.9). The curve of the symptomatically infected population fits well with real data for . The time series for different values of governmental measures () are given in Figure 6, and it is revealed that the curve of is an approximation of active infected cases of the real scenario in Bangladesh for . The variation in the time series of state variables (with κ) is given in Figure 7. The interesting observation in Figure 7 is that the change in time series of all state variables, including , is negligible for values of κ ranging from 0 to 80,000 but increases for values greater than 80,000. The time series for the case (Figure 7) depicts the situation in which only government control is imposed, and no public behaviour is regulated. It is also observed that the number of symptomatic infected individuals () will increase if we reduce the order of derivative closer to 0. The value of Q decreases slowly if the order of derivative ε is fixed in a higher range (Figure 5).
6. Conclusions
For the COVID-19 pandemic, we have modified and created a SAIHR model, including various transmission rates for contact with infected and exposed persons, and we have incorporated parameters and variables to represent governmental action and society reaction. We have formulated the proposed model by considering that a recovered individual can retreat to the susceptible class. The model is considered in a Caputo fractional order framework. We have used the data from Bangladesh, ranked 5th among 121 countries around the world. We have simulated the model, and it justifies the pandemic situation in Bangladesh and provides sound validation. According to numerical studies, the impact of Bangladeshi government action on disease spread was significant (Figure 1, Figure 2, Figure 3 and Figure 4).
We have looked at the following three scenarios: (a) no control (Figure 1 and Figure 2), (b) only government action (Figure 7, case ), and (c) the combined effect of government action and public reaction (Figure 3 and Figure 4). The findings show that by carefully selecting the parameters that govern social and government behaviour, it is possible to halt the spread of the disease (or extinguish the endemic equilibrium). Additionally, we have observed that governmental control is more successful than merely controlling public behaviour. The effect of fractional order is very much important in epidemic dynamics. We can fit our model and estimate other parameters with the right choice of ε.
Finally, we conclude that our model can justify the scenario of other countries also, in that cases need to adjust the fractional order according to different parametric values. Our proposed model is an abstract one, which can be developed as a statistical model, but in this work, we have focused on the deterministic nature of the model and also studied the effect of memory of disease transmission. Our model is not a predictive model rather than a good interpolating model, though this model can be developed as a predictive model. There are some statistical measures, such as parameter estimation, parameter optimisation, statistical model selection, statistical sensitivity and robustness analysis, that may enrich the quality of this article. We will definitively try to incorporate these in our future research work. There is no perfect model for COVID-19 till now. There are so many factors (including economical and financial factors) controlling the pandemic situation. Therefore, we will consider these important factors in our future research.
Author Contributions
M.D., G.S. and M.D.l.S. have participate equally in all the aspects of this paper: conceptualization, methodology, investigation, formal analysis, writing—original draft preparation, writing—review and editing. All authors have read and agreed to the published version of the manuscript.
Funding
This research was funded by the Spanish Government for its support through grant RTI2018-094336-B-100 (MCIU/AEI/FEDER, UE) and to the Basque Government for its support through grant IT1555-22.
Institutional Review Board Statement
Not applicable.
Informed Consent Statement
Not applicable.
Data Availability Statement
The data used to support the findings of the study are available within the article.
Acknowledgments
The authors are grateful to the anonymous referees for their careful reading, valuable comments, and helpful suggestions, which have helped them to improve the presentation of this work significantly. The third author (Manuel De la Sen) is grateful to the Spanish Government for its support through grant RTI2018-094336-B-I00 (MCIU/AEI/FEDER, UE) and to the Basque Government for its support through grant IT1555-22.
Conflicts of Interest
The authors declare that they have no conflict of interest regarding this work.
Appendix A
We have applied the numerical scheme (predictor-corrector algorithms for fractional differential equations) presented by Garrappa [26] to solve the system (1). We have considered the following equivalent system:
with
in this context, . Then, system (A1) can be solved numerically by using the following scheme:
with , for , we have used 10,000, .
The above scheme is used in the FDE12 function, which is easily available in the MATLAB File exchange [29].
References
- WHO COVID-19 Dashboard; World Health Organization: Geneva, Switzerland, 2020. Available online: https://covid19.who.int/ (accessed on 23 June 2022).
- Islam, K.; Ali, S.; Akanda, S.Z.R.; Rahman, S.; Kamruzzaman, A.H.M. COVID-19 Pandemic and Level of Responses in Bangladesh. Int. J. Rare Dis. Disord. 2020, 3, 19. [Google Scholar] [CrossRef]
- Podlubny, I. Fractional Differential Equations; Academic Press: San Diego, CA, USA, 1999. [Google Scholar]
- Petras, I. Fractional-Order Nonlinear Systems: Modeling Aanlysis and Simulation; Higher Education Press: Beijing, China, 2011. [Google Scholar]
- Du, M.; Wang, Z.; Hu, H. Measuring memory with the order of fractional derivative. Sci. Rep. 2013, 3, 3431. [Google Scholar] [CrossRef] [PubMed]
- Podlubny, I. Geometric and Physical Interpretation of Fractional Integration and Fractional Differentiation. Fract. Calc. Appl. Anal. 2002, 5, 367–386. [Google Scholar]
- Sardar, T.; Rana, S.; Bhattacharya, S.; Al-Khaled, K.; Chattopadhyay, J. A generic model for a single strain mosquito-transmitted disease with memory on the host and the vector. Math. Biosci. 2015, 263, 18–36. [Google Scholar] [CrossRef] [PubMed]
- Das, M.; Maiti, A.; Samanta, G.P. Stability analysis of a prey-predator fractional order model incorporating prey refuge. Ecol. Genet. Genom. 2018, 7-8, 33–46. [Google Scholar] [CrossRef]
- Das, M.; Samanta, G.P. A prey-predator fractional order model with fear effect and group defense. Int. J. Dyn. Control. 2020, 9, 334–349. [Google Scholar] [CrossRef]
- Das, M.; Samanta, G.P. A delayed fractional order food chain model with fear effect and prey refuge. Math. Comput. Simul. 2020, 178, 218–245. [Google Scholar] [CrossRef]
- Das, M.; Samanta, G.P. Optimal Control of Fractional Order COVID-19 Epidemic Spreading in Japan and India 2020. Biophys. Rev. Lett. 2020, 15, 207–236. [Google Scholar] [CrossRef]
- Das, M.; Samanta, G.P. Stability analysis of a fractional ordered COVID-19 model. Comput. Math. Biophys. 2021, 9, 22–45. [Google Scholar] [CrossRef]
- Das, M.; Samanta, G.P.; De la Sen, M. A Fractional Ordered COVID-19 Model Incorporating Comorbidity and Vaccination. Mathematics 2021, 9, 2806. [Google Scholar] [CrossRef]
- Khan, M.A.; Atangana, A. Modeling the dynamics of novel coronavirus (2019-nCov) with fractional derivative. Alex. Eng. J. 2020, 59, 2379–2389. [Google Scholar] [CrossRef]
- Liu, Z.; Magal, P.; Seyd, O.; Webb, G. A COVID-19 epidemic model with latency period. Infect. Dis. Model. 2020, 5, 323–337. [Google Scholar] [CrossRef] [PubMed]
- Shaikh, A.S.; Shaikh, I.N.; Nisar, K.S. A mathematical model of COVID-19 using fractional derivative: Outbreak in India with dynamics of transmission and control. Adv. Differ. Equ. 2020, 373, 1–19. [Google Scholar] [CrossRef] [PubMed]
- Xie, Y.; Wang, Z.; Meng, B.; Xia Huang, X. Dynamical analysis for a fractional-order prey–predator model with Holling III type functional response and discontinuous harvest. Appl. Math. Lett. 2020, 106, 106342. [Google Scholar] [CrossRef]
- Wang, X.; Wang, Z.; Xia, J. Stability and bifurcation control of a delayed fractional-order eco-epidemiological model with incommensurate orders. J. Frankl. Inst. 2019, 356, 8278–8295. [Google Scholar] [CrossRef]
- Shen, M.; Peng, Z.; Xiao, Y.; Zhang, L. Modelling the epidemic trend of the 2019 novel coronavirus outbreak in China. bioRxiv 2020. [Google Scholar] [CrossRef]
- Wikipedia Contributors. Statistics of the COVID-19 Pandemic in Bangladesh. In Wikipedia, The Free Encyclopedia. Retrieved 19:19. 12 June 2022. Available online: https://en.wikipedia.org/wiki/Statistics_of_the_COVID-19_pandemic_in_Bangladesh (accessed on 16 June 2022).
- Kwuimy, C.A.K.; Nazari, F.; Jiao, X.; Rohani, P.; Nataraj, C. Nonlinear dynamic analysis of an epidemiological model for COVID-19 including public behavior and government action. Nonlinear Dyn. 2020, 101, 1545–1559. [Google Scholar] [CrossRef] [PubMed]
- Van den Driessche, P.; Watmough, J. Reproduction numbers and sub-threshold endemic equilibria for compartmental models of disease transmission. Math. Biosci. 2002, 180, 29–48. [Google Scholar] [CrossRef]
- Gelf, I.M.; Kapranov, M.M.; Zelevinsky, A.V. Discriminants, Resultants, and Multidimensional Determinants; Birkhäuser: Boston, MA, USA, 1994; ISBN 978-0-8176-3660-9. [Google Scholar]
- Ahmed, E.; El-Sayed, A.M.A.; El-Saka, H. On some Routh–Hurwitz conditions for fractional order differential equations and their applications in Lorenz, Rössler, Chua and Chen systems. Phys. Lett. A 2006, 358, 1–4. [Google Scholar] [CrossRef]
- Arriola, L.; Hyman, J. Sensitivity Analysis for Uncertainty Quantification in Mathematical Models. In Mathematical and Statistical Estimation Approaches in Epidemiology. Chowell, G., Hyman, J.M., Bettencourt, L.M.A., Castillo-Chavez, C., Eds.; Springer: Dordrecht, The Netherland, 2009. [Google Scholar] [CrossRef]
- Garrappa, R. On linear stability of predictor-corrector algorithms for fractional differential Equations. Int. J. Comput. Math. 2010, 87, 2281–2290. [Google Scholar] [CrossRef]
- COVID-19 Coronavirus Pandemic. 2022. Available online: https://www.worldometers.info/coronavirus/country/italy (accessed on 3 September 2020).
- World-Population. Bangladesh. Available online: https://www.worldometers.info/world-population/bangladesh-population (accessed on 26 June 2022).
- Garrappa, R. Predictor-Corrector PECE Method for Fractional Differential Equations. MATLAB Central File Exchange. Available online: https://www.mathworks.com/matlabcentral/fileexchange/32918-predictor-corrector-pece-method-for-fractional-differential-equations (accessed on 16 August 2022).
Figure 1.
Time series of of system (1) for 100 days from 1 January 2022 to 10 June 2022 when no government control is applied (), corresponds to Table 1.
Figure 1.
Time series of of system (1) for 100 days from 1 January 2022 to 10 June 2022 when no government control is applied (), corresponds to Table 1.
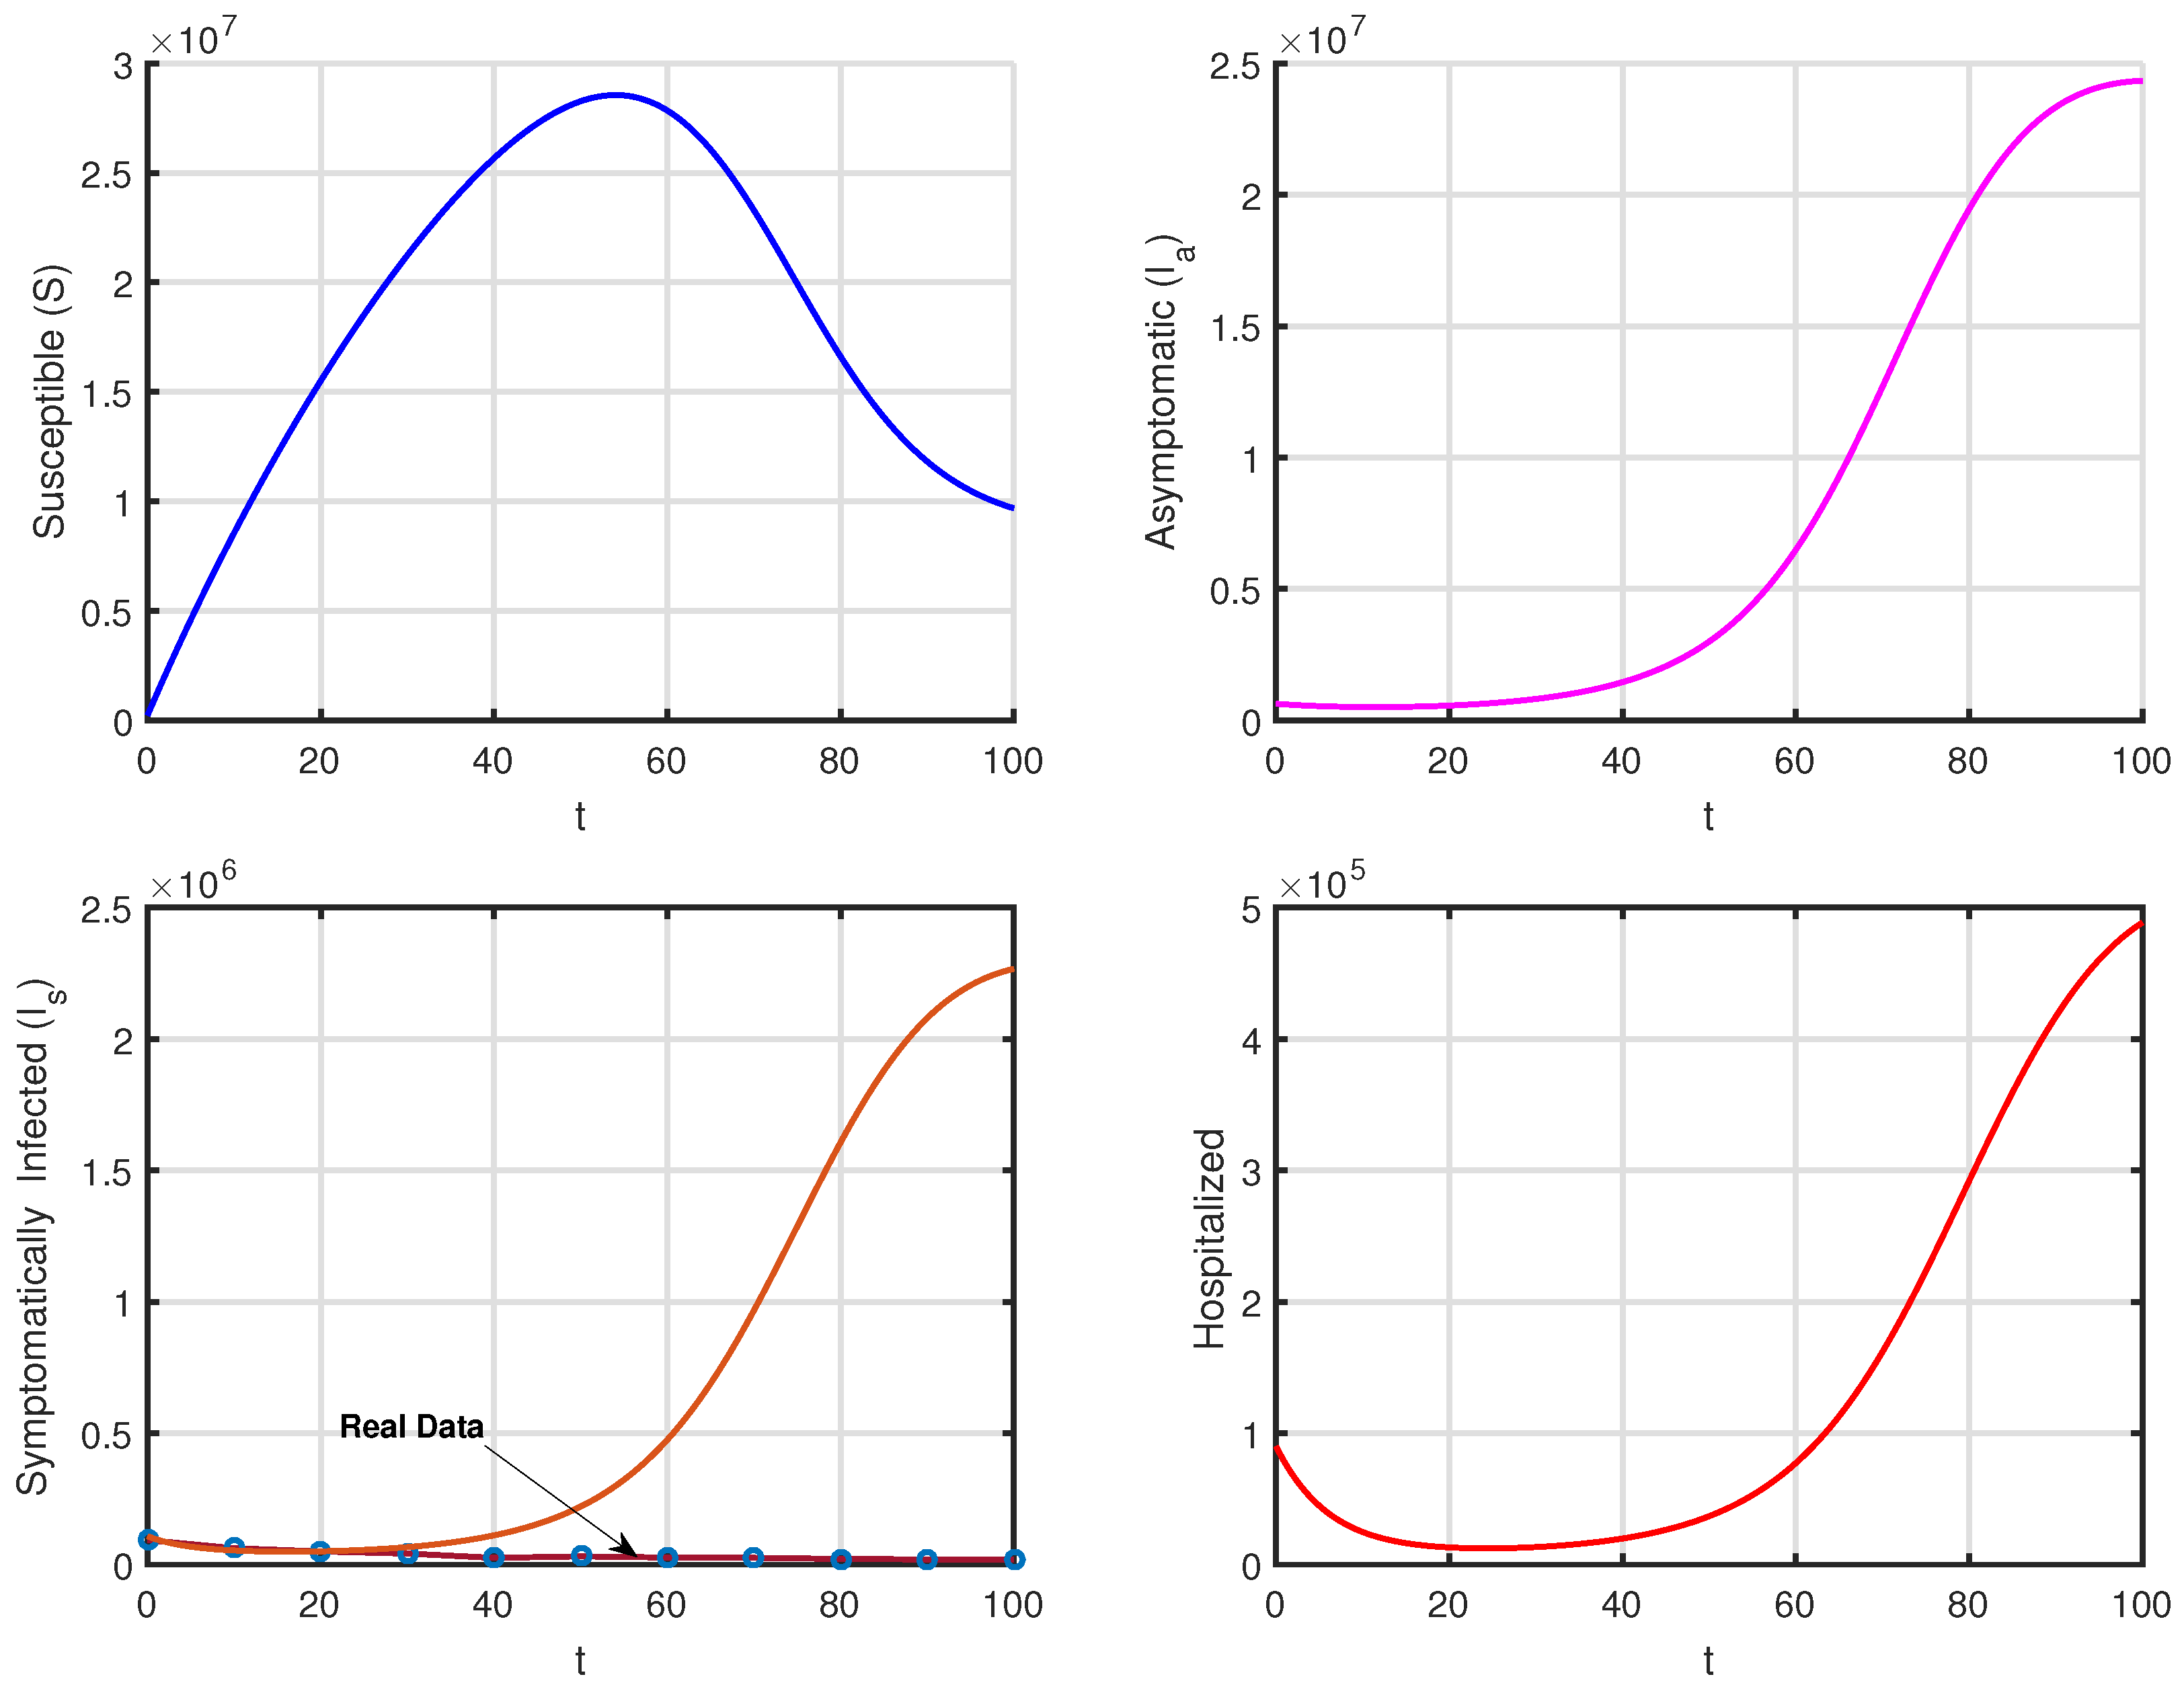
Figure 2.
Time series of for 100 days from 1 January 2022 to 10 June 2022 when no government control is applied ().
Figure 2.
Time series of for 100 days from 1 January 2022 to 10 June 2022 when no government control is applied ().
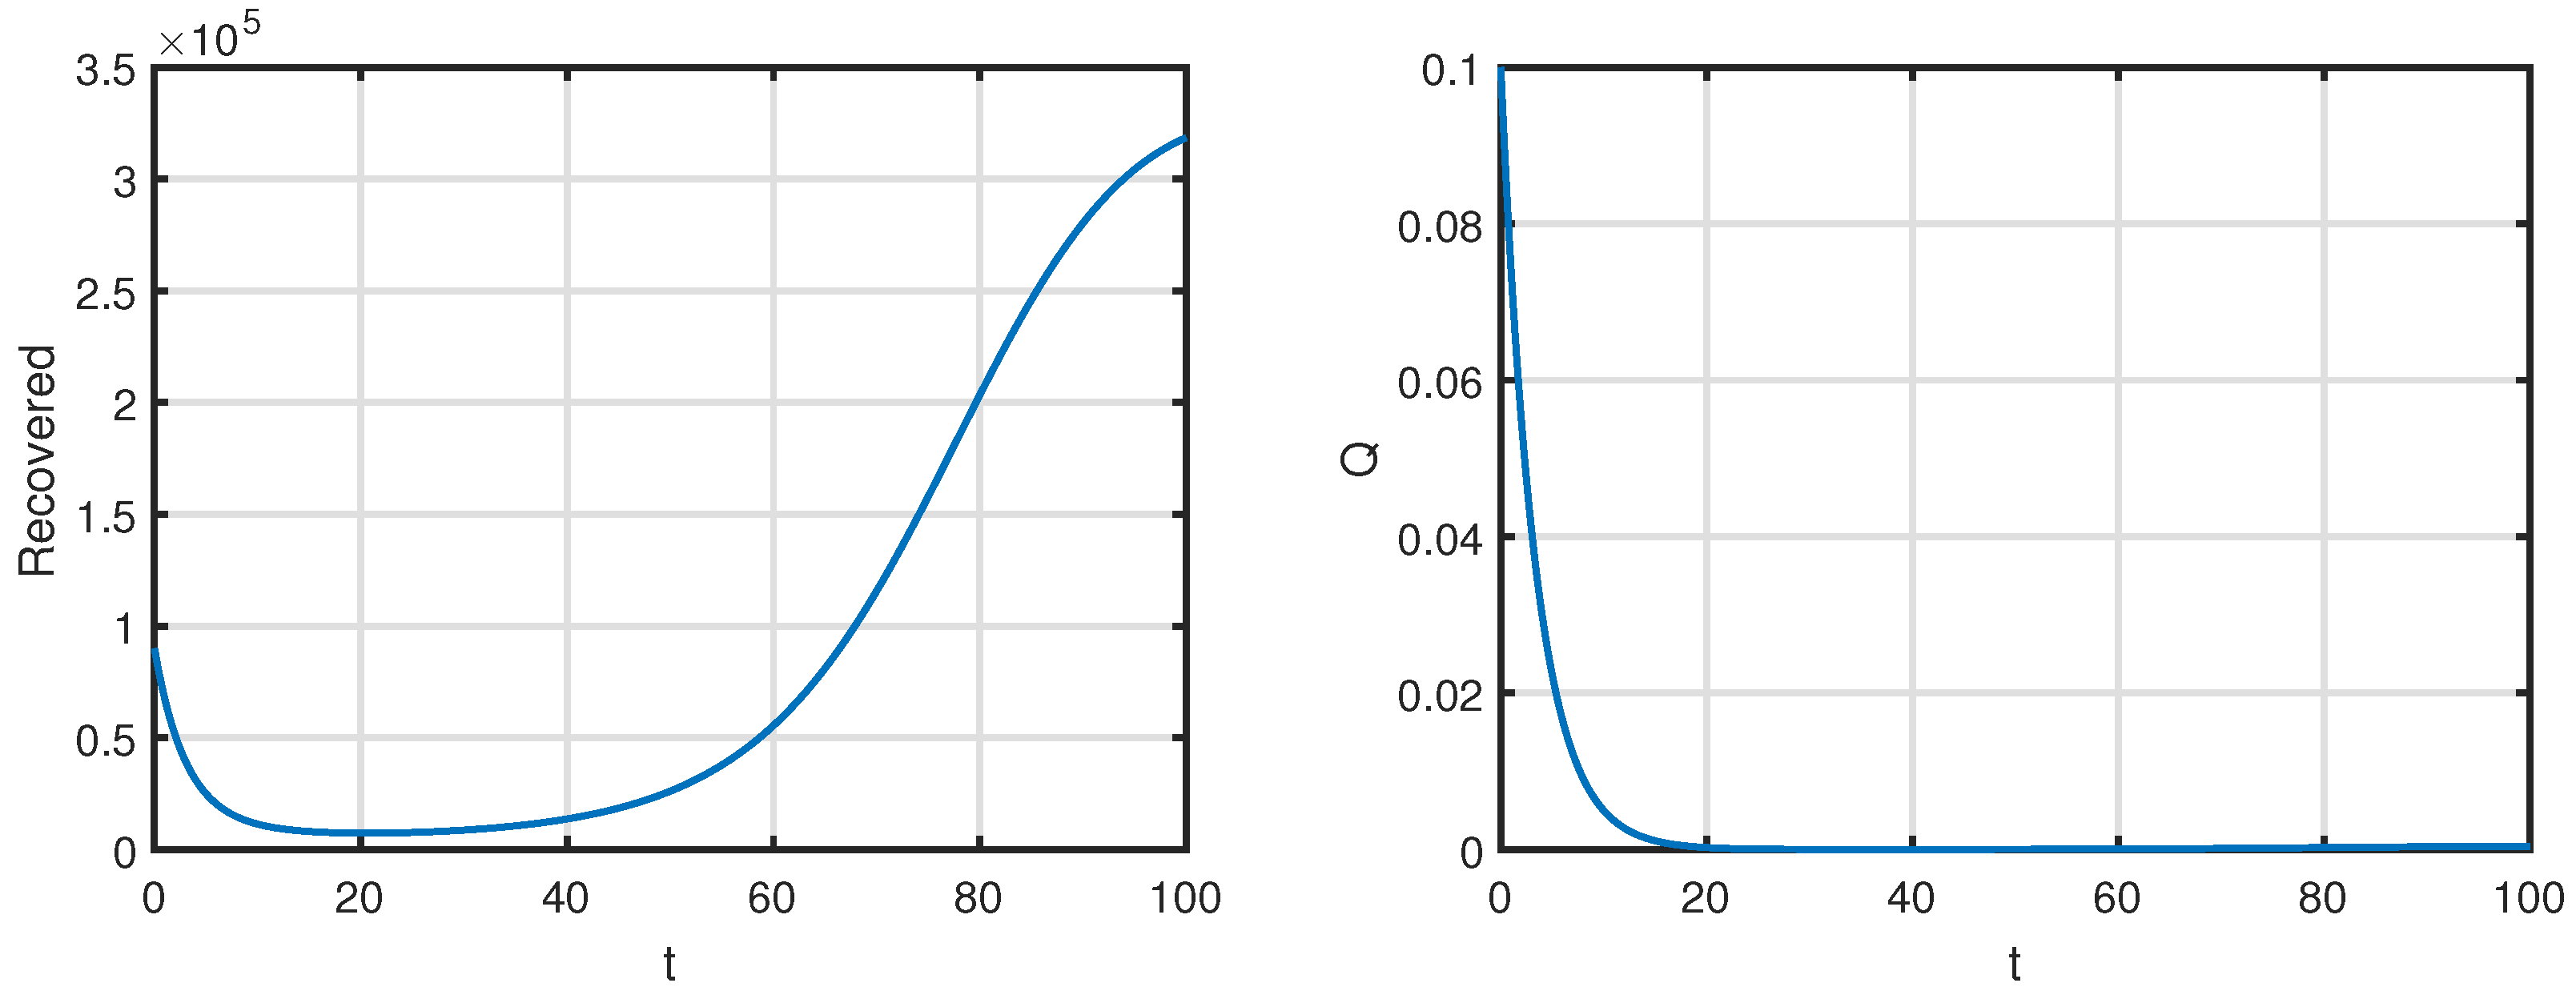
Figure 3.
Time series of for 100 days from 1 January 2022 to 10 June 2022 when controls (both government measures and public behaviour) are applied.
Figure 3.
Time series of for 100 days from 1 January 2022 to 10 June 2022 when controls (both government measures and public behaviour) are applied.
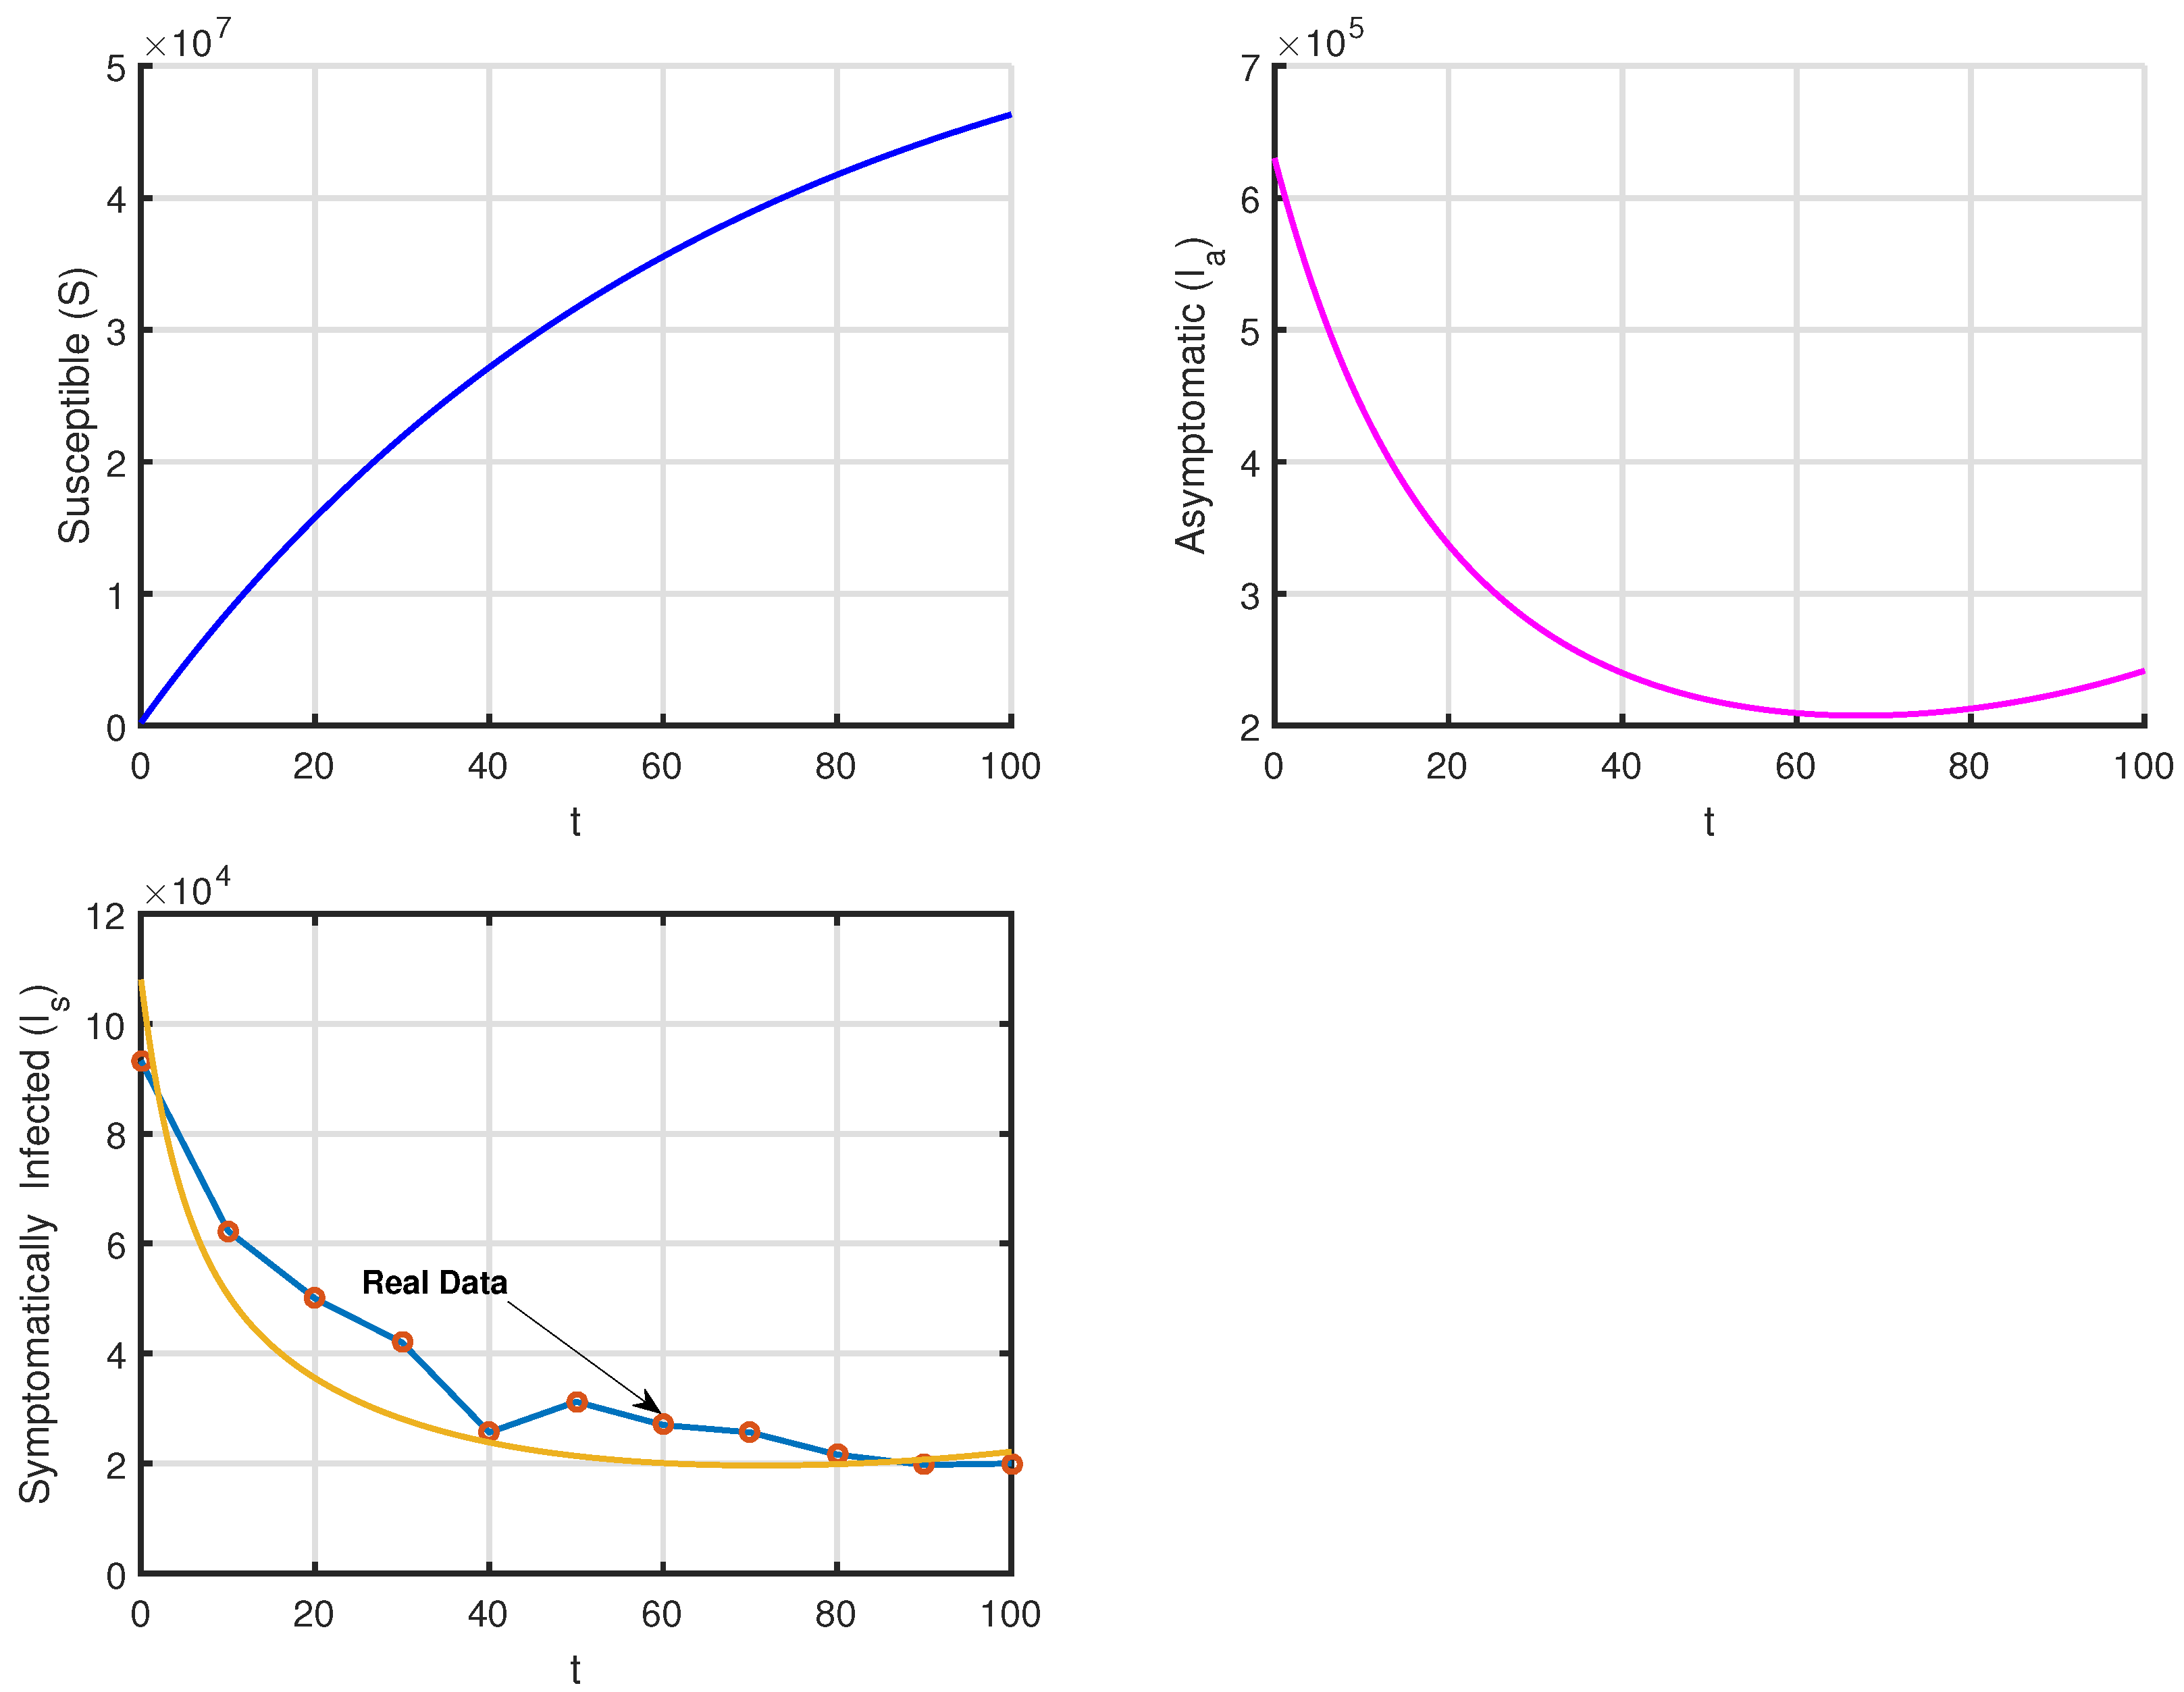
Figure 4.
Time series of for 100 days from 1 January 2022 to 10 June 2022 when controls (both government measures and public behaviour) are applied.
Figure 4.
Time series of for 100 days from 1 January 2022 to 10 June 2022 when controls (both government measures and public behaviour) are applied.
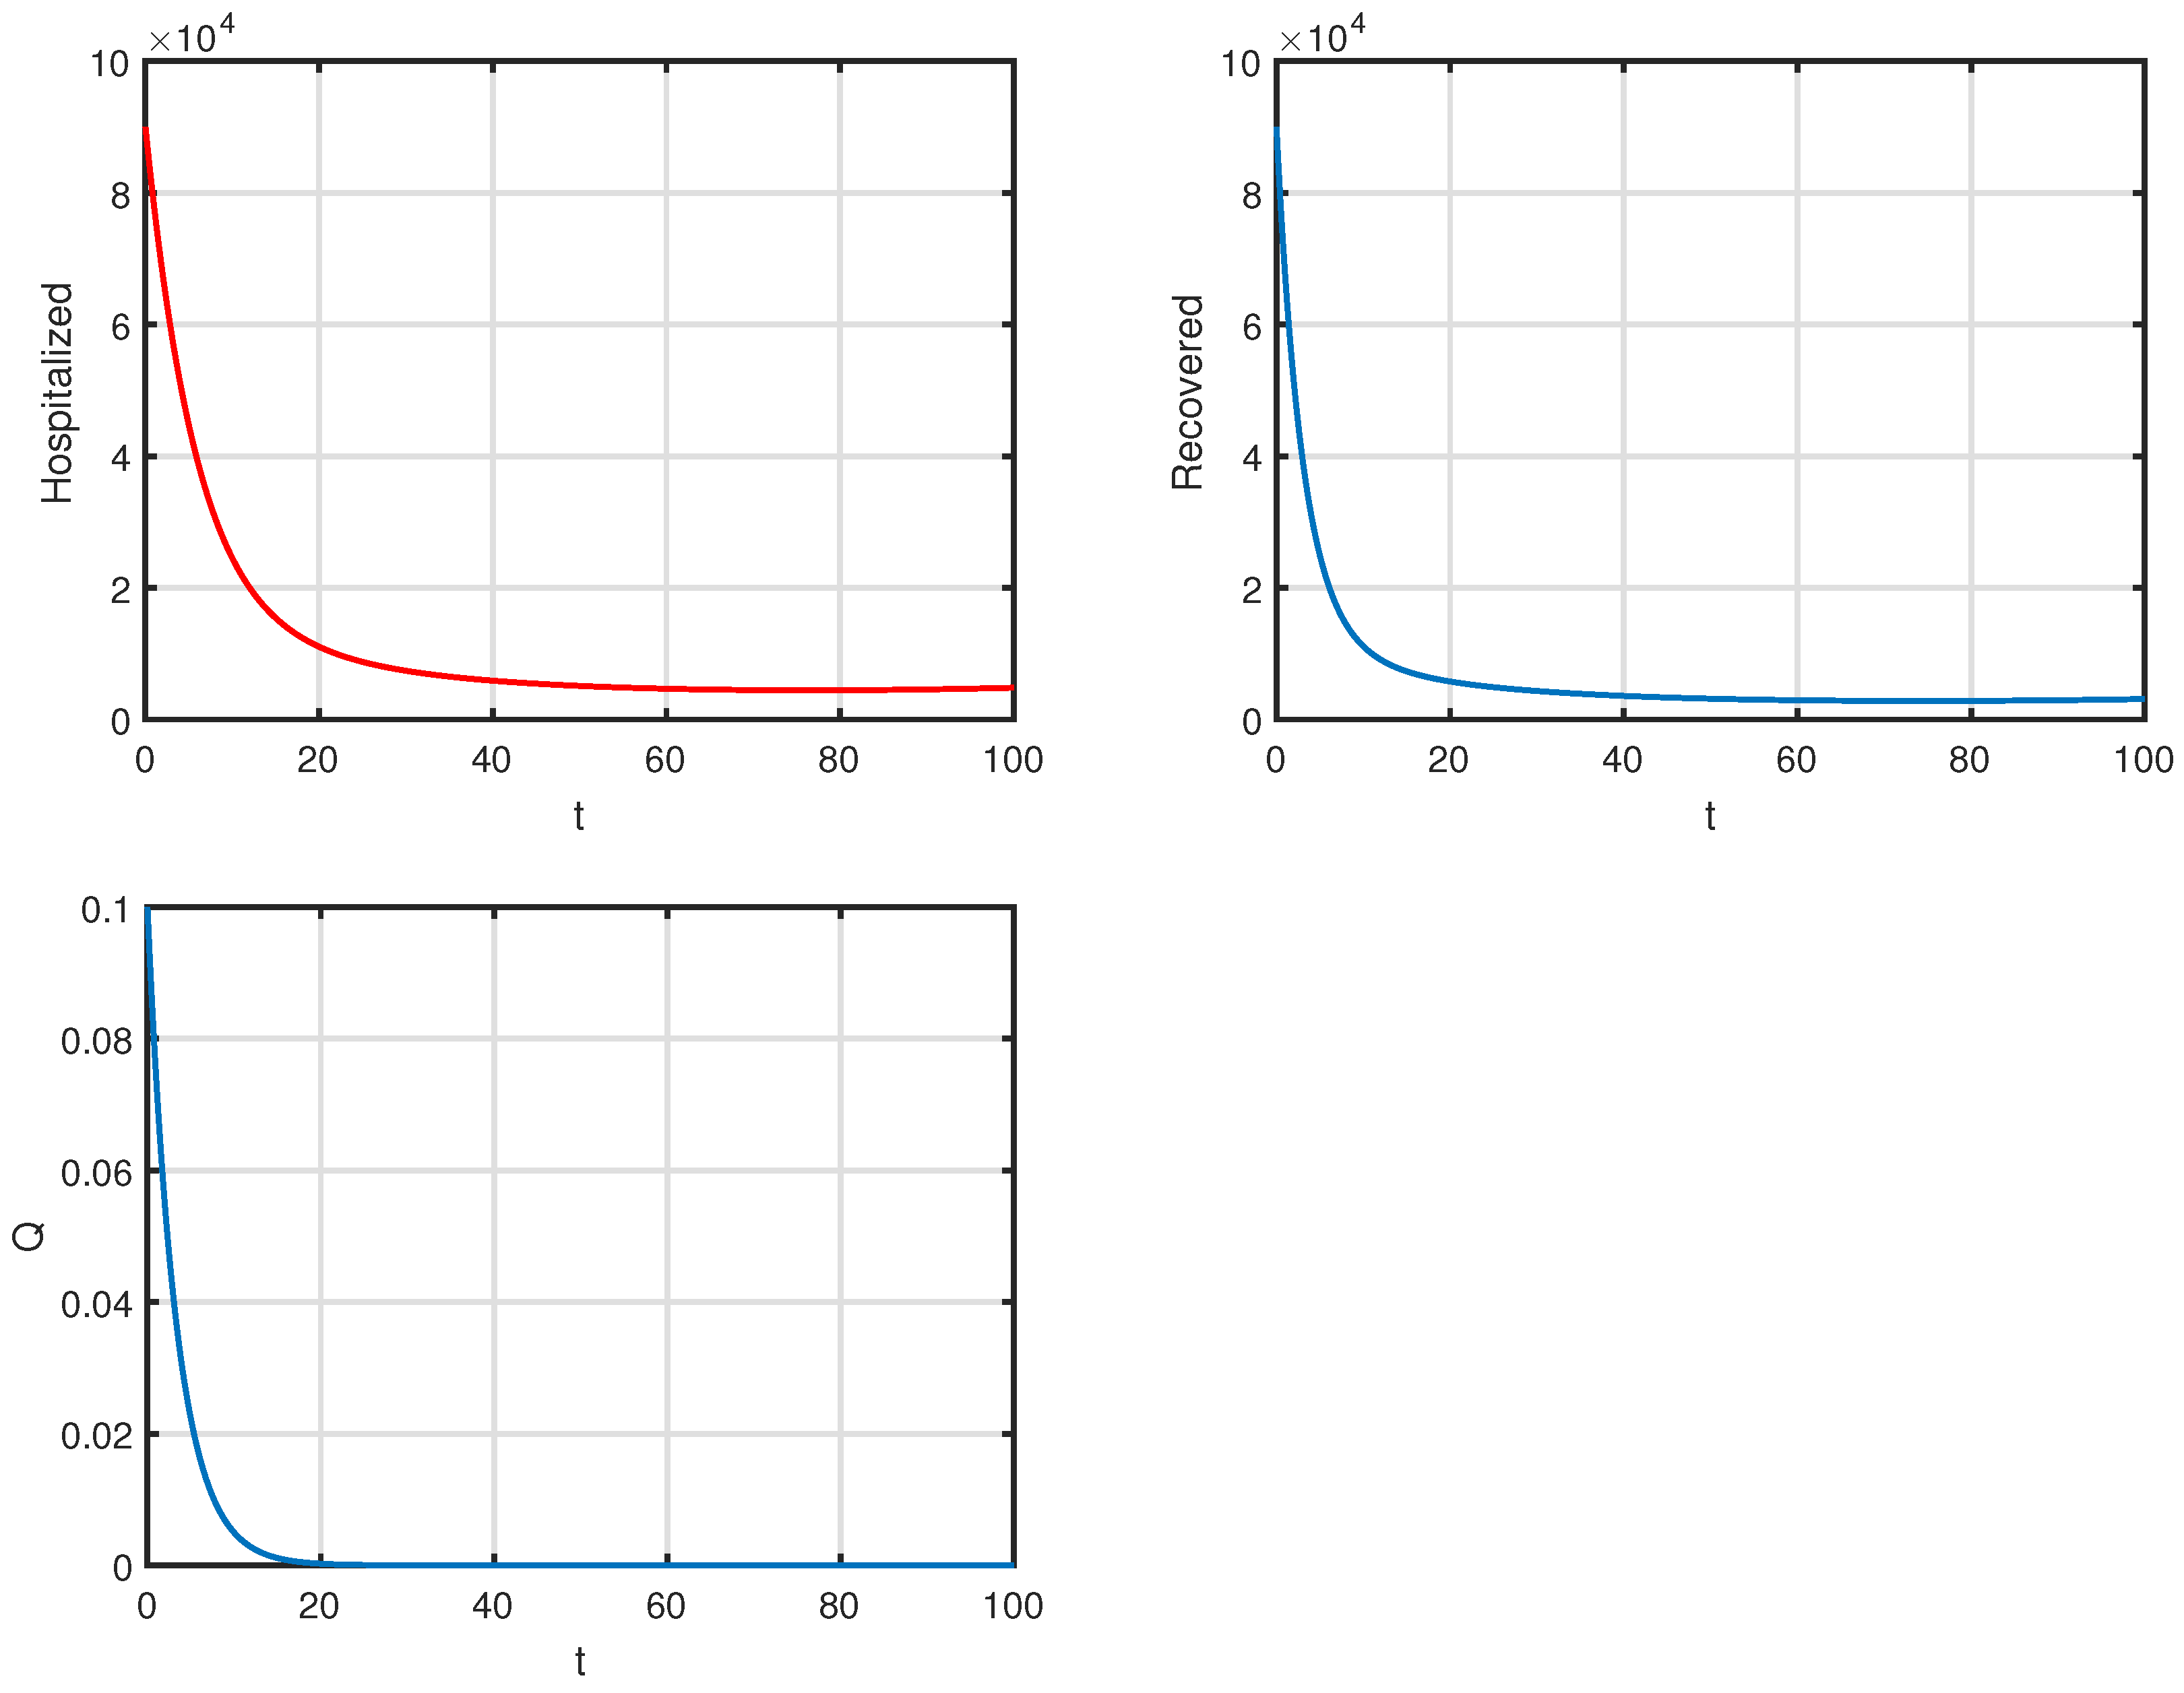
Figure 5.
Variation time series with different values of .
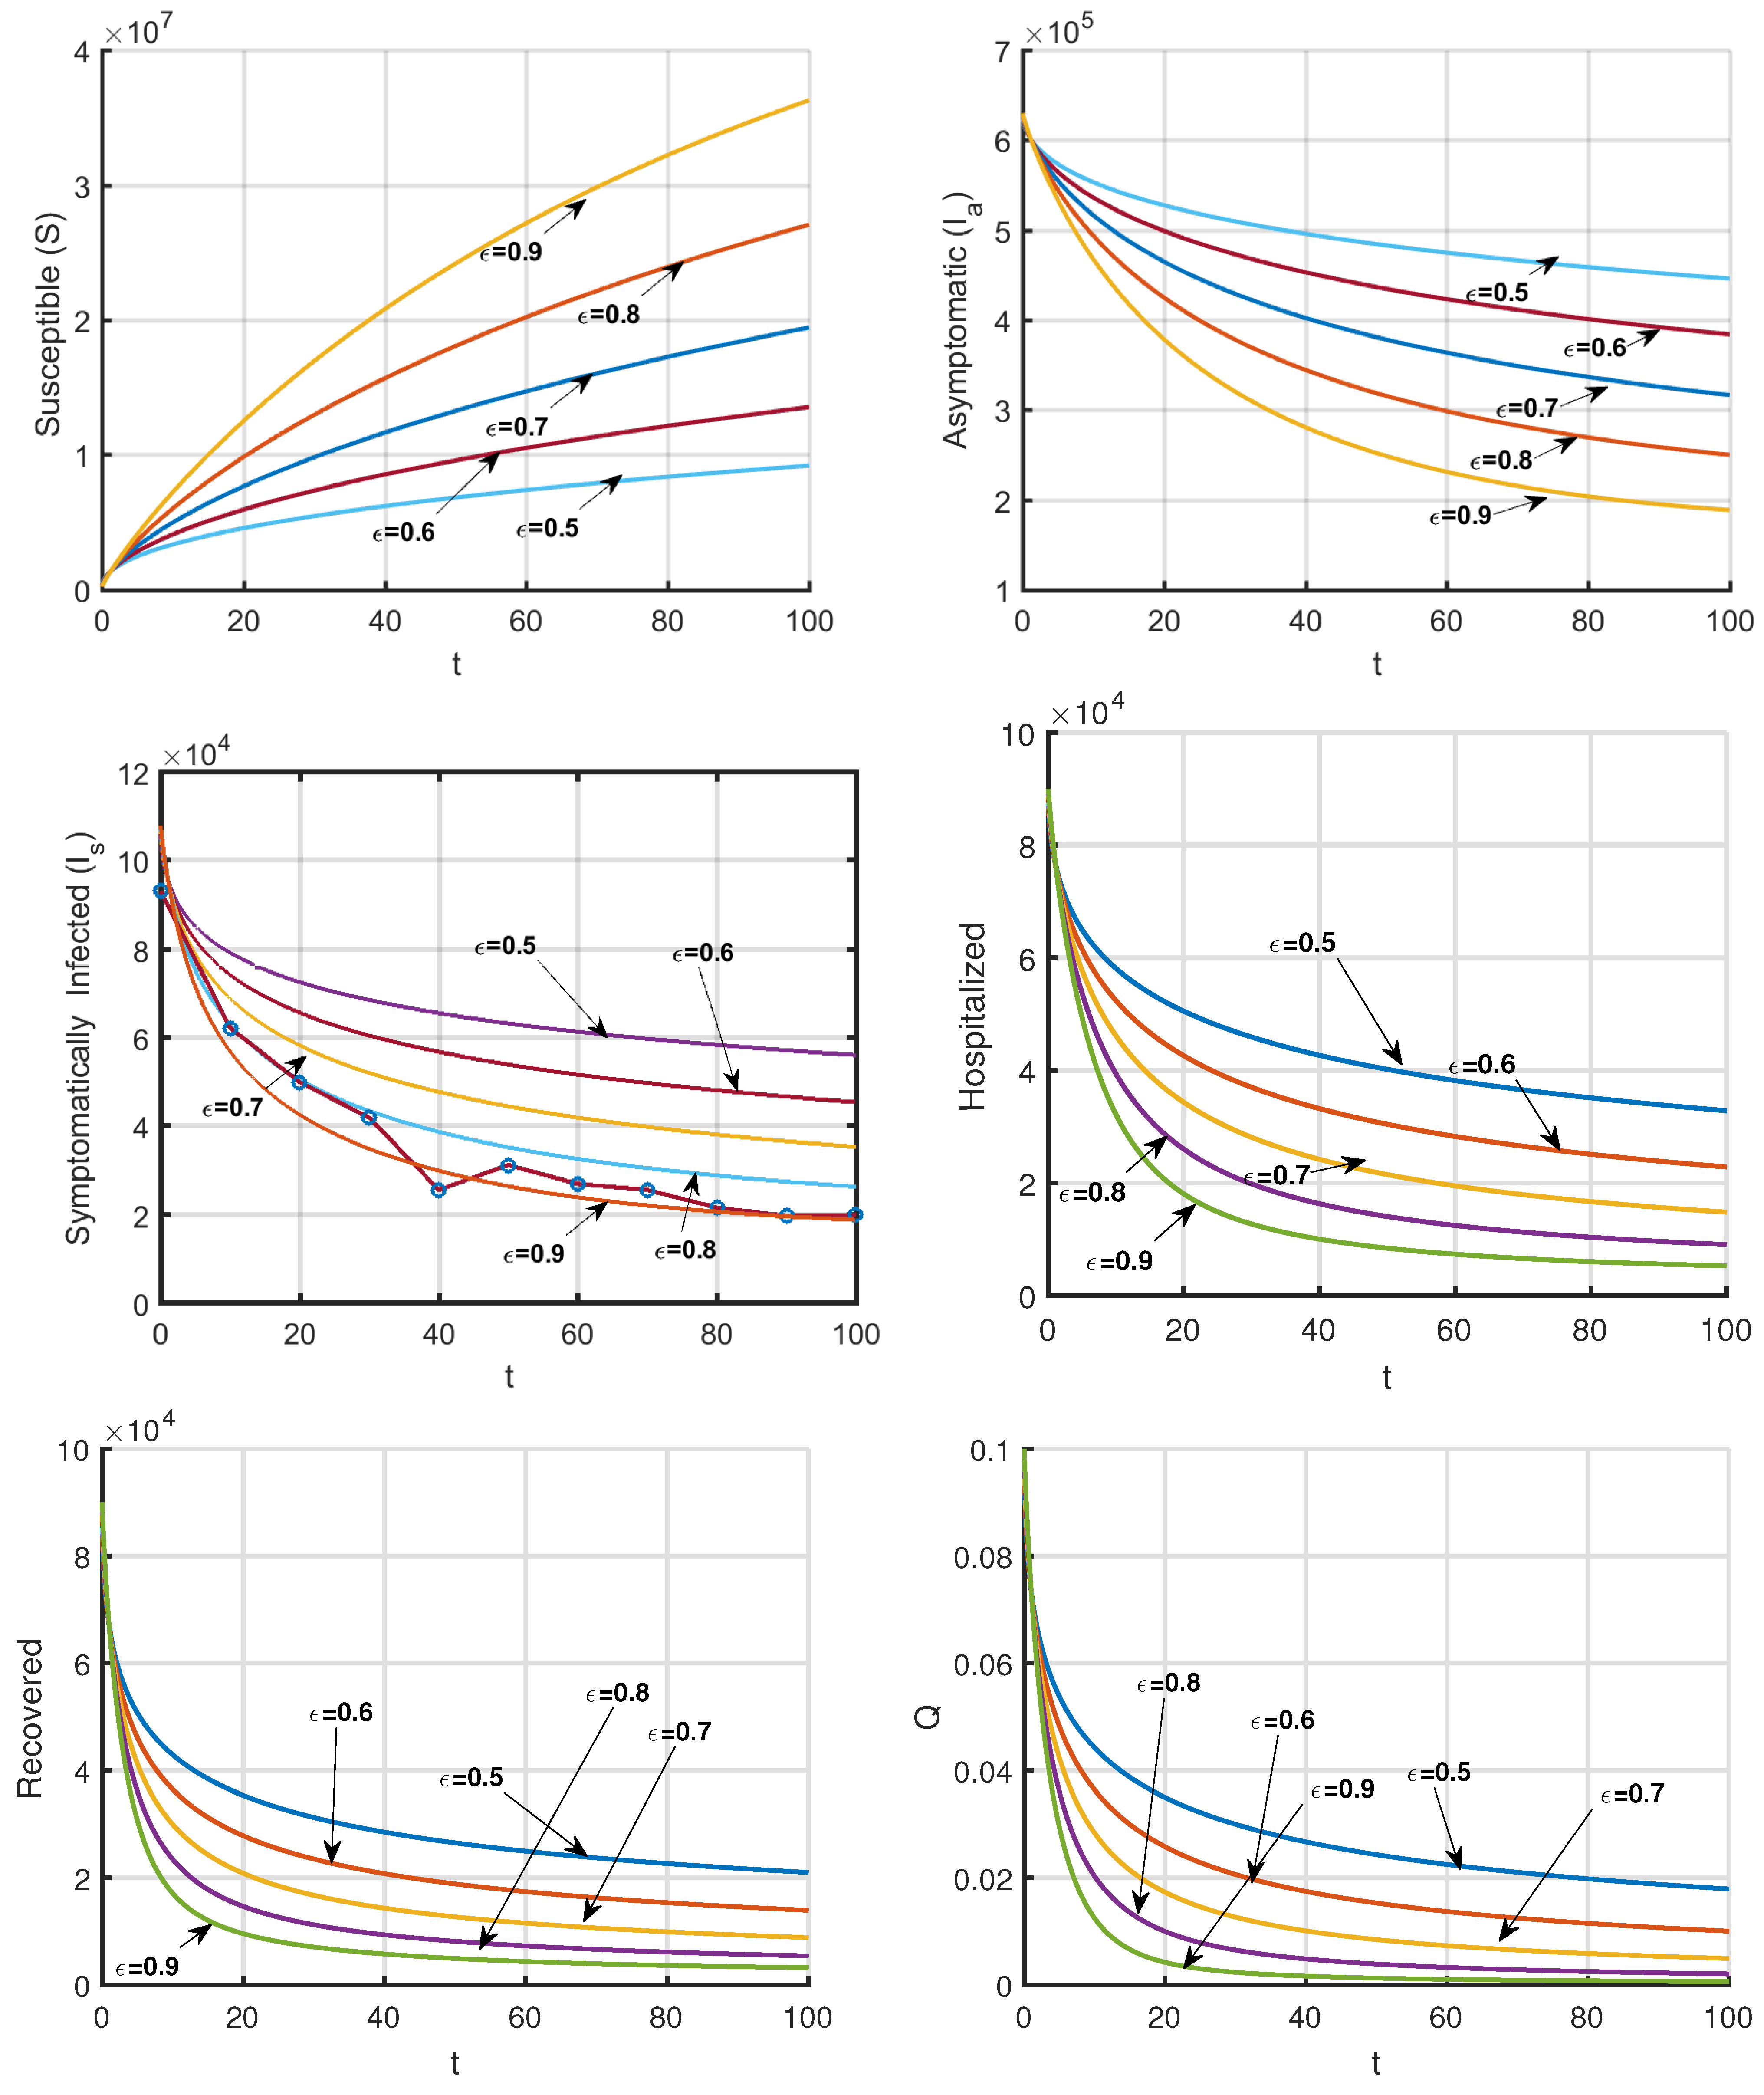
Figure 6.
Variation time series with different values of .
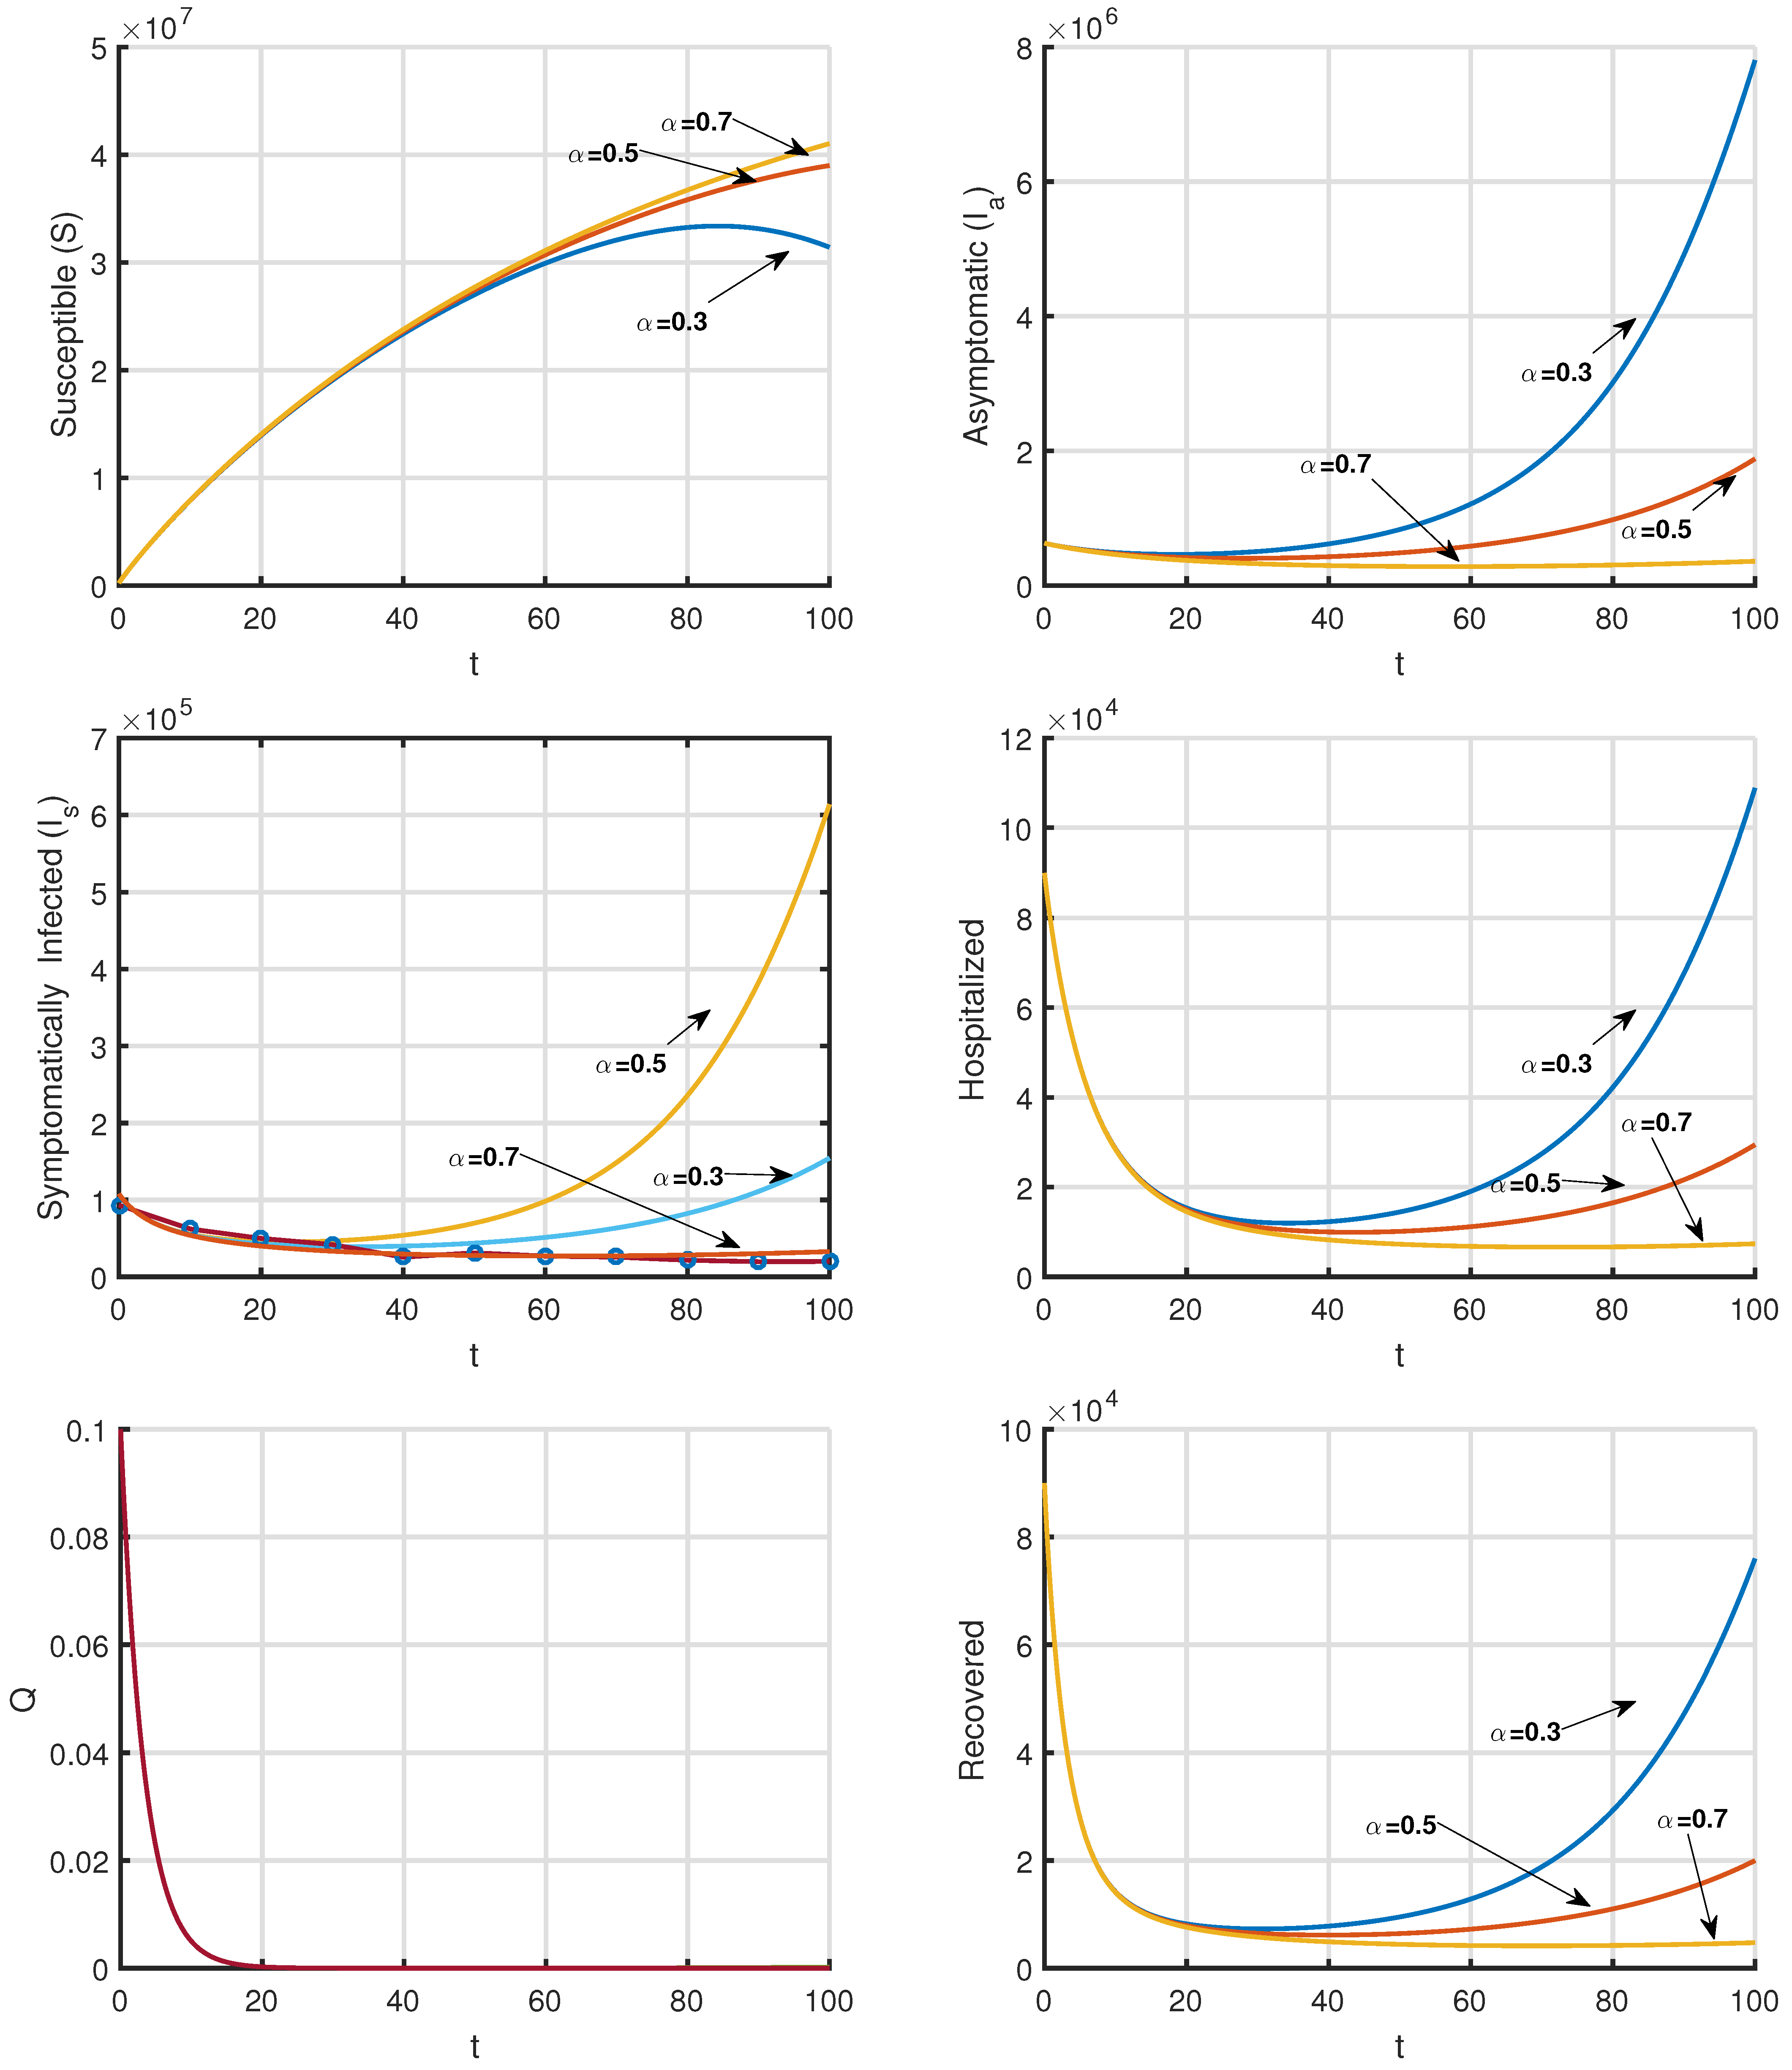
Figure 7.
Variation time series with different values of .

Table 1.
Description of biological interpretation of model parameters.
| Parameter | Interpretation | Values (Range) | Reference |
|---|---|---|---|
| recruitment rate of the human population | 0.001 | [20] | |
| rate of infection per unit of time by the symptomatic infected | 0.35 (0.005–0.34) | [21] | |
| reduction factor of infected population by the class compared to class | 0.32 (0.005–0.34) | [21] | |
| rate at which asymptomatic becomes symptomatic | 0.025 (0.02–0.1) | [21] | |
| rate at which the symptomatic infected individuals are hospitalised | 0.07 | Assumed | |
| rate of recovery of the symptomatic infected individuals | 0.14 | Assumed | |
| rate of mortality of symptomatic infected individuals | 0.05 (0.05–0.1) | [20] | |
| rate of retreat from recovered class to susceptible class | 0.1 | [21] | |
| rate of mortality of hospitalised individuals | 0.07 | [20] | |
| rate of transfer of hospitalised individuals to recovered class | 0.05 | Assumed | |
| order of fractional derivative | 0.95 (0–1) | Assumed |
Table 2.
Sensitivity indices of different parameters of system (1) corresponding to Table 1.
Table 2.
Sensitivity indices of different parameters of system (1) corresponding to Table 1.
| Parameters | Sensitivity Index |
|---|---|
| +1 | |
| −0.5502 | |
| −0.0127 | |
| −0.0141 | |
| +0.0748 | |
| +0.9252 |
Table 3.
Number of active cases between 1 March 2022 and 10 June 2022.
| Day | Active Cases |
|---|---|
| 1 March 2022 | 93,206 |
| 11 March 2022 | 62,302 |
| 21 March 2022 | 50,030 |
| 31 March 2022 | 42,010 |
| 10 April 2022 | 25,650 |
| 20 April 2022 | 31,241 |
| 31 April 2022 | 27,005 |
| 10 May 2022 | 25,665 |
| 20 May 2022 | 21,616 |
| 30 May 2022 | 19,739 |
| 10 May 2022 | 20,011 |
Publisher’s Note: MDPI stays neutral with regard to jurisdictional claims in published maps and institutional affiliations. |
© 2022 by the authors. Licensee MDPI, Basel, Switzerland. This article is an open access article distributed under the terms and conditions of the Creative Commons Attribution (CC BY) license (https://creativecommons.org/licenses/by/4.0/).
Share and Cite
MDPI and ACS Style
Das, M.; Samanta, G.; De la Sen, M. A Fractional Order Model to Study the Effectiveness of Government Measures and Public Behaviours in COVID-19 Pandemic. Mathematics 2022, 10, 3020. https://doi.org/10.3390/math10163020
AMA Style
Das M, Samanta G, De la Sen M. A Fractional Order Model to Study the Effectiveness of Government Measures and Public Behaviours in COVID-19 Pandemic. Mathematics. 2022; 10(16):3020. https://doi.org/10.3390/math10163020
Chicago/Turabian StyleDas, Meghadri, Guruprasad Samanta, and Manuel De la Sen. 2022. "A Fractional Order Model to Study the Effectiveness of Government Measures and Public Behaviours in COVID-19 Pandemic" Mathematics 10, no. 16: 3020. https://doi.org/10.3390/math10163020
Note that from the first issue of 2016, this journal uses article numbers instead of page numbers. See further details here.