


Experimental Research on the Settlement Feature of Two Ground Deformation Modes Induced by Tunnelling
1
Department of Civil Engineering, School of Civil Engineering, Tsinghua University, Beijing 100084, China
2
Institute of Geotechnical and Underground Engineering, Beijing University of Technology, Beijing 100124, China
*
Author to whom correspondence should be addressed.
Mathematics 2023, 11(10), 2351; https://doi.org/10.3390/math11102351
Submission received: 25 April 2023
/
Revised: 16 May 2023
/
Accepted: 16 May 2023
/
Published: 18 May 2023
(This article belongs to the Special Issue Resilient Infrastructure: Mathematical Modeling, Assessment and Smart Sensing)
Abstract
:Two ground deformation modes, i.e., the arching mode and collapsing mode, may be caused by tunnel excavation. However, the development of the ground deformation corresponding to the two modes is unclear. A piece of a model test facility is designed to study the ground settlement induced by tunnel excavation. Tunnel excavation is realized by decreasing the area of the model tunnel. Two model tests with different soil cohesion are conducted, and the two ground deformation modes form in the two tests, respectively. The former mode is observed at higher soil cohesion while the latter is found to develop at lower soil cohesion. Whether the failure surface develops to the ground surface or not is the most significant difference between the two ground deformation modes. In the two modes, the failure surface occurs at the position where the ground settlement contours distribute densely, and the shape of the failure surface can be described by the semi-oval for both modes. Meanwhile, for both the arching mode and the collapsing mode, Gaussian curves can reasonably describe the ground settlement troughs before the ground surface settlement becomes stable or increases sharply, and distribution of the trough width parameter is similar.
MSC:
74S251. Introduction
Soil above the tunnel crown may collapse during tunnel excavation. A failure surface can occur between the collapsed soil body and surrounding intact soil. If the failure surface extends to the ground surface, the soil between the tunnel crown and the ground surface collapse completely. This failure condition is called the “collapsing mode”. However, when the failure surface does not extend to the ground surface, the soil between the failure surface and the ground surface does not collapse even if the tunnel is unlined. This condition is defined as the “arching mode”. The geometry of the tunnel and mechanical properties of the soil determine the formation of the ground deformation mode together. In general, the arching mode is observed when the cover-to-diameter ratio Z0/D is large and/or the shear strength of the soil is high (high cohesion c and/or high internal friction angle φ) [1,2,3].
Trapdoor tests [3,4,5,6] have been frequently used to study the ground deformation modes, where attention is mainly placed on the evolution of earth pressure. The ground settlement is not monitored. However, the ground settlement induced by tunnelling has significant impact on both surface buildings and underground structures [7,8,9]. Proper consideration of the ground settlement caused by tunnelling is of more importance when the collapsing mode occurs, as catastrophic damages to the neighboring structures and foundations can be caused.
Nakai et al. (1997) [10] and Marshall et al. (2012) [11] studied the contours of the ground settlement at a specific moment based on the model test results. However, these tests cannot reveal the development process of the two failure modes because the contours of the ground settlement corresponding to different ground volume loss is not known. In addition, development of the ground settlement trough is directly related to the ground deformation mode. Both field observations [12,13,14,15,16,17,18] and model tests [11,19,20,21] have been used to investigate the ground settlement trough induced by tunnelling. Peck (1969) [22] analyzed the field observation data and indicated that Gaussian curves can well fit the surface settlement trough. Mair et al. (1993) [23] made further development in Peck’s method and pointed out that Gaussian curves can also provide a good fit for the subsurface settlement trough. Similar conclusions have been obtained from model tests [19,21,24,25,26]. However, several studies [27,28,29] indicated that the ground settlement trough approximates the plug-shape or triangular-shape at the collapsed position. Gaussian curves may not provide an adequate fit for the ground settlement trough at the collapsed position [27,28,29]. In sum, the development of the ground deformation, including the maximum settlement, the contours of the ground settlement, and surface and subsurface settlement troughs corresponding to the arching mode and collapsing mode are unclear.
This paper presents a new study on the formation of arching and collapsing mode. A new test facility is designed for the model tests. Sand with different water content is used in the tests, which simulates soil with different cohesion. At the initial state, the tunnel to be excavated is filled by a pressurized water bag. Water is then released during the tests to simulate the excavation process. The surface and the subsurface settlement at different soil volume loss states are monitored to obtain the ground settlement contours and the ground settlement troughs. The feature of the failure surface and the ground settlements are analyzed for the two ground deformation modes.
2. Physical Model Test of Tunnel Excavation
2.1. Test Equipment
The test equipment consists of a model strongbox, a model tunnel, and a ground deformation monitoring system.
2.1.1. Model Strongbox
Though the deformation of the ground near the tunnel heading shows 3D features, the final ground deformation is similar for different transverse cross-sections. Therefore, the effect of tunnelling on the ground can be studied using a simplified plain strain model [3,11,23]. In this work, a model strongbox for plain strain tests is designed. The model strongbox is rectangular with a Perspex window on its front face (Figure 1). The main body of the model strongbox is made using several 10-mm-thick steel plates. A 20-mm-thick acrylic plate Perspex window is fitted in the front face, enabling observation of the subsurface ground deformation. Stiffness of the strongbox is large enough to ensure that the deformation of the strongbox is small in the tests. Internal dimensions of the strongbox are 1500 mm long, 400 mm wide, and 1500 mm high. The Perspex window is 900 mm high and 1000 mm wide. The tunnel to be excavated is in the horizontal center of the strongbox. To reduce the boundary effect, the diameter D of the model tunnel is designed to be 200 mm. The distance between the tunnel crown and the top of the strongbox is 600 mm. The maximum cover-to-diameter ratio z0/D of the model tunnel can reach 3.0. Boundary conditions for the strongbox are shown in Figure 2.
2.1.2. Model Tunnel and Excavation Simulation
Reduction of the area of the tunnel transverse section to schematically realize a ground volume loss Vs is an approach adopted by many researchers to simulate the tunnelling process in model tests [8,11]. A model tunnel that can realize different Vs by releasing water was designed (Figure 3a,b), consisting of a water bag and a needle valve, as illustrated in Figure 3c. The diameter of the water bag is 200 mm, and the length is 500 mm. The water bag is filled with water through a high-pressure water pump before it is buried in the model. The needle valve is closed to seal the water bag when the diameter of the tunnel reaches 200 mm. Reduction of the tunnel diameter is simulated by releasing the water from the water bag, as shown in Figure 3a,b. The volume of the discharged water is defined as the tunnel volume loss Vt. The advantage of this system is that Vt can be controlled precisely, and Vt can reach a considerable value so that stable ground deformation can be formed. The ground volume loss Vs is indirectly realized by controlling the tunnel volume loss Vt. Tunnel volume loss can be calculated by Equation (1) [25]:
where Vw is the volume of the model tunnel, Vwd is the volume of the discharged water, D (=200 mm) is the diameter of the model tunnel, and L (=500 mm) is the length of the model tunnel.
2.1.3. Monitoring System
The surface and the subsurface settlements are monitored in the test. As shown in Figure 4, the DSCM monitoring system [30] was chosen to measure the subsurface settlement. The basic principle of DSCM is to match the geometric positions of the digital speckle images and then track the movement of each point. The camera of the DSCM monitoring system is placed in front of the model. The acrylic plate not only ensures the rigidity of the strongbox but also enables the ground deformation to be monitored by the DSCM monitoring system. Data collection points, which are symmetrical about the vertical central plane A-A, are set at each silica sand layer. DSCM computational software is used to conduct the correlation operation so that the displacement of each silica sand layer can be collected. Currently, the DSCM can achieve a precision of 0.01 pixels.
Dial indicators are used to monitor the surface settlement (Figure 5). The measurement range of the dial indicator is 30 mm, and the maximum precision is 10 μm. In the tests of this study, the surface and the subsurface settlement troughs are symmetrical about the vertical central plane A-A. Therefore, the dial indicators are arranged only on the right side of A-A. In addition, there is still one dial indicator that is installed on the left side of A-A to check the surface settlement monitored by other dial indicators. The layout of the dial indicators is shown in Figure 2, and the interval between adjacent dial indicators is 100 mm or 150 mm. Dial indicators are fixed on the designed position through supporting frames. The measuring rod of the dial indicator is perpendicular to the ground surface, and a glass pad is placed between the measuring rod and the ground surface (Figure 5). The surface settlement can be monitored reasonably when these measures are implemented.
2.2. Soil for the Tests
Sand was used in the model tests. The grading curve of the sand is shown in Figure 6. When the water content w is less than approximately 10%, cohesion c of the sand increases as w increases [31,32,33]. The water content w is 5% in Group T1 and 2% in Group T2. Meanwhile, previous studies have shown that the internal friction angle φ of the sand changes very little when w increases from 2% to 5% [34,35,36].
For the sand in Group T1 and Group T2, the direct shear test is carried out to determine the shear strength of the sand under different vertical pressure. In each group of direct shear tests, the vertical pressure is taken for 100 kPa, 200 kPa, 300 kPa, and 400 kPa, respectively. As shown in Figure 7, values of c and φ of the sand in Group T1 and Group T2 are determined by fitting the measured results of shear strength of the sand with the linear regression method using Equation (2), which is an expression for the Mohr–Coulomb failure criterion [37,38].
where τf is the shear strength of the sand and σ is the vertical pressure. For the sand used in the test, c and φ are, respectively, equal to 1.60 kPa and 33.0° when w = 2%. The values of c and φ, respectively, equal 7.34 kPa and 30.1° when w increases to 5%, as shown in Figure 7. To evaluate the quality of values of c and φ in Groups T1 and T2, coefficients of determination (R2) between the fitting line and the measured data are calculated using Equation (3).
where and are the true value and the predicted value of the ith target variable; is the mean value of ; N is the number of data samples. Values of R2 is 0.95 and 0.99 for Groups T1 and T2, respectively, as also shown in Figure 7.
2.3. Test Procedure and Conditions
2.3.1. Test Procedure
Sand is preheated and then mixed with a certain amount of water before filling (i.e., w = 5% in Group T1; w = 2% in Group T2). The sand is immediately filled into the strongbox after mixing with water. Lightweight plastic films are placed on the soil to prevent water from evaporating. A total of 103.2 kg (for Group T1) or 100 kg (for Group T2) sand is poured into the strongbox one at a time, and then the sand is compact into a layer 10 cm thick to control the dry density of the sand at 1634 kg/m3. A thin layer of white quartz sand is sprinkled inside the Perspex window for collecting the ground settlement information (Figure 1). The same procedure is repeated until the model reaches the designed height. In particular, the model tunnel is placed at the pre-set location when the sand beneath the tunnel is completed. The sand is in close contact with the lining. After the model is completed, the ground surface is made smooth and the monitoring system is installed. The data collection points for the DSCM monitoring system are set in the white quartz sand layer.
The test procedure is as follows: (1) fill the test model and install the monitoring system; (2) start the DSCM monitoring system; (3) control the volume of the discharged water and close the needle valve when the volume of the discharged water reaches 100 mL (i.e., Vt = 0.66%); (4) monitor the ground deformation for 10 min to ensure that the ground deformation becomes stable; and (5) repeat steps (3) and (4) until the surface settlement does not change or the surface settlement increases abruptly. In addition, after the model test is completed, the four soil samples at different depths are obtained to measure water content. The test results indicate that the water content remains almost constant.
2.3.2. Test Conditions
Two groups of tests are designed to realize the two ground deformation modes, as shown in Table 1. In Group T1, the water content of the sand is 5% while the buried depth of the tunnel crown is 30 cm, 40 cm, or 50 cm, with the corresponding test numbers being T101, T102, and T103, respectively. In Group T2, the water content of the sand is 2% while the buried depth of the tunnel crown is 25 cm or 50 cm, with the corresponding test numbers being T201 and T202, respectively.
3. Two Ground Deformation Modes
The arching mode and collapsing mode are observed in Group T1 and Group T2, respectively. The maximum surface settlements, development of the failure surface, and the ground settlement contours are presented to analyze the features of the ground settlement in the two ground deformation modes. Then, the formation mechanism of the two ground deformation modes is analyzed.
3.1. The Maximum Surface Settlement
In T1 and T2 groups of tests, the development of maximum surface settlement Smax(0) is different. For the T1 groups of tests, Smax(0) tends to converge with the increase in Vt, as shown in Figure 8a. The Vt when Smax(0) begins to converge is defined as Vt,c. When the buried depths are 30 cm, 40 cm, and 50 cm, the corresponding Vt,c are 2.63%, 1.97%, and 1.32%, respectively. The value of Vt,c decreases with the increase in Z0. For the T2 groups of tests, Smax(0) increases sharply when Vt reaches a specific value as shown in Figure 8b. The specific value of Vt is defined as Vt,s. When the buried depths are 25 cm and 50 cm, the corresponding Vt,s. are 3.29%, and 5.26%, respectively. Vt,s is larger in the deep tunnel. The failure surface does not extend to the ground surface when Smax(0) tends to converge with the increase of Vt, so the arching mode will be formed. Conversely, the failure surface extends to the ground surface after Smax(0) sharply increases with the increase of Vt, which represents that the collapsing mode will be formed.
3.2. Development Process of the Failure Surface
The water content of the sand is 5% in Group T1, and the cohesion c is 7.34 kPa. The development process of failure surface is similar in T101, T102, and T103, and therefore, T103 is taken as an example to describe the development process of the failure surface. Figure 9a illustrates that the failure surface cannot be observed when Vt is relatively small. When Vt reaches 2.63%, the failure surface S1 occurs near the tunnel crown, and the sand between the tunnel crown and S1 collapses, as shown in Figure 9b. When Vt increases to 4.62%, the failure surface S2 occurs above S1, and the sand between S1 and S2 collapses as shown in Figure 9c. When Vt reaches 30.66%, the failure surface S3 occurs, as shown in Figure 9d. After that, additional Vt does not cause new soil failure. When the failure surface does not extend to the ground surface, this condition is defined as the arching mode. As shown in Figure 9, the failure surface is approximately a semi-oval shape. As Vt increases, the lengths of the horizontal axis and the vertical axis gradually increase.
Group T2 includes two test conditions (T201 and T202). The water content of the sand is 2%, and the cohesion c is 1.60 kPa. The development process of the ground deformation is similar in T201 and T202. Thus, T202 is taken as an example to describe the development process of the ground deformation. Obvious ground settlement can be observed even if Vt is relatively small, but the failure surface does not appear. When Vt reaches 5.26%, the failure surface begins to appear near the shoulder of the tunnel, and then the failure surface gradually extends to the ground surface, as shown in Figure 10a. Meanwhile, a sliding block forms between the tunnel crown and the ground surface, and the sliding block moves downward with the increase in Vt, as shown in Figure 10b–d. When the sand between the tunnel crown and the ground surface collapses completely, this condition is defined as the collapsing mode. Figure 10a shows that the failure surface is also approximately a semi-oval-shape, and the similar failure surface was observed by Zheng (2016). As Vt increases, the failure surface gradually evolves into two vertical lines, as shown in Figure 10b–d.
3.3. Ground Settlement Contours
The changing gradient of the ground settlement is larger in the zone that the ground settlement contours distribute densely, which means that the failure surface may occur at the dense zone of the contours. Therefore, distribution of the contours can be used to predict the formation position of the failure surface for the two ground deformation modes. In this study, the contours are obtained by interpolating the measured settlement information, as illustrated in Figure 11 (T103) and Figure 12 (T202). The colors of the contours represent the value of the ground settlement. The settlement differences between two adjacent contours are the same in one figure. Abscissa x represents the horizontal distance from a certain point to the center of the tunnel. Ordinate y represents the vertical distance from a certain point to the center of the tunnel.
For the arching mode: the surface settlement does not increase when Vt reaches 2.63%, 1.97%, and 1.32% in T101, T102, and T103, respectively. The sand near the tunnel crown does not collapse when the surface settlement begins to become stable. However, contours of the ground settlement, before the ground surface settlement converges, can reflect the position that the failure surface will be formed. In this work, contours of the ground settlement in T103 are presented in Figure 11. To fully present the distribution of displacement in the figure, the range of the legend is from 0 to 0.09 mm because the maximum settlement at the tunnel crown is 0.09 mm when the surface settlement become convergent, i.e., Vt = 1.32%. As shown in Figure 11a, when Vt reaches 0.66%, the contours distribute densely in a zone near the tunnel crown. With the increase in Vt, the range of the dense distribution zone hardly changes, as shown in Figure 11b, indicating that the settlement in the dense distribution zone increases significantly with the increase in Vt, but the settlement outside the dense distribution zone increases minimally. Therefore, the failure surface occurs near the upper boundary of the dense distribution zone. The conclusion can be demonstrated by the comparison of Figure 9d and Figure 11. The position of the failure surface can be determined when the Vt is relatively small for the arching mode.
For the collapsing mode: the maximum surface settlement increases abruptly when Vt reaches 3.29% and 5.26% in T201 and T202, respectively. The failure surface has extended to the ground surface at this moment. For T201 and T202, evolution of the contours of the ground settlement is similar before the ground surface settlement sharply increases. Figure 12 shows the contours of the ground settlement in T202 to analyze the position that the failure surface is formed in the collapsing mode, and the range of the legend is from 0 to 2.80 mm because the maximum settlement at the tunnel crown is 2.80 mm when the collapse extends to the surface, i.e., Vt = 5.26%. The distribution of the contours has significant differences for different values of Vt. As shown in Figure 12a,b, when Vt reaches 0.66% and 1.32%, the contours distribute uniformly in the zone between the tunnel crown and the ground surface. As Vt increases, the contours above the tunnel crown become sparser, as shown in Figure 12c–g. When Vt reaches 5.26%, two vertical bands of the contours occur between the tunnel crown to the ground surface, as shown in Figure 12h. The settlement of the sand inside the two vertical bands is much larger than outside so that the failure surface is formed at the two vertical bands, which can be demonstrated by the comparison between Figure 10a and Figure 12h.
3.4. Formation Mechanism of the Ground Deformation Mode
Whether the soil above the tunnel crown collapses or not is related to the stress state. As shown in Figure 13a, curve S1 represents a failure surface before a stable ground deformation mode was formed; soil elements A and B lie on S1. The length and width of the soil element is dx and dz, respectively. Force balance conditions of soil elements A and B are shown in Figure 13b. The weight of the soil element is larger than the upper resultant of other forces because soil elements A and B tend to collapse, as shown in the equation below:
where GA and GB, respectively, represent the weight of soil elements A and B; F and f, respectively, represent the normal and tangential force acting on the soil element; α is the inclination angle of the soil element. The new failure surface S2 will be formed above S1. Soil elements C and D lie on S2. If the forced state of the soil elements C and D reaches balance as shown in the Equation (5), the soil element above S2 will not collapse, which means that the arching mode is formed. In contrast, the failure surface will extend upwards. If the failure surface (S3) is tangent to the ground surface and the force state of the soil elements E and F does not reach balance, as shown in the Equation (6), the soil will collapse completely, which means the collapsing mode is formed.
where GC, GD, GE, GF represent the weight of soil elements A~F.
As shown in Equations (4)–(6), both cohesion and internal friction angle affect the formation of the ground deformation mode. Cohesion can resist the tensile stress caused by the weight of the soil above the tunnel crown. The large internal friction angle and cohesion contribute to the formation of the arching mode. The water contents of the sand are 5% and 2% in Group T1 and Group T2, respectively. According to the analysis in Section 2.2, cohesion of the sand in Group T1 is larger than Group T2, and the internal friction angle of Group T1 and Group T2 is almost the same. Therefore, higher cohesion is the main reason that caused the arching mode in Group T1.
4. Surface and Subsurface Settlements
The surface and subsurface settlement troughs are always the focus of research in tunnelling engineering [11,20,21,22,23]. The measured surface and subsurface settlements, before the surface settlement no longer increases for the arching mode and the surface settlement sharply increases for the collapsing mode, are shown in Figure 14 and Figure 15, respectively, to analyze the feature of ground settlement during the formation process of the two deformation modes.
For the arching mode: as shown in Figure 14, the ground settlement of T101, T102, and T103 is similar. Taking T101 as an example, all the ground settlement troughs are approximately the Gaussian curves. For a given Vt, the width of the settlement trough decreases with the increase in the depth, and the settlement increases with the increase of the depth in the same vertical line. When the depth is same, both the width of the settlement trough and the settlement of a point increase with the increase in Vt. The maximum settlement appears in the tunnel crown. In addition, the maximum settlement gradually decreases as the depth of the tunnel increases. For the collapsing mode: as shown in Figure 15, the ground settlement of T201 and T202 is similar. Taking T201 as an example, the ground settlement troughs are also approximately the Gaussian curves when Vt is less than 1.97%, but the ground settlement troughs at different depths become plug-type when Vt reaches 3.29%. In addition, the width of the settlement trough hardly changes with the depth when Vt is fixed.
Existing studies indicate that, in a transverse tunnel section, the surface and subsurface settlement trough can be formulated by the Gaussian function as follows [25]:
where x is the horizontal distance from the vertical tunnel centerline; Smax(z) is the maximum settlement at depth z; and i(z) is the distance from the vertical tunnel centerline to the inflection point of the Gaussian curve at depth z. To analyze the ability of Gaussian function to describe the settlement trough under two deformation modes, Equation (7) is used to fit the data points, as illustrated in Figure 14 and Figure 15. Coefficients of determination (R2) between the measured settlement troughs and the fitting Gaussian curves are presented in Figure 16. There is only one value of R2 less than 0.9 in two groups of tests, and most of the data are greater than 0.94. It is indicated that Gaussian curves can well describe the surface and subsurface settlement troughs even before the two deformation modes are formed.
4.1. Settlement trough Width Coefficient i(z)
The settlement trough width coefficient i(z) is determined based on the Gaussian curves in Figure 14 and Figure 15. Distribution characteristics of i(z) can be analyzed based on these data. Peck (1969) studied the effect of tunnel crown depth on the surface settlement trough width coefficient, and provided three empirical curves of 2i(0)/D against z0/D that correspond to “rock, hard clays, sands above ground water level”, “soft to stiff clays”, and “sands below ground level”, respectively.
Based on our tests, the settlement trough width coefficient of both surface and subsurface settlement is arranged and compared with Peck’s curves, as shown in Figure 17. Note that curves corresponding to different depth form a surface that is parallel to the z/z0 axis. Figure 17 shows that the test data at the ground surface (i.e., 2i(0)/D against z0/D) is around the curve of “sands above ground water” because this condition agrees with the fact of our test. Meanwhile, the comparison demonstrates that the test data at subsurface is also in accordance with this curve. It can be concluded that z/z0 does not affect the distribution rule of 2i(z)/D against z0/D.
Previous research indicates that i(z) can be expressed as [23]
where z0 is the tunnel crown depth, and K is the trough width parameter. The value of i(z) can be estimated when K is determined. Marshall et al. (2012) pointed out that K can be described by [11]
where i(0) is the value of K at the ground surface, and ∂i(z)/∂z is the slope of i(z). Mair et al. (1993) [23] found that ∂i(z)/∂z = −0.325 and i(0) = 0.5 for clays. The results of K for all measured settlement troughs are plotted in Figure 18, and Equation (9) is used to fit these data to determine to values of ∂i(z)/∂z and i(0) corresponding to Groups T1 and T2. It can be seen that ∂i(z)/∂z = −0.01 is suitable for both Group T1 and Group T2, but the value of i(0) is 0.24 for Group T1 and 0.27 for Group T2. Meanwhile, coefficients of determination (R2) between the fitting curve of Equation (9) and measured results, calculated by Equation (3), are 0.96 and 0.97 for Groups T1 and T2, respectively. It can be concluded that Equation (9) can reasonably describe variation of K with depth for both the arching mode and the collapsing mode. In addition, variation of K with depth in clay is presented as the black dash curve in Figure 18, indicating that the value ∂i(z)/∂z and i(0) in sandy stratum is different from that in the clay stratum. It can be concluded that variation of K with depth is greatly affected by the type of the soil.
4.2. Ground Volume Loss Vs(z)
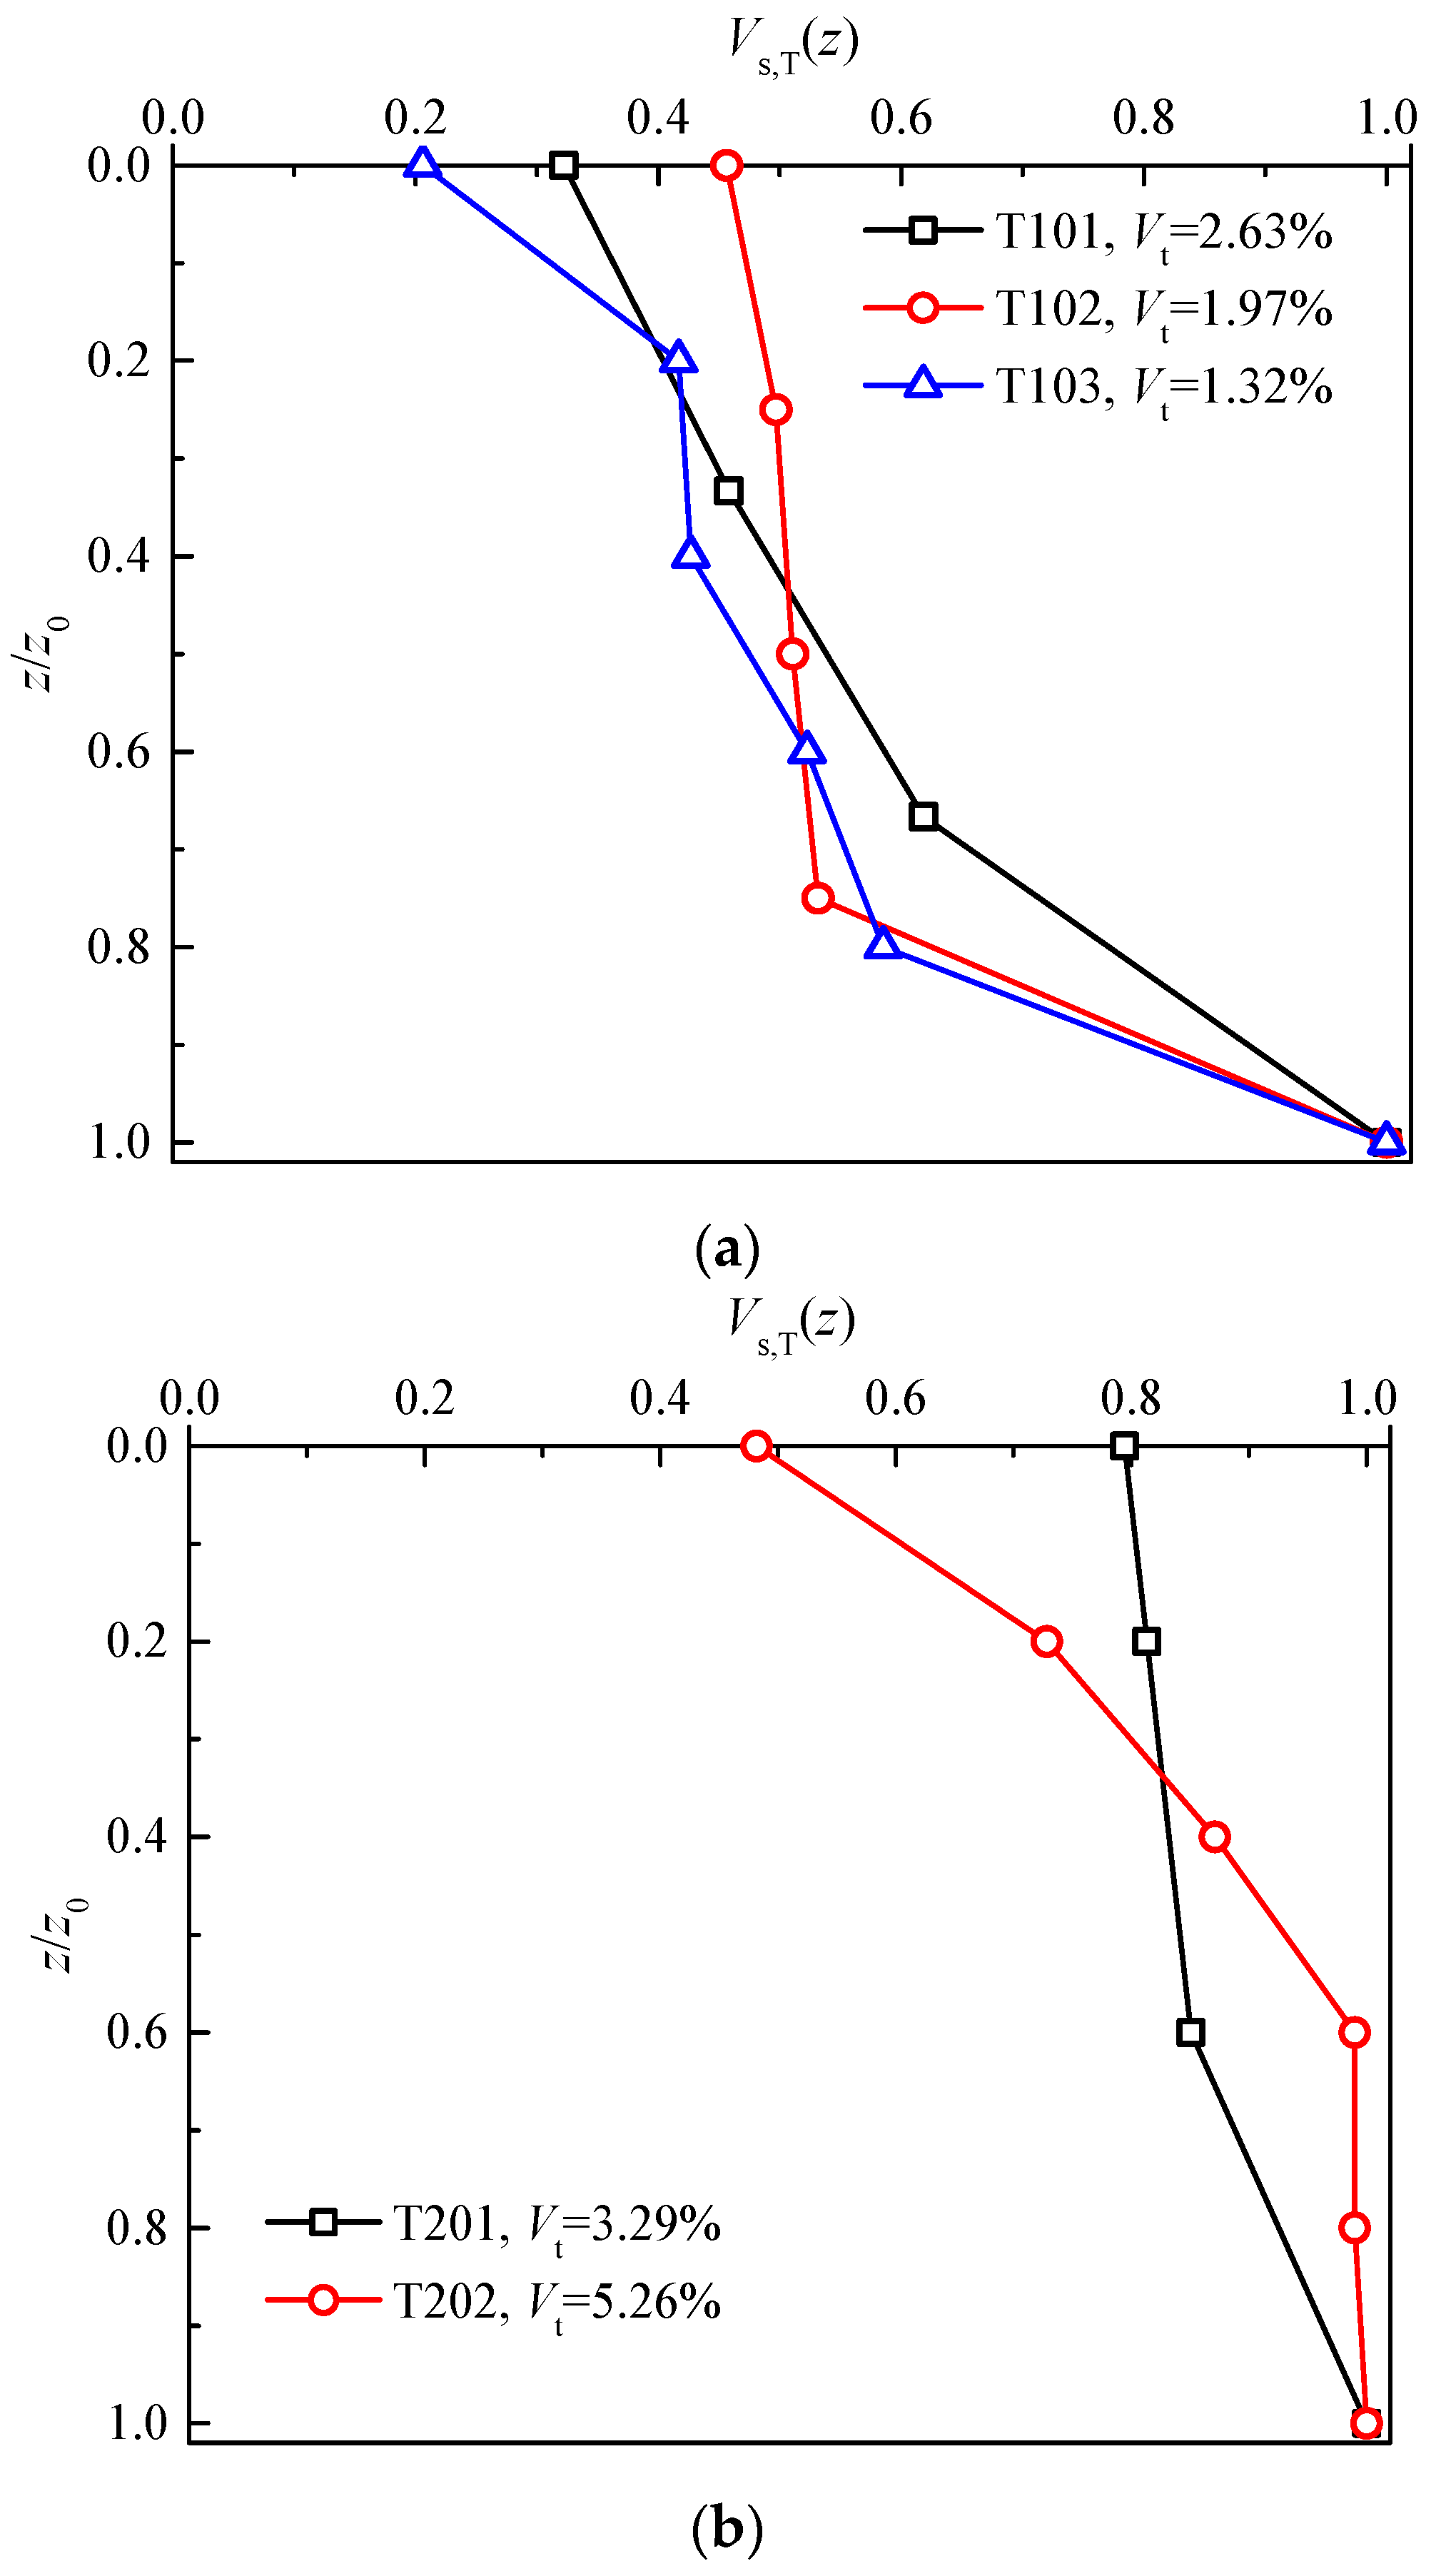
Vs(z) is the ground volume loss at depth z and is calculated as the area of the settlement trough. Peck (1969) [22] assumes that Vs(z) is constant during the tunnel excavation process, which means that the area of the settlement trough is independent of depth z. This assumption is only applicable to clay in the undrained condition. However, some test data show that Vs(z) for sand varies with depth z [11,19], which is consistent with our test results. Figure 19 shows the change of Vs(z)/Vs(z0) against z/z0 when the arching mode and the collapsing mode are formed, which illustrates that Vs(z) gradually decreases from tunnel crown to ground surface in two modes. For the arching mode, the change in Vs(z) is similar in T101, T102, and T103. Vs(z) is rapidly reduced from the tunnel crown to the ground surface, especially in the zone between the tunnel crown and the 0.8 z0. For the collapsing mode, Vs(z)/Vs(z0) is relatively large, which means the volume loss at different depths approaches that of the tunnel crown, i.e., the sliding block moves downward as a whole. In addition, the value of Vs(z0) is not equal to Vt, which results from three reasons: the horizontal displacement is also induced by Vt around the model tunnel; dilatation occurs in the sand near the tunnel crown; the soil arching effect appears in the sand above the tunnel crown.
5. Conclusions
Two groups of tests are conducted through a newly designed test facility. The arching mode is formed in Group T1, in which the cohesion is 7.34 kPa. The collapsing mode is formed in Group T2, in which the cohesion is 1.60 kPa. Characteristics of the two ground deformation modes are studied. The conclusions are as follows:
Before the failure surface occurs, as Vt increases, the maximum surface settlements become convergent in the arching mode and is divergent in the collapsing mode. Development tendency of the maximum surface settlement as Vt increases can be used to predict the two ground deformation modes. Contours of the ground settlement distribute densely in a limited zone above the tunnel crown in the arching mode, but two dense vertical bands of the contours gradually appear between the tunnel crown and the ground surface in the collapsing mode. In the two ground deformation modes, the failure surface occurs at the position where the ground settlement contours distribute densely. For both the arching mode and the collapsing mode, Gaussian curves can reasonably describe the ground settlement troughs before the ground surface settlement becomes stable or increases sharply, and distribution of the trough width parameter is similar. The manuscript only provides the ground deformation under two cohesive forces. More experimental conditions and numerical simulations will be carried out in future works to investigate the influence of cohesion on the ground deformation mode and the corresponding deformation.
Author Contributions
Methodology, Q.L. and F.K.; Validation, X.M. and H.D.; Data curation, C.G. and X.M.; Writing—review & editing, Q.L. and C.G. All authors have read and agreed to the published version of the manuscript.
Funding
This research was funded by National Natural Science Foundation of China (Grant No. 52208396, 52278385), Postdoctoral Science Foundation of China (Grant No. 2021M701934), and Beijing Municipal Education Commission (Grant No. KM202210005019).
Data Availability Statement
Data sharing not applicable.
Conflicts of Interest
The authors declare no conflict of interest.
Abbreviations
| c | cohesion strength |
| D | tunnel diameter and water bag diameter |
| e0 | initial void ratio |
| i(z) | settlement trough width coefficient |
| K | trough width parameter |
| L | water bag length |
| Mf | peak failure stress ratio |
| Smax(0) | maximum settlement of ground surface |
| Smax(z) | maximum settlement at a depth of z |
| Vs | ground volume loss |
| Vt | tunnel volume loss |
| Vt,c | tunnel volume loss when the surface settlement begins to converge |
| Vt,s | tunnel volume loss when the surface settlement begins to increase sharply |
| Vw | volume of water bag |
| Vwd | volume of discharged water |
| z0 | depth of the buried tunnel crown |
| z | depth of one point in the model |
| λ | slope of the isotropic compression curve |
| κ | slope of the isotropic swelling curve |
| w | water content |
| φ | internal friction angle |
References
- Chen, R.P.; Tang, L.J.; Ling, D.S. Face stability analysis of shallow shield tunnels in dry sandy ground using the discrete element method. Comput. Geotech. 2011, 38, 187–195. [Google Scholar] [CrossRef]
- Chen, R.P.; Tang, L.J.; Yin, X.S.; Chen, Y.M.; Bian, X.C. An improved 3D wedge-prism model for the face stability analysis of the shield tunnel in cohesionless soils. Acta Geotech. 2015, 10, 683–692. [Google Scholar] [CrossRef]
- Rui, R.; Tol, F.V.; Xia XLEekelen, S.V.; Hu, G.; Xia, Y.Y. Evolution of soil arching; 2D DEM simulations. Comput. Geotech. 2016, 73, 199–209. [Google Scholar] [CrossRef]
- Dewoolkar, M.M.; Santichaianant, K.; Ko, H.Y. Centrifuge modeling of granular soil response over active circular trapdoors. Soils Found. 2007, 47, 931–945. [Google Scholar] [CrossRef]
- Chevalier, B.; Combe, G.; Villard, P. Experimental and discrete element modeling studies of the trapdoor problem: Influence of the macro-mechanical frictional parameters. Acta Geotech. 2012, 7, 15–39. [Google Scholar] [CrossRef]
- Lu, D.C.; Dong, H.Y.; Lin, Q.T.; Guo, C.X.; Gao, Z.W.; Du, X.L. A method for characterizing the deformation localization in granular materials using the relative particle motion. Comput. Geotech. 2023, 156, 105262. [Google Scholar] [CrossRef]
- Shahin, H.M.; Nakai, T.; Ishii, K.; Iwata, T.; Kuroi, S. Investigation of influence of tunneling on existing building and tunnel: Model tests and numerical simulations. Acta Geotech. 2016, 11, 679–692. [Google Scholar] [CrossRef]
- Ritter, S.; Giardina, G.; DeJong, M.J.; Mair, R.J. Centrifuge modelling of building response to tunnel excavation. Int. J. Phys. Model. Geotech. 2018, 18, 146–161. [Google Scholar] [CrossRef]
- Lin, Q.T.; Lu, D.C.; Lei, C.M.; Tian, Y.; Kong, F.C.; Du, X.L. Mechanical response of existing tunnels for shield under-crossing in cobble strata based on the model test. Tunn. Undergr. Space Technol. 2022, 125, 104505. [Google Scholar] [CrossRef]
- Nakai, T.; Xu, L.; Yamazaki, H. 3D and 2D model tests and numerical analyses of settlements and earth pressures due to tunnel excavation. Soils Found. 1997, 37, 31–42. [Google Scholar] [CrossRef]
- Marshall, A.M.; Farrell, R.; Klar, A.; Mair, R. Tunnels in sands: The effect of size, depth and volume loss on greenfield displacements. Géotechnique 2012, 62, 385–399. [Google Scholar] [CrossRef]
- Lin, Q.T.; Lu, D.C.; Lei, C.M.; Tian, Y.; Gong, Q.M.; Du, X.L. Model test study on the stability of cobble strata during shield under-crossing. Tunn. Undergr. Space Technol. 2021, 110, 103807. [Google Scholar] [CrossRef]
- Miao, J.; Lu, D.; Lin, Q.; Kong, F.; Du, X. Time-dependent surrounding soil pressure and mechanical response of tunnel lining induced by surrounding soil viscosity. Sci. China Technol. Sci. 2021, 64, 2453–2468. [Google Scholar] [CrossRef]
- Zhang, J.Z.; Phoon, K.K.; Zhang, D.M.; Huang, H.W.; Tang, C. Novel approach to estimate vertical scale of fluctuation based on CPT data using convolutional neural networks. Eng. Geol. 2021, 294, 106342. [Google Scholar] [CrossRef]
- Zhang, J.Z.; Huang, H.W.; Zhang, D.M.; Phoon, K.K.; Liu, Z.Q.; Tang, C. Quantitative evaluation of geological uncertainty and its influence on tunnel structural performance using improved coupled Markov chain. Acta Geotech. 2021, 16, 3709–3724. [Google Scholar] [CrossRef]
- Lu, D.C.; Ma, Y.D.; Kong, F.C.; Guo, C.X.; Miao, J.B.; Du, X.L. Support vector regression with heuristic optimization algorithms for predicting the ground surface displacement induced by EPB shield tunnelling. Gondwana Res. 2022. [Google Scholar] [CrossRef]
- Kong, F.C.; Lu, D.C.; Ma, Y.D.; Li, J.L.; Tian, T. Analysis and intelligent prediction for displacement of stratum and tunnel lining by shield tunnel excavation in complex geological conditions: A case study. IEEE Trans. Intell. Transp. Syst. 2022, 23, 22206–22216. [Google Scholar] [CrossRef]
- Kong, F.C.; Lu, D.C.; Ma, Y.C.D.; Tian, T.; Yu, H.T.; Du, X.L. Novel hybrid method to predict the ground-displacement field caused by shallow tunnel excavation. Sci. China-Technol. Sci. 2023, 66, 101–114. [Google Scholar] [CrossRef]
- Wang, F.; Miao, L.C.; Yang, X.M.; Du, Y.J.; Liang, F.Y. The Volume of Settlement Trough Change with Depth Caused by Tunneling in Sands. J. Civ. Eng. KSCE 2016, 20, 2719–2724. [Google Scholar] [CrossRef]
- Zheng, G.; Dai, X.; Diao, Y.; Zeng, C.F. Experimental and simplified model study of the development of ground settlement under hazards induced by loss of groundwater and sand. Nat. Hazards 2016, 82, 1869–1893. [Google Scholar] [CrossRef]
- Zhou, M.; Wang, F.; Du, Y.J.; Liu, M.D. Laboratory evaluation of buried high-density polyethylene pipes subjected to localized ground subsidence. Acta Geotech. 2019, 14, 1081–1099. [Google Scholar] [CrossRef]
- Peck, R.B. Deep excavations and tunnelling in soft ground. In Proceedings of the 7th International Conference on Soil Mechanics and Foundation Engineering, State of the Art Volume, Mexico City, Mexico; 1969; pp. 225–290. [Google Scholar]
- Mair, R.J.; Taylor, R.N.; Bracegirdle, A. Subsurface settlement profiles above tunnels in clays. Géotechnique 1993, 43, 315–320. [Google Scholar] [CrossRef]
- Lu, D.; Kong, F.; Du, X.; Shen, C.; Gong, Q.; Li, P. A unified displacement function to analytically predict ground deformation of shallow tunnel. Tunn. Undergr. Space Technol. 2019, 88, 129–143. [Google Scholar] [CrossRef]
- Lu, D.C.; Lin, Q.T.; Tian, Y.; Du, X.L.; Gong, Q.M. Formula for predicting ground settlement induced by tunnelling based on Gaussian function. Tunn. Undergr. Space Technol. 2020, 103, 103443. [Google Scholar] [CrossRef]
- Lin, Q.T.; Tian, Y.; Lu, D.C.; Gong, Q.M.; Du, X.L.; Gao, Z.W. A prediction method of ground volume loss variation with depth induced by tunnel excavation. Acta Geotech. 2021, 16, 3689–3707. [Google Scholar] [CrossRef]
- Celestino, T.B.; Gomes, R.A.M.P.; Bortolucci, A.A. Errors in ground distortions due to settlement trough adjustment. Tunn. Undergr. Space Technol. 2000, 15, 97–100. [Google Scholar] [CrossRef]
- Grant, R.J.; Taylor, R.N. Tunnelling-induced ground movements in clay. ICE Proc. Geotech. Eng. 2000, 143, 43–55. [Google Scholar] [CrossRef]
- Huang, Z.K.; Zhang, D.M.; Pitilakis, K.; Tsinidis, G.; Huang, H.W.; Zhang, D.M.; Argyroudis, S. Resilience assessment of tunnels: Framework and application for tunnels in alluvial deposits exposed to seismic hazard. Soil Dyn. Earthq. Eng. 2022, 162, 107456. [Google Scholar] [CrossRef]
- Li, Y.J.; Zhang, D.L.; Fang, Q.; Yu, Q.C.; Xia, L. A physical and numerical investigation of the failure mechanism of weak rocks surrounding tunnels. Comput. Geotech. 2014, 61, 292–307. [Google Scholar] [CrossRef]
- Escario, V.; Juca, F.T. Strength and deformation partly saturated soils. In Proceedings of the 12th International Conference of Soil Mechanics and Foundation Engineering, Rio de Janeiro, Brazil, 13–18 August 1989; pp. 43–46. [Google Scholar]
- Lu, N.; Wu, B.; Tan, C.P. Tensile strength characteristics of unsaturated sands. Journal of Geotechnical and Geoenvironmental Engineering. ASCE 2007, 133, 144–154. [Google Scholar]
- Kim, T.H.; Sture, S. Capillary-induced tensile strength in unsaturated sands. Can. Geotech. J. 2008, 45, 726–737. [Google Scholar] [CrossRef]
- Escario, V.; Sàez, J. The shear strength of partly saturated soils. Géotechnique 1986, 3, 453–456. [Google Scholar] [CrossRef]
- Karube, D. New concept of effective stress in unsaturated soil and its proving test. In Advanced Triaxial Testing of Soil and Rock; American Society for Testing and Materials: Philadelphia, PA, USA, 1988; pp. 539–552. [Google Scholar]
- Drumright, E.E. The Contribution of Matric Suction to the Shear Strength of Unsaturated Soils. Ph.D. Thesis, Colorado State University, Fort Collins, CO, USA, 1989. [Google Scholar]
- Lin, Q.T.; Zhu, J.M.; Kang, Y. Active spatial earth pressure behind retaining wall considering arching effects of soil. Chin. J. Rock Mech. Eng. 2015, 34, 1918–1927. [Google Scholar]
- Zhu, J.M.; Lin, Q.T.; Gao, X.J.; Gao, L.S. Research on space earth pressure behind retaining wall adjacent to existing basements exterior wall. Rock Soil Mech. 2016, 37, 3417–3426. [Google Scholar]
Figure 1.
Front view of the model.
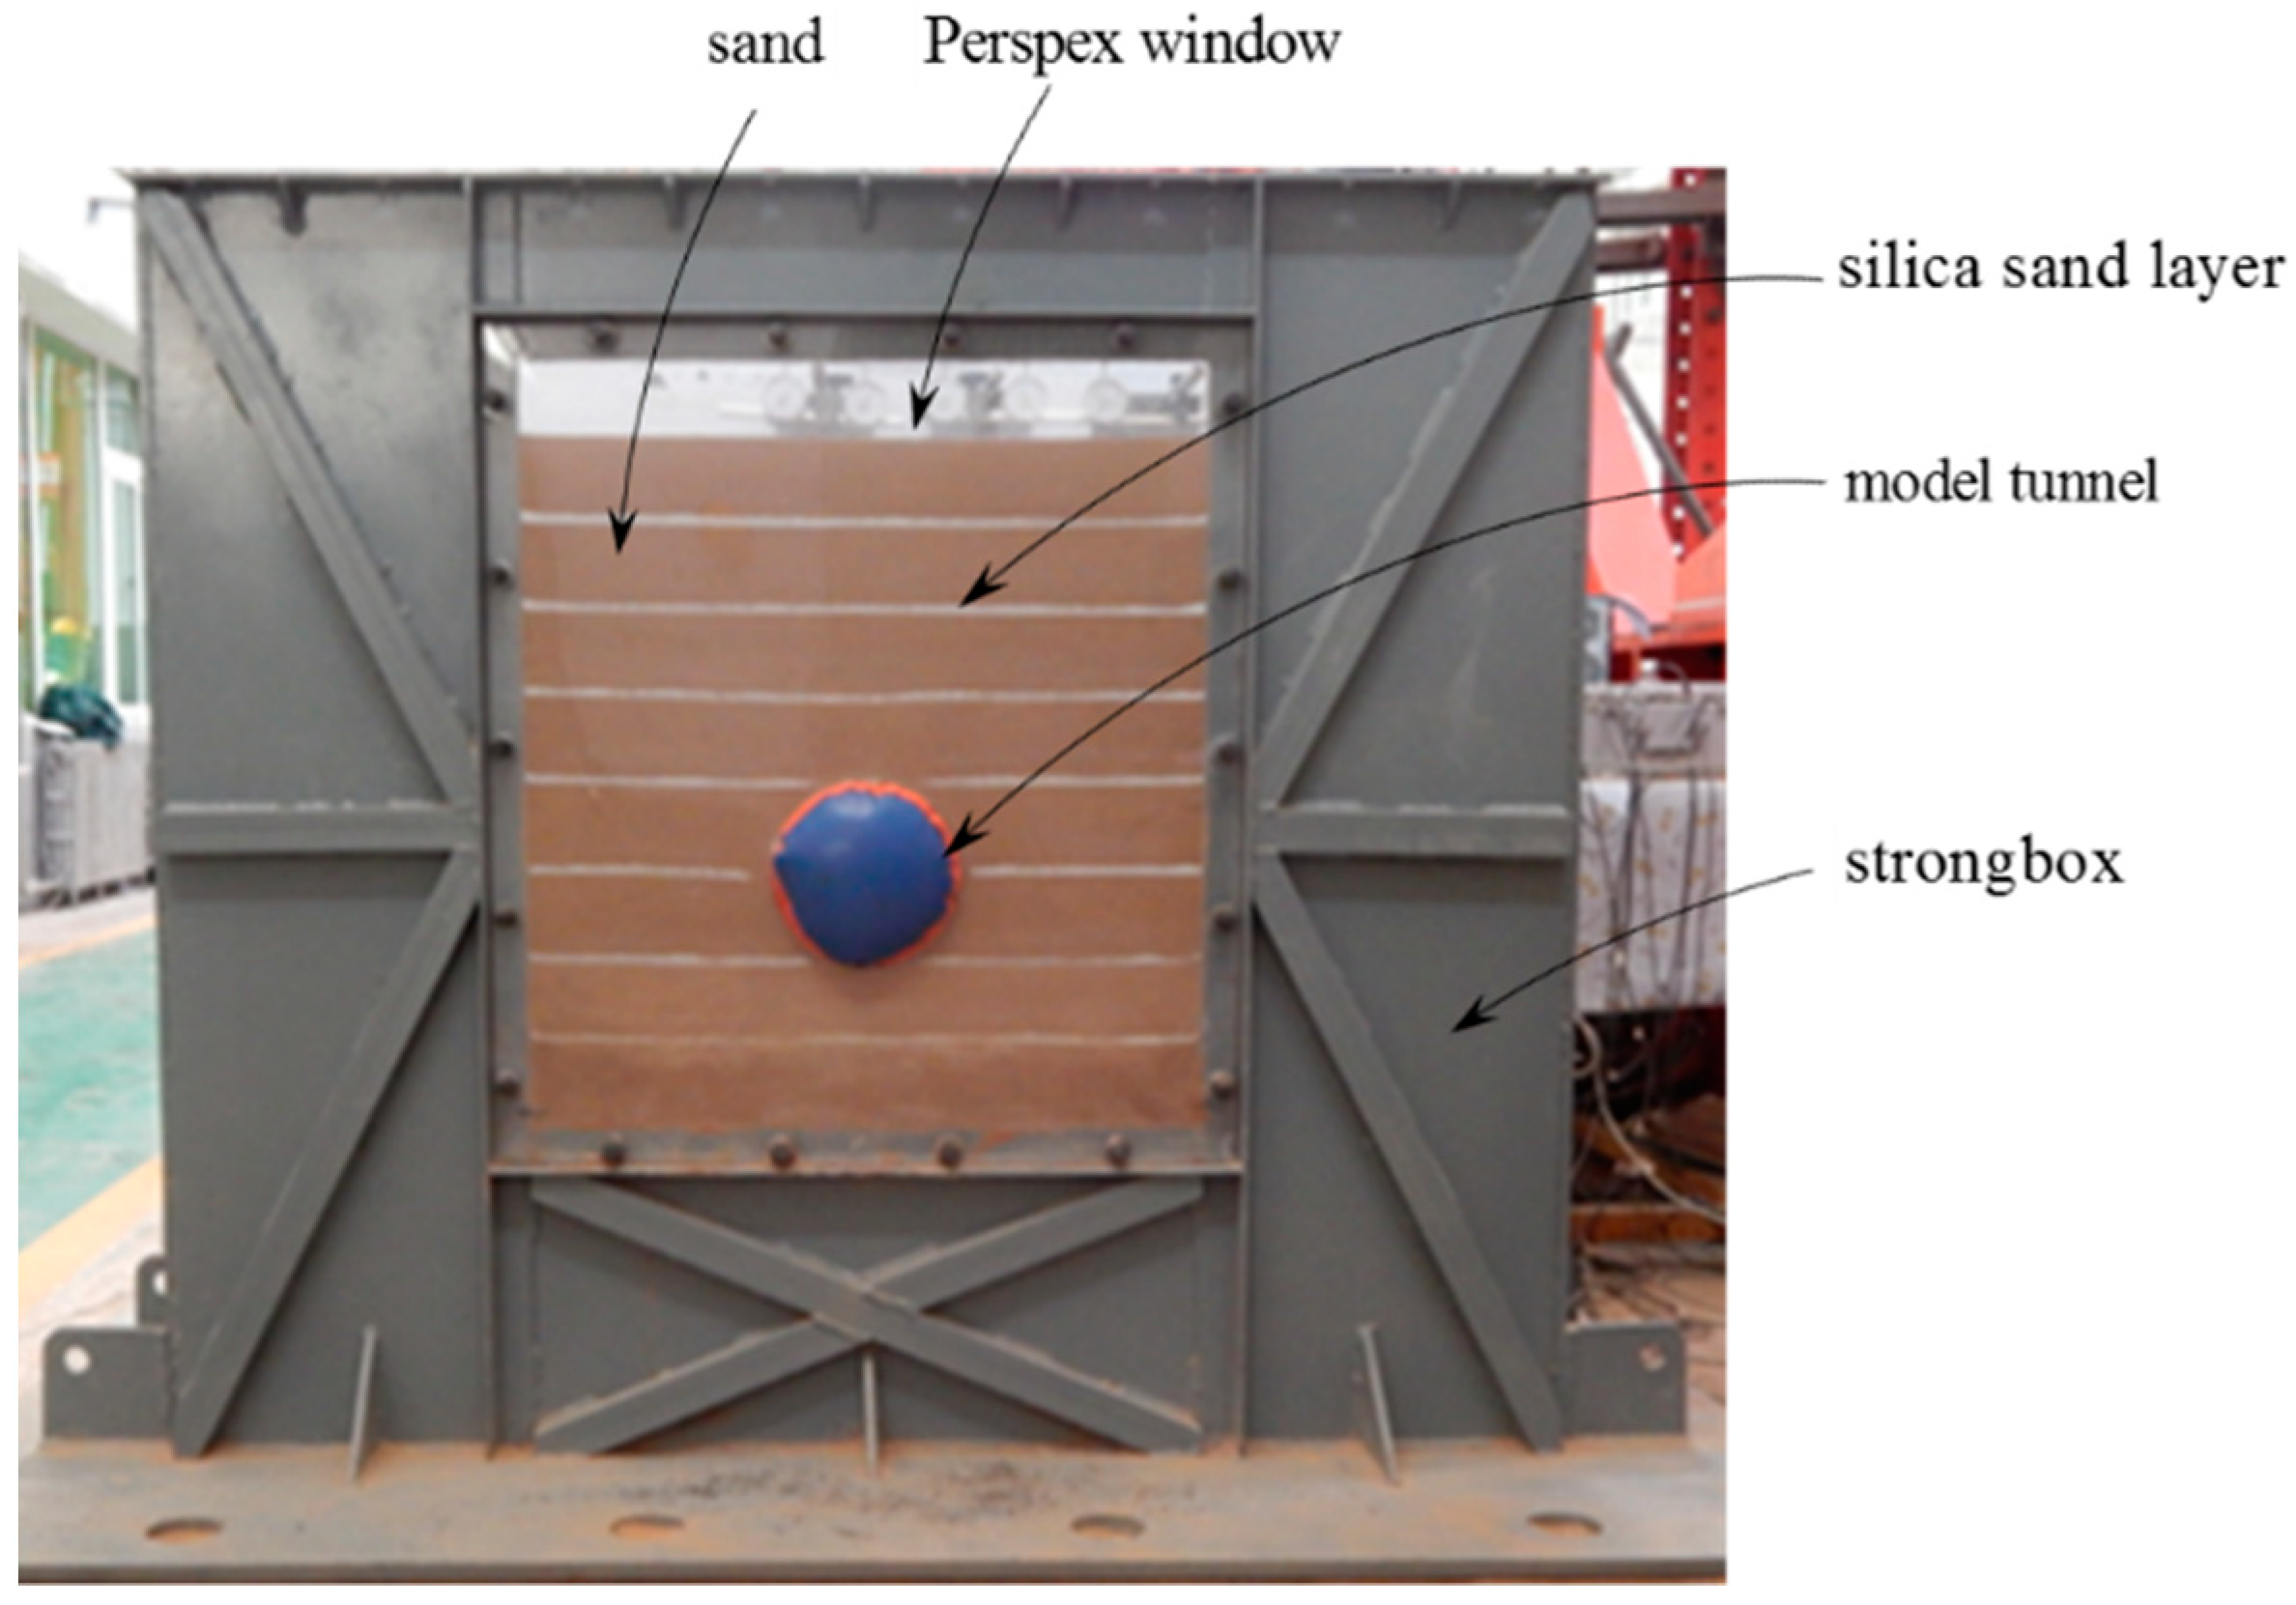
Figure 2.
Dimensions of the model strongbox.

Figure 3.
Model tunnel. (a) The vertical central plane A-A; (b) Cross-section of model tunnel; (c) Image of the model tunnel.
Figure 3.
Model tunnel. (a) The vertical central plane A-A; (b) Cross-section of model tunnel; (c) Image of the model tunnel.
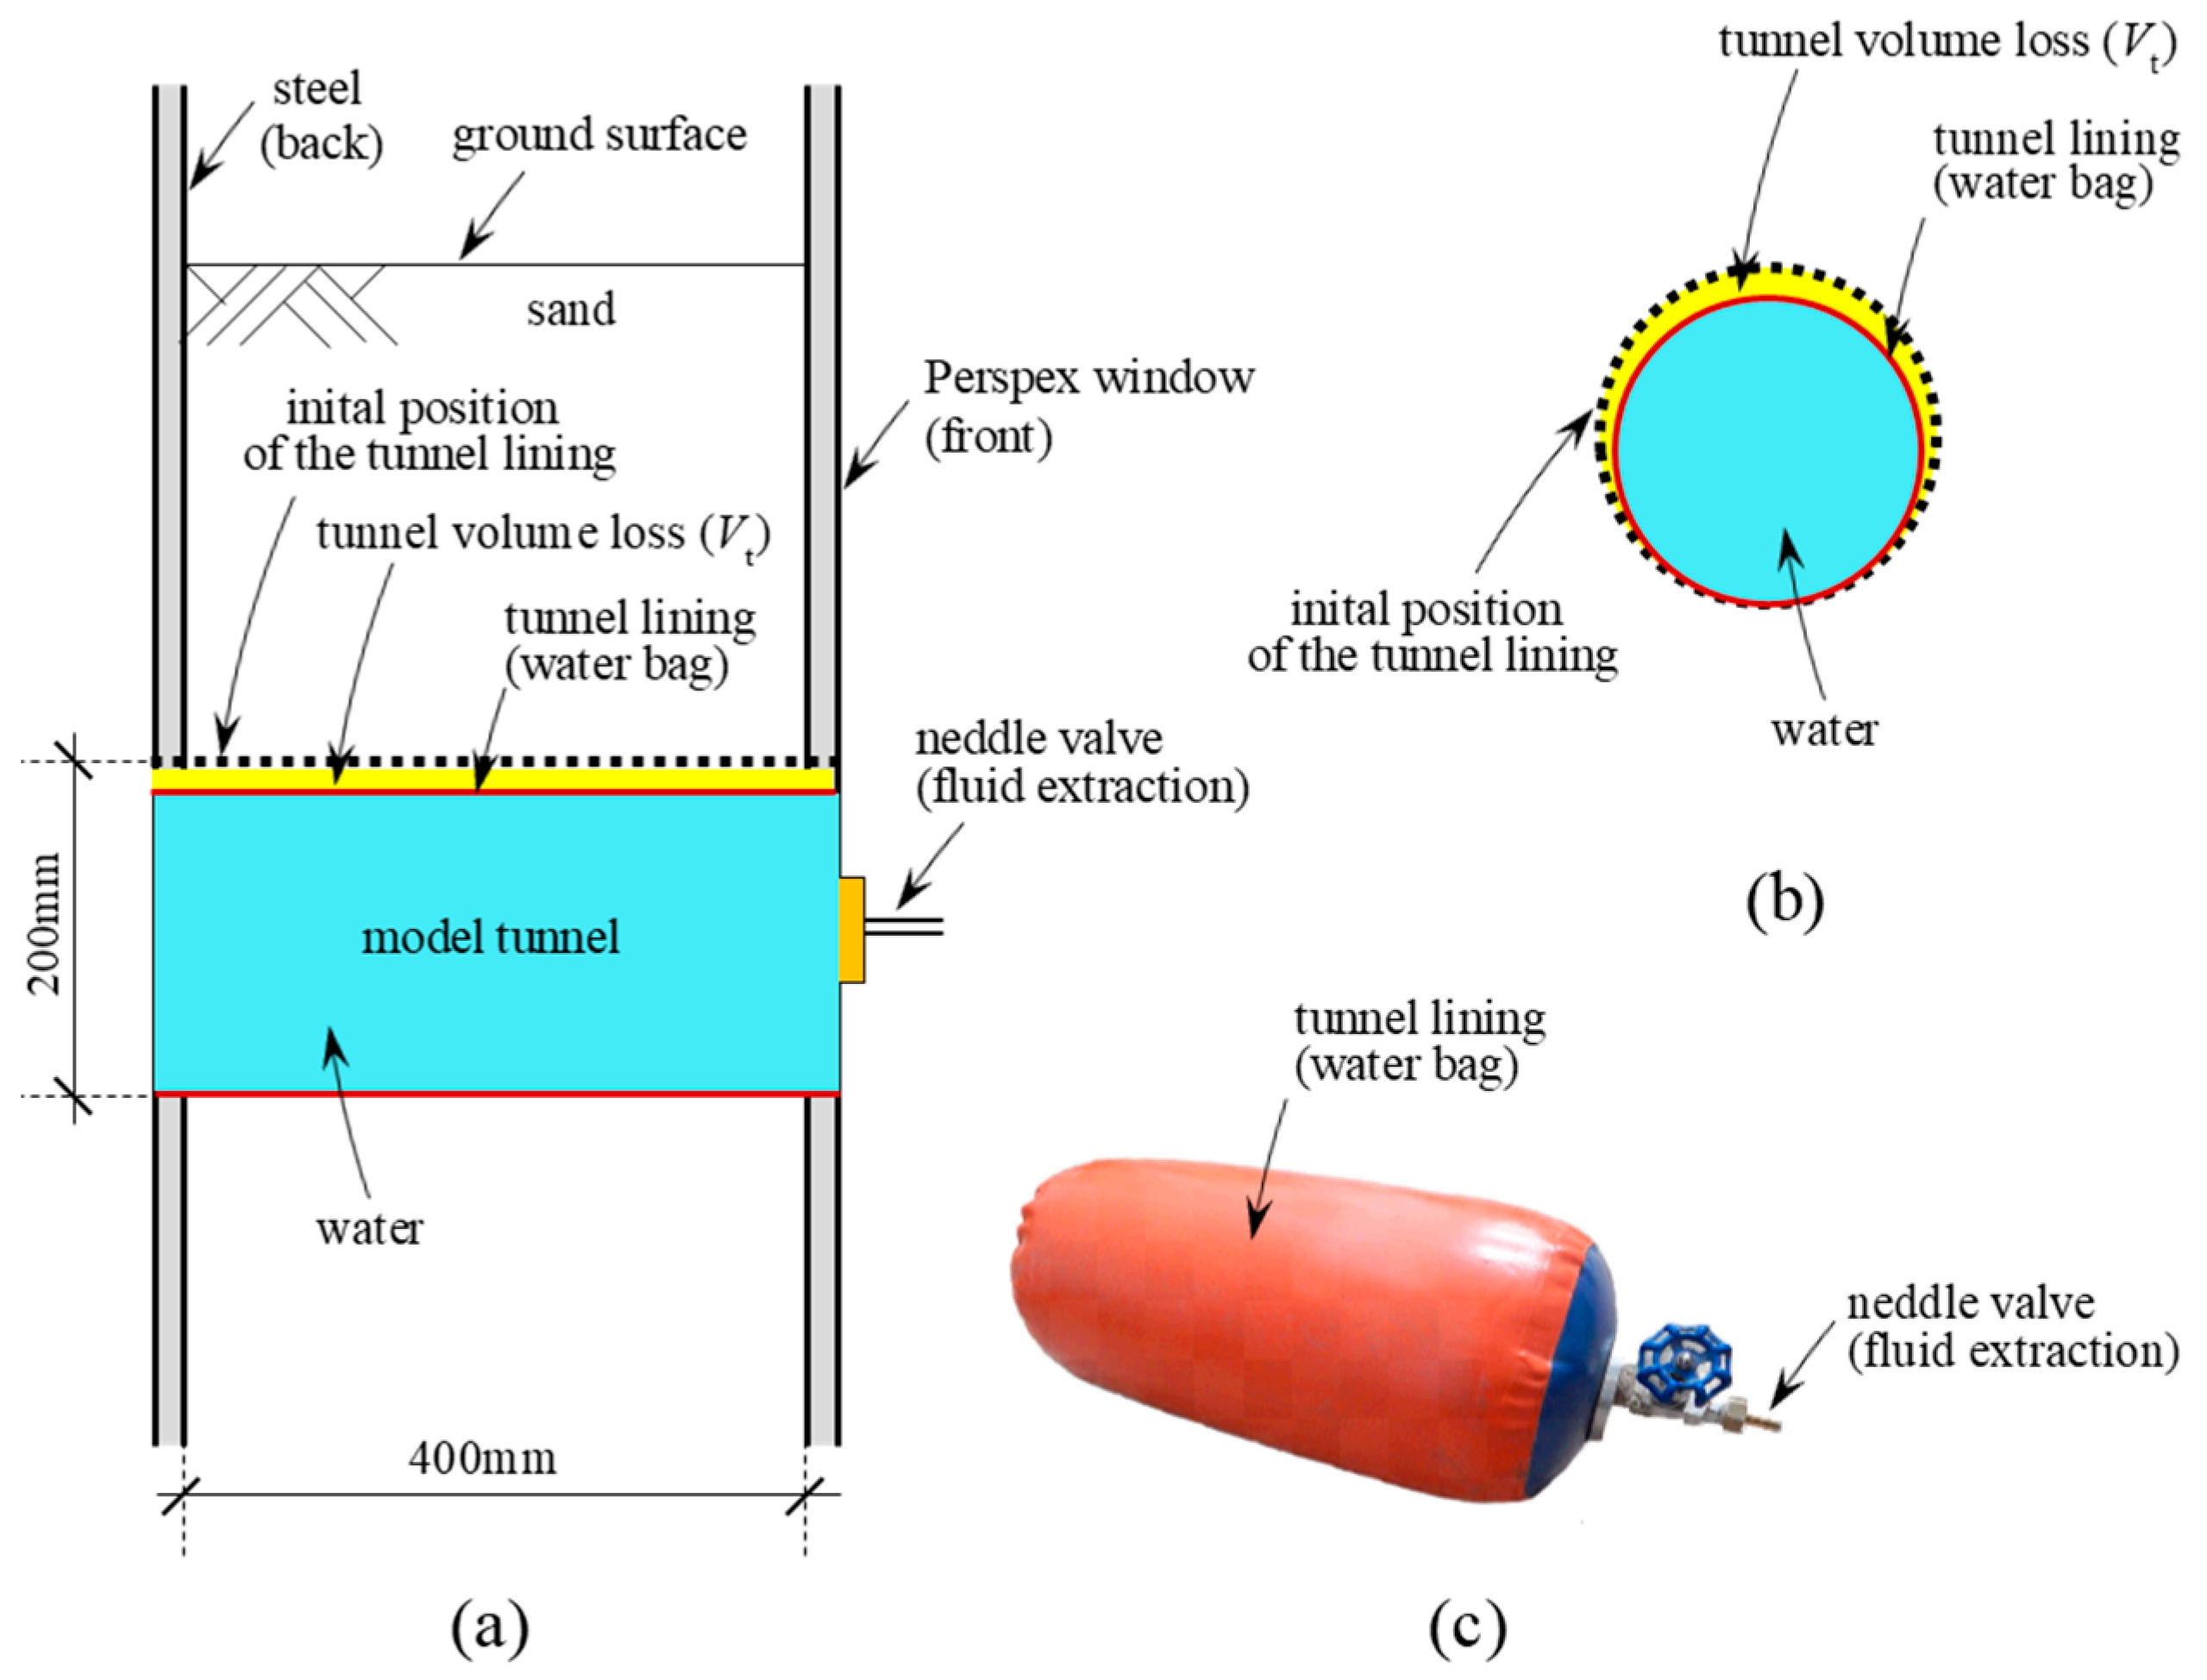
Figure 4.
DSCM monitoring system.
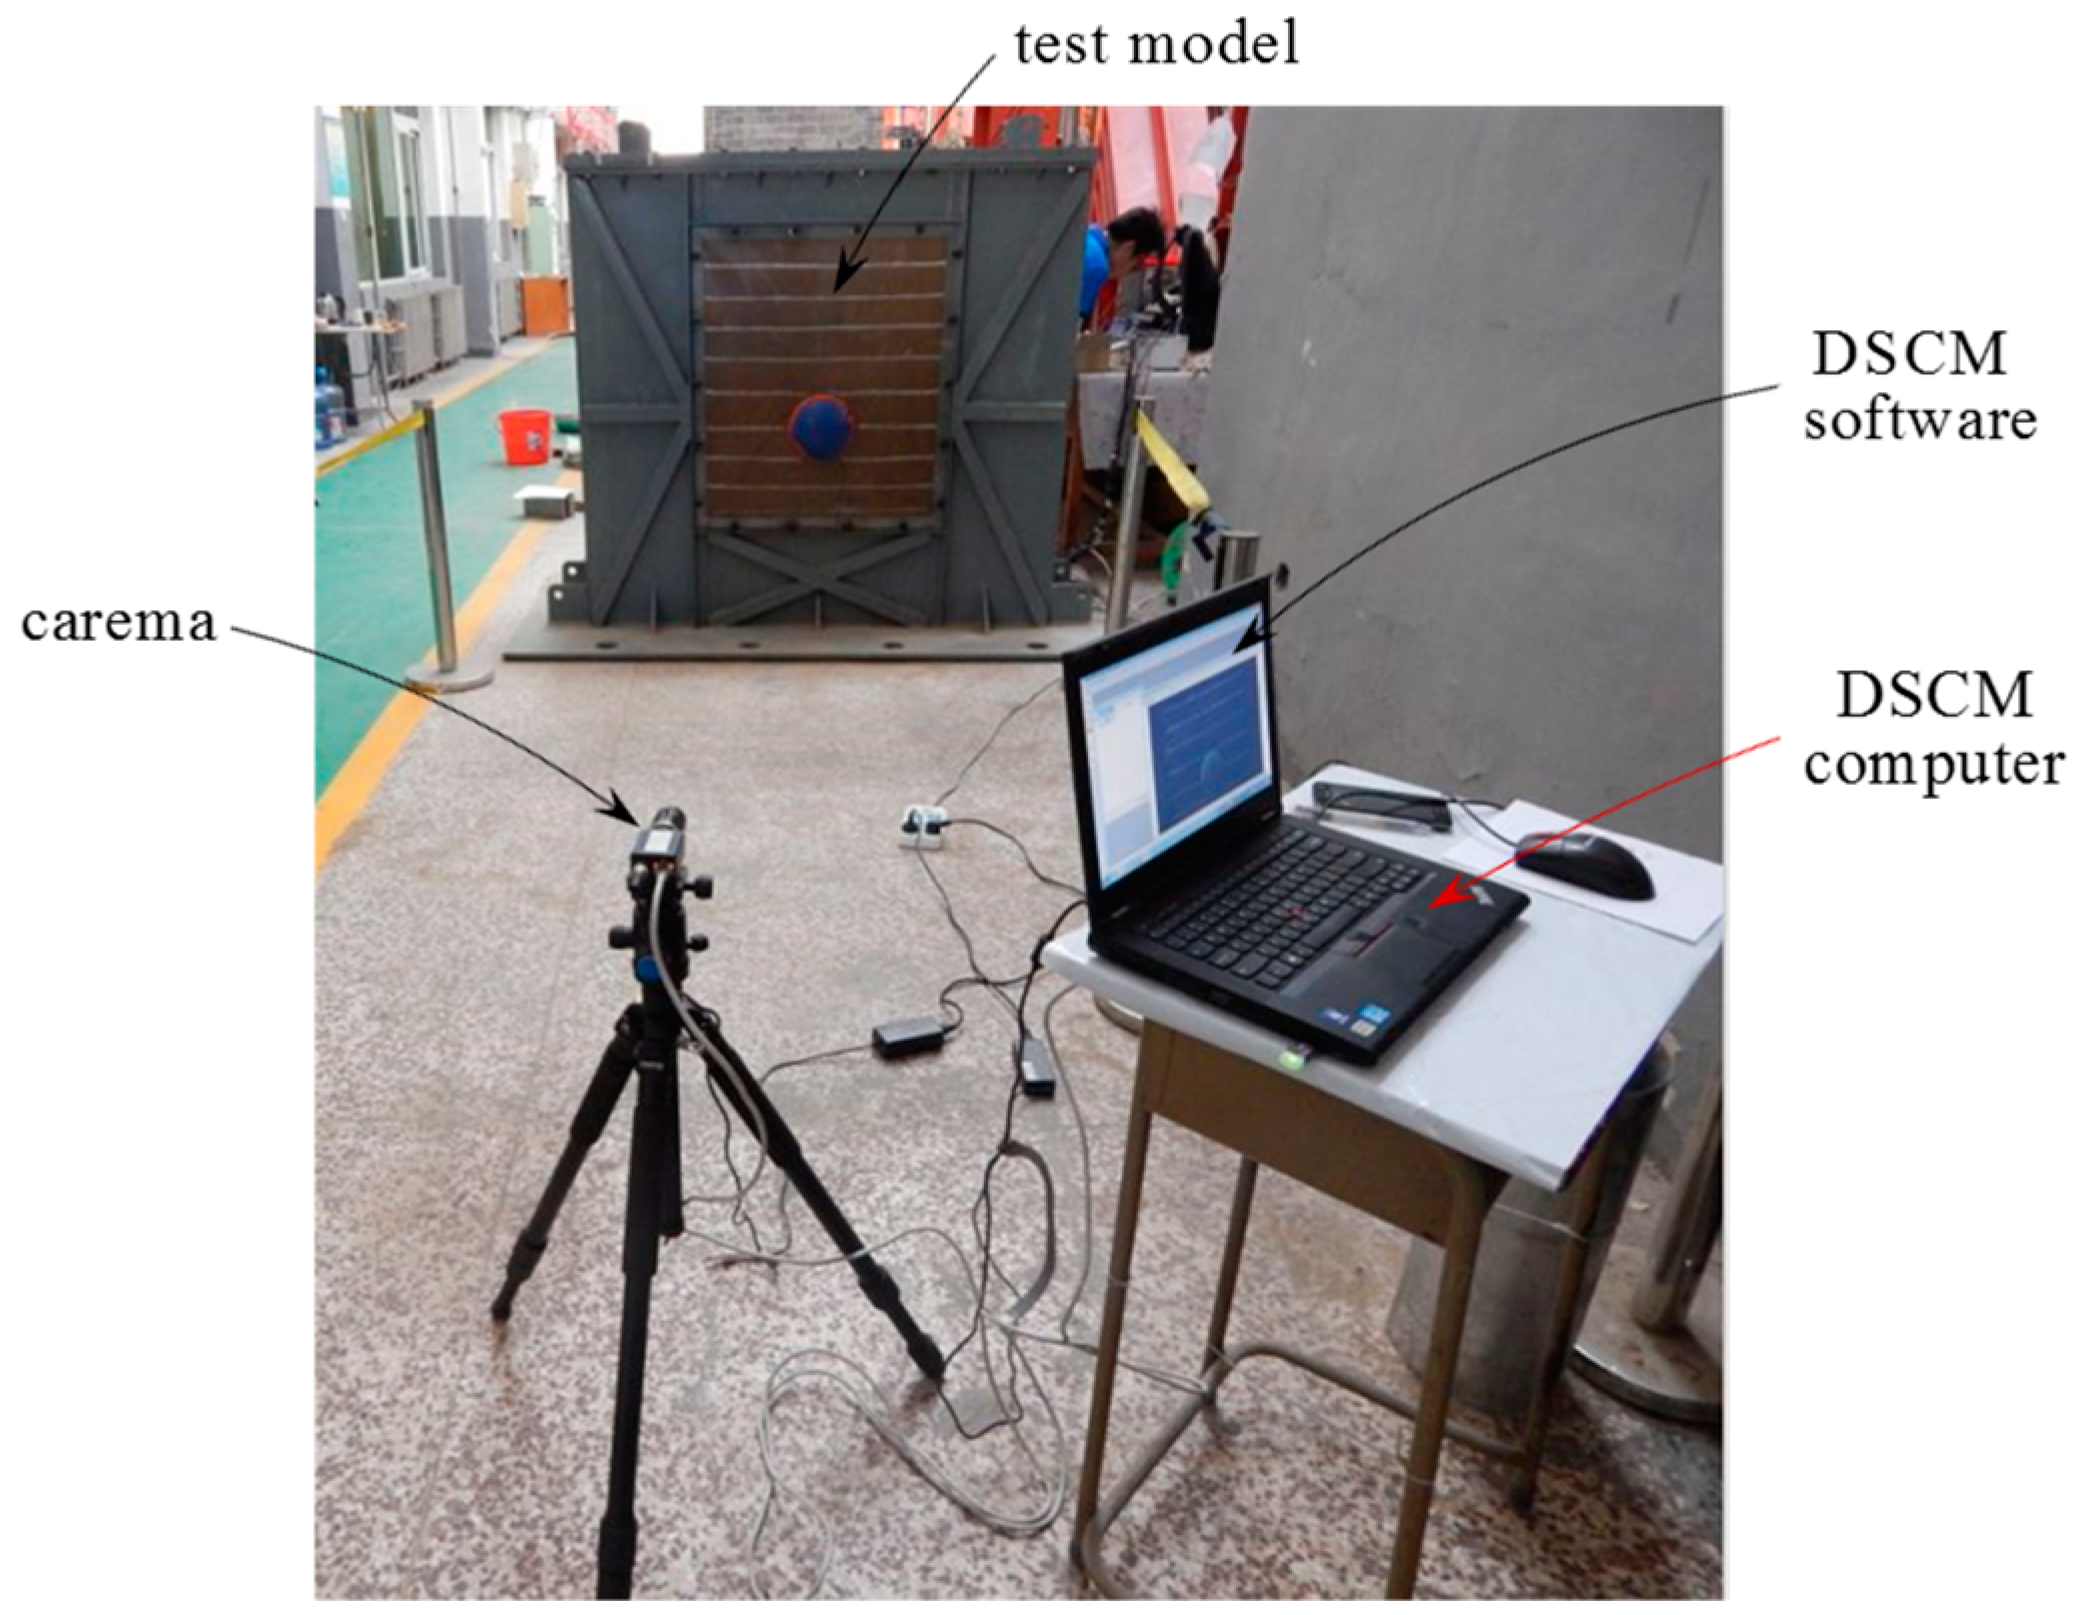
Figure 5.
Monitoring of the surface settlement. (a) Arrangement of the dial indicator; (b) installation details of the dial indicator.
Figure 5.
Monitoring of the surface settlement. (a) Arrangement of the dial indicator; (b) installation details of the dial indicator.
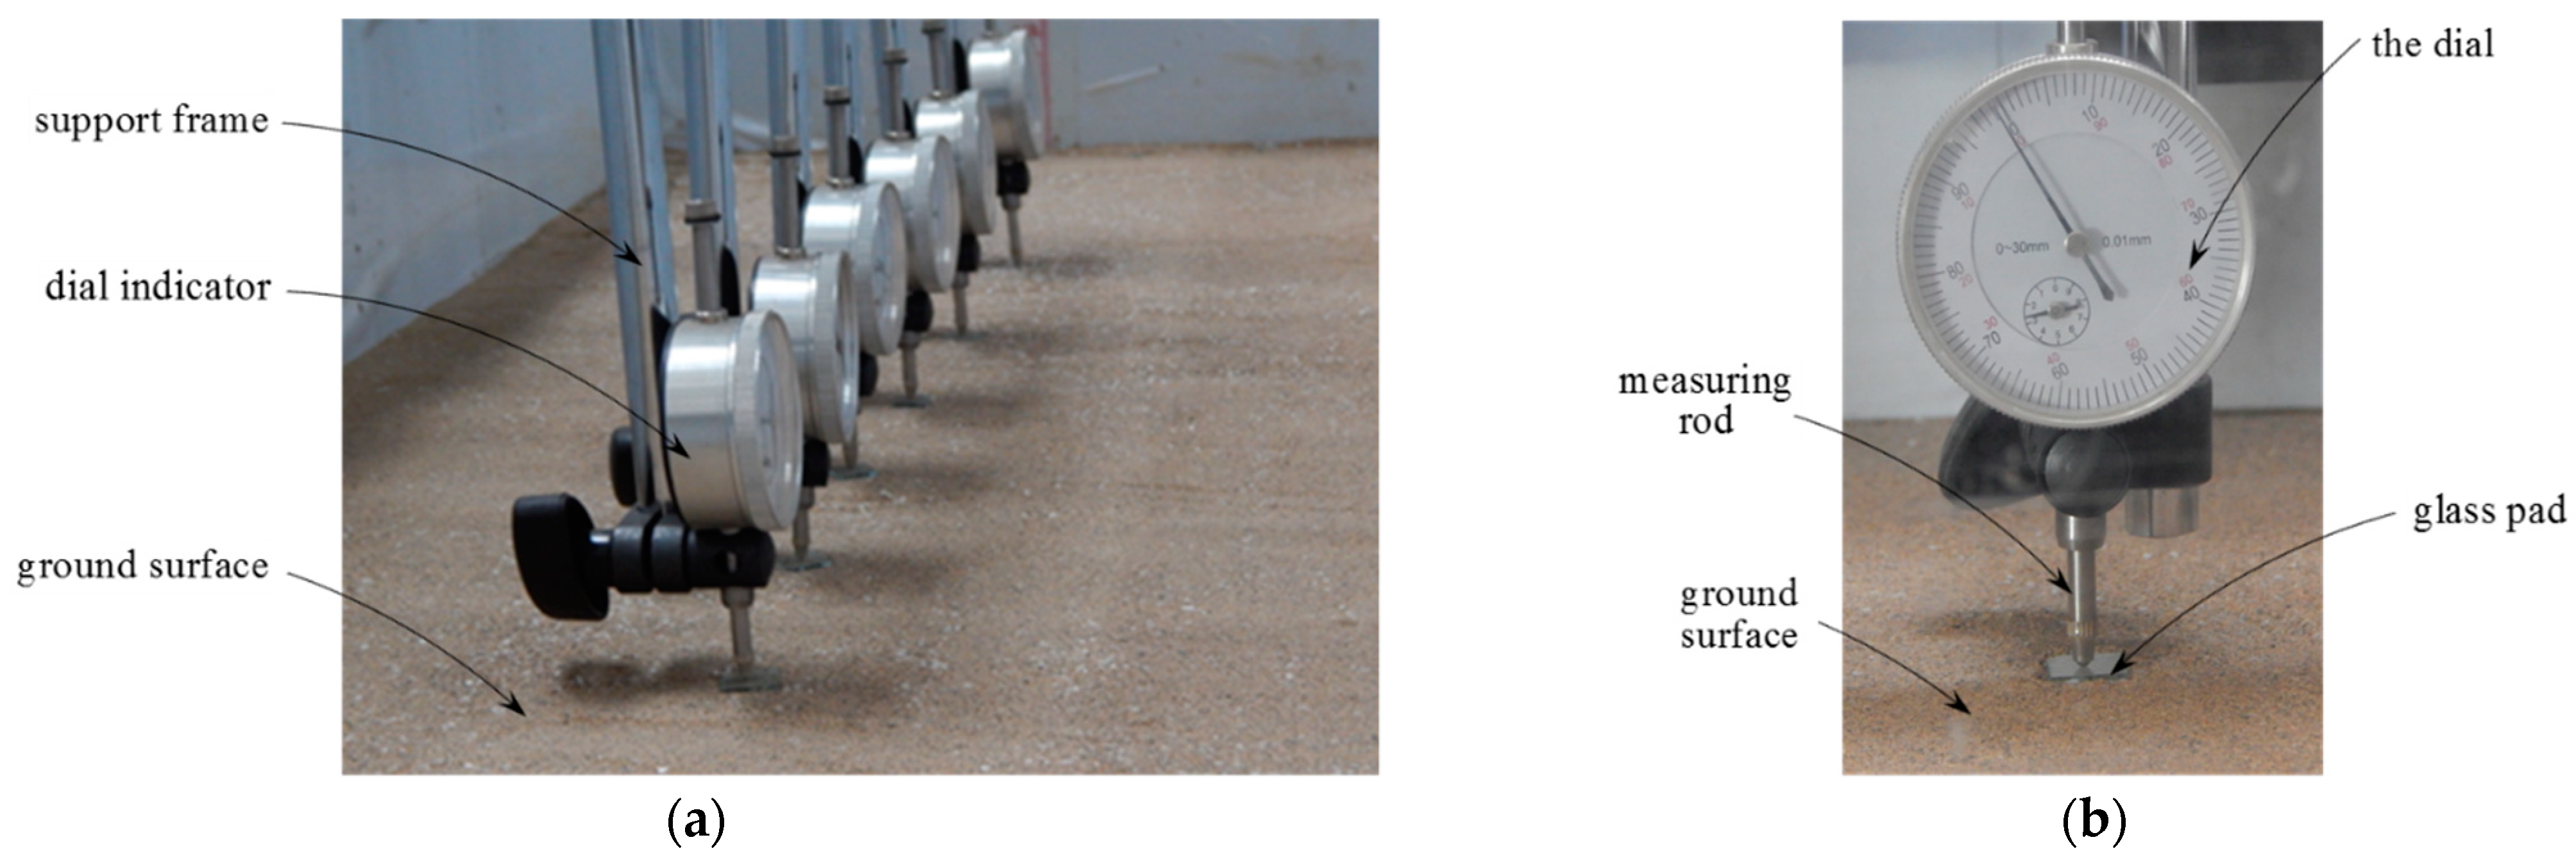
Figure 6.
Grading curve of sandy soil.
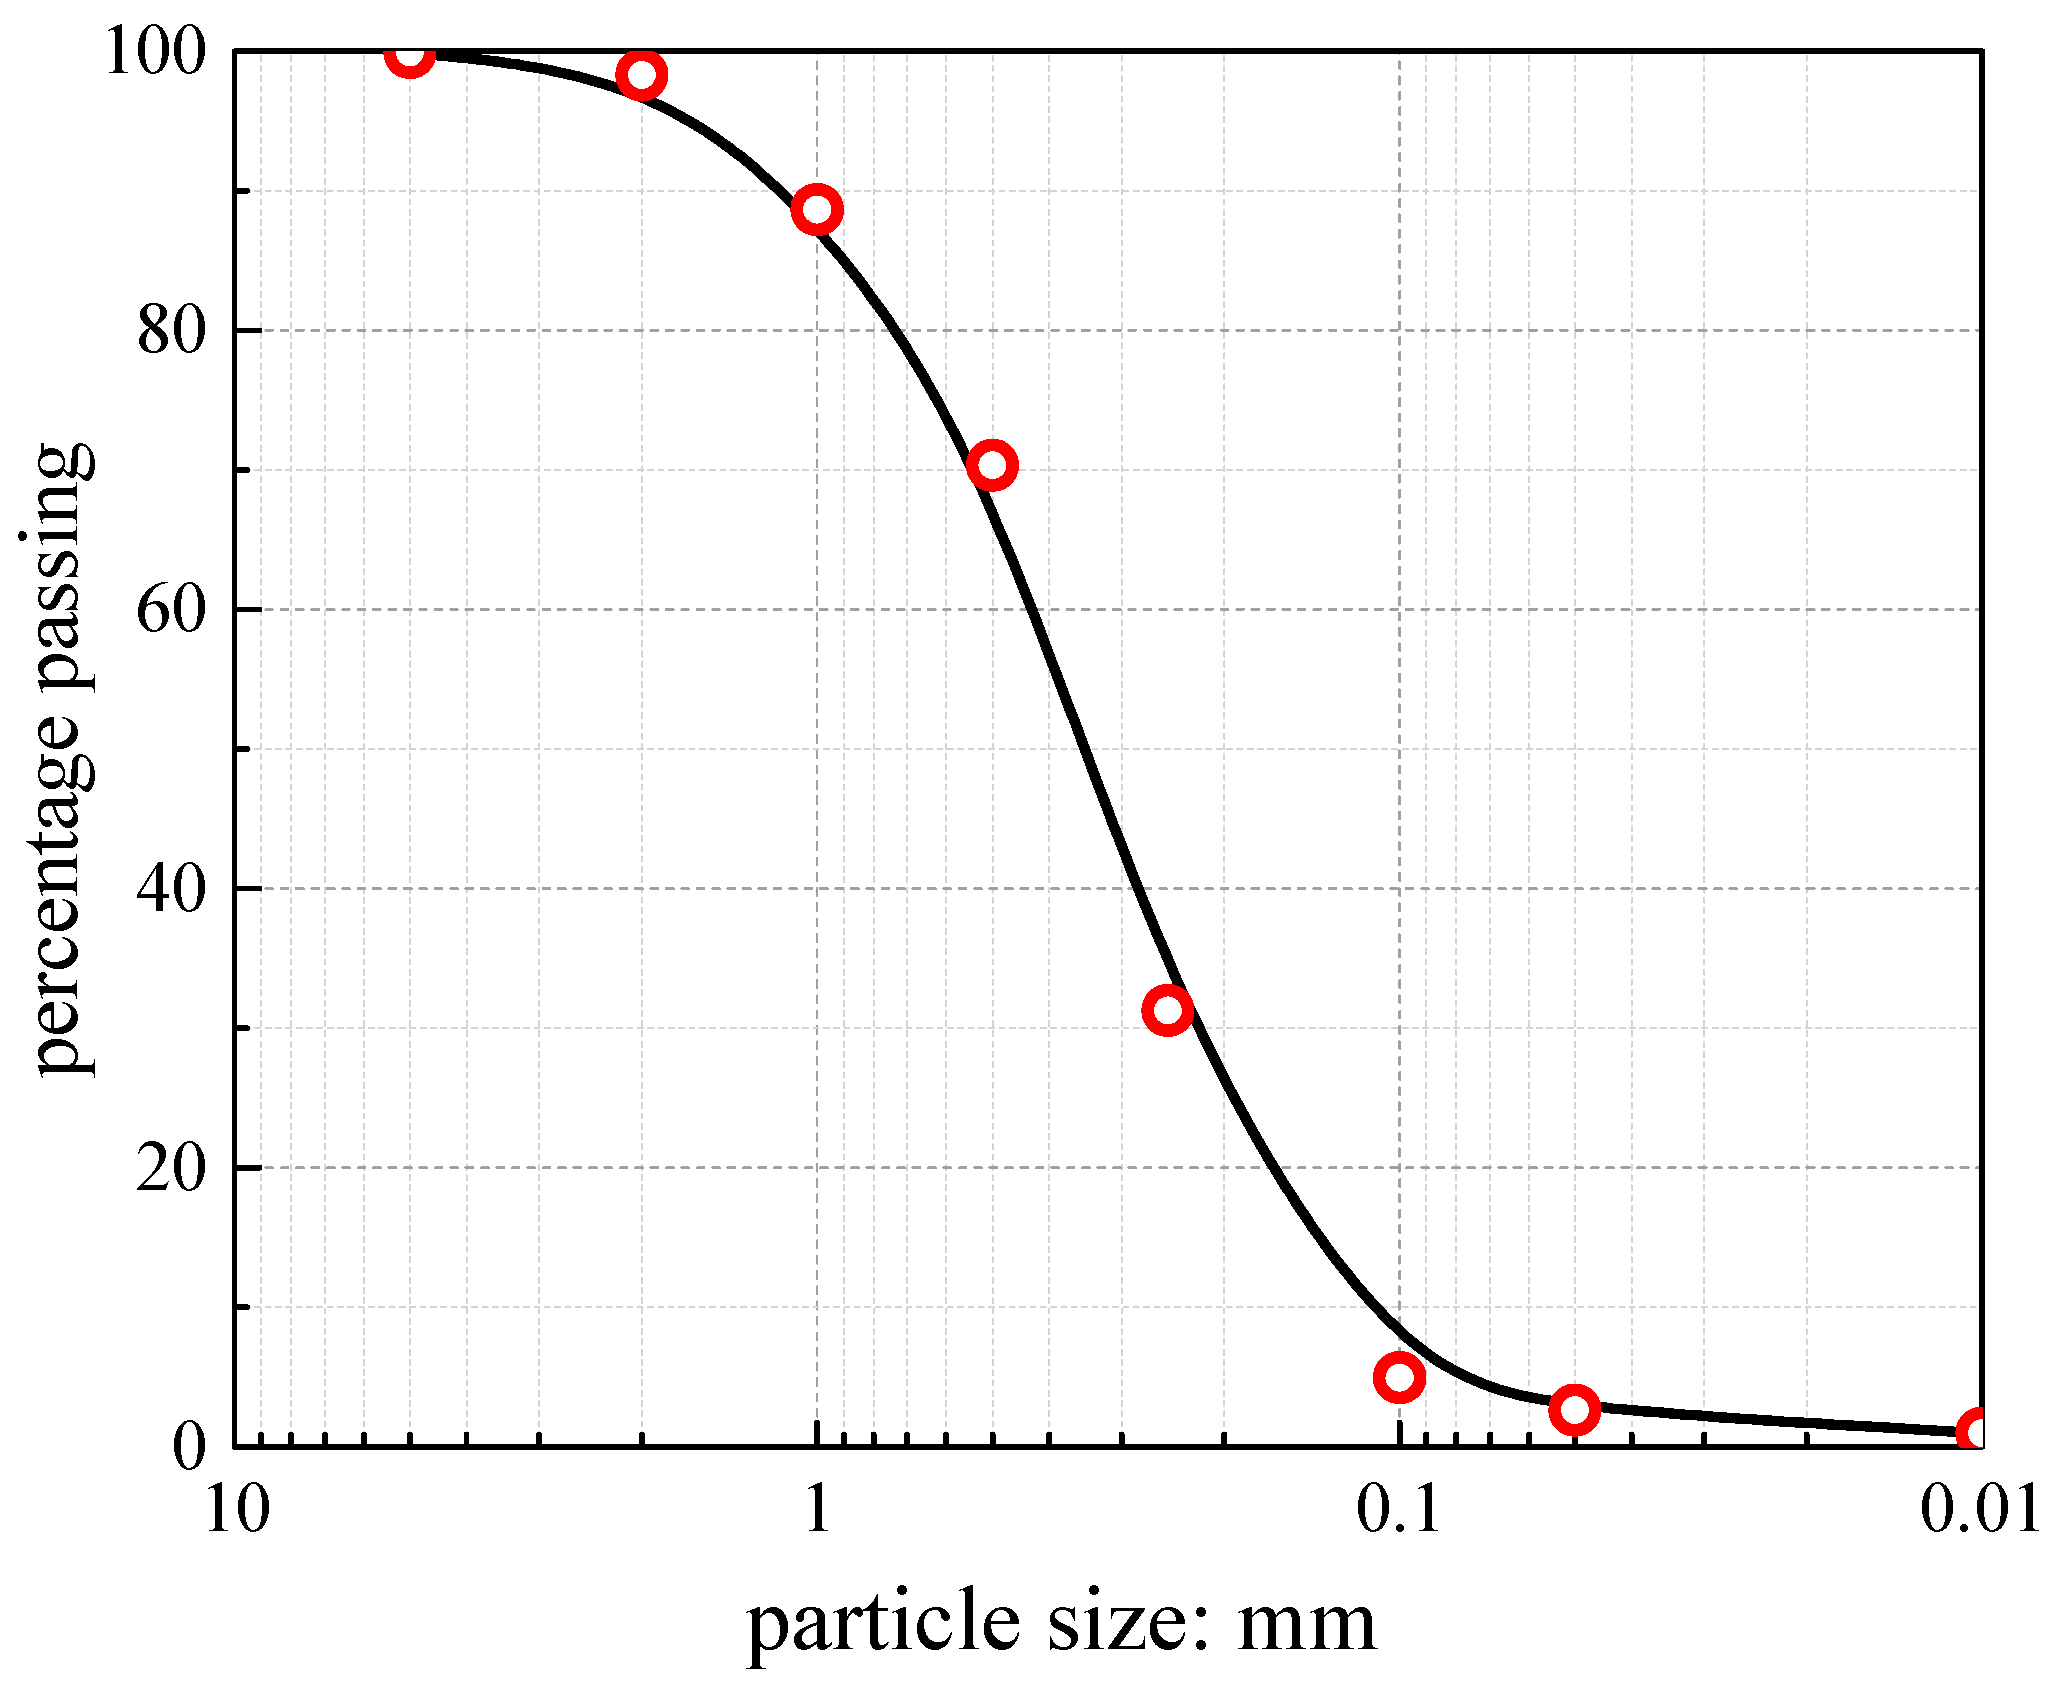
Figure 7.
Relationship between the shear strength and the vertical pressure.

Figure 8.
Maximum surface settlement with the tunnel volume loss Vt. (a) The arching mode; (b) the collapsing mode.
Figure 8.
Maximum surface settlement with the tunnel volume loss Vt. (a) The arching mode; (b) the collapsing mode.

Figure 9.
Development of failure surface for the arching mode (T103). (a) The failure surface does not occur; (b) the failure surface S1 occurs; (c) the failure surface S2 occurs; (d) the failure surface S3 occurs.
Figure 9.
Development of failure surface for the arching mode (T103). (a) The failure surface does not occur; (b) the failure surface S1 occurs; (c) the failure surface S2 occurs; (d) the failure surface S3 occurs.

Figure 10.
Development of failure surface for the collapsing mode (T202). (a) The failure surface extends to the ground surface; (b) a sliding block forms; (c) the sliding block moves downward when Vt = 6.60%; (d) the sliding block moves downward when Vt = 7.26%.
Figure 10.
Development of failure surface for the collapsing mode (T202). (a) The failure surface extends to the ground surface; (b) a sliding block forms; (c) the sliding block moves downward when Vt = 6.60%; (d) the sliding block moves downward when Vt = 7.26%.
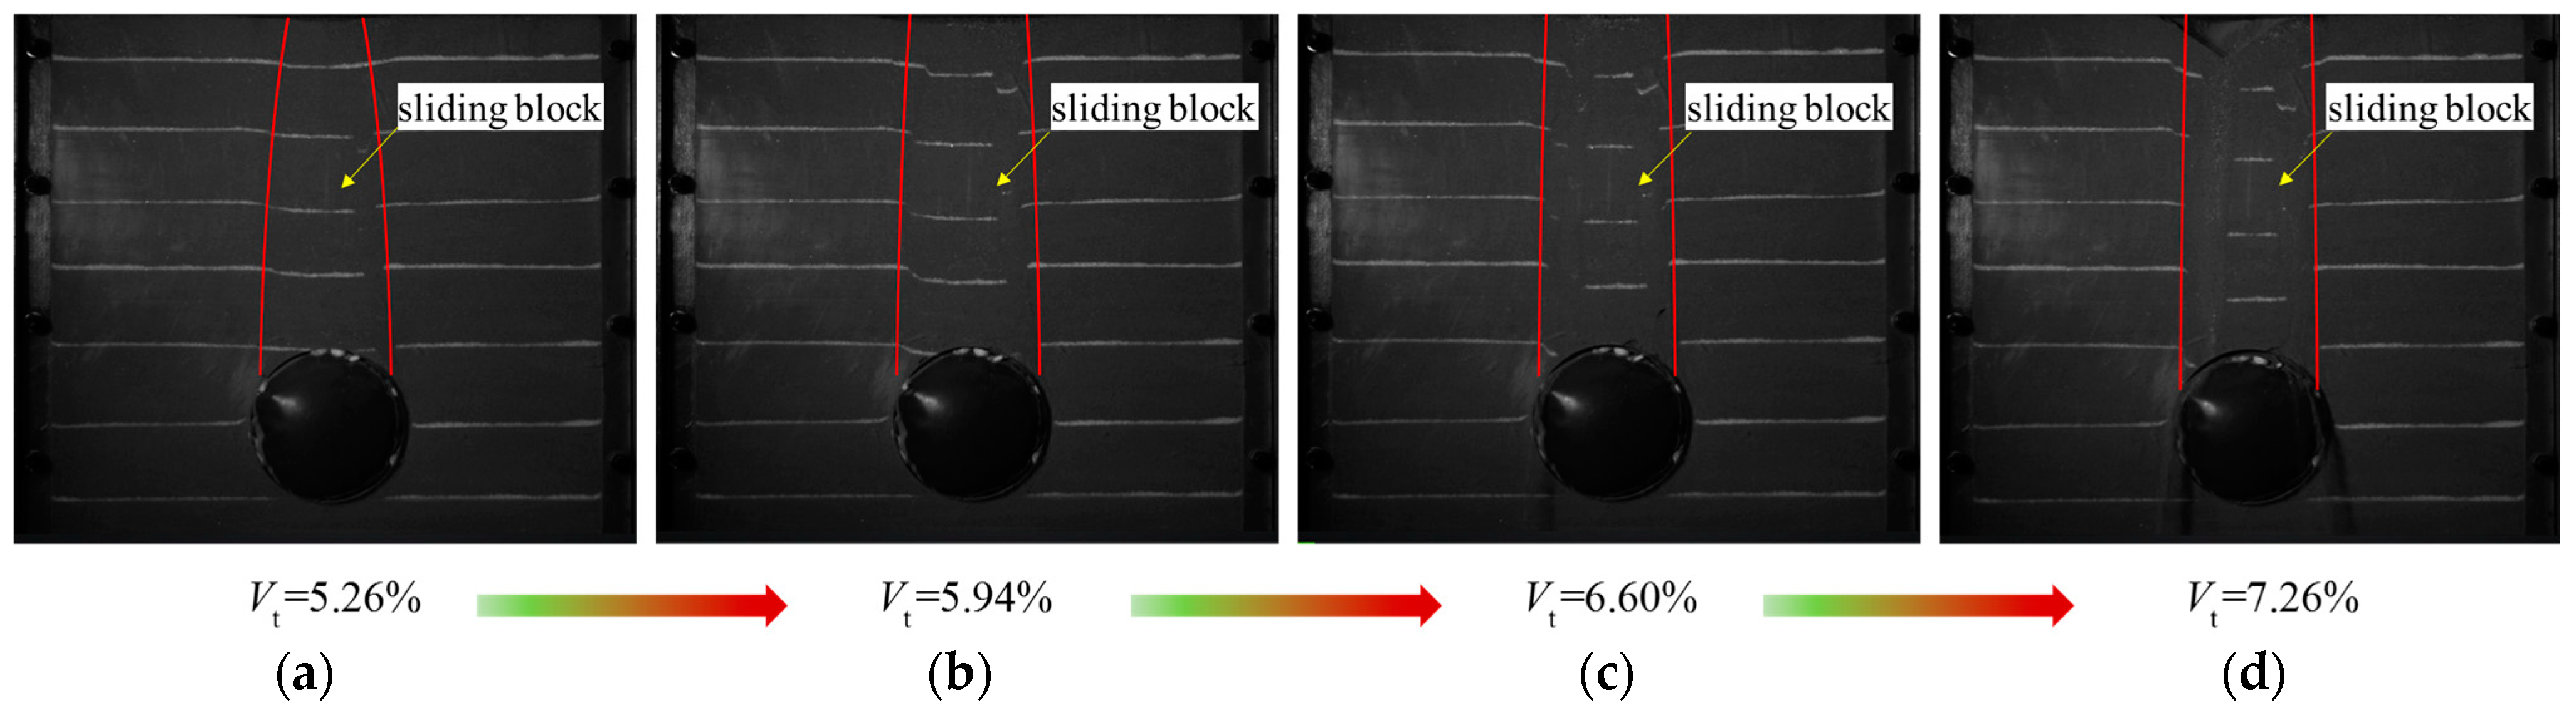
Figure 11.
Ground settlement contours before the ground surface settlement becomes stable in the arching mode (T103) (a) Vt = 0.66% (b) Vt = 1.32%.
Figure 11.
Ground settlement contours before the ground surface settlement becomes stable in the arching mode (T103) (a) Vt = 0.66% (b) Vt = 1.32%.

Figure 12.
Ground settlement contours before the ground surface settlement increases sharply in collapsing mode (T202); (a) Vt = 0.66%; (b) Vt = 1.32%; (c) Vt = 1.97% (d) Vt = 2.63% (e) Vt = 3.29% (f) Vt = 3.95% (g) Vt = 4.61% (h) Vt = 5.26%.
Figure 12.
Ground settlement contours before the ground surface settlement increases sharply in collapsing mode (T202); (a) Vt = 0.66%; (b) Vt = 1.32%; (c) Vt = 1.97% (d) Vt = 2.63% (e) Vt = 3.29% (f) Vt = 3.95% (g) Vt = 4.61% (h) Vt = 5.26%.
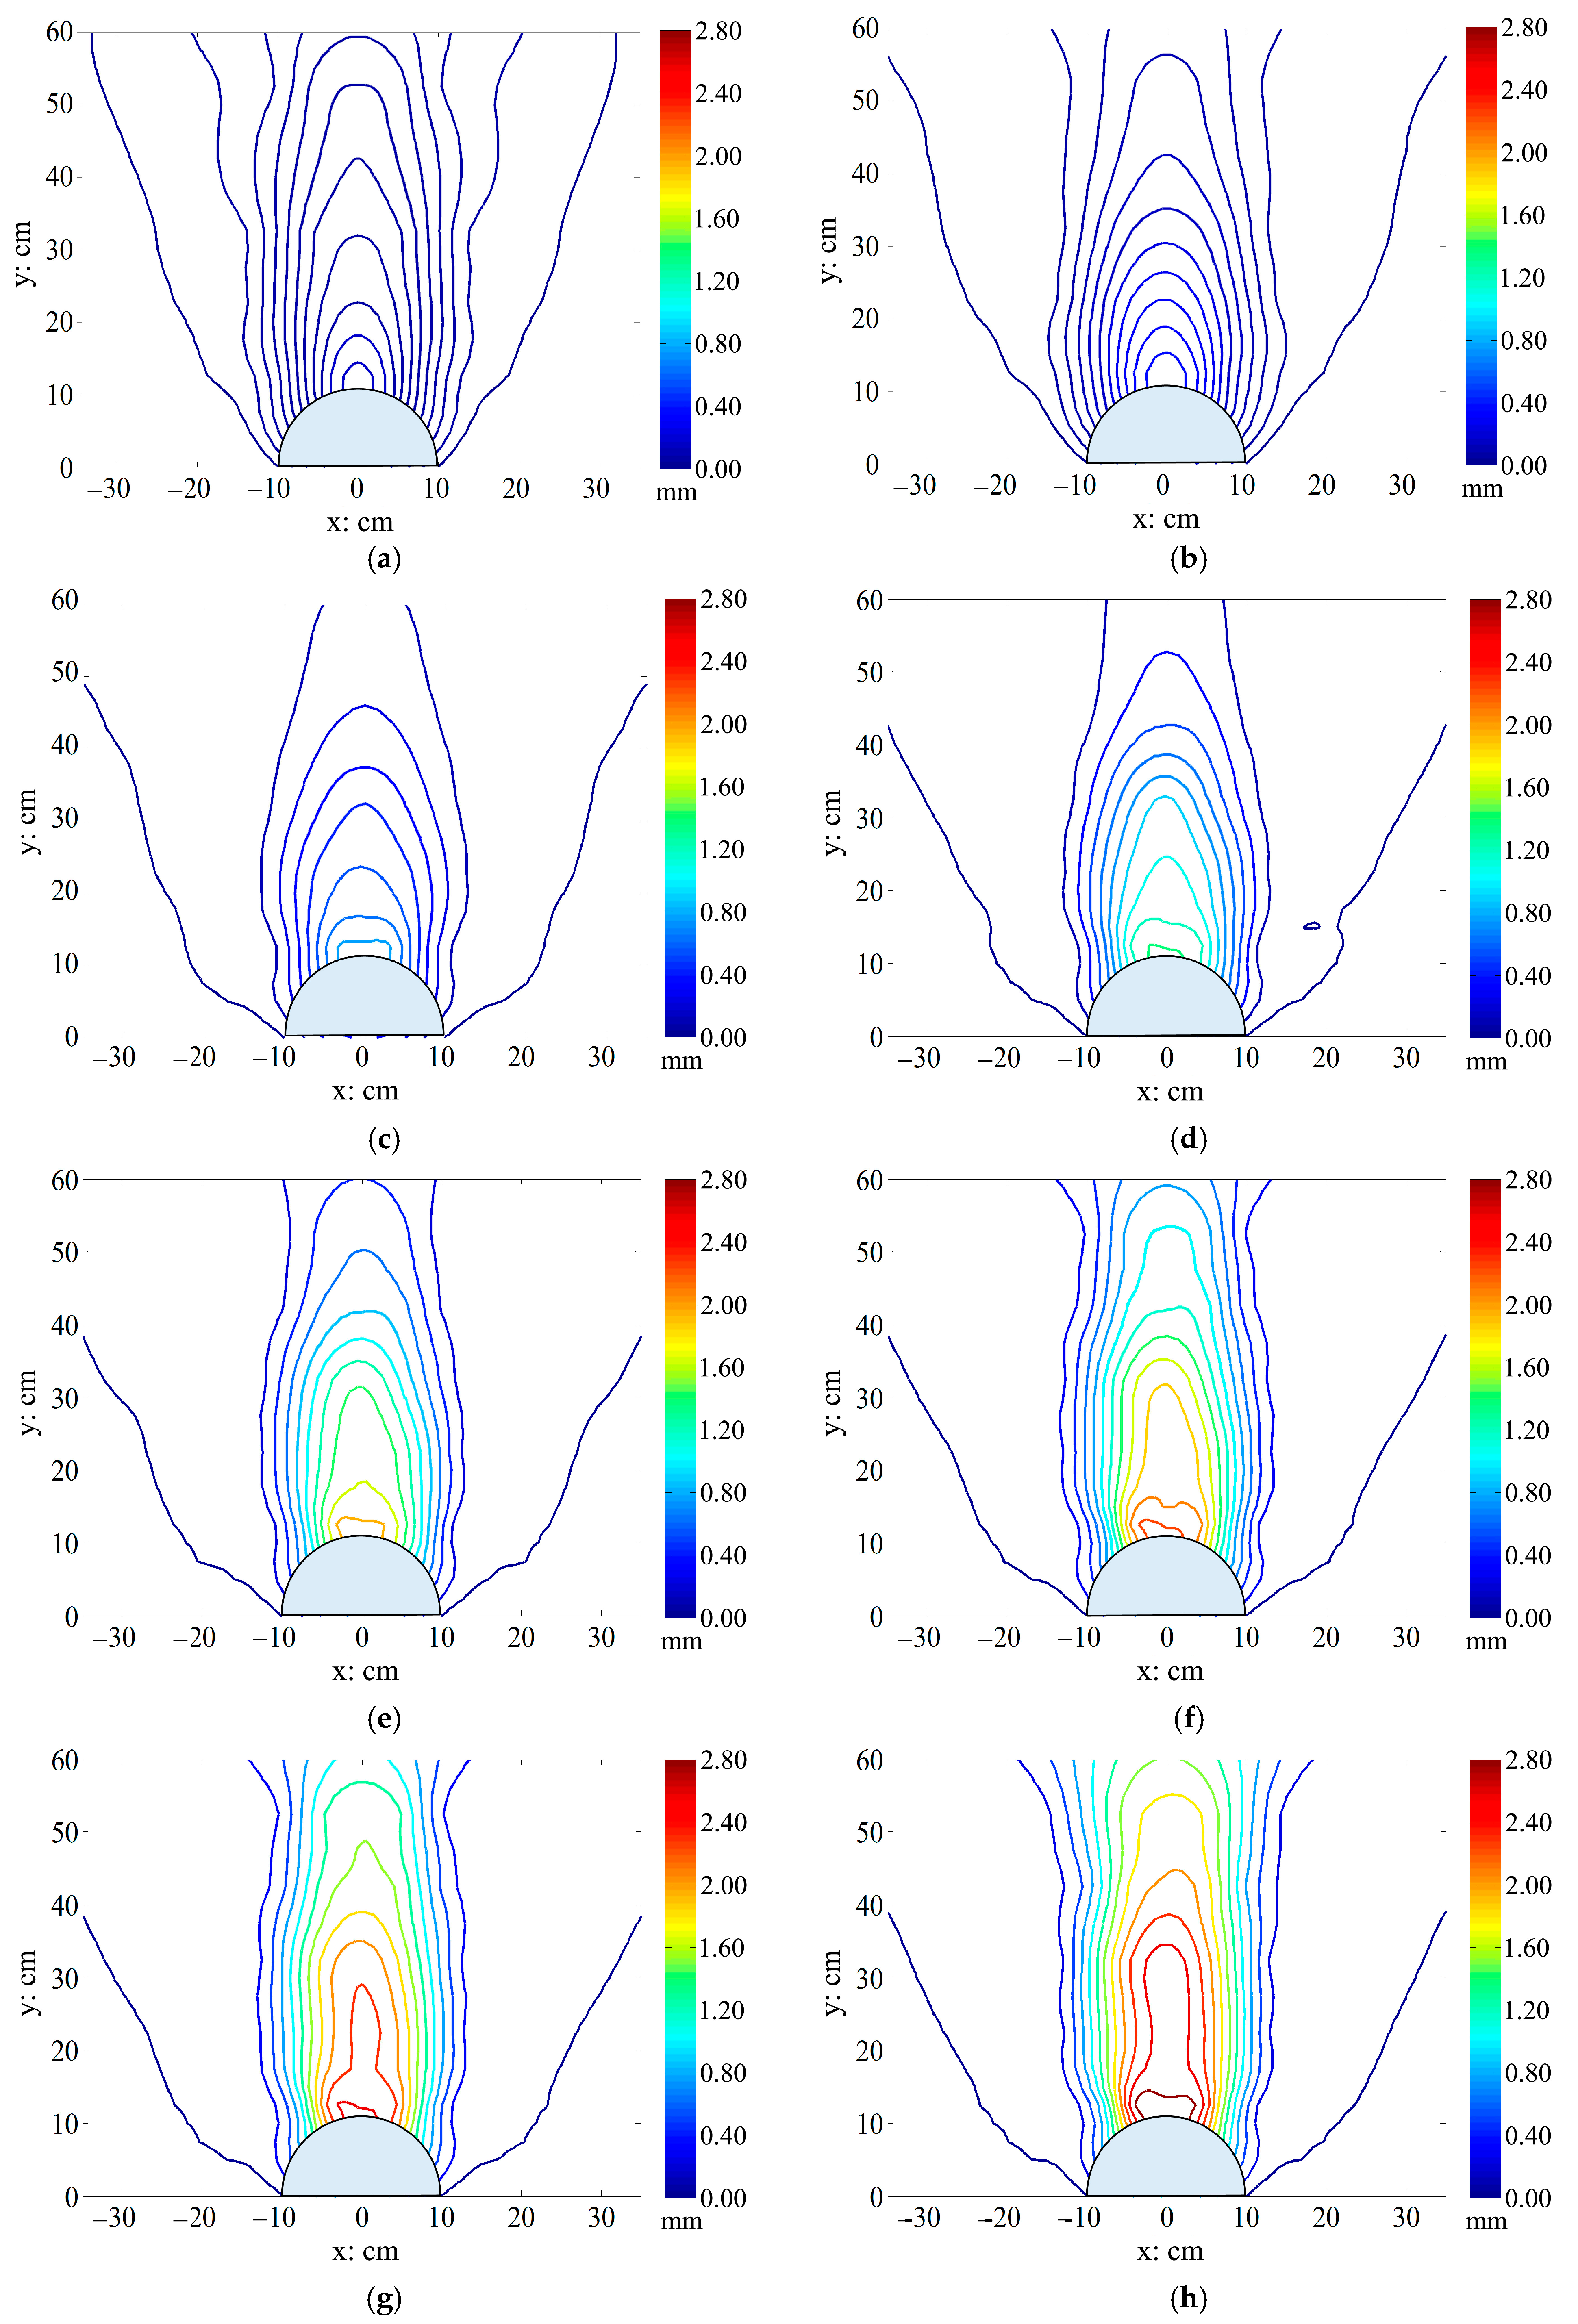
Figure 13.
Formation mechanism schematic of the ground deformation mode. (a) Schematic diagram for collapse mechanism of the soil; (b) Schematic diagram for the force acting on the soil element.
Figure 13.
Formation mechanism schematic of the ground deformation mode. (a) Schematic diagram for collapse mechanism of the soil; (b) Schematic diagram for the force acting on the soil element.

Figure 14.
Surface and subsurface settlement troughs in Group T1; (a) T101 (b) T102 (c) T103.


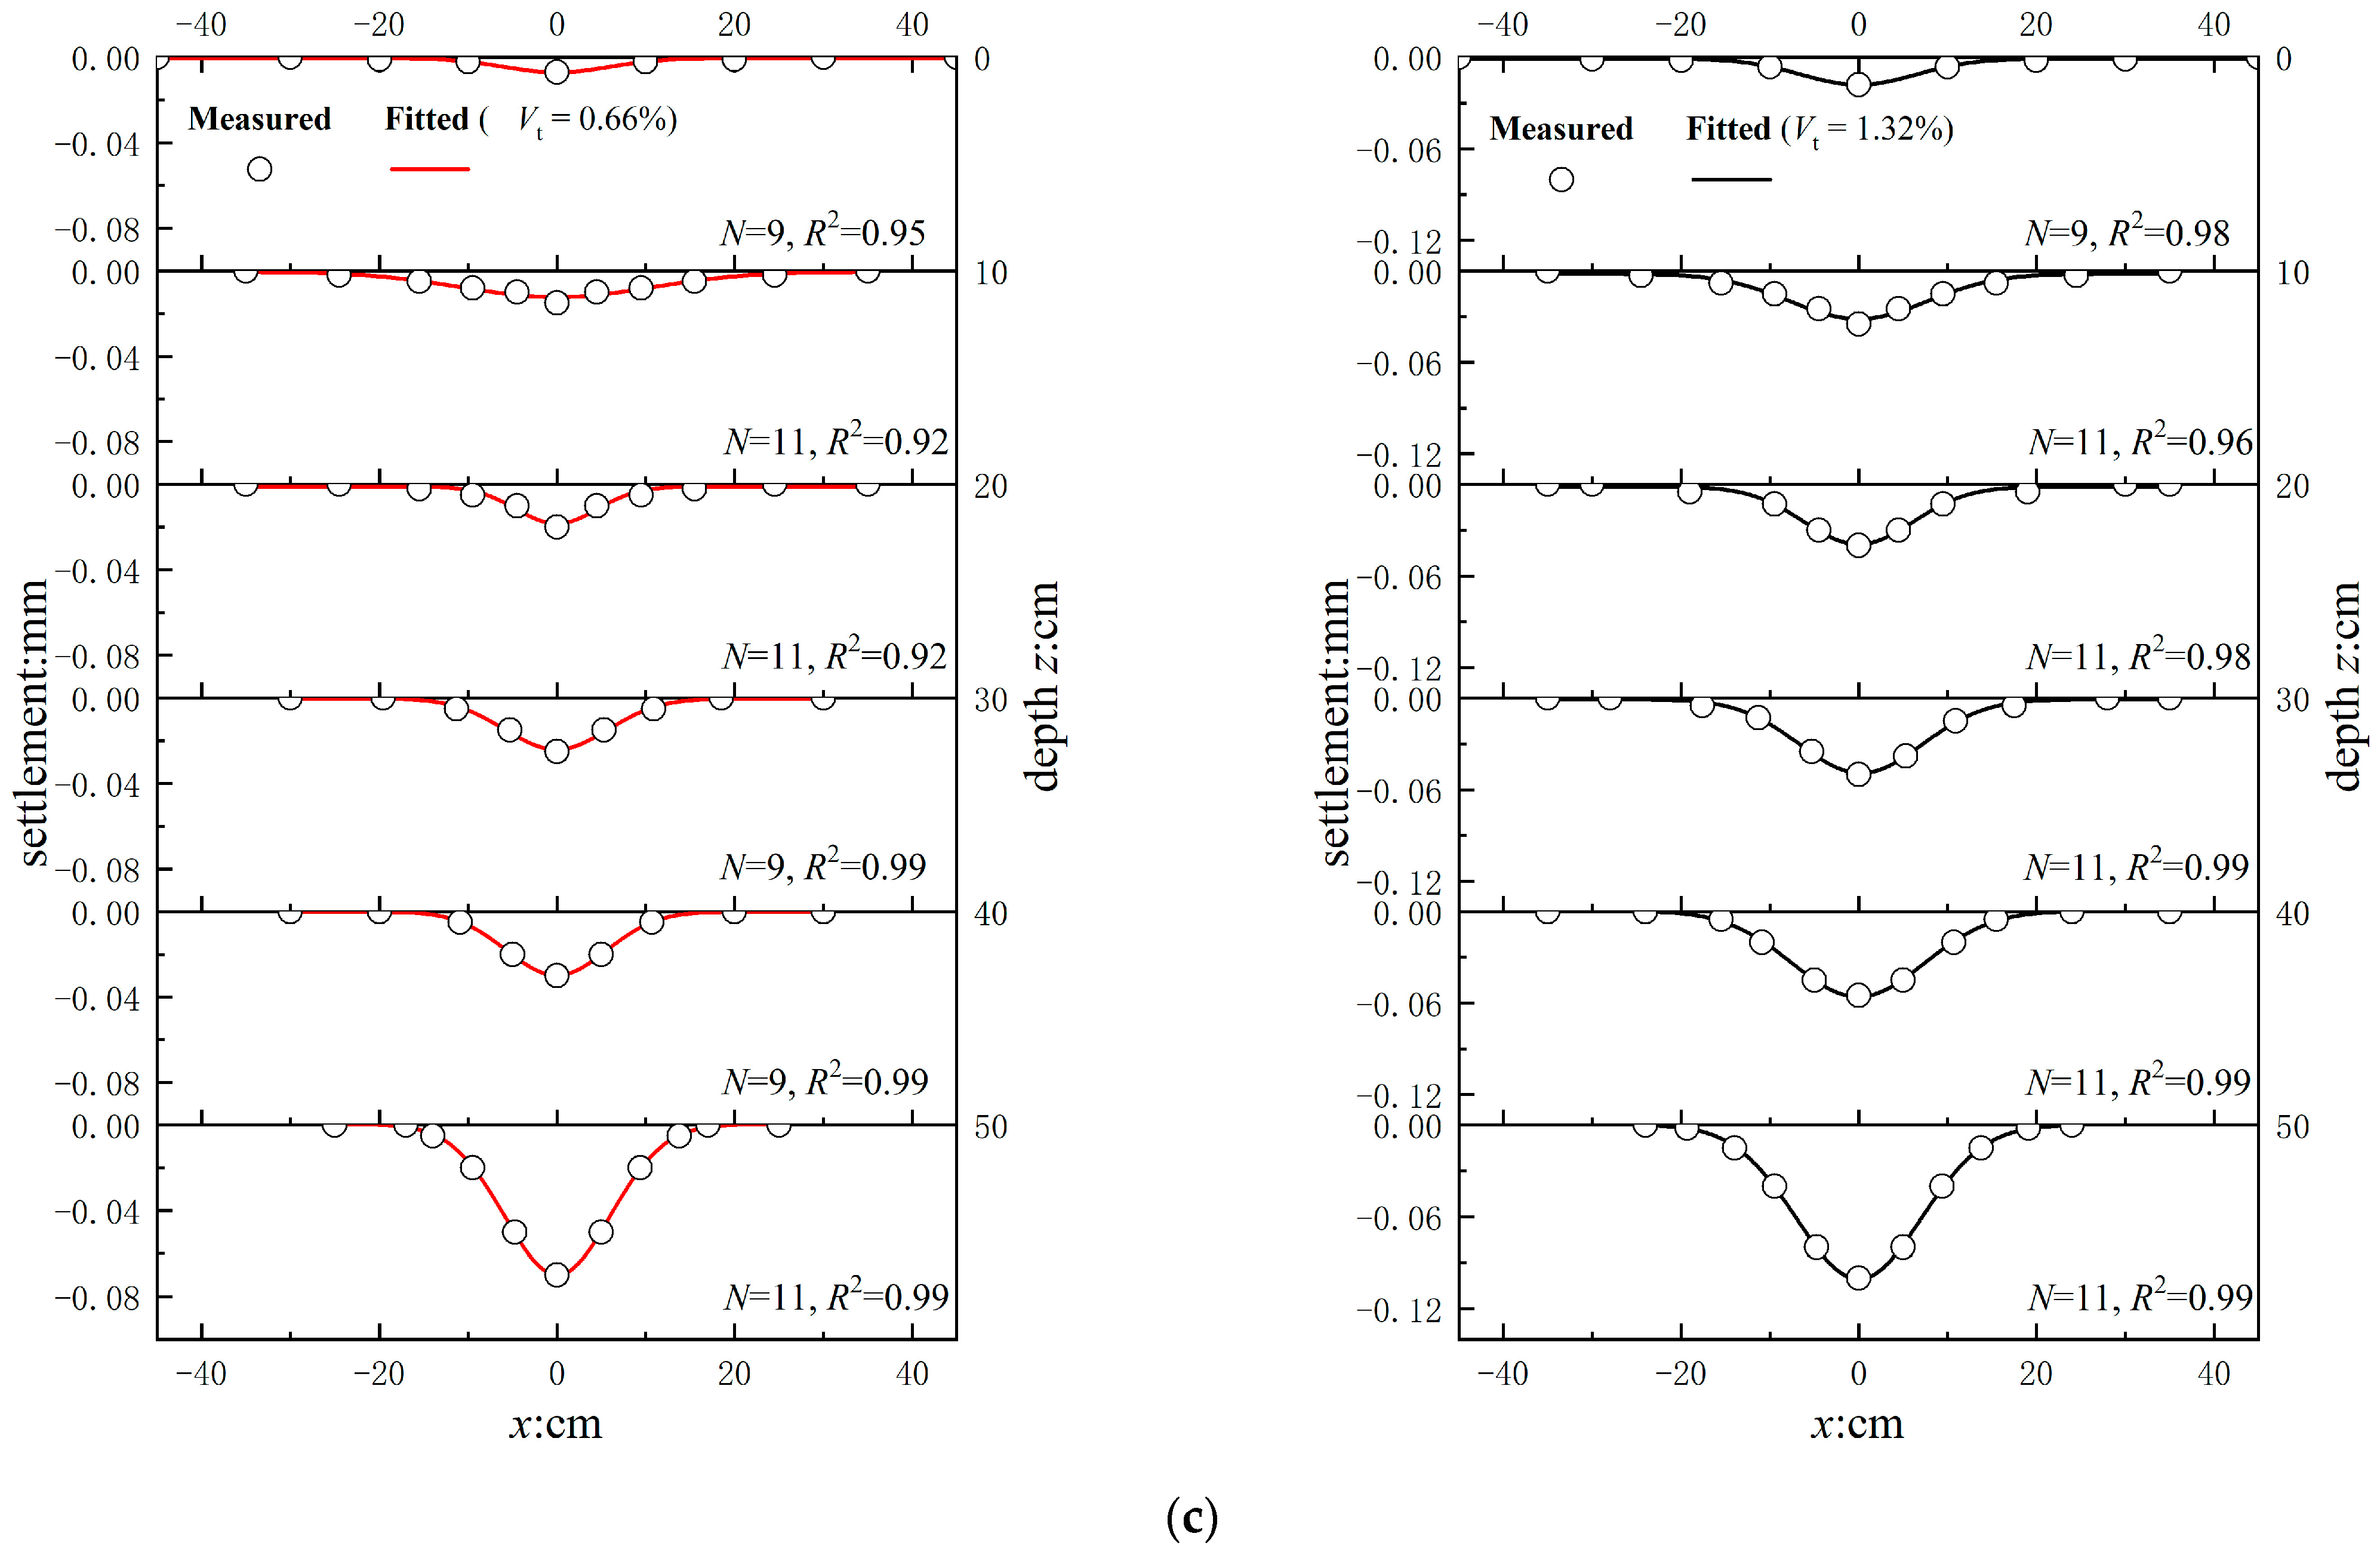
Figure 15.
Surface and subsurface settlement troughs in Group T2; (a) T201 (b) T202.
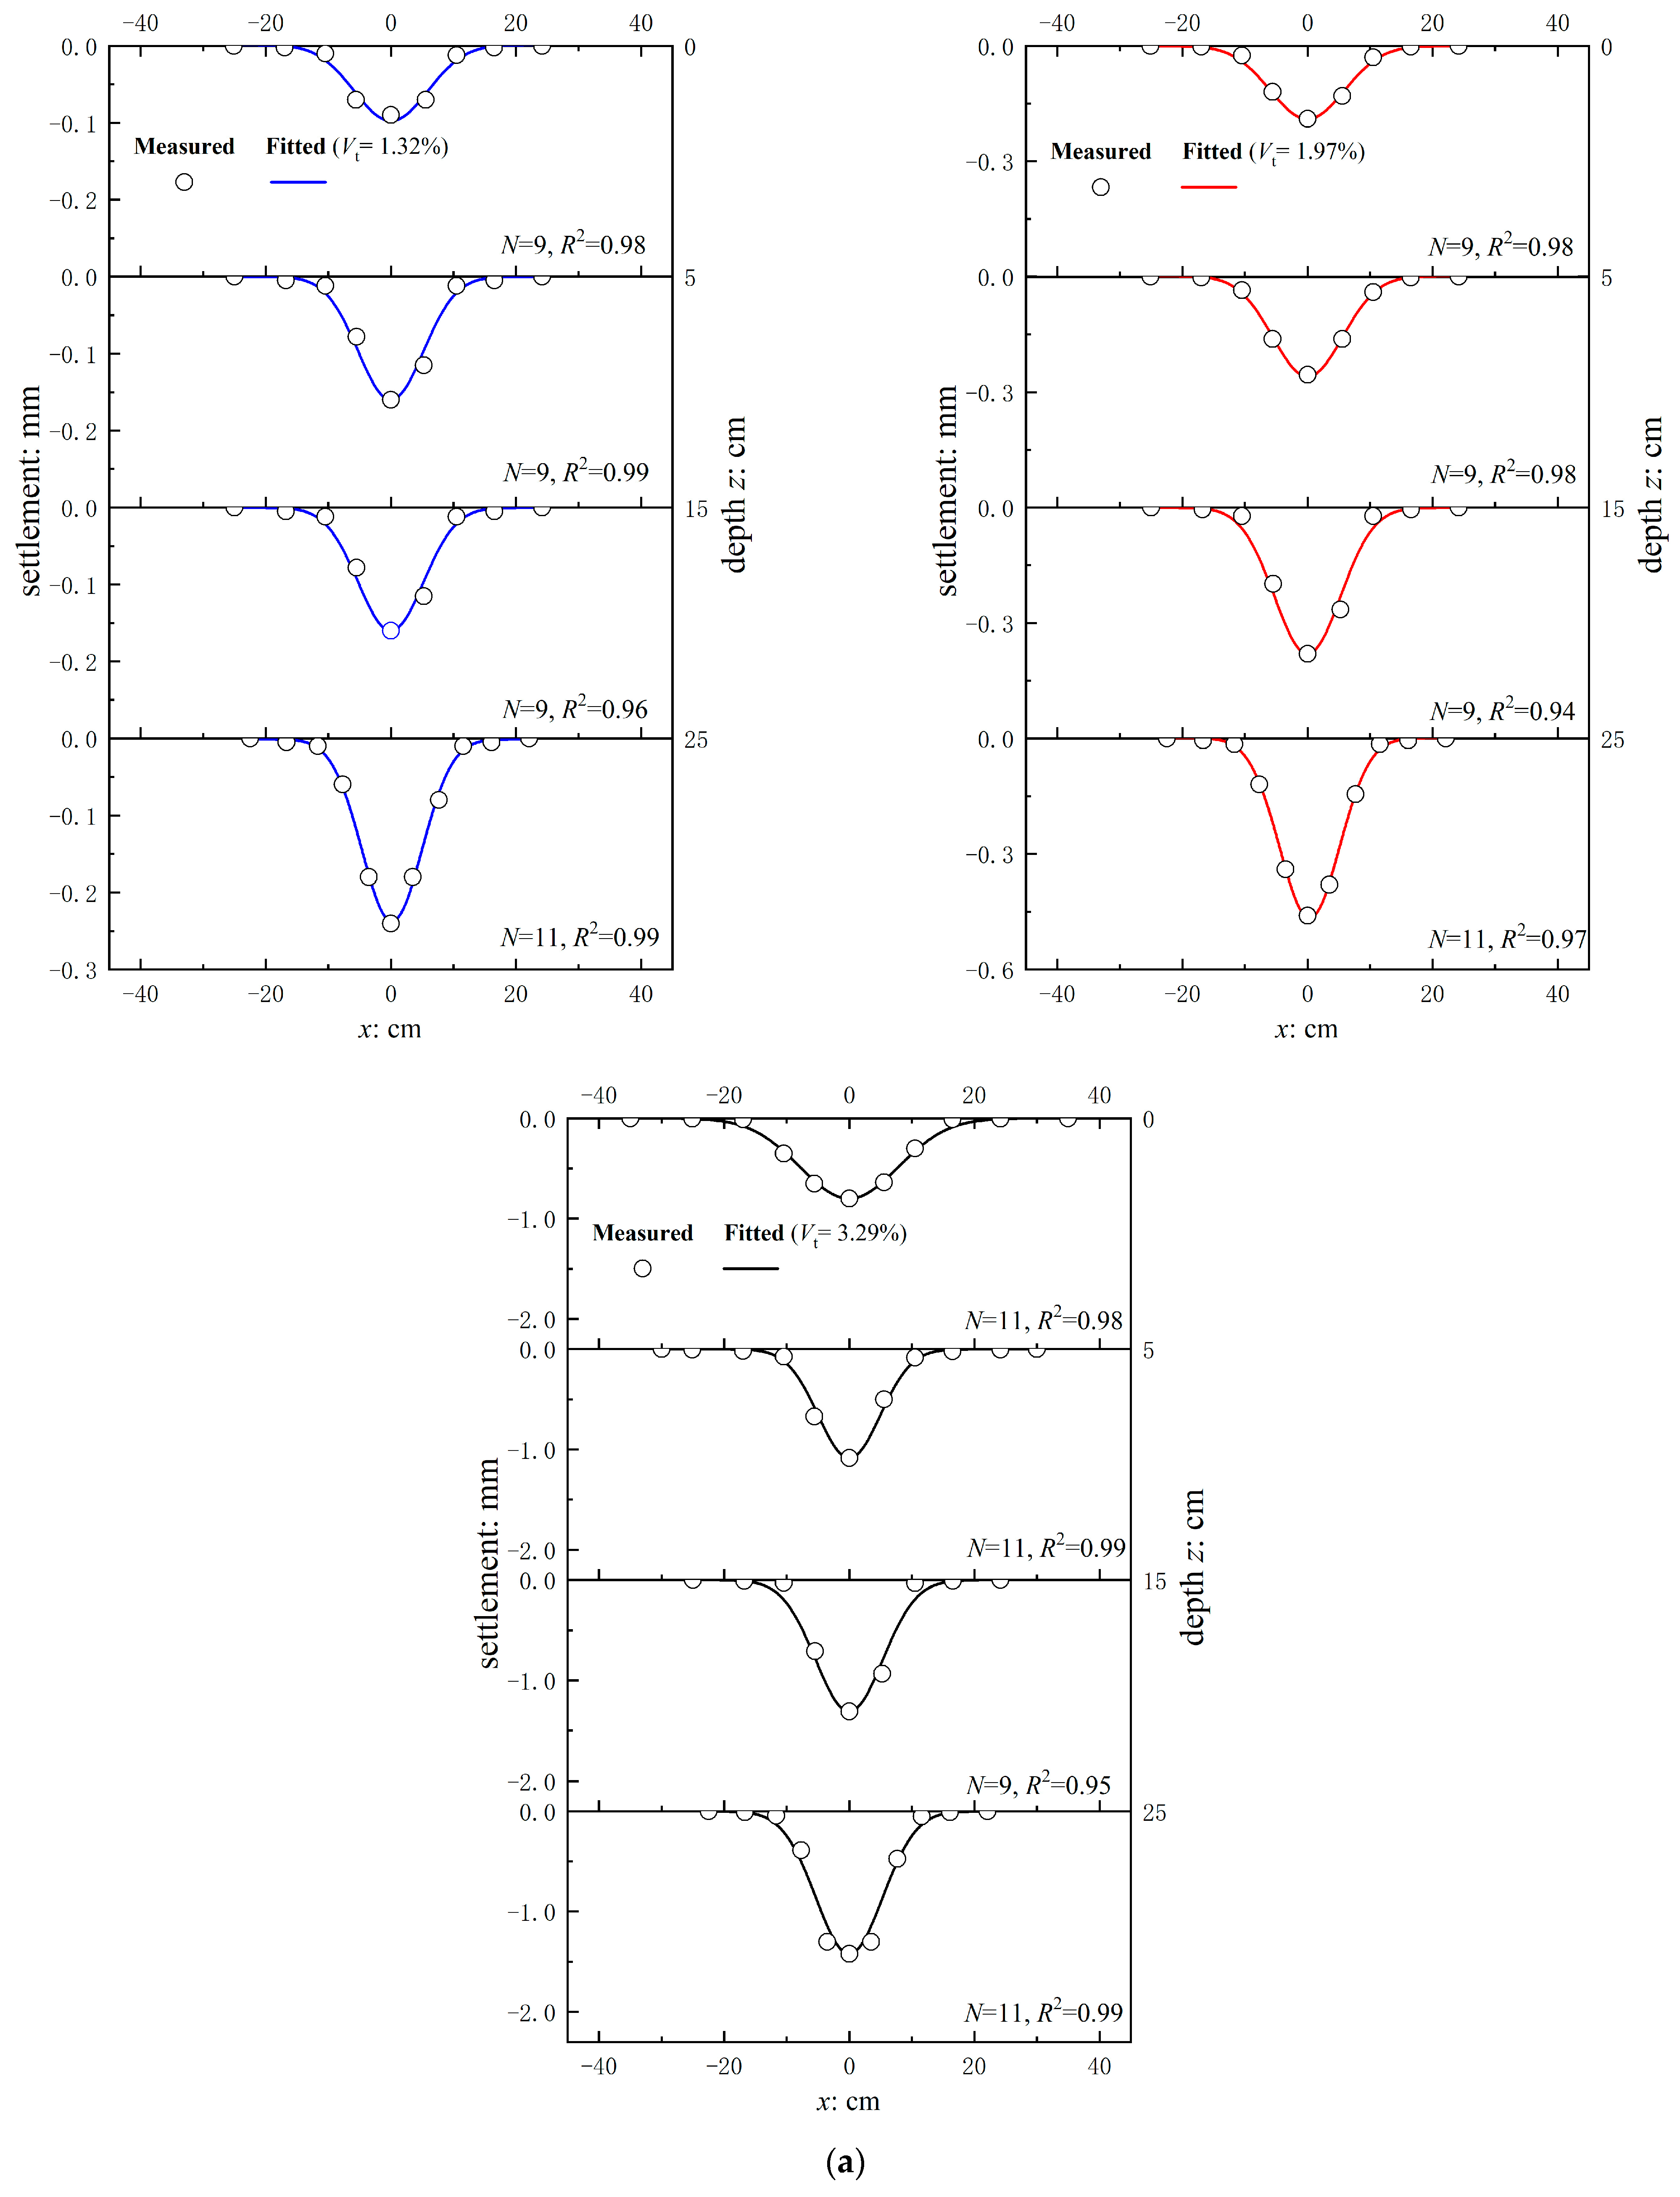

Figure 16.
Coefficients of determination between the fitting Gaussian curve and measured results. (a) The arching mode; (b) the collapsing mode.
Figure 16.
Coefficients of determination between the fitting Gaussian curve and measured results. (a) The arching mode; (b) the collapsing mode.
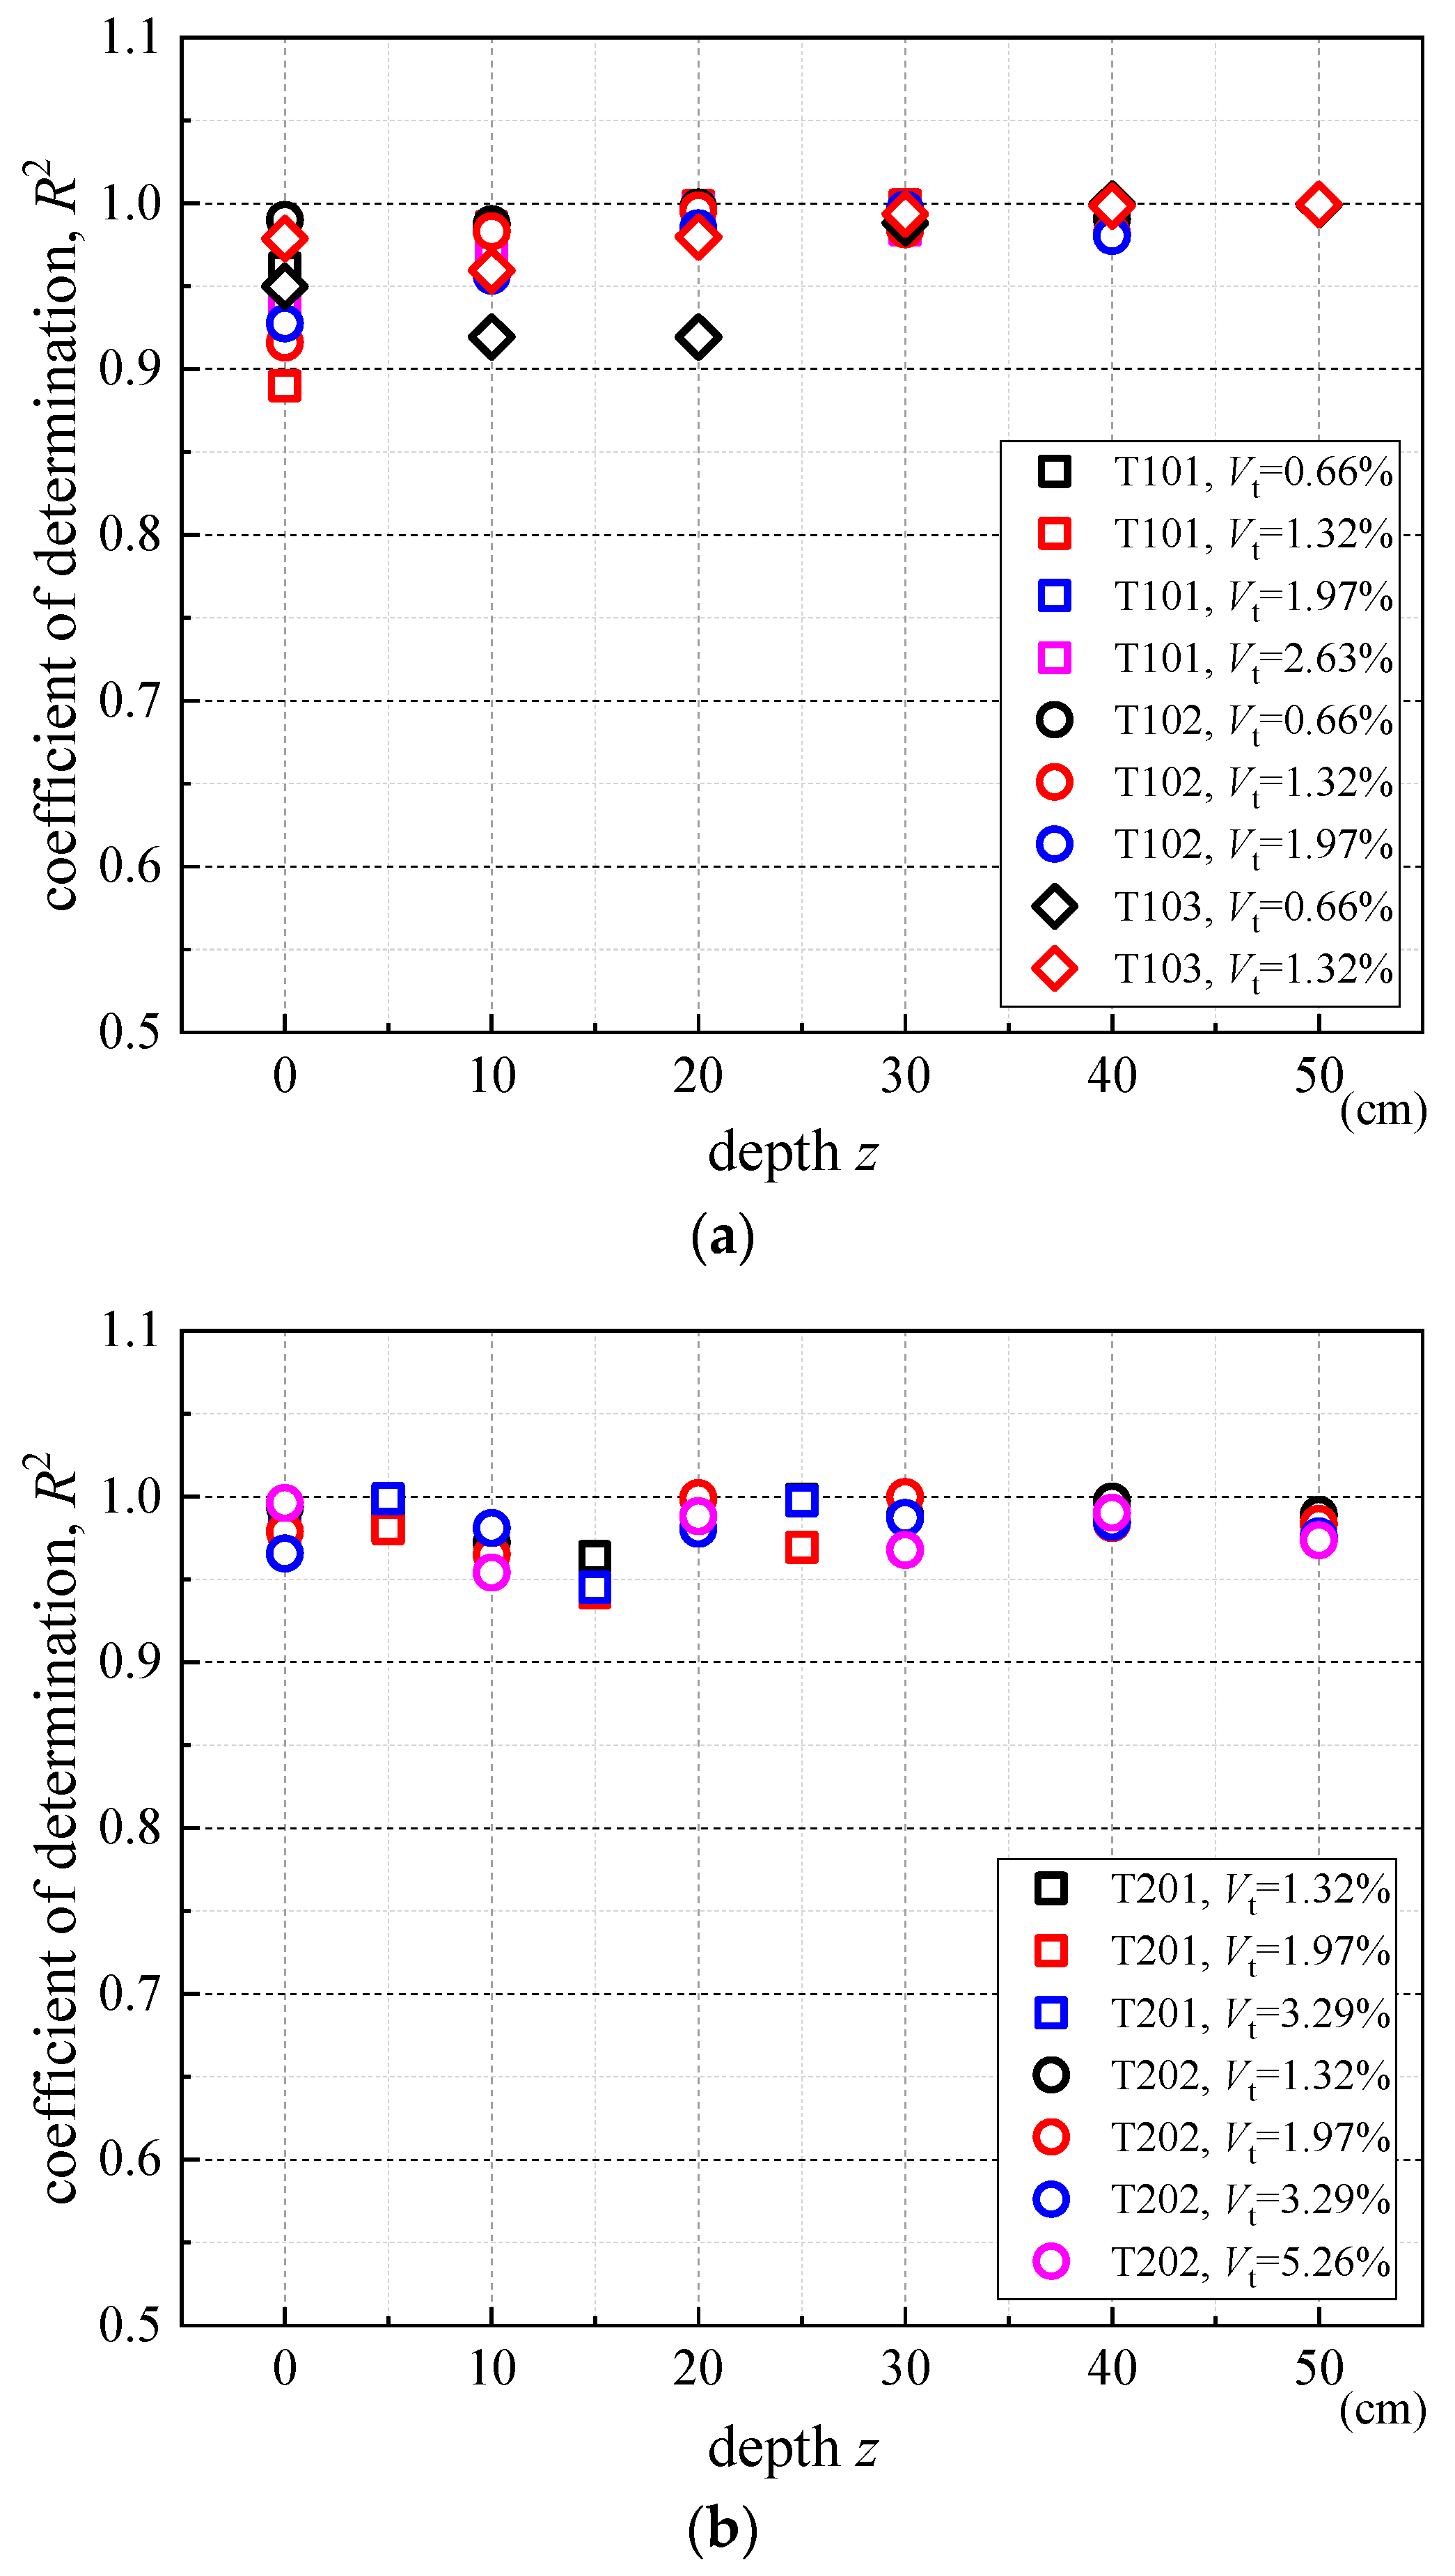
Figure 17.
Change rule of i(z) against tunnel crown depth z0. (a) The arching mode. (b) The collapsing mode.
Figure 17.
Change rule of i(z) against tunnel crown depth z0. (a) The arching mode. (b) The collapsing mode.
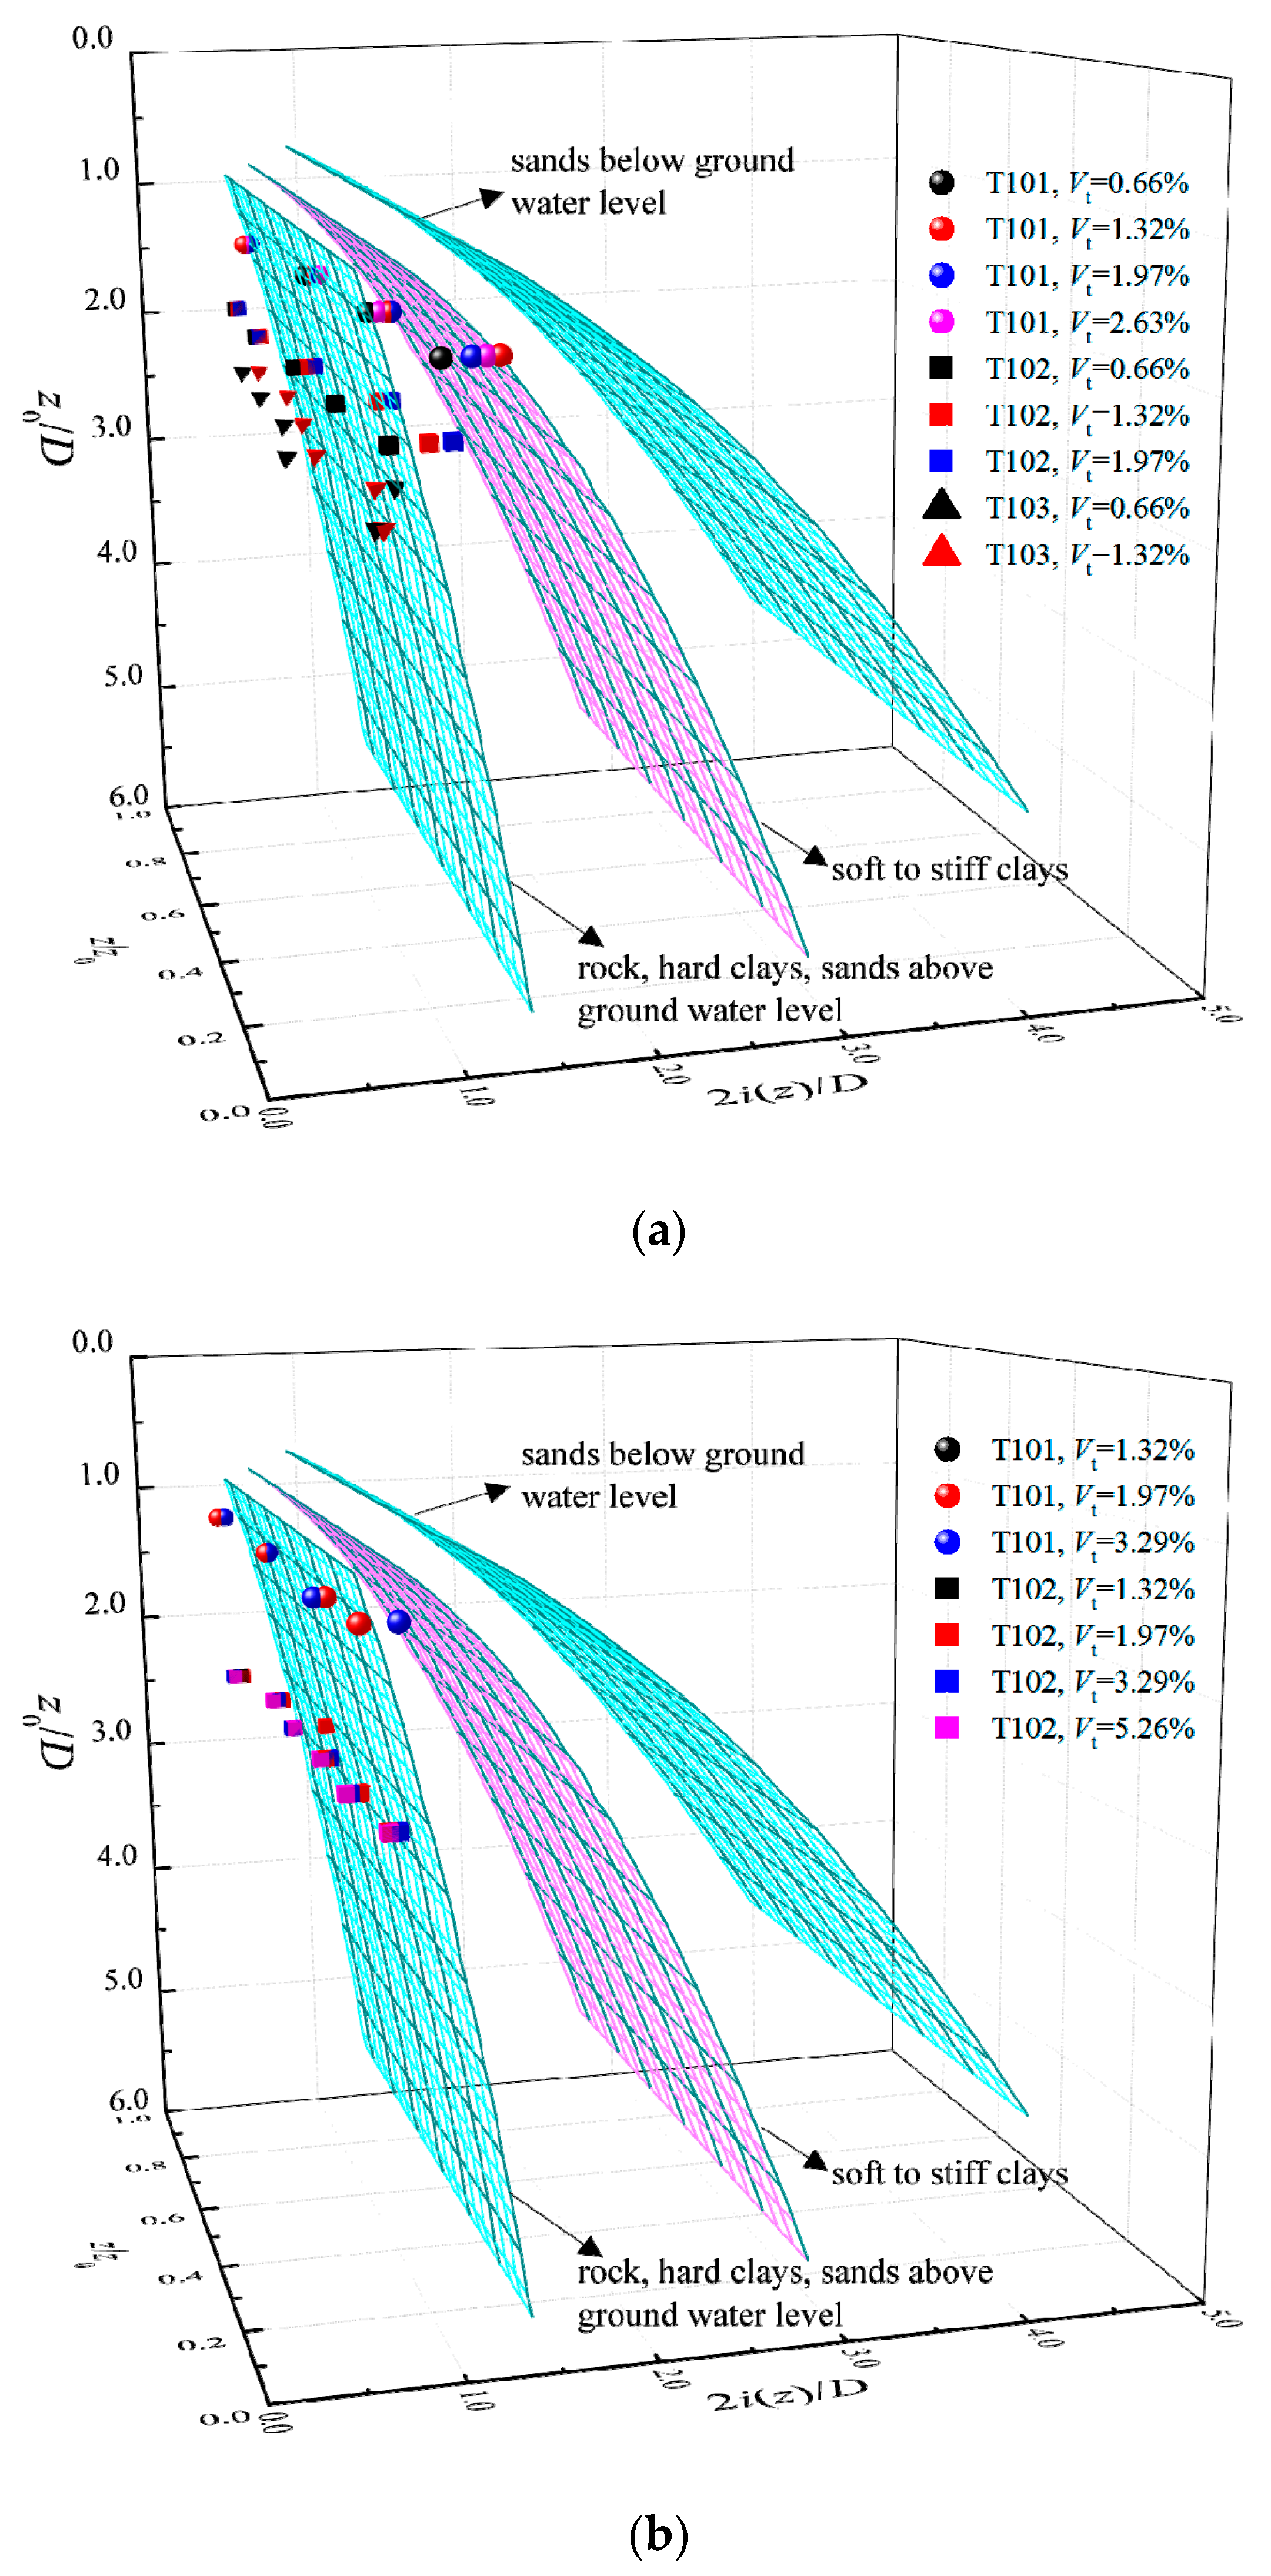
Figure 18.
Change rule of K against depth. (a) The arching mode; (b) the collapsing mode [23].
Figure 18.
Change rule of K against depth. (a) The arching mode; (b) the collapsing mode [23].
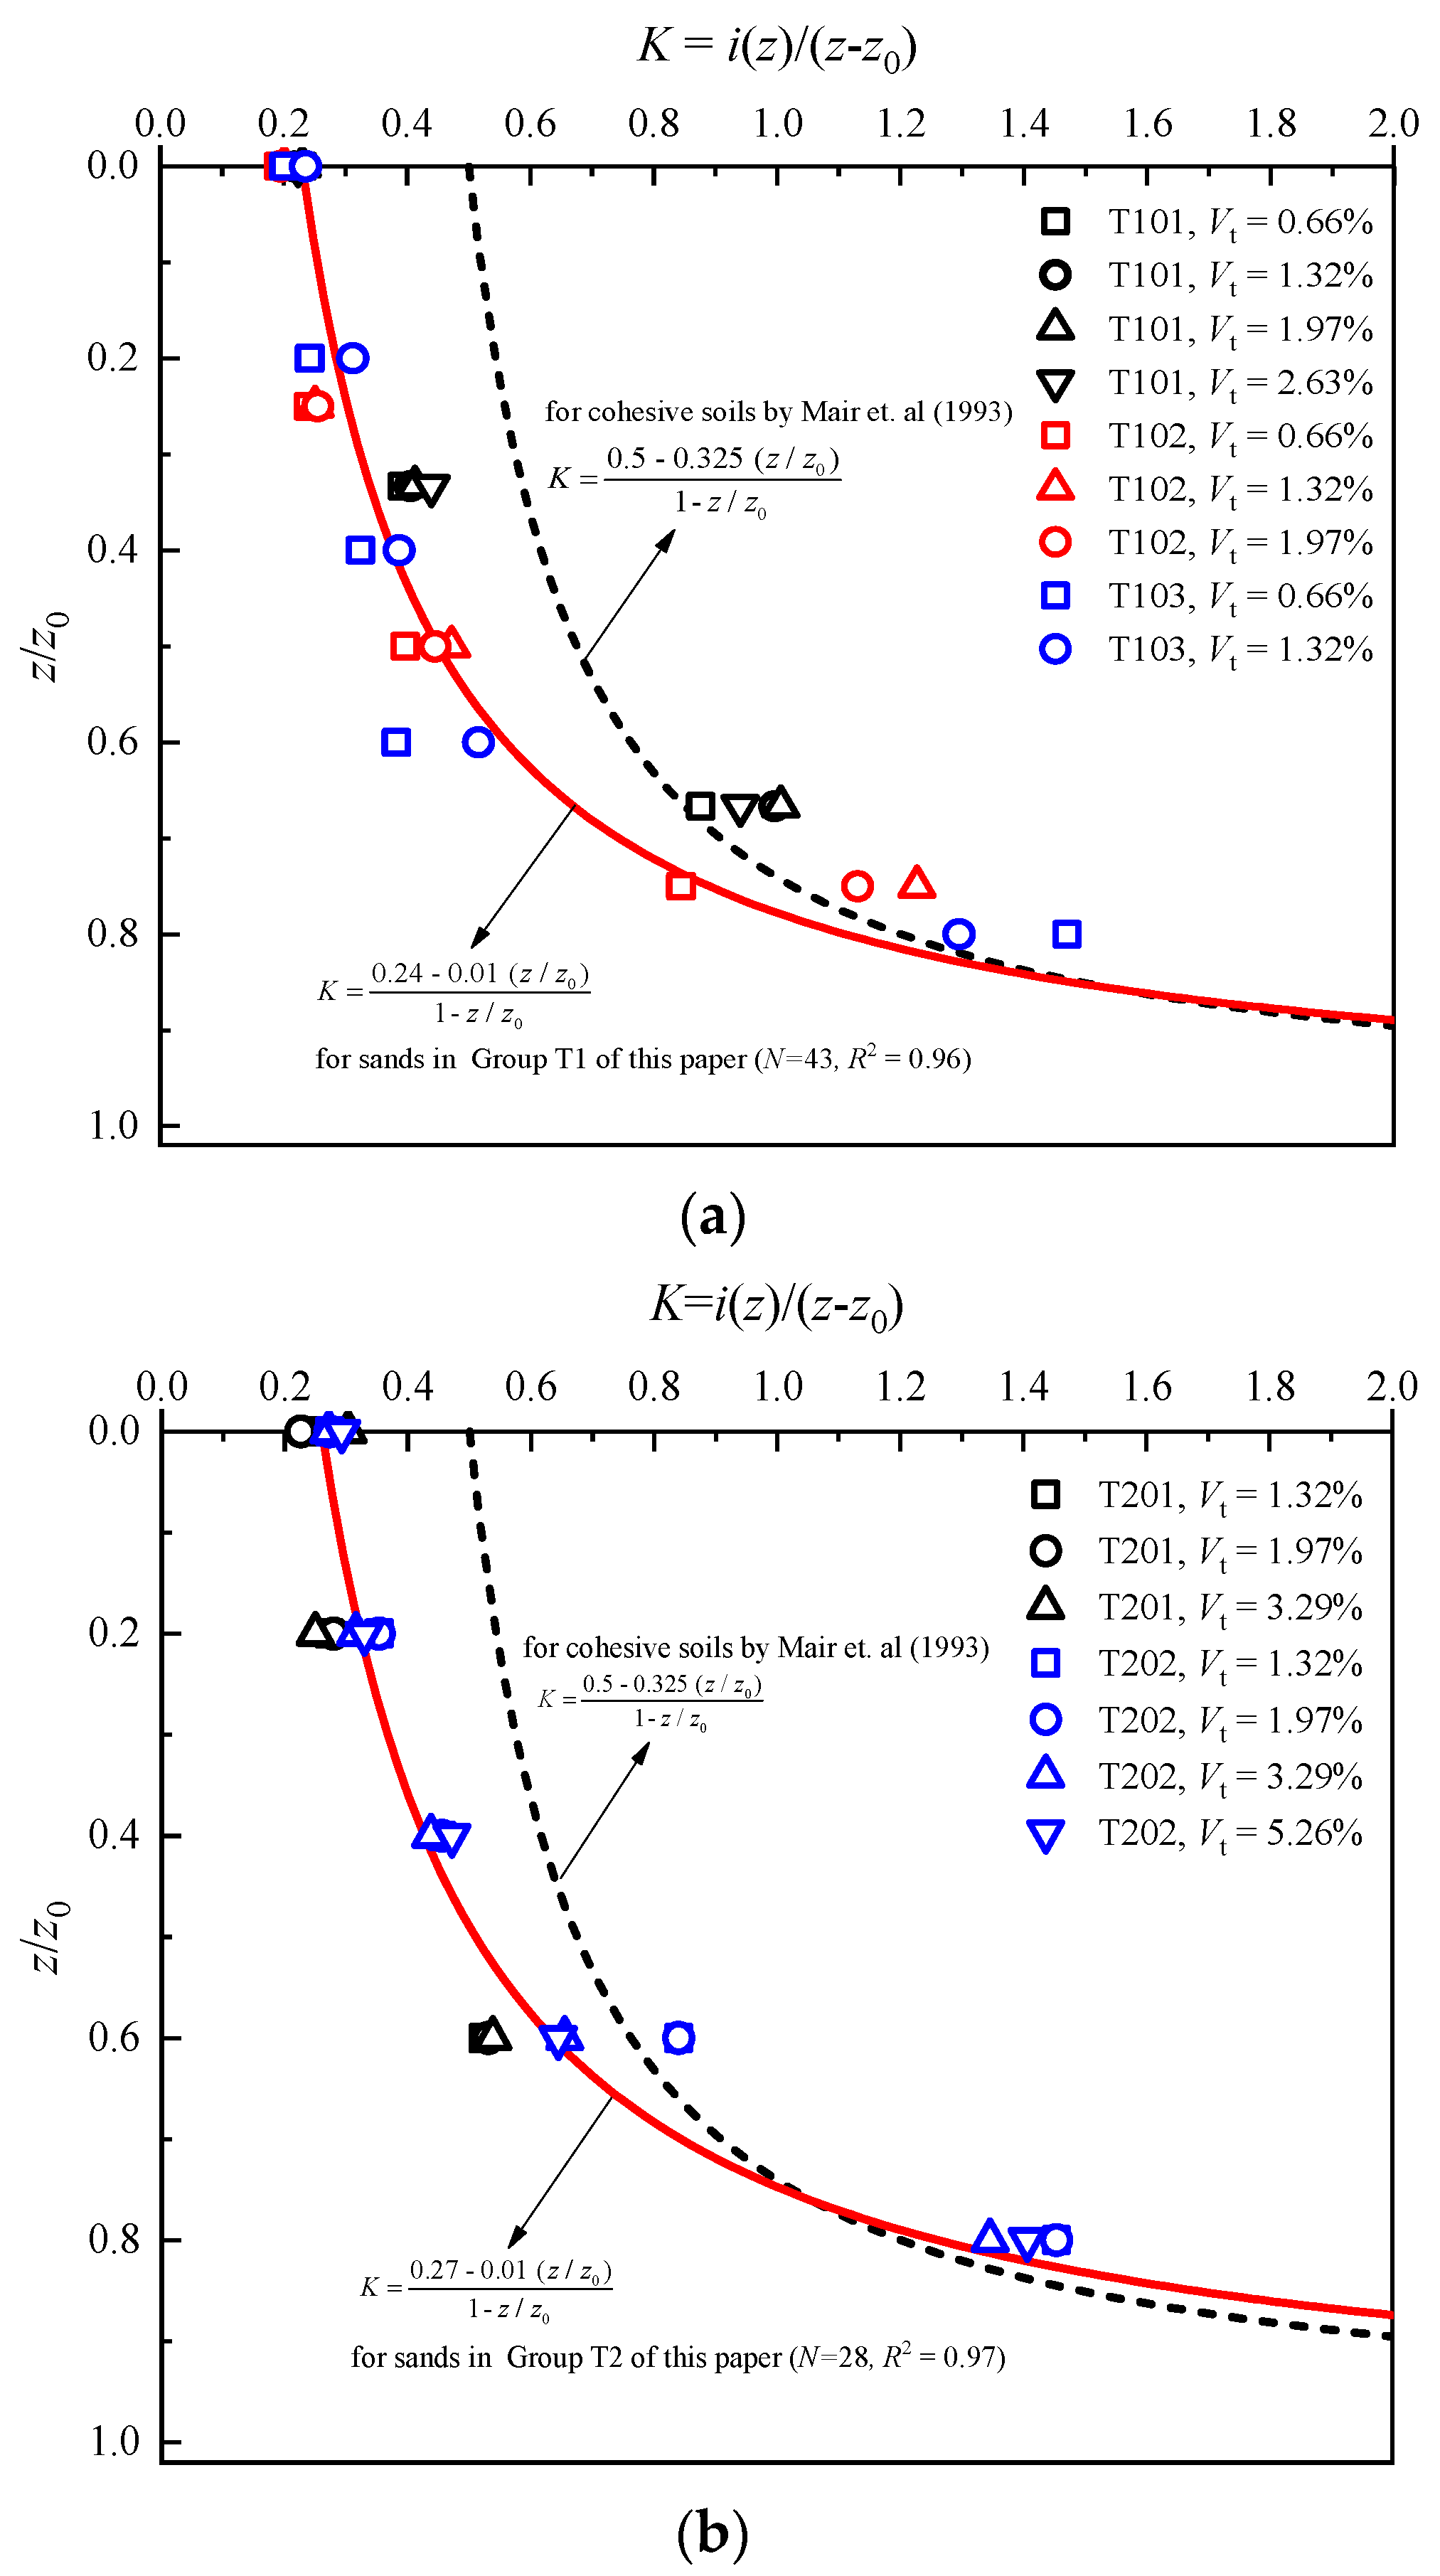
Figure 19.
The change rule of Vs,T(z) against depth z/z0. (a) The arching mode; (b) the collapsing mode.
Figure 19.
The change rule of Vs,T(z) against depth z/z0. (a) The arching mode; (b) the collapsing mode.

Table 1.
Test conditions.
| Groups | T1 | T2 | |||
|---|---|---|---|---|---|
| Test Number | T101 | T102 | T03 | T201 | T202 |
| Tunnel crown depth (cm) | 30 | 40 | 50 | 25 | 50 |
| Water content | 5% | 2% | |||
Disclaimer/Publisher’s Note: The statements, opinions and data contained in all publications are solely those of the individual author(s) and contributor(s) and not of MDPI and/or the editor(s). MDPI and/or the editor(s) disclaim responsibility for any injury to people or property resulting from any ideas, methods, instructions or products referred to in the content. |
© 2023 by the authors. Licensee MDPI, Basel, Switzerland. This article is an open access article distributed under the terms and conditions of the Creative Commons Attribution (CC BY) license (https://creativecommons.org/licenses/by/4.0/).
Share and Cite
MDPI and ACS Style
Lin, Q.; Guo, C.; Meng, X.; Dong, H.; Kong, F. Experimental Research on the Settlement Feature of Two Ground Deformation Modes Induced by Tunnelling. Mathematics 2023, 11, 2351. https://doi.org/10.3390/math11102351
AMA Style
Lin Q, Guo C, Meng X, Dong H, Kong F. Experimental Research on the Settlement Feature of Two Ground Deformation Modes Induced by Tunnelling. Mathematics. 2023; 11(10):2351. https://doi.org/10.3390/math11102351
Chicago/Turabian StyleLin, Qingtao, Caixia Guo, Xu Meng, Hongyu Dong, and Fanchao Kong. 2023. "Experimental Research on the Settlement Feature of Two Ground Deformation Modes Induced by Tunnelling" Mathematics 11, no. 10: 2351. https://doi.org/10.3390/math11102351
Note that from the first issue of 2016, this journal uses article numbers instead of page numbers. See further details here.