
A Study to Identify Long-Term Care Insurance Using Advanced Intelligent RST Hybrid Models with Two-Stage Performance Evaluation
1
College of Management, National Chin-Yi University of Technology, Taichung 411030, Taiwan
2
Department of Finance, Chaoyang University of Technology, Taichung 413310, Taiwan
3
Executive Doctoral Business Administration, Danphine University of Business, CEDEX 16, 75775 Paris, France
*
Author to whom correspondence should be addressed.
Mathematics 2023, 11(13), 3010; https://doi.org/10.3390/math11133010
Submission received: 23 May 2023
/
Revised: 24 June 2023
/
Accepted: 3 July 2023
/
Published: 6 July 2023
(This article belongs to the Special Issue Industrial Mathematics in Management and Engineering)
Abstract
:With the motivation of long-term care 2.0 plans, forecasting models to identify potential customers of long-term care insurance (LTCI) are an important and interesting issue. From the limited literature, most past researchers emphasize traditional statistics techniques to address this issue; however, these are lacking in some areas. For example, intelligent hybrid models for LTCI are lacking, performance measurement of components for hybrid models is lacking, and research results for interpretative capacities are lacking, resulting in a black box scenario and difficulty in making decisions, and the gap between identifying potential customers and constructing hybrid models is unbridged. To solve the shortcomings mentioned above, this study proposes some advanced intelligent single and hybrid models; the study object is LTCI customers. The proposed hybrid models were used on the experimental dataset collected from real insurance data and possess the following advantages: (1) The feature selection technique was used to simplify variables for the purpose of improving model performance. (2) The performance of hybrid models was evaluated against some machine learning methods, including rough set theory, decision trees, multilayer perceptron, support vector machine, genetic algorithm, random forest, logistic regression, and naive Bayes, and sensitivity analysis was performed in terms of accuracy, coverage, rules number, and standard deviation. (3) We used the C4.5 algorithm of decision trees and the LEM2 algorithm of rough sets to extract and provide valuably comprehensible decisional rules as decision-making references for the interested parties for their varied benefits. (4) We used post hoc testing to verify the significant difference in groups. Conclusively, this study effectively identifies potential customers for their key attributes and creates a decision rule set of knowledge for use as a reference when solving practical problems by forming a structured solution. This study is a new trial in the LTCI application field and realizes novel creative application values. Such a hybrid model is rarely seen in identifying LTCI potential customers; thus, the study has sufficient application contribution and managerial benefits to attract much concern from the interested parties.
Keywords:
long-term care insurance; potential customer; feature selection technique; data discretization method; decision tree; rough set theoryMSC:
68Q15; 68Q171. Introduction
This section introduces the related issues of research background, research problems, and main research motivation, and accordingly explores research originality as well as research importance and research purposes.
1.1. Research Background, Research Problems, and Research Motivation
In recent years, Taiwan has been affected by the social problems of decreasing birth rate and aging population, and this issue and importance of these problems have led to the demand for new models and emerging techniques with regard to long-term care insurance (abbreviated as LTCI in this study). Therefore, this study was developed with the intention of researching the effect of the four powerful motivating words “new”, “heart”, “salary”, and “warmth” on LTCI.
First of all, we started with the first brand “new” models of emerging technology for addressing mathematical application issues to solve the real-life problem faced. After the emergence of new information technology (IT) techniques, the hottest technical issues recently are related to data mining for machine learning (ML) [1] methods, such as decision trees (DTs), random forests (RFs), and multilayer perceptrons (MLPs), with other related topics that have also been introduced into the financial and insurance industry, resulting in the rise of finance and insurance 4.0 and arousing widespread attention from academia and industry. Next, with the generation and collection of a large amount of transaction data, technologies for addressing how to deal with the large amount of data have emerged one after another. We know that the hierarchical structure of knowledge is divided into four stages in order: data ➔ information ➔ knowledge ➔ wisdom [2], the concerns of which involve how to transform the bottom-level data into a more useful information system, then upgrade it to a higher level of professional knowledge and even the highest level of wisdom. In turn, this framework has greatly contributed to the evolution of data mining techniques in mainstream research fields in the past 20–30 years, leading the industrial transformation brought about by the digital economy and itself benefiting in terms of learning how to transform data into knowledge/wisdom. In particular, in contrast to the urgently needed long-term care issues for the elderly under the current financial and insurance 4.0 framework, the core importance of “LTCI” data accumulated rapidly and closely related to the future of the people becomes even more important for quality of life in old age. Thus, this study investigates an important and interesting issue: developing data models of machine learning techniques as its first core research interest from the perspective of industry data applications.
Accordingly, in order to match and conform to the government’s future policy priorities, it is necessary to explore the recent issue of disability and LTCI. In particular, LTCI was primarily chosen as the research topic to address the fact that Taiwan has entered the state of an aging society; thus, to properly improve the second half of life for the elderly in the near future, this study’s second core research interest is identifying LTCI data. According to a newspaper report, a report released by the Ministry of Health, Welfare and Welfare of Japan in 2013 shows that only 4.3% of the people who paid LTCI were between the ages of 40 and 64, and most of the rest of the payers were 65 and older. Moreover, they had heart disease, dementia, arthritis, stroke, fractures, and slips, and elderly debilitating diseases accounted for 75.4% of the serious diseases. It can be seen that the social problems of the elderly are still serious in Taiwan, and thus we need increased attention on these problems even more in advance. By the above reason, we should follow the guidance of the second motivation, “loving heart”, in facing this practical problem in the insurance industry. It is true that life is always full of crises and changeable characteristics in ever-changing circumstances, and the damage this may cause can be very scary and unpredictable. Thus, it is necessary to prepare for emergencies, and this implies that the mechanism of insurance is requisite, particularly for the elderly. It was found that many elderly people may be limited by finances and illnesses in their later years, without dignity; they suffer from the abandonment of their relatives. Thus, this case deeply shows the key importance of the protection of LTCI for the elderly in the face of the imminent future. As Taiwan has been negatively impacted by the declining birth rate in recent years, the elderly have more difficult lives in their later years and may be even more unhappy; they may suffer from illness and even worse. These important and interesting focus topics are worthy of a great degree of our attention. Therefore, exploring the issue of long-term care [3] for the elderly is something that we as a country and society need to face seriously, which drives this study.
Therefore, if we have the customer’s “LTCI” data information, we can use a “new” technical model to identify the characteristics of future potential customers of LTCI and may generate their decision-making rule set, so the “new” technical model + “LTCI” data combination becomes extremely important. However, there are three gaps for general insurance salesmen (referred to as insurers) when looking at real-world insurance data in practice: (1) a lack of professional technical knowledge regarding the huge amount of insurance data in industry databases, and the fact that it is impossible to effectively identify information in the field of new techniques; (2) a lack of effective technical models to interpret information, as well as a lack of analysis capabilities; and (3) insufficient transparency of insurance financial data, which may cause information asymmetry and lead to adverse consequences, causing insurers and managers to be full of selfish behaviors and eventually lead to mutual suspicion. The short-term problem is discord among employees, and the longer-term problem is direct possible tangible damage to the operating performance of the insurance company and indiscernible reputation damage. In addition, early scholars focused on the analysis of traditional statistical theory in LTCI research, and an effective LTCI prediction system for practical development is absent, resulting in the inability to effectively correlate and verify the research theory and practice results. Based on the above reasons, it is urgent to build a practical and effective “new” advanced intelligent LTCI forecasting system. When we have insurance customers’ data, this can help insurers quickly develop potential customer targets, increase personal business performance, and create wealth through the mining of various possible hidden factors using effective hybrid models of noted machine learning techniques. Based on different classification functions of machine learning models, this study proposes an evolutionary method for the framework of advanced and intelligent data application analysis and builds an improved LTCI forecasting system. According to the literature review, these appliable methods are rarely used in the related LTCI mining research.
1.2. Continuous Research Motivation and Research Originality
Regarding the key issue of LTCI, we started from the following two aspects, the insurance industry and insurers. The first is the insurance industry. With the recent rapid development of IT techniques and continuous research and development, the industry market of insurance management information systems (IMISs) has become vigorously developed [4]. In particular, they can now solve the problem of the storage of a large amount of customer insurance data, complete with preserving resource deposits. The financial concept of “Insurance” is a kind of mutual assistance that originated in the United Kingdom. It also is the cornerstone of stabilizing the national economy and an important indicator to guide a country’s economic development. Furthermore, from the perspective of Taiwan’s insurance development history, there are six important stages of development, starting from 1962 to the present. In particular, the final sixth stage, from 1994 to the present, is important. This stage concerns the development of diversified insurance products for Taiwan. During this policy period, there are some special products, such as major diseases, end-of-life, and second- and third-level disability exemptions, including LTCI. In addition, due to the gradual aging of the population in Taiwan, the average life expectancy has increased, and the social problems of the elderly population and the need for long-term care have gradually surfaced. The support of disability insurance can allow people to be protected by insurance at every stage of life [5], so insurance products are more complete and diversified, and LTCI was therefore produced in response to this timing. The next step is to explore and understand the professional issues of insurers. Recently, sales of diversified insurance policies in Taiwan have truly professionalized insurance business operations. In particular, since Taiwan’s insurance financial market has reached maturity and saturation, the business expansion of insurers has been greatly restricted and hindered. At present, insurers have to face the following three business operating problems: (1) Excessive competition: There are currently over 320,000 insurers registered in the insurance association. In contrast, product performance is naturally highly competitive. Therefore, in order to develop operating performance, all insurers must muster their strength. (2) Call center marketing: In the insurance industry, it is important to develop potential new customers to purchase new policies. However, traditional insurers often make cold calls to strangers through a call center in order to develop customers. The effect is often not as good as expected. The success ratio is often less than 1%, and this process often requires some frustration. (3) DM marketing: Insurance is an intangible commodity that cannot be touched or seen, and insurers only have cold numbers on their report papers. Therefore, marketing through DM is just like looking for a needle in a haystack. It is problematic that DMs are often sent but the response rate is still less than 1%, and thus this may be described as a miserable operation. The above three questions prompted this study’s investigation of motivation power, and we constructed an effective method to help insurers develop potential customers. Therefore, the idea of helping insurance companies and insurers and helping them enhancing salaries became the third triggering force, “salary”, to drive this study.
Moreover, based on a survey report from the Ministry of Health and Welfare, the government’s LTCI was launched in 2017, and there are currently about 670,000 people who need long-term care; however, the current LTCI coverage rate in Taiwan is only 2.04% (about 470,000 people), which means that nearly 98% of these people have not purchased LTCI. From the above report, this implies that there is an emerging need for the requirement of LTCI. In addition, insurance experts suggest that individuals should prepare LTCI in advance when they have the possibility of bearing a burden so that their family members can experience a reduced high degree of insecurity and uncertainty in the future, and this can prepare a better-secured “warmth” for family life. Importantly, issues related to LTCI were the fourth, heartwarming driving force, “warm”, of this study.
It is true that we can review and learn the relevant historical data to actively face present and future problems, meet challenges, and solve problems. Therefore, we must always consider whether there are some rules or some attribute correlations among the insurance-related information. Relatively speaking, it is important to find the key attributes of LTCI and to apply effective data or new intelligent hybrid modeling methods [6] as effective auxiliary tools to address the industry data analysis. By developing an effective forecasting model, we can help insurers engage in the business of developing future potential customers. From different perspectives, all the above signs show the key importance of data mining technology, and we can use and trace the application of “new” models for data mining technology to dig out any hidden information from the given data; in particular, treasure can be excavated from past insurance data. Therefore, this study serves to establish future effective decision-making rules and criteria from an amount of LTCI data [7] to help the insurance industry and insurers expand their operating performance. However, insurers face a mature insurance market full of highly uncertain and highly competitive risks now. This situation highlights the strong demand of insurers for valuable information, such as future personal business performance and potential customer feature development. In practice, insurers can be divided into two types: one utilizes subjective judgement, relying on their own subjective consciousness and intuition to “blindly” advocate customers to buy LTCI; conversely, the other utilizes objective analysis, using effective tools to “clearly” screen data collected for identifying potential customer characteristics. The first type has its disadvantages because the subjective person has a slightly random method of choosing targets, which may tend to give the feeling of compulsory insurance sales and lead to poor performance and low morale. On the contrary, the second type has the help of new technology models, and for them it is more feasible to effectively find out potential customers for targeted marketing. Therefore, we need an objective and effective advanced intelligent hybrid LTCI model [8,9] (named AIHLCIM in this study) to help insurers correctly and effectively identify potential LTCI customers and actively develop operating performance. The establishment of this hybrid model can ensure the successful development of potential customers for addressing the key factors of characteristics. Developing the AIHLCIM and its performance evaluation is an urgent need for interested parties under different interest considerations. The important functions of the AIHLCIM include recording practical examples of LTCI, providing forecasting capabilities, providing decision-making knowledge base rules of LTCI potential customers, and supplying interested parties with use. The AIHLCIM can not only identify a group of important determinants that affect LTCI, but also has a valuable property. After the above analysis results, we understand that it is easier to fully mine the characteristics of potential LTCI customers by using some useful and objective tools or methods. The AIHLCIM can not only increase the information transparency or information disclosure of potential customers [10,11], but also can reduce the operating risk of insurers and the insurance industry. More importantly, the calculation and acquisition of data for the AIHLCIM model does not require a highly specialized role, and all insurers easily have this ability in a friendly manner. For insurers, after standardizing the operation and acquisition of this advanced hybrid model [12], it is helpful to easily establish a LTCI prediction model [8]; thus, it becomes a topic of friendly operation and of academic research value.
In the past decades, data mining rule techniques in machine learning technology have developed to a fairly mature and stable stage and can be applied to various fields, such as medical diagnosis analysis, financial management, retail market analysis, manufacturing industry process, and other related fields. However, in our limited review of the literature, it has not been applied to the study of mining potential customer characteristics of LTCI, especially for the advanced intelligent hybrid model built in this study, for which data are even more lacking. Therefore, this study uses the LTCI data collected from existing customers to construct an advanced hybrid model, conduct mining, excavate unknown mineral deposits hidden in a given dataset, extract and summarize decision-making knowledge classification rules, apply them to the actual issues of LTCI, help insurance companies and insurers operate well, and achieve a win–win situation among insurance companies, insurers, and customers. The application of machine learning technology to excavate the laws hidden in the database and provide an advanced model is a practical topic that has considerable reference value for insurers because it can accelerate the improvement of service quality and added value in the insurance industry, continuously improve management performance, and establish sustainable competitive advantages.
From reviewing the limited literature, it was found that the research of LTCI in the early days used traditional statistics-based research frameworks to deal with related LTCI issues and obtained satisfactory results to varying degrees; however, traditional statistical methods have two major problems. First, the results are affected by many factors (or problems) or application constraints. Second, one encounters the limitations of assumptions and conditions during data distribution processing. However, most of the data models used to deal with qualitative or quantitative data often violate the above-mentioned data distribution restrictions in the real world of LTCI, and it is even more difficult to correctly reflect the real insurance market data status. In addition, traditional statistical methods combined with LTCI issues [13] have the following five main shortcomings: (1) past research has not seen the construction of such advanced intelligent hybrid models; (2) no scholars have discussed and developed the application of this practical AIHLCIM; (3) a lack of individual performance measurement to explore the constituent technologies (elements) of this advanced intelligent hybrid model; (4) traditional research results lack effective rule interpretation capabilities, and are put at risk by their black box operations so as to encounter difficulties in decision making; and (5) the above knowledge gap has not been effectively filled. Most of the popular prediction models in recent years are composed of different modes or steps (hybrid or fusion), and their past performance has been obtained in the literature [14,15,16], where it is demonstrated that such an intelligent hybrid model is superior to a stand-alone model, since each classification technique has its strengths and weaknesses. In the past decades, scholars have devoted themselves to the application of intelligent hybrid models, which shows that advanced machine learning technology will still occupy a significant leading position in the future [15]. Based on the above comprehensive discussion, it is urgent to apply objective and effective machine learning techniques to the mining of potential customer characteristics of LTCI and its model performance evaluation [17], and it is also of great development value. Therefore, this study proposes a superior set of advanced intelligent hybrid models, with an eye towards maximizing the advantages of individual models while minimizing their disadvantages.
This study develops the AIHLCIM to eradicate the above two major deficiencies and five major problems. The reasons for the selection of the five main components for the hybrid AIHLCIM models are introduced below. (1) Data discretization technique: First, in order to improve the classification performance of the intelligent models, two application methods of data discretization techniques are proposed, including expert discretization and automatic discretization. According to the research of Ouyang and Chou [18] and Zhao and Wu [19], it is known that expert discretization performance is better than automatic discretization performance, but sometimes it is difficult to obtain the results of expert discretization performance, and automatic discretization is the only good choice. Therefore, based on the above reasons, this study adopts expert discretization for decision-making attributes for better performance and automatic discretization for conditional attributes (because it is difficult for experts to agree on this part). (2) Feature selection method: This is used in the field of data mining technology in the data pre-processing stage, and it plays a very important role, mostly in terms of selecting important key attributes to speed up the experimental operation of the intelligent models [20]. It has the following three key advantages: improving classification prediction efficiency, eliminating experimental overfitting problems, and developing more rapid and effective cost-effectiveness models. Due to its satisfactory research results in the classifier prediction model community, it is often applied to different fields, such as statistical data analysis, financial accounting, medical services, and industrial services [21]. Therefore, it was chosen for the advanced intelligent hybrid model proposed in this study. (3) Machine learning techniques: Many studies have switched to machine learning techniques [22,23,24] to overcome the limitations of statistical assumptions [25] and successfully solve various prediction (or classification) problems in the real world. More common classification techniques used, such as rough set theory (RST) [26], DT [27], RF [28], and MLP [29,30], have become an important research trend at present. Moreover, Bayes network (BN) learning [31], logistic regression (LR) [32], naïve Bayesian (NB) [33], and support vector machine (SVM) [34] classifiers are always emerging techniques helpful for industry application fields; thus, they were also selected and emphasized in this study for the sake of comparison. (4) The rule extraction method: The extracted decision rule set has attracted the attention of many researchers and established an effective decision rule knowledge base to mine hidden information, such as the famous C4.5 of the decision tree and the LEM2 algorithms of the rough set theory, and it has been applied in different fields [35] with outstanding performance. Therefore, this study selects it as the main rule generation technical basis for the advanced intelligent hybrid models. (5) Post hoc test analysis: The well-known ANOVA test and Scheffe’s test [36] were used to effectively review and measure the differences afterwards.
1.3. Research Importance and the Purposes of Research
To sum up the above arguments, these four triggering forces rigorously shape this study and motivate the implementation of this research work. Then, we have the following three positive practices to rationalize the methods proposed in this study. (1) The proposed AIHLCIM in this study has the following advantages: it simplifies the set of decision-making rules, facilitates rule interpretation and understanding, provides robust and reliable empirical results, and simultaneously processes nominal and categorical data. (2) With valuable experience in financial and insurance-related industries, we are confident to establish a knowledge base for mining potential customer characteristics of LTCI. (3) The construction of such a trustworthy LTCI potential customer prediction model is extremely desired by insurance decision makers and insurers for taking advantage of the superior background of industry knowledge and removing the shortcomings of the aforementioned problems. Importantly, this study takes LTCI customers as the research object to organize attribute selection methods, data discretization techniques, rough set theory, decision trees, and different classifiers based on the individual advantages of decision-making rule extraction algorithms and other techniques. Relatively, this study is focused on “insurance field application analysis”, a relatively new field. Based on the limited information, no other researchers have found such a mixed model and applied it to the prediction of potential LTCI customers. Therefore, if the research topic of this study is important, the proposed method is a little innovative and has specific application value and contribution in academics and industries on the research and development of related LTCI studies in this professional field.
Based on the above descriptions, this study has the following research purposes, as follows: (1) Construct a suitable advanced intelligent hybrid model for the mining of potential customer characteristics of LTCI and explore its classification knowledge. (2) Measure the performance difference during verification of the feature selection method. (3) Measure the performance difference during verification of the different classification algorithms. (4) Perform data analysis on the classification accuracy rate. (5) Identify the determinants that affect the LTCI. (6) Generate comprehensible decision-making rules of LTCI purchase as the basis for establishing a knowledge base system.
The remainder of this paper is structured in the following order established. Section 2 describes the related literature review for some topics of LTCI with its application and some emerging classification techniques. Section 3 describes the structures of the proposed hybrid models. Section 4 introduces a real case of long-term insurance data and the empirical results with its discussion. Section 5 describes the research findings and limitations of the research results, and Section 6 reports the analysis of the results and the conclusions for subsequent research.
2. Literature Review
The relevant literature of this study includes LTCI and its related potential customer application issues, feature selection and its related applications, data discretization and its related applications, decision tree learning classifier and its related applications, rough set theory and its related applications, rule filtering methods, and the introduction of other famous classifiers and their related application research, described in detail as follows.
2.1. LTCI and Its Related Application Issues for Developing Potential Customers
It is a true that unpredictable things and good and bad times happen randomly; thus, it is really appropriate to extend the meaning of this sentence to insurance. The so-called “insurance” means that once a risk occurs, it will inevitably cause large or small personal financial losses, but it can be compensated through gathering the resource power (such as money) of everyone from insuring insurance [37]. If you have bought insurance, you can avoid risks and benefit from an agreement of insurance. The real concept of insurance should mean and imply that paying a relatively small amount of money can be exchanged for greater compensation and protection, especially for the need of long-term care in the elderly, when unfortunate things happen. Long-term care refers to the need to provide life care and medical care for a specific group of people whose physical and mental disability lasts for more than 6 months. In response to Taiwan’s aging population with the rapid growth of the population that needs to be specifically taken care of and in order to reduce the burden on the family, the government first proposed the long-term care 1.0 plan, which is the 10-year long-term care plan. Continually, long-term care 2.0 is an upgraded version of 1.0; the original 1.0 service items have been increased from 8 to 17 items in the 2.0 version, the applicable objects have also increased from the original 4 items to 8 items, and the number of services has increased from the original estimate of more than 510,000 people to more than 730,000. Furthermore, driven by the implementation of the long-term service 2.0 project from 2017, the insurance for long-term care has begun and is ready to be offered to the people.
However, in the actual operations of the insurance business, two problems are faced. One is the professionalism of insurance, and the other is that the valuable customer information stored in the database is ineffectively use, which results in a serious problem: potential customers cannot be discovered using existing insurance data for performance enhancement. It is necessary that enterprises should think of the problematic dilemma between the development of new customers and the maintenance of old customers to expand business. For sustainable operation, enterprises must allow old customers to continue to buy new and old products and maintain long-term strong relationships to ensure steady growth in operation performance. In particular, it is interesting that the cost of developing a new customer is several times more than maintaining old customers. Under this concept, it is easier to retain old customers with a low cost; thus, to retain old customers is more important than to constantly develop new customers. With the progress of IT, combined with corporate processes and emerging technology, it is important to collect and quickly analyze insurance customer data to establish an effective prediction model. Liu et al. [38] explained that the customer information system can grasp complete and correct data. By analyzing customer needs through the collected data to reduce transaction costs, switching costs can be increased, and customers’ dependence on enterprises will increase. Alseadoon et al. [39] pointed out that the use of the technical support of software can improve tailor-made services and maintain the maximum profit of enterprises. Woratschek et al. [40] combined enterprise processes and emerging techniques to enable enterprises to better understand all aspects of customer data on continuous innovation, service improvement, and maintenance of customer relationships, thereby improving customer satisfaction and customer loyalty. Sheth and Kellstadt [41] pointed out that database marketing uses computer technology to manage a database system of information about existing customers and potential customers and to establish a good long-term relationship with customers. Shah and Murthi [42] indicated that the purpose of database marketing is to use customer data to improve the application of marketing resources by enterprises, deliver more useful information to specific objects, and maintain a good long-term close relationship with customers.
As stated above, it is an important concept that a good instrument holds good benefits; thus, this study proposes that from the data of some existing customer databases in accordance with the attributes of the databases, we can find out the special features, characteristics, or hidden information of potential customers. Given the above reason, currently only 2.04% of those for whom LTCI is relevant are insured, so there is still a lot of room for growth of selling new products for long-term insurance; thus, we can find a niche that can develop new value from existing customers. Based on this principle, this study establishes a set of advanced and intelligent hybrid models to identify the key attributes that affect the purchase of LTCI and generate the decision-making decision rules for interested parties.
2.2. Feature Selection and Its Related Application
Practice data often have high-dimensional attribute characteristics; however, many past studies have shown that when dealing with high-dimensional data, if the training samples are limited, the Hughes phenomenon will be encountered because high-dimensional data require more training samples. Under a fixed training sample, the classification accuracy gradually decreases as the high-dimensional data continue to increase [43]. At this time, to overcome the above defects, feature selection (or attribute selection) technology is needed as an effective method to lower the dimensions [44,45]. Since the 1970s, attribute selection has been widely studied and used in many research fields, such as statistical technical model analysis [46], machine learning [47], data mining [48,49], etc. Attribute selection has many advantages [50], including: (1) Data collection: It can reduce the cost of data collection, which can reduce the waste of unnecessary collection costs and resources since the amount of data is reduced. The data are also clearer and easier to see. (2) Data processing: By deleting redundant attributes, data storage space can be reduced. Because the amount of data is reduced, the calculation of the classification model can be made more efficient, and the model can be more simplified. (3) Data interpretation: After attribute selection, the shortcomings of irrelevant attributes that interfere with the prediction results can be improved. This also makes the research results more explanatory, accelerates the classification model derivation and explores structured knowledge, and leads to a better ability to explain the results of target variables. Therefore, attribute selection is usually used mainly for the following four reasons: to simplify the model, to be more convenient and easier to interpret, to speed up the model derivation, and to simplify the establishment of structured knowledge. According to the literature [51], evolutionary attribute selection technology can be simply divided into linear and nonlinear models, which are used to screen important conditional attributes and have significantly better performance. In terms of practical statistical applications, it can be widely applied to services in different fields, such as data mining [49] and other industrial services [52], all of which have excellent performance reflections and objective evaluations for reducing model complexity.
In summary, it is known that attribute selection techniques have performed well according to the research results of past scholars. Thus, this study implements and absorbs the advantages of this attribute selection technique to simplify the derivation of this advanced intelligent hybrid model and increase the accuracy of the classification model and accelerates the definition of main determinants that affect the purchase of LTCI.
2.3. Data Discretization and Its Related Application
In the field of data mining, data discretization [53] is an important data preprocessing function. In the literature [19,54], it is pointed out that data discretization includes two methods: expert discretization and automatic discretization. The former represents experts in different fields cutting data according to personal professional experience, judgment, knowledge, or intuition, while the latter uses different mathematical equations to carry out automatic data cutting. Unfortunately, in the real world, due to certain possible problems, such as the amount of data being too large, resources are limited, data experts cannot easily obtain them, subjective factors may be involved, or unreasonable factors may lead to possible wrong decisions, etc. Expert opinion cutting cannot be obtained when there are no expert discretization data for reference, and the automatic discrete method is the only and best choice. There are three core functions of data discretization: (1) it helps reduce the number of subsequent rule generations; (2) it helps improve the performance of classifiers; and (3) it cuts off continuous value attributes, which is helpful for human natural semantics representation of value.
Based on the excellent function of data discretization, this study uses the data discretization method on decision attribute and condition attributes. With the advantages of these two data discretization methods, it helps the proposed hybrid models improve classification quality and generate human nature semantic value for ease of reading and understanding.
2.4. Research on Decision Tree Learning Classifier and Its Related Application
In the field of applied research, the DT learning classifier has been a very popular classification algorithm and prediction tool [55,56] used to analyze data or assist decision making. A DT is a special tree structure that utilizes a tree-like graph and possible outcomes to model a target decision [57]. DTs [27] are commonly used algorithms, including CARTs (classification and regression trees), ID3 (Iterative Dichomizer 3), and C4.5 rule induction algorithms. (1) The CART algorithm was proposed by Breiman et al. [58]; it is a binary DT, which is composed of nodes formed at different stages and branches between nodes under various conditions. (2) The ID3 algorithm is widely used to deal with discrete data and can take into account the advantages of improving the classification accuracy and reducing the complexity of the tree [59]. (3) The C4.5 was proposed by Quinlan [60], mainly to improve the shortcomings of ID3; it uses information theory and selects the attribute with the largest increase in information as the segmentation attribute to construct a complete DT structure by the inductive learning method.
A DT mainly uses the concept of entropy to measure the information value of the attribute; assuming that a set includes a possible result , the entropy for its mathematical algorithm can be defined as the following Equation (1), in which represents the category (class) belonging to the ratio of set [59]:
In addition, represents the information gain of an attribute in the set , and its Equation (2) for mathematical formation is defined as follows:
where the value of attribute is , and is a sub-set of set , then is the number of elements in the sub-set , and is the number of elements in the set .
In summary, a DT [61] has the following advantages: (1) it has the property of fast construction, (2) it can generate decision rule sets, (3) it is easy to understand and implement for rule sets, (4) it can handle data with category attributes concurrently, (5) it has excellent classification performance, and (6) it can make feasible and effective classification results for large data sources in a relatively short period of time. Due to DTs having the above-mentioned advantages, and the resulting decision rules having the advantage of being clear at a glance, a variety of evolutionary DT-related models have been constructed to be applied to various industrial fields, such as finance and banking, industrial fraud detection banking, credit crisis early warning model, and bioinformatics and other integrated application research, and all have performed well.
Therefore, due to the excellent performance and advantages of the DT C4.5 algorithm [61] in the past, it was favored in this study and was selected as one of the best candidates for classifier verification of classification performance.
2.5. Research on Rough Set Theory and Its Related Applications
RST [62,63] has the ability to deal with classification problems of fuzzy and uncertain information, and it thus has been widely used in medical, financial, manufacturing, imaging processing, and other fields of different industries. In RST [26,64], the training sample and the corresponding attributes are regarded as an information system, a decision table is composed of all data, and the decision rule is based on “If conditional attribute then decision attribute” for if–then decision rules to represent. The data composition has lower and upper approximations [65,66,67] as the basis for data classification. The following five major definitions of RST are explained as follows:
Definition 1.
Let
and
, be in a finite set
with non-empty attributes ( is the conditional attributes, and is the decisional attributes), is a reduction set of attributes, and represents a sub-set of the universe of discourse that is a finite (non-empty) set of objects; then let
, be a conditional attribute
for a collection of values, and for observations (objects)
and
, let
and
, and
refers to a decisional attribute.
Definition 2.
For
, it represents that the indiscernibility or equivalence relation is recorded as
, which is called the indiscernibility relation of
, and
represents the equivalence classification of the indiscernibility or equivalence relation of
, which are formatted as the following Equations (3) and (4) for the mathematical algorithm. Importantly, the universe
of discourse is also a finite (non-empty) set of objects.
Definition 3.
In the set
, the lower bound
and the upper bound
of
are represented by approximation sets, which are expressed in Equations (5) and (6) for their mathematical formation below:
is an observation value (object) in the value range , and is the approximately the lower bound of the set , which means that it is included in , and it must belong to the set ; is approximately the upper bound of the set , and this is expressed as the same, as the set has a non-empty intersection that may belong to the set . If the set is a non-empty intersection, then the set is rough or roughly definable as . However, is expressed as the boundary of ; if the lower bound is approximately the same as the upper bound, then the set cannot be classified exactly. The boundary, the positive boundary , and the negative boundary are mathematically formatted as Equations (7)–(9), respectively, as follows:
Next, the classification accuracy and classification quality are defined by the following Equations (10) and (11) for their mathematical formation, respectively. (Note: if , it means that the decision table is consistent; otherwise, it is not consistent.)
Definition 4.
Another important function of RST is defined as
, which is defined as
, and the reduced set is marked as
; it needs to satisfy;
concurrently; that is, it can retain the original attribute set information, and the reduction is expressed in Equation (12) for its mathematical formation, as follows:
Definition 5.
The core is also another important function of RST that can provide the most relevant attribute information. First, let
be the set of all reduced attributes, and the
refers to a non-empty attribute of a finite set with all the conditional attributes and the decisional attributes. The core can be formatted and expressed as Equation (13) for its mathematical definition, as follows:
RST contains two main important functions for attributes: core and reduction. (1) If the set of data attributes is the most relevant and indispensable set of attributes in the data set, it is called the core, (2) but if the set of data attributes is interdependent, all possible minimum sets of attributes can be found, it has the same number of unit sets and provides the same quality as the original data set, and then it is called a reduction. Specifically, if some attributes or attribute values are redundant or repeated in the entire dataset, reduction can filter out or delete these unnecessary attributes or attribute values to form several smaller attribute sets. Thus, the reduction is the smallest set of attributes that can be preserved and represents all original attributes; the core, however, is the set of all reduced common elements. The redundant attributes in the decision table are deleted first, and then the core attributes are found. The purpose of this is to use fewer attributes to classify the data and reduce the difficulty of analyzing the huge dataset without losing the complete information that the original data can provide, bringing more efficient and fast classification results to the construction of models.
To sum up, RST has been widely used in academia and practice recently such as for feature selection [68], and it has achieved excellent performance. In addition, regarding the numerical attribute data, this study has special interests and concerns; that is, it is necessary to discretize the data before performing rule derivation, and then to simplify the model, simplify the number of decision rules, and increase the accuracy rate of the mixed models. Therefore, in this study, we first discretized the data and then implemented the rule derivation. The LEM2 (Learning from Examples Module, version 2) [69] rule derivation algorithm is just more commonly used in the rule derivation method of the LERS (Learning from Examples based on Rough Set) system [70] in such a type. Therefore, this study uses LEM2 as one of the important components of the hybrid models and as the rule derivation algorithm of the main classification technology, after which we conducted a performance evaluation so as to construct a better LTCI hybrid model.
2.6. Rule Filtering Method
A model established using RST as the medium (or basis) has a big disadvantage: The set of decision rules it derives often contains a large number of rules [67], resulting in a complicated number of decision rules that are very difficult to understand. When some extraction rules are redundant or of “poor quality”, these extracted rules limit classification ability and also limit the decision-making simplification principle, causing decision-making troubles. Thus, we must perform some appropriate disposal measures and tasks. In particular, some rule filter algorithms are necessary [71], and they are often used to filter and reduce unnecessary or superfluous decision rules and lower the number of rule sets [72]. For example, the determination of the upper limit on the minimum number of rules can be used to remove some weak rules from the input rule set, and these rules may be redundant or “poor quality”.
Since this study uses two kinds of DT and RST as the rule extraction methods [73] for the main classification techniques, we know that the rule filter method has some specific advantages in the mixed model of this study; its necessity demonstrates its key importance. In addition to increasing the accuracy rate of the proposed models and reducing the number of generated rules, they also increase the model’s interpretation ability and simplify the decision-making process for creating the decision-making rule set.
2.7. Other Well-Known Classifier Techniques and Related Application Areas
To enhance the comparable performance of the hybrid model, this study applies some well-known classification techniques into the proposed models as performance evaluations and comparison functions. The techniques used include BN learning, LR, MLP, NB, RF, and SVM classifiers described as follows: (1) BN learning is a well-known classification algorithm in machine learning areas for the application of industry data analysis. We have also learned from the past that it has advantageous performance in different fields, such as vault settlement in urban tunnels [74]. (2) LR [32,75] is mainly used to discuss the relationship between the dependent and the independent variables, which is suitable for the situation of the binary category data of the dependent variable. For example, the two results (with and without insurance) that are suitable for predicting LTCI are addressed in a method of reaction variable statistical model analysis on learning from the literature, and its past classification performance is also very outstanding. (3) The MLP neural network is one of the more popular neural networks at present [29,76] and has three layers, the input layer, hidden layer, and output layer, uses supervised learning, and can handle nonlinear problems with good classification performance. This neural network has the following advantages: high model accuracy, nonlinear model construction, different types of input variables, wide range of application fields, and ambiguity of input and output variables allowed. (4) The NB [33,63] is a statistical classification method, and it can be expressed in the “icon model” to explain the relationship between each attribute. NB can be used to calculate the possible values, hoping to achieve a complete and reasonable speculation; therefore, it can be used to explore and predict the classification models. For example, the literature has designed a set of intrusion detection systems to further reduce the classification of characteristic selection. Simple NB classification can produce the best performance because this classifier has the advantages of simple use, fast operation speed, and good classification accuracy rate, and it is currently widely used in classification prediction for data exploration and analysis. (5) In the field of ML, RF [28] has a result of wide application scope and satisfactory performance, and it has gradually attracted the attention of academic circles. In addition to regression and classification work, it can be applied to the attribute reduction task and also has good results in handling omissions and abnormal values. It has the following advantages, especially applicable to classification problems: generating high classification accuracy, training and test speed, strong fault-tolerant capability, and handling high-dimensional characteristics data. (6) The SVM [34,77,78] is based on the core function of statistical learning theory for training and learning; following input of the training data, it can be used to find a maximum boundary that can separate the data for classification. It is a supervised learning method based on statistical theory. In addition to being widely used in the data analysis of statistical classification models for patterns, it can also be used as a tool for LR analysis. SVM has the following three advantages: (a) better generalized application ability; (b) better classification results; and (c) faster data training.
Based on the above instructions, the above six famous classifiers were selected as evaluation criteria for comparative studies of the advanced hybrid models in this study because of their outstanding performance in past research.
3. The Proposed AIHLCIM
This section mainly describes the proposed AIHLCIM, including the reasons for using it and its algorithm in detail, as follows:
3.1. Reasons for Using the Proposed Models
According to a report by the Economic Daily on 26 April 2018 (https://www.businessweekly.com.tw/business/blog/22593 accessed on 24 October 2021), although Taiwan’s insurance penetration ranks first in the world, the coverage rate of LTCI in Taiwan is only 2.04%; from this viewpoint, there is still a lot of room for improvement in LTCI coverage. In other words, the need of insurers for help defining the related characteristics of potential customers for LTCI indicates that data mining technology has important practical application value. After preliminary investigation on perspectives of exploration from the limited literature, we learned that most scholars in past research have focused on discussing property insurance issues (such as fire insurance, automobile insurance, etc.), but relatively few have focused on life insurance, especially in LTCI. Effectively mining the characteristics of potential customers is not only important, but also can bring substantial long-term benefits to the promotion of performance of insurance companies and insurers. However, there is currently a lack of applied research on this practical application analysis of insurance data. In addition to relying on salespersons to develop their annual performance marketing plans (such as introduction to old acquaintances or blind sales to strangers), insurance companies only rely on customer source guidance for business promotion, but technology–customer development education and training is not the only effective development strategy or tactical SOP method. Obviously, from the limited literature review, there is a serious lack of effective relevant technologies or predictive models for “LTCI” customer development. Therefore, if there is an effective potential customer development model, this is a good thing that will definitely attract great attention from academic circles and industry. This study thus came into being in such a meaningful context, engaged in a valuable and interesting research topic. Based on the motivation of helping insurance companies and insurers, this study builds a set of practical advanced intelligent hybrid models, and the characteristics of potential customers of LTCI are excavated from the insurance policy data of existing customers. Some applications of our research results are effectively providing insurers with help in developing potential customers, making the most efficient visits, speeding up and implementing new LTCI policies for the company, increasing training confidence and the application of auxiliary resources, reducing frustration, and creating the maximum benefits for insurers and insurance companies.
It becomes very important to engage in knowledge mining with excellent data mining techniques for transforming data into formalized knowledge capabilities by extracting hidden or undiscovered rule information from a large number of heterogeneous databases [79]. Therefore, how to combine a set of useful professional learning techniques to find out the characteristics of potential customers, avoid waste of resources, and verify the technology performance of the individual model and the advanced intelligent hybrid model are the focus and benefit of this research. The following subsections continue to describe the research methods adopted, and the details are introduced as follows.
3.2. The Proposed Models Used
This study proposes an advanced intelligent hybrid long-term care insurance model (called AIHLCIM) including four processing stages: data collection, data preprocessing, rule learning, and two-order in-depth performance evaluation. The constituent elements include attribute selection technology, data discretization methods, the decision tree C4.5, the rough set classifier LEM2, rule extraction and rule filters, relative comparison (or comparative studies; BN, LR, MLP, NB, RF, and SVM), ANOVA and Scheffe’s post hoc tests, etc. In order to verify performance with/without the use of the attribute selection method, with/without the use of data discretization technology, with/without the use of rule filtering technology, the difference between different rule derivation algorithms (C4.5 and LEM2), the combination differences of single models and advanced intelligent hybrid models were compared, and two-order depth grade verification was performed. A total of 16 (Models A-P) intelligent hybrid models are shown in Table 1 below, mainly to evaluate the performance of different component technologies applied to the LTCI experimental data set.
The processing flow of the 16 models includes 4 phases, 5 relative techniques, and 11 respective steps; due to limited space, it is shown in Figure 1 below. Practically, from our review of the literature, these advanced intelligent hybrid models have application innovation and importance in the field of long-term care 2.0 projects. Long-term care issues may seriously affect us in real-life practice; these proposed models thus help research investigations solve the professional problems of insurers and insurance company in a systematic way.
In this research, we briefly describe the institution of the four main processing phases of the AIHLCIM and its component combinations as follows:
- (1)
- Data collection phase: This consists of three sub-steps: (a) selection of insurance-source databases, (b) selection of basic attributes, and (c) collection of data. The key point is to first select the possible initial basic condition attributes through the relevant insurance and financially experienced knowledge of experts, then select the used condition attributes based on the relevant LTCI literature. Accordingly, supplemented by insurance experts’ knowledge of the unique characteristics of Taiwan’s insurance industry and LTCI experience, some conditional attributes are also selected; the sum of the above attributes is for all conditional attributes. Finally, the relevant attribute data are collected.
- (2)
- The data preprocessing phase: This includes three sub-steps: (a) format conversion, (b) selection of important attributes, and (c) data discretization. The key direction of this phase is to apply the necessary preprocessing procedures to the collected data, including (a) first removing multiple incorrect or noisy observations that may have arisen, (b) removing possible outlier examples, (c) converting the collected data set into the necessary format for the experiment, such as an EXCEL .csv file, to facilitate subsequent experimental operations, and (d) making a simple data normalization technique used for modeling all the ML-based methods for the benefits of a uniform format, good for follow-up experiments; then, attribute selection technology are used to remove irrelevant or redundant condition attributes. In order to further obtain the effective combination of important attributes, it is beneficial to reduce the complexity of the model (that is, reduce the data dimensions) and improve the predictive ability. Finally, the data discretization technique is applied to the numerical (digital) data of the key influencing condition attributes on the LTCI after the attributes are selected; the automatic discretization method is used to cut the individual attribute data into different interval values to leverage human natural language expressions (e.g., small, medium, and large) and enhance classifier performance.
- (3)
- The rule learning phase: This also consists of three sub-steps: (a) rule generation, (b) rule testing, and (c) rule filtering. Key tasks at this stage include first executing the extraction decision rule algorithm (such as C4.5 or LEM2), executing rule testing, and then performing the filtering decision rule work (only LEM2 requires it, because C4.5 has the rule prune function). The main detailed tasks are to discretize the numerical data of the selected important condition attributes, add whether the decision attribute is LTCI (coded Y: yes and N: no), and then put all the attribute data into DT and RST classifiers according to three types of data partitioning: 66% for training and 34% for testing (i.e., about 2:1), 75%/25% (3:1), and 80%/20% (4:1) sub-sets. The combined data are randomly disassembled, and the C4.5 and LEM2 algorithms are accordingly executed to generate rules. A meaningful decision rule set is thus extracted; concurrently, the number of rules of a set generated by the testing is obtained with the initial classification accuracy. Finally, the support threshold for LEM2 is separately set, the decision rules with too-low support are filtered out, and the disadvantage of too many rules in the rough set is overcome, thereby reducing the complexity of the decision rules and improving the classification quality.
- (4)
- The performance evaluation phase: This majorly includes two sub-steps: (a) the first stage involves a performance evaluation and (b) the second stage involves post-event statistical verification. The focus of the first stage is to randomly divide the experimental data set into the same proportion again, 66% as the training data sub-set and the remaining 34% as the testing data sub-set, so as to test the performance of the AIHLCIM and compare it with other different ML techniques. The comparison benchmarks are as follows: (a) internal comparison (for Models A-P, 16 models), (b) single model and intelligent hybrid model comparison (comparison of Models A-L vs. M-P), and (c) external comparison (comparison of optimal Models A-L vs. M-P accuracy rate). Following this, model performance is analyzed according to internal comparison, single model and intelligent hybrid model comparison, and external comparison according to self-defined evaluation criteria: (d) performance comparisons of the rough set and decision tree for properties such as accuracy rate, and (e) performance comparison of C4.5 and LEM2 for rule induction. The second stage involves (a) a one-way ANOVA analysis of variance and (b) a post hoc test of Schaeffer’s method to understand the empirical results of significant differences in the accuracy of the methods and the degree of difference between their groups. Afterwards, the results of differences are analyzed and the reasons are discussed, conclusions are made from the results, and the possible implications and possible major findings of the experimental results in terms practical management for the insurance industry are explained.
The following introductions detail the actual implementations and steps of the AIHLCIM algorithm with a real case study and research institute in detail, as follows:
3.2.1. Phase 1: Data Collection
- Step 1. Select the insurance database
First, we collected relevant insurance data (including LTCI) from potential databases, such as those from life insurance companies, as the experimental data set to verify and review the performance of the AIHLCIM proposed in this study.
- Step 2. Select basic attributes
We then selected attribute data from three aspects: (1) we first found out the relevant basic attributes from the data of a certain life insurance company, (2) then used variables used in the relevant literature as conditions; (3) in accordance with the professional experience of cooperative insurance experts in the relevant insurance industry, the selection of conditional attributes was added; the attributes selected by organizing these three directions were regarded as the basic condition attributes of this research. The preliminary acquisition of 31 original attributes includes gender, education, marriage, nature of work, whether the spouse is working, family salary structure, payment method, occupation, position, payer, location of the policyholder, main source of income, whether the three generations live together, the date when insurance policy was purchased for the first time, whether to repurchase investment insurance policy, whether to repurchase savings policy, whether to repurchase accident insurance policy, whether to pay renewal premiums, whether to refer customers, age, number of family members, approximate annual salary, the total number of insurance policies purchased in the past, the number of valid policies, the time in months since the first purchase, the insured amount of critical illness insurance, the total premiums of effective insurance policies for this year, the total insurance amount of property insurance, the total insurance amount of life insurance, the total sum of insured insurance, and total insurance premiums. After an interview and discussion with experts, 19 features of the above 31 original attributes remained. For the convenience of expression in the text for the reserved features, C1–C19 are used to represent the above 19 condition attributes, and D1 (class category code) represents a decision attribute (Y means LTCI and N means no LTCI); at the same time, this data set is named LTCI (long-term care insurance), and its detailed information is shown in Table 2.
- Step 3. Collect data
After the basic attributes were selected and established, we started to collect data from different sources. This part of the work was handled carefully so as not to cause any omissions or to affect the final empirical results due to data errors. Accordingly, we ran the analysis of descriptive statistics to calculate the relevant information of attributes, such as maximum value (max), minimum value (min), mean value (mean), and standard deviation, after collecting. It is helpful to understand the important information of each attribute’s observation value.
3.2.2. Phase 2: Data Preprocessing
- Step 4. Format conversion
Data preprocessing plays a very important role in data mining work [49], as real-world data may have outliers (attributes have exceptional values), noise (such as garbled characters or data errors), or inconsistent cases (such as inconsistent codes or names, or abnormal values), resulting in errors that the data cannot match with; all these serious problems show the necessity and importance of data preprocessing work. Therefore, we needed to remove or correct outliers, noises, and inconsistencies. Then, we converted the processed data mentioned above and used simple normalization jobs, such as making a uniform data length for each attribute and coding attributes, for parsing the proposed methods into the same format (such as an EXCEL.csv). Afterwards, we performed attribute coding for the benefits of a unified and identified formatting, which also facilitated subsequent experimental operations and procedures to be carried out more simply and efficiently through the use of coded data. Specifically, all these numeric data used were in the same unit of new Taiwan dollars (abbreviated as NT$), applicable for the following experiments. Importantly, the decision attribute was coded according to expert opinions, and the encoded attributes C1–C19 and D1 were identified and determined.
- Step 5. Select important attributes
We learned from the literature [79] that attribute selection can effectively reduce the data dimensions. This sub-step focuses on the application of the attribute selection method and completely deletes irrelevant (meaningless) or redundant condition attributes to achieve the purpose of selecting important attributes, prevent unnecessary attributes from interfering with experimental results, and increase the performance advantages of advanced intelligent hybrid models. Therefore, this sub-step was only executed in Models A-H (please refer to Table 1 above) and was not executed in the other models.
- Step 6. Perform data discretization
According to the literature [80], the data discretization method is not only helpful for the extraction of the decision rules set and can be explained in human natural language, but also helps to improve the accuracy of the classifier. Data discretization is divided into two types: expert discretization and automatic discretization. Therefore, this step focuses on using different discretization techniques to discretize the important conditional attributes obtained in the previous steps (only for numerical attributes). For example, if the discrete results are represented by L1, L2, and L3, indicating the upper, middle, and lower semantic values, respectively, the natural language of these data can be fully expressed, and then the model can be interpreted more naturally. This step was executed for Models A-D and Models I-L (please see Table 1) using expert and automatic discretization, respectively.
- Step 6-1. Execute expert discretization
Using the opinions of experts in the insurance field, the decision-making attribute was divided into two categories: Y and N, which represent “with LTCI” and “without LTCI”, respectively, to facilitate the understanding of interpretable results produced by sets of decision rules.
- Step 6-2. Execute automatic discretization
In this sub-step, we adopted the automatic discretization technique to apply data discretization to the selected important numerical condition attributes mentioned above to automatically cut the attributes into different interval values to represent different natural semantic values.
3.2.3. Phase 3: Rule Learning
- Step 7. Rule generation
In this sub-step, we executed the rule derivation algorithms of DT-C4.5 (Models B, F, J, N) and RST-LEM2 (Models C, D, G, H, K, L, O, P), since they have the advantage of being able to derive a minimal set of rules to represent the original data set without changing the structure of the original data and without being affected by the absence of certain observations; the resulting of “If…Then” general decision rule set can be used to discover the unknown information hidden in the data, and these have become two of the most commonly used decision rule derivation algorithms. In addition, the algorithms mentioned above [69] have the advantage of being able to directly derive a decision rule set from a symbolic or numerical attribute of the data set. Therefore, in this study, we used them to randomly cut the new experimental data set generated in the previous step (including the important condition attributes and decision attributes after the discretization of the data) into 66% training data set and 34% testing data set, the minimum set of decision-making rules was extracted, and these rules of each category (two categories in total) were deduced as the basis for predicting the insurance status of LTCI in the future. The generation of a decision rule set is jointly established by important condition attributes and decision attributes, similar to the general rules of “If conditions then decisions.” Moreover, the ratios 75%/25% (3:1) and 80%/20% (4:1) of training/testing data were run again for this step.
An example is expressed as follows:
Rule 1: “If (C4 is high) & (C14 is high) Then Class = Y”, interpreted in natural language as: “If C4 is a high value (−0.2252–∞) and C14 is a high value (0.545–∞)…, then the customer (subject) is a person with LTCI.” Such a structured knowledge base system enables stakeholders to easily interpret the true meaning of the decision-making rules, and then we can calculate the strength of the rules based on the number of supports each rule received.
- Step 8. Rule testing
Using the above initially structured decision-making rule set, and then using the remaining 33% of the testing data set to test the performance of the above listed classifiers, the original classification accuracy rate of each classifier was achieved.
- Step 9. Rule filtering
This sub-step includes two possible situations; one is to execute the rule filter (Models C, G, K, O), and the other is to skip it and not execute it. The RST algorithm has the disadvantage of generating too many rules, and it increases the complexity of the rule set [81]. Therefore, in order to solve this defect, rule filtering techniques are important for effectively improving the quality of the rules [72]. In this sub-step, we first set a threshold based on the support number of the rule (for example, set the number of supports to be less than or equal to 1 (i.e., ≤1), because these decision rules represent that at most only one instance conforms to this rule), and then set the threshold value of the following rules for deletion. This proactive approach is based on the following reasons: (1) When more rules are generated, it means that more conditions must be considered, which increases the complexity of the advanced intelligent hybrid model. (2) When there are too many rules with low support, it means that the explanatory power of the predicted results from these rules is not high. (3) The quality of prediction can be improved through the regular filtering method, and the classification accuracy rate can be further increased. The above focus is on reducing the number of rules and providing the smallest subset with the same function or even better, giving decision makers a simple, easy, and meaningful knowledge-based decision rule set as a reference for future decision making for interested parties.
3.2.4. Phase 4: Two-Order in-Depth Performance Evaluation
- Step 10. The first-order performance evaluation
The performance of the AIHLCIM was addressed for the first-order verification. The evaluation criteria used include the accuracy rate (the higher the better), the number of important attributes (the less the better), the number of decision-making rules (the less the better), and the standard deviation of accuracy rate (the smaller the better). This sub-step is divided into the following three items to execute: (1) Perform internal comparison: Compare the Models A-P (16 models) of the proposed AIHLCIM and evaluate the effects of their individual constituent elements, including (a) Models A-H vs. I-P for first-order verification with or without feature selection differences in methods; (b) Models A-D vs. E-H and Models I-L vs. M-P for first-order verification with or without differences in data discretization method, respectively; and (c) Models C vs. D, G vs. H, K vs. L, and N vs. O to verify whether there is a difference in the use of the rule filter method for RST classifiers. (2) Perform model comparison between single models and hybrid models: Use Models A-L vs. M-P to verify the model difference between the single model and hybrid model (that is, to review the conclusion of the literature: the hybrid model is better than the single model in terms of classification accuracy). (3) Execute external comparison: This refers to comparing the internal comparison of the previous item on the highest accuracy rate with the ML techniques commonly used in the literature for forecasting LTCI (a total of six types: BN, LR, MLP, NB, RF, and SVM, which can be regarded as external classifiers in this study) compared with DT and RST for result comparison and difference analysis. Therefore, in order to verify the performance of the AIHLCIM in the first-order verification, the data need to be randomly divided into two sub-experimental data sets of 66%/34% (training/testing) again; the 66% training data set was also used to generate the classification decision rule set, and then the classification accuracy was evaluated using the 34% testing data set. After performing this random repetition 10 times, the average accuracy rate, the average number of decision rules, and the standard deviation for equivalent performance index between the average accuracy rate and the number of decision rules were calculated. Afterwards, we compared the performance with the above eight classifiers; finally, we found the best classifier among the above three different comparison results and analyzed and summarized the experimental results. Furthermore, based on the limited literature, although general evaluation indicators, such as the classification accuracy, area under ROC (AUC), precision rate, recall rate, and F1-score [82] are commonly used to measure the performance of classification models constructed for further verification, they have different evaluation directions with different performance objectives. Thus, if there are no special requirements for a particular class, we can directly use the indicator of the classification accuracy as a representative to evaluate the built model, as accurateness is the evaluation of performance from the perspective of the overall model, and it has great value for measuring the overall evaluation results of models. Importantly, it is emphasized in this research that only classification accuracy was used for an indicator of performance evaluation to assess the performance of models from the view of the overall model.
- Step 11. The second-order statistical test
Finally, this sub-step involves performing the second-order result difference test and explore the possible reasons. Run first the following two sub-steps: (1) One-way ANOVA [25] is used to test whether there is a significant difference in the accuracy rate of the different ML techniques mentioned above at the 95% confidence level and re-verify the study model performance. (2) Scheffe’s post hoc test [83] is also used. After one-way ANOVA analysis, if the F value reaches a significant level, then use Scheffe’s post hoc test to confirm that the above method is correct and whether there is a group difference in the accuracy rate and its degree of difference. Reconfirm the three comparison results of the previous step, including internal comparison, model comparison, and external comparison, and review the best classifier among them. (3) For the RST classifier, further verify whether there is a trade-off relationship between the accuracy rate, coverage rate, number of rules, and the standard deviation between the accuracy rate and the number of rules proposed in the literature [84]. Finally, perform a difference analysis, make a conclusion of the analysis results, and explain the potential practical management implications and possible major findings of the research results. More importantly, it is noted that the experiments of training/testing models were designed to conduct a fair comparison to ensure truly unbiased results, and thus, it is needed to compare classification models in a context of fair competition in an informative manner. Thus, one of the research purposes is just to make a basis of fair comparison for implementing the comparative study in this research. Based on the above reason, in order to facilitate a fair competition, it is highlighted that we employed all the default values for tuning the parameters of different classifiers in the used open-source package software for when the developed experiments were executed.
4. Empirical Results of a Case Study
The proposed hybrid model, AIHLCIM, was used to evaluate the classification performance with a real case study, and the collected LTCI data set was analyzed. Thus, this section majorly explores the data analysis of the experiment results for the practical case, including empirical results of the first subsection and some discussion for the study results in the second subsection.
4.1. Empirical Results
Inspired by the four drivers of motivations, this study mainly concerns LTCI data from some insurance companies that were collected before October, 2022 as the research object; this study develops an advanced objective and effective intelligent hybrid model to analyze and identify important determinants affecting LTCI purchase, extract classification decision-making rule sets to establish rule-based knowledge, and provide valuable information and understandable practical decision-making rules to stakeholders. Concurrently, according to the experimental output, the important indicators were established by the rules of decision trees, rough sets, and the feature selection technique. The interested parties can use them for future reference and use in related LTCI issues. With the empirical results of this study, there are main seven key points defined and achieved as follows.
- (1)
- For descriptive statistics: First, a descriptive statistic is a means of quantitatively describing the basic feature information of a given data set by generating summaries about the sample of data; thus, they can provide enough summaries about statistical information from the sample and the measures. Based on the collected data from the LTCI data set, the descriptive statistics were divided into two tabulated forms of information, including nominal data in Table 3 and numerical data in Table 4. From Table 3 and Table 4, it is clear that C1–C11 and D1 are nominal data of attributes, and C12–C19 belong to the numerical data of conditional attributes. D1 has 167 records coded “Y” (Yes, referring to having LTCI) and 340 records coded “N”. As for Table 4, it is observed that the minimum value, maximum value, mean value, and standard deviation were determined for the numerical attributes C12–C19.
- (2)
- For implementing results of feature selection: In this study, some feature selections were used for finding out important attributes in order to benefit experiment operation. There are two ways to be addressed in this step. (1) First, the CFS (correlation-based feature selection) subset evaluator method can be used to measure the worth of subsets of features that have high correlation with the class and consider the individual predictive ability of each feature for working well together, along with the degree of redundancy between attributes; thus, CFS and DT were used and implemented for selecting important attributes in this study. Table 5 lists the results of feature selection methods for implementing CFS and DT. From Table 5, it is clear that attributes C12, C17, and C19 are really key important features of decision attributes (with/without LTCI) based on the two feature selection techniques. (2) Second, three attribute evaluator methods were also used for another measurement, including the gain ratio feature evaluator, information gain ranking filter, and OneR feature evaluator, for evaluating attributes in ranking. Table 6 lists the comparison information for the results of these three similar feature selection methods, gain ratio, information gain, and OneR, in ranking the importance of attributes. Importantly, for the gain ratio and information gain methods, the threshold was o.1; thus, the attributes C19 (0.193918), C17 (0.193723), C12 (0.121827), and C15 (0.114906) were identified using gain ratio, and for information gain, the attributes C19 (0.347007), C17 (0.151519), C13 (0.127195), and C12 (0.124875) were identified. However, for the OneR method, the threshold was 70, and thus the attributes C19 (79.4872), C17 (75.5424), C12 (72.5838), C13 (71.7949), C14 (71.2032), and C18 (70.6114) were also determined. It is very clear that the important attributes are C19, C17, and C12 because they have common intersection.
- (3)
- For running results of automatic data discretization: The data discretization technique is used to discretize the numerical data of attributes for creating comprehensible semantic values in natural language. The semantic value has the meaning of an expression, which refers to expressing the result of a division into linguistically similar word types and deals directly with values for the subsequent attribution of possible objects. Thus, this step of data discretization involves the performance of an automation data discretization technique, and the implementing results are described in Table 7. For example, there are three semantic alternatives of levels for low, medium, and high values of natural language for C12 and two semantic alternatives for low and high values of natural language for C14. This effective function can yield an outcome of better classification accuracy and benefit its classification advantage.
- (4)
- Comparative study: There were seven parts to the comparison studies.
- (a)
- Model comparison: Regarding model comparison, a total of 16 models were compared each other, and Table 8 lists their comparison results in classification accuracy under three different ratios of data partitioning. From Table 8, it is clear that based on the average accuracy, Model H > G > I > E > L > M > J > A > B > K > F > C, D > P > O > N, and the top three accuracies are H➔G➔I. The Models H and G belong to the RST classifier; thus, it is very clear that the RST classifier has the best average accuracy of the combinations of the three ratios (66%/34%, 75%/25%, and 80%/20%) of data partitioning in the proposed AIHLCIM for the LTCI data set.
- (b)
- Classifier comparison: For a fair basis of comparison, all the eight classifiers used in this study were compared without the feature selection and data discretization methods. The experiments for the eight classifiers were run with the three different ratios again. Table 9 shows the comparison results. As a result, the top three average accuracies are DT, RST, and RF for sequential expression. From Table 9, the best classifier was selected from the eight pure classifiers, that being that which has the better accuracy in the same ratio of data partitioning for the LTCI data set. It is clear that DT has the best value (91.09%) in terms of classification accuracy in the ratio of 80%/20%.
- (c)
- Component comparison with feature selection and data discretization: Similarly, the above eight classifiers were compared under the condition of having both feature selection and data discretization methods for the purpose of component comparison. Thus, the experiments were run with three different ratios once more. Table 10 shows the comparison results, and the top three average accuracies are MLP, RF, and DT for sequential expression. From Table 10, the best classifier was selected from the eight classifiers under the condition of both components, that being that which has the better accuracy in the same ratio of data partitioning for the LTCI data set. It is clear that RST (no filter) has the best value (88.10%) for all the classification accuracies in the ratio of 80%/20%.
- (d)
- Component comparison only with feature selection: The above eight classifiers were compared again within the condition of only having the feature selection method for the same purpose of component comparison. The experiments were also run with the same ratios mentioned above once again. Table 11 lists the comparison results. As predicted, the top three average accuracies are RST (no filter), RF, and DT in sequential expression. From Table 11, the best classifier was selected from the eight classifiers under the condition of implementing feature selection, that being that which has the better accuracy in the same ratio of data partitioning for the LTCI data set. It is clear that RST has the best value (96.60%) of all the classification accuracies in the ratio of 66%/34%.
- (e)
- Component comparison only with data discretization: Similarly, the above eight classifiers were compared again in the condition of only having the data discretization technique for the purpose of component comparison. These experiments were also run with the same three ratios mentioned above. Table 12 shows their comparison results. Consequently, the top three average accuracies are LR, RF, and SVM in ranking order. From Table 12, the best classifier was also selected from the eight classifiers under the condition of implementing data discretization, that being that which has the best accuracy in the same ratio of data partitioning for the LTCI data set. It is clear that RF has the best value (94.06%) across all the classification accuracies in the ratio of 80%/20%.
- (f)
- Model comparison in 10 times: For a fair base of comparison, all the eight pure classifiers used were compared without both the feature selection and data discretization methods in 66%/34% for 10 times. The experiments were repeatedly run with a same ratio for 10 times. Table 13 lists their comparison results. As a result, the top three average accuracies in 10 runs were DT, RF, and LR for sequential expression. From Table 13, the best classifier was selected from the eight pure classifiers, that being that which has the best accuracy in the partitioning ratio 66%/34% of data for the LTCI data set. In general, it is clear that DT wins the best role in terms of average classification accuracy, but for standard deviation, the top three standard deviations (stability) in 10 runs are NB, MLP, and RF.
- (g)
- Filter comparison of RST for accuracy, total coverage, and rule numbers with standard deviation: For further exploring the RST classifier, the experiments were defined with/without filter in terms of average classification accuracy, total coverage, and rule numbers with their standard deviation in 66%/34% across 10 times repeatedly for the LTCI data set. Table 14 shows these comparison results for RST. From Table 14, for the comparison of with/without filter, it is clear that the average accuracy rate (72.67 vs. 73.87), total coverage (0.43 vs. 0.40), and rule numbers (105.0 vs. 71.3) have a better outcome after performing the rule filtering technique; concurrently, most of the standard deviations also have more stable outcomes. These facts imply that the rule filtering technique is an effective method for the RST classifier. This case makes a verification and validation of the result from the literature review.
- (5)
- For induced results of decision rules on a set: In this component, there were two rule induction algorithms used, DT-C4.5 and LEM2. The rule induction method is a function of machine learning fields in which a formal decision rule set is extracted to represent a full scientific model of the given data from a set of observations. Thus, the DT-C4.5 and LEM2 induction algorithms were used to extract the decision rules set for identifying the decision features of LTCI. (1) First, two types of DT algorithms were induced and figured, including a DT-C4.5 rules set in a ratio of 66%/34% after implementing feature selection and data discretization techniques and a same ratio and one without feature selection and data discretization techniques. Table 7 displays the former rule results and Table 8 lists the latter results. For an example of rule expression, if C19 = (30400~95000] and C17 = (-inf~2.04], then Class = Y (i.e., with a LTCI). (2) Second, the RS-LEM2 algorithm was used to generate a rule set upon which was performed feature selection and data discretization techniques. In total, there were only 12 rules in the set created for extracting a decision-making knowledge base for future references and uses. Take Rule 12 as a case: If C4 = Y and C12 = (6.5~inf), then D1 (i.e., Class) = Y (i.e., with a LTCI).
- (6)
- For in-depth performance evaluation of statistical tests: Accordingly, second-order in-depth performance evaluation methods for difference tests, one-way ANOVA and Scheffe’s post hoc tests, were used in this step for further validating the classifier performance in different partition ratios. First, the one-way ANOVA test was used to measure and investigate whether there is a statistically significant difference at the 95% confidence level between the means of more than two groups to one independent factor and one dependent factor. Second, a Scheffé test is a post hoc statistical analysis of a class used for multiple comparisons between group means to determine where a significant result exists if the F value reaches a significant level. Thus, in order to further measure the eight classifiers (for ease of presentation, BN, LR, MLP, NB, RF, SVM, DT, and RST (no filter) are coded using the numbers 1–8, respectively), each classifier was repeatedly run 10 times in the 70%/30% data ratio again, and 10 samples were obtained. The results of the one-way ANOVA for the accuracy are at a confidence level of 0.95. As a result, they significantly differ, which refers to having a significant difference in their classification accuracy rate. It is presented that three groups were identified: 7, 5, 2 > 1, 6 > 8, 4, 3; that is, DT, RF, and LR > BN and SVM > RST, NB, and MLP, for the result of Scheffe’s test. No significant difference was defined in the three groups: (a) DT, RF, and LR, (b) BN and SVM, and (c) RST, NB, and MLP.
- (7)
- Further verifying a trade-off relationship: For further reviewing the RST classifier, this step re-verifies the trade-off relationship under coverages 0.9 and 0.8 among the accuracy rate, total coverage, and number of rules for executing a sensitivity analysis of RST models in three different ratios (66%/34%, 75%/25%, and 80%/20%). Table 15 shows the results comparison. From Table 15, it is clear that in coverage 0.9, the accuracy rate, total coverage, and number of rules are higher values than those of coverage 0.8. Thus, there exists a trade-off relationship between coverages 0.9 and 0.8 in this study issue data for the RST classifier.
4.2. Discussion
This study discusses four directions with the rising issue of LTCI from two perspectives of technical and applicable solutions.
First, from a technical perspective, although this study issue exists as a trade-off relationship under coverages 0.9 and 0.8 for the RST classifier from Table 14, it is still needed to measure more coverage ratios, such as coverages 07, 0.6, and 0.5, of data for further confirming the empirical results. Second, for the RST in the LTCI issue, its performance does not always yield such good application results, and its model stability is not stable enough to continuously maintain good classification accuracy. A possible reason is that the feature selection method is more suitable for the RST classifier than the data discretization method. This interesting issue is valuable to be further explored, and it can be used to re-assess the RST performance for different conditions, such as the evaluation standard or data discretization method, in future work. Third, from the application view, the investigation of LTCI can encourage confidence in purchasing this insurance plan as early as possible since LTCI is not just required for the elderly, and any person may encounter challenges from illnesses or accidents and thus need it. Due to this reason, taking out LTCI to fulfill the gaps in interrupted income or nursing expenses in the possible future is a basic concept for the need for LTCI. Fourth, although this study does not support the novelty method, it has industrial application value and contributes to the industry with regard to a special LTCI field; this study is mainly interested in proposing some data pre-treatment techniques, such as feature selection and data discretization techniques, to increase the built model performance and to compare with some extensive comparative studies in addressing the emerging LTCI issue. Conclusively, the study results for the comparative experiments are acceptable and feasible for using the LTCI data in the research. Thus, this study can provide an alternative for constructive judgments of LTCI industry data to the interested parties.
5. Findings and Limitations of Research Results
There are two types of research results addressed. First, six research findings were found to benefit interested parties with regard to the studied issue. Second, research limitations are also described and discussed, as follows.
5.1. Research Findings
After performing the feature selection and data discretization techniques, it is a main concern to explore the research findings to provide a complete review for showing the performance of the proposed hybrid models. Thus, six key points of the research findings from the experimental results are identified, as follows.
- (1)
- (2)
- For the key important attributes, C19, C17, and C12, they are discretized in three, three, and seven semantic values from Table 7, which can be represented as (low, medium, and high), (low, medium, and high), and (very low, low, low medium, medium, high-medium, high, very high) in natural language, respectively, which can improve the model performance.
- (3)
- The DT and RST classifiers are focused on the proposed AIHLCIM, and it was found that the DT classifier has better classification accuracy than RST for the LTCI issue.
- (4)
- Comprehensible knowledge-based decision rules of a set were generated, which can be used as an effective reference for identifying and tracing future LTCI issues.
- (5)
- The accuracy of the proposed AIHLCIMs are all above 85% in average accuracy from Table 8, and this is an acceptable prediction accuracy rate for a variety of industry data analyses.
- (6)
- It was also found that attribute selection and data discretization methods have better classification results than that of single methods when they are used together.
5.2. Research limitations
It is needed to further explore the research limitations in LTCI predictions of this study, as follows. (1) The LTCI data set was collected from Taiwan’s industry companies; thus, it is limited in terms of regional features. (2) Long-range restriction for a time period needs to be considered. Learning about types of historical timelines to identify the differences in chronological timelines is also necessary. (3) We still need to examine the concerns of the LTCI industry data regarding the temporality of all attributes. (4) The extensive property and popularity of data from diverse databases was also limited in this study.
6. Conclusions
According to the experimental results in this study, we can conclude the research outcomes for the LTCI issue, followed by research contributions and subsequent research.
6.1. Conclusions of the Study Results
After implementing the framework and components of the proposed AIHLCIM, empirical results are concluded in the following 10 core points, as follows:
- (1)
- The hybrid model creates better performance than that of the single model in LTCI data for improving classification accuracy.
- (2)
- (3)
- The feature selection and data discretization techniques have better performance for most of the models used in the study towards the studied issue.
- (4)
- Data discretization techniques can create understandable knowledge for human natural semantic representation of values, which is very helpful to the interested parties. See Table 7.
- (5)
- The generation of knowledge-based decision rules of a set, such as Figure 2, Figure 3 and Figure 4, using DT and RST is easy to understand and can be applied to LTCI practices to help insurers identify new potential customers and create a good situation for insurance companies to promote business operation.
- (6)
- (7)
- The better classifiers and the less accurate classifiers were identified by the conducted experiments across 1 run and 10 runs, respectively.
- (8)
- From Table 14, it is implied that the rule filtering technique is an effective method for the RST classifier to improve classification accuracy and model stability and lower the total rule numbers generated.
- (9)
- The significant difference of eight classifiers was determined, and the group difference was also identified.
- (10)
- From Table 15, the trade-off relationship exactly exists between the accuracy rate, total coverage, and number of rules for the RST model in the three ratios (66%/34%, 75%/25%, and 80%/20%) when comparing coverage 0.9 with coverage 0.8.
6.2. Contributions of the Study
Regarding the research contributions, there are two directions addressed, including the industrial contribution and academic contribution of this study, as follows. First, regarding the industrial contribution, this study provides knowledge-based decision rules for making good decisions in future LTCI issues with helpful findings and good managerial implications for addressing future stakeholder endeavors, and the study results significantly contribute to helpful managerial tools as a feasible alternative for LTCI solutions to discover sustainable elderly life. Concurrently, this study effectively identifies the key determinants influencing LTCI. Consequently, this study thus has an industrial contribution for interested parties. Second, although this study does not address the creation of a novel method, the advanced hybrid models are primarily focused on and intensified by the impressive results for achieving the applicable value. Moreover, the proposed AIHLCIM constructing such a hybrid procedure for the LTCI issue has yet to be seen in past research from the limited literature review; thus, the study has distinct merit, with an important academic contribution for research works. Importantly, no classification model is absolutely suitable for all industrial data in a variety of application fields, and thus defining a suitable classifier to identify specific industry data analyses is very important for overcoming the LTCI issues from the perspective of machine learning methods. Given the above descriptions, the study yields a significant scientific benefit when compared to the actuarial literature.
6.3. Subsequent Studies
From all the empirical results in this study, although some good performances for predicting the issues of LTCI are addressed, there is still some room for the improvement of future research in the following 11 directions for the interested parties. (1) Use different industry data to further measure the performance of proposed hybrid models, such as Big Data analytics [85]. (2) Use different hybrid models to test the LTCI data set and to re-verify the proposed hybrid models for the promotion of LTCI, such as deep learning versus logistic regression models [86]. (3) Use different time periods of data analysis to further re-identify the proposed hybrid model performance for research. (4) Add more different state-of-the-art classifiers, such as genetic algorithms (GAs), to the proposed hybrid models for revalidation. (5) Use different evaluation indicators, such as precision rate, recall rate, and F1-score, to further measure the performance of classification models constructed for further verification, except for classification accuracy, because they have different evaluation directions with different performance objectives. (6) Add different conditional attributes into the LTCI data set to re-validate the practical application of the results of this study, and compare their results of the difference in effectiveness. (7) Use different feature selection methods to re-identify the important conditional attributes in influencing the issues related to LTCI. (8) Use different data discretization techniques to discretize the numerical data of conditional attributes for further measuring the performance of the proposed hybrid model. (9) Use different types data partition methods, such as the 10-fold cross-validation method [87]. (10) Further tune the parameters of the learning-based methods for finding optimal parameters of the investigated models. (11) For the poor classifiers with low accuracy, the rationality for use and potential improvement can be further addressed in subsequent work.
Author Contributions
Conceptualization, Y.-S.C.; methodology, Y.-S.C.; software, Y.-S.C. and Y.-H.H.; visualization, Y.-S.C., Y.-H.H. and Y.-S.L.; writing—original draft, Y.-S.C.; writing—review and editing, Y.-S.C., Y.-H.H. and Y.-S.L. All authors have read and agreed to the published version of the manuscript.
Funding
This research was partially supported by the National Science and Technology Council of Taiwan by grant numbers NSTC 110-2410-H-167-017 and 111-2221-E-167-036-MY2.
Data Availability Statement
Not applicable.
Conflicts of Interest
The authors declare no conflict of interest.
References
- Wu, X.; Xiao, L.; Sun, Y.; Zhang, J.; Ma, T.; He, L. A survey of human-in-the-loop for machine learning. Future Gener. Comput. Syst. 2022, 135, 364–381. [Google Scholar] [CrossRef]
- Lemke, H.U. Moving from data, information, knowledge and models to wisdom-based decision making in the domain of Computer Assisted Radiology and Surgery (CARS). Int. J. Comput. Assist. Radiol. Surg. 2022, 17, 1513–1517. [Google Scholar] [CrossRef] [PubMed]
- van Wees, M.; Duijs, S.E.; Mazurel, C.; Abma, T.A.; Verdonk, P. Negotiating masculinities at the expense of health: A qualitative study on men working in long-term care in the Netherlands, from an intersectional perspective. Gend. Work. Organ. 2023, 1–19. [Google Scholar] [CrossRef]
- Ngally, P. The Role of CHF-IMIS in health insurance scheme: A digital solution for enhancing penetration of health insurance coverage in Tanzania. Tanzan. J. Health Res. 2022, 23, 134–135. [Google Scholar]
- McKenzie, K.; Smith-Merry, J. Responding to complexity in the context of the national disability insurance scheme. Soc. Policy Soc. 2023, 22, 139–154. [Google Scholar] [CrossRef]
- Asadi, M.J.; Shabanlou, S.; Najarchi, M.; Najafizadeh, M.M. A hybrid intelligent model and computational fluid dynamics to simulate discharge coefficient of circular side orifices. Iran. J. Sci. Technol. Trans. Civ. Eng. 2021, 45, 985–1010. [Google Scholar] [CrossRef]
- Kojima, T.; Hamaya, H.; Ishii, S.; Hattori, Y.; Akishita, M. Association of disability level with polypharmacy and potentially inappropriate medication in community dwelling older people. Arch. Gerontol. Geriatr. 2023, 106, 104873. [Google Scholar] [CrossRef]
- Chen, L.; Zhang, L.; Xu, X. Review of evolution of the public long-term care insurance (LTCI) system in different countries: Influence and challenge. BMC Health Serv. Res. 2020, 20, 1057. [Google Scholar] [CrossRef]
- Feng, Z.L.; Glinskaya, E.; Chen, H.T.; Gong, S.; Qiu, Y.; Xu, J.M.; Yip, W.N. Long-term care system for older adults in China: Policy landscape, challenges, and future prospects. Lancet 2020, 396, 1362–1372. [Google Scholar] [CrossRef]
- Dominguez, R.; Cannella, S.; Ponte, B.; Framinan, J.M. On the dynamics of closed-loop supply chains under remanufacturing lead time variability. OMEGA-Int. J. Manag. Sci. 2020, 97, 102106. [Google Scholar] [CrossRef]
- Pätäri, E.; Karell, V.; Luukka, P.; Yeomans, J.S. Comparison of the multicriteria decision-making methods for equity portfolio selection: The U.S. evidence. Eur. J. Oper. Res. 2018, 265, 655–672. [Google Scholar] [CrossRef]
- Fung, D.W.; Wei, P.; Yang, C.C. State subsidized reinsurance programs: Impacts on efficiency, premiums, and expenses of the US health insurance markets. Eur. J. Oper. Res. 2023, 306, 941–954. [Google Scholar] [CrossRef]
- del Val, E.B.; Claramunt Bielsa, M.M.; Varea Soler, X. Role of private long-term care insurance in financial sustainability for an aging society. Sustainability 2020, 12, 8894. [Google Scholar] [CrossRef]
- Jiang, D.; Tu, G.; Jin, D.; Wu, K.; Liu, C.; Zheng, L.; Zhou, T. A hybrid intelligent model for acute hypotensive episode prediction with large-scale data. Inf. Sci. 2021, 546, 787–802. [Google Scholar] [CrossRef]
- Klinkel, S.; Chen, L.; Dornisch, W. A NURBS based hybrid collocation-Galerkin method for the analysis of boundary represented solids. Comput. Methods Appl. Mech. Eng. 2015, 284, 689–711. [Google Scholar] [CrossRef]
- Ravi Kumar, P.; Ravi, V. Bankruptcy prediction in banks and firms via statistical and intelligent techniques—A review. Eur. J. Oper. Res. 2007, 180, 1–28. [Google Scholar] [CrossRef]
- Baracchini, T.; Hummel, S.; Verlaan, M.; Cimatoribus, A.; Wuest, A.; Bouffard, D. An automated calibration framework and open source tools for 3D lake hydrodynamic models. Environ. Model. Softw. 2020, 134, 104787. [Google Scholar] [CrossRef]
- Ouyang, R.L.; Chou, C.A. Integrated optimization model and algorithm for pattern generation and selection in logical analysis of data. Environ. Model. Softw. 2020, 134, 104787. [Google Scholar] [CrossRef]
- Zhao, X.; Wu, L. Classification and pruning strategy of knowledge data decision tree based on rough set. In Data Processing Techniques and Applications for Cyber-Physical Systems (DPTA 2019); Advances in Intelligent Systems and Computing; Huang, C., Chan, Y.W., Yen, N., Eds.; Springer: Singapore, 2020; Volume 1088. [Google Scholar] [CrossRef]
- Gao, L.Y.; Wu, W.G. Relevance assignation feature selection method based on mutual information for machine learning. Knowl.-Based Syst. 2020, 209, 106439. [Google Scholar] [CrossRef]
- Solorio-Fernández, S.; Martínez-Trinidad, J.F.; Carrasco-Ochoa, J.A. A supervised filter feature selection method for mixed data based on spectral feature selection and information-theory redundancy analysis. Pattern Recognit. Lett. 2020, 138, 321–328. [Google Scholar] [CrossRef]
- Cohen, J.P.; Ding, W.; Kuhlman, C.; Chen, A.; Di, L. Rapid building detection using machine learning. Appl. Intell. 2016, 45, 443–457. [Google Scholar] [CrossRef] [Green Version]
- Nascimento, D.C.; Pires, C.E.; Mestre, D.G. Applying machine learning techniques for scaling out data quality algorithms in cloud computing environments. Appl. Intell. 2016, 45, 530–548. [Google Scholar] [CrossRef]
- Nesarani, A.; Ramar, R.; Pandian, S. An efficient approach for rice prediction from authenticated Block chain node using machine learning technique. Environ. Technol. Innov. 2020, 20, 101064. [Google Scholar] [CrossRef]
- Stracca, L. Our currency, your problem? The global effects of the Euro debt crisis. Eur. Econ. Rev. 2015, 74, 1–13. [Google Scholar] [CrossRef]
- Yan, C.; Li, Z.; Boota, M.W.; Zohaib, M.; Liu, X.; Shi, C.; Xu, J. River pattern discriminant method based on Rough Set theory. J. Hydrol. Reg. Stud. 2023, 45, 101285. [Google Scholar] [CrossRef]
- Abreu, L.R.; Maciel, I.S.; Alves, J.S.; Braga, L.C.; Pontes, H.L. A decision tree model for the prediction of the stay time of ships in Brazilian ports. Eng. Appl. Artif. Intell. 2023, 117, 105634. [Google Scholar] [CrossRef]
- Kishino, M.; Matsumoto, K.; Kobayashi, Y.; Taguchi, R.; Akamatsu, N.; Shishido, A. Fatigue life prediction of bending polymer films using random forest. Int. J. Fatigue 2023, 166, 107230. [Google Scholar] [CrossRef]
- Yan, J.; Zeng, S.; Tian, B.; Cao, Y.; Yang, W.; Zhu, F. Relationship between highway geometric characteristics and accident risk: A multilayer perceptron model (MLP) approach. Sustainability 2023, 15, 1893. [Google Scholar] [CrossRef]
- Zhang, Y.; Li, Y.; Sun, J.; Ji, J. Estimates on compressed neural networks regression. Neural Netw. 2015, 63, 10–17. [Google Scholar] [CrossRef] [Green Version]
- Kitson, N.K.; Constantinou, A.C.; Guo, Z.; Liu, Y.; Chobtham, K. A survey of Bayesian Network structure learning. Artif. Intell. Rev. 2023, 56, 8721–8814. [Google Scholar] [CrossRef]
- Song, Y.X.; Yang, X.D.; Luo, Y.G.; Ouyang, C.L.; Yu, Y.; Ma, Y.L.; Mi, W.D. Comparison of logistic regression and machine learning methods for predicting postoperative delirium in elderly patients: A retrospective study. CNS Neurosci. Ther. 2023, 29, 158–167. [Google Scholar] [CrossRef]
- Kim, T.; Lee, J.S. Maximizing AUC to learn weighted naive Bayes for imbalanced data classification. Expert Syst. Appl. 2023, 217, 119564. [Google Scholar] [CrossRef]
- Qin, Z.; Li, Q. An uncertain support vector machine with imprecise observations. Fuzzy Optim. Decis. Mak. 2023, 1–19. [Google Scholar] [CrossRef]
- Meng, X.; Zhang, P.; Xu, Y.; Xie, H. Construction of decision tree based on C4.5 algorithm for online voltage stability assessment. Int. J. Electr. Power Energy Syst. 2020, 118, 105793. [Google Scholar] [CrossRef]
- Fujioka, A.; Nagano, M.; Ikegami, K.; Masumoto, K.H.; Yoshikawa, T.; Koinuma, S.; Shigeyoshi, Y. Circadian expression and specific localization of synaptotagmin17 in the suprachiasmatic nucleus, the master circadian oscillator in mammals. Brain Res. 2023, 1798, 148129. [Google Scholar] [CrossRef] [PubMed]
- Wang, K.M.; Lee, Y.M. Are life insurance futures a safe haven during COVID-19? Financ. Innov. 2023, 9, 13. [Google Scholar] [CrossRef] [PubMed]
- Liu, Y.; Soroka, A.; Han, L.; Jian, J.; Tang, M. Cloud-based big data analytics for customer insight-driven design innovation in SMEs. Int. J. Inf. Manag. 2020, 51, 102034. [Google Scholar] [CrossRef]
- Alseadoon, I.; Ahmad, A.; Alkhalil, A.; Sultan, K. Migration of existing software systems to mobile computing platforms: A systematic mapping study. Front. Comput. Sci. 2021, 15, 152204. [Google Scholar] [CrossRef]
- Woratschek, H.; Horbel, C.; Popp, B. Determining customer satisfaction and loyalty from a value co-creation perspective. Serv. Ind. J. 2020, 40, 777–799. [Google Scholar] [CrossRef]
- Sheth, J.; Kellstadt, C.H. Next frontiers of research in data driven marketing: Will techniques keep up with data tsunami? J. Bus. Res. 2021, 125, 780–784. [Google Scholar] [CrossRef]
- Shah, D.; Murthi, B.P.S. Marketing in a data-driven digital world: Implications for the role and scope of marketing. J. Bus. Res. 2021, 125, 772–779. [Google Scholar] [CrossRef]
- Hughes, H.D. The settlement of disputes in the public service. Public Adm. 1968, 46, 45–62. [Google Scholar] [CrossRef]
- Al-Tashi, Q.; Abdulkadir, S.J.; Rais, H.M.; Mirjalili, S.; Alhussian, H. Approaches to multi-objective feature selection: A systematic literature review. IEEE Access 2020, 8, 125076–125096. [Google Scholar] [CrossRef]
- Thakkar, A.; Lohiya, R. Fusion of statistical importance for feature selection in deep neural network-based intrusion detection system. Inf. Fusion 2023, 90, 353–363. [Google Scholar] [CrossRef]
- Lin, R.H.; Pei, Z.X.; Ye, Z.Z.; Guo, C.C.; Wu, B.D. Hydrogen fuel cell diagnostics using random forest and enhanced feature selection. Int. J. Hydrogen Energy 2020, 45, 10523–10535. [Google Scholar] [CrossRef]
- Kazemi, F.; Asgarkhani, N.; Jankowski, R. Predicting seismic response of SMRFs founded on different soil types using machine learning techniques. Eng. Struct. 2023, 274, 114953. [Google Scholar] [CrossRef]
- Nguyen, B.H.; Xue, B.; Zhang, M. A survey on swarm intelligence approaches to feature selection in data mining. Swarm Evol. Comput. 2020, 54, 100663. [Google Scholar] [CrossRef]
- Zhang, B.; Tseng, M.L.; Qi, L.; Guo, Y.; Wang, C.H. A comparative online sales forecasting analysis: Data mining techniques. Comput. Ind. Eng. 2023, 176, 108935. [Google Scholar] [CrossRef]
- Seeja, K.R. Feature selection based on closed frequent itemset mining: A case study on SAGE data classification. Neurocomputing 2015, 151, 1027–1032. [Google Scholar] [CrossRef]
- Zhang, Z.; He, J.; Gao, G.; Tian, Y. Sparse multi-criteria optimization classifier for credit risk evaluation. Soft Comput. 2017, 23, 3053–3066. [Google Scholar] [CrossRef]
- Kaba, A.; Ramaiah, C.K. Demographic differences in using knowledge creation tools among faculty members. J. Knowl. Manag. 2017, 21, 857–871. [Google Scholar] [CrossRef]
- Qian, W.; Li, Y.; Ye, Q.; Ding, W.; Shu, W. Disambiguation-based partial label feature selection via feature dependency and label consistency. Inf. Fusion 2023, 94, 152–168. [Google Scholar] [CrossRef]
- Chen, Y.S.; Lin, C.K.; Chou, J.C.L.; Hung, Y.H.; Wang, S.W. Research on industry data analytics on processing procedure of named 3-4-8-2 components combination for the application identification in new chain convenience store. Processes 2023, 11, 180. [Google Scholar] [CrossRef]
- Alaka, H.A.; Oyedele, L.O.; Owolabi, H.A.; Akinade, O.O.; Bilal, M. Systematic review of bankruptcy prediction models: Towards a framework for tool selection. Expert Syst. Appl. 2018, 94, 164–184. [Google Scholar] [CrossRef]
- Sarker, I.H.; Colman, A.; Han, J. BehavDT: A behavioral decision tree learning to build user-centric context-aware predictive model. Mob. Netw. Appl. 2020, 25, 1151–1161. [Google Scholar] [CrossRef] [Green Version]
- Lu, H.; Ma, X. Hybrid decision tree-based machine learning models for short-term water quality prediction. Chemosphere 2020, 249, 126169. [Google Scholar] [CrossRef]
- Breiman, L.; Friedman, J.H.; Olshen, R.A.; Stone, C.J. Classification and Regression Trees; Wadsworth International Group: Belmont, CA, USA, 1984. [Google Scholar]
- Quinlan, J.R. Induction of decision trees. Mach. Learn. 1986, 1, 81–106. [Google Scholar] [CrossRef] [Green Version]
- Quinlan, J.R. C4.5: Programs for Machine Learning; Morgan Kaufmann Publishers: San Mateo, CA, USA, 1993. [Google Scholar]
- Sarailidis, G.; Wagener, T.; Pianosi, F. Integrating scientific knowledge into machine learning using interactive decision trees. Comput. Geosci. 2023, 170, 105248. [Google Scholar] [CrossRef]
- Luo, J.; Fujita, H.; Yao, Y.; Qin, K. On modeling similarity and three-way decision under incomplete information in rough set theory. Knowl.-Based Syst. 2020, 191, 105251. [Google Scholar] [CrossRef]
- Zhang, C.; Li, D.; Kang, X.; Song, D.; Sangaiah, A.K.; Broumi, S. Neutrosophic fusion of rough set theory: An overview. Comput. Ind. 2020, 115, 103117. [Google Scholar] [CrossRef]
- Yolcu, A.; Benek, A.; Öztürk, T.Y. A new approach to neutrosophic soft rough sets. Knowl. Inf. Syst. 2023, 65, 2043–2060. [Google Scholar] [CrossRef]
- Hu, C.; Zhang, L. Efficient approaches for maintaining dominance-based multigranulation approximations with incremental granular structures. Int. J. Approx. Reason. 2020, 126, 202–227. [Google Scholar] [CrossRef]
- Jiang, H.; Hu, B.Q. On two new types of fuzzy rough sets via overlap functions and corresponding applications to three-way approximations. Inf. Sci. 2023, 620, 158–186. [Google Scholar] [CrossRef]
- Sun, B.; Ma, W.; Li, B.; Li, X. Three-way decisions approach to multiple attribute group decision making with linguistic information-based decision-theoretic rough fuzzy set. Int. J. Approx. Reason. 2018, 93, 424–442. [Google Scholar] [CrossRef]
- Yin, T.; Chen, H.; Yuan, Z.; Li, T.; Liu, K. Noise-resistant multilabel fuzzy neighborhood rough sets for feature subset selection. Inf. Sci. 2023, 621, 200–226. [Google Scholar] [CrossRef]
- Grzymala-Busse, J.W. A comparison of three strategies to rule induction from data with numerical attributes. In Proceedings of the International Workshop on Rough Sets in Knowledge Discovery (RSKD 2003), Warsaw, Poland, 5–13 April 2003; pp. 132–140. [Google Scholar]
- Grzymala-Busse, J.W. A new version of the rule induction system LERS. Fundam. Informaticae 1997, 31, 27–39. [Google Scholar] [CrossRef]
- Cui, L.; Ren, T.; Zhang, X.; Feng, Z. Optimization of large-scale knowledge forward reasoning based on OWL 2 DL ontology. In Collaborative Computing: Networking, Applications and Worksharing: 18th EAI International Conference, CollaborateCom 2022, Hangzhou, China, 15–16 October 2022, Proceedings, Part II; Springer Nature: Cham, Switzerland, 2023; pp. 380–399. [Google Scholar]
- Nguyen, H.S.; Nguyen, S.H. Analysis of stulong data by rough set exploration system (RSES). In Proceedings of the ECML/PKDD 2003 Discovery Challenge, Dubrovnik, Croatia, 22–26 September 2003; pp. 71–82. [Google Scholar]
- Obregon, J.; Jung, J.Y. RuleCOSI+: Rule extraction for interpreting classification tree ensembles. Inf. Fusion 2023, 89, 355–381. [Google Scholar] [CrossRef]
- Wu, X.; Feng, Z.; Liu, Y.; Qin, Y.; Yang, T.; Duan, J. Enhanced safety prediction of vault settlement in urban tunnels using the pair-copula and Bayesian network. Appl. Soft Comput. 2023, 132, 109711. [Google Scholar] [CrossRef]
- Yang, Y.; Chen, G.; Reniers, G. Vulnerability assessment of atmospheric storage tanks to floods based on logistic regression. Reliab. Eng. Syst. Saf. 2020, 196, 106721. [Google Scholar] [CrossRef]
- Huang, L.; Leng, H.; Li, X.; Ren, K.; Song, J.; Wang, D. A data-driven method for hybrid data assimilation with multilayer perceptron. Big Data Res. 2020, 23, 100179. [Google Scholar] [CrossRef]
- Ghaddar, B.; Naoum-Sawaya, J. High dimensional data classification and feature selection using support vector machines. Eur. J. Oper. Res. 2018, 265, 993–1004. [Google Scholar] [CrossRef]
- Singh, V.; Poonia, R.C.; Kumar, S.; Dass, P. Prediction of COVID-19 corona virus pandemic based on time series data using Support Vector Machine. J. Discret. Math. Sci. Cryptogr. 2020, 23, 1583–1597. [Google Scholar] [CrossRef]
- Wiharto, W.; Kusnanto, H.; Herianto, H. System diagnosis of coronary heart disease using a combination of dimensional reduction and data mining techniques: A review. Indones. J. Electr. Eng. Comput. Sci. 2017, 7, 514–523. [Google Scholar] [CrossRef]
- Pawlak, Z. Rough Sets, Theoretical Aspects of Reasoning about Data; Kluwer: Dordrecht, The Netherlands, 1991. [Google Scholar]
- Chen, Q.; Guo, Z.; Zhao, J.; Ouyang, Q. Comparisons of different regressions tools in measurement of antioxidant activity in green tea using near infrared spectroscopy. J. Pharm. Biomed. Anal. 2012, 60, 92–97. [Google Scholar] [CrossRef] [PubMed]
- Vij, R.; Arora, S. A novel deep transfer learning based computerized diagnostic Systems for Multi-class imbalanced diabetic retinopathy severity classification. Multimed. Tools Appl. 2023, 1–38. [Google Scholar] [CrossRef]
- Yap, A.U.; Ong, J.E.; Yahya, N.A. Effect of resin coating on highly viscous glass ionomer cements: A dynamic analysis. J. Mech. Behav. Biomed. Mater. 2020, 113, 104120. [Google Scholar] [CrossRef]
- Tsumoto, S. Incremental rule induction based on rough set theory. In International Symposium on Methodologies for Intelligent Systems; Lecture Notes in Computer Science; LNAI 6804; Springer: Berlin/Heidelberg, Germany, 2011; pp. 70–79. [Google Scholar]
- Wang, J.; Xu, C.; Zhang, J.; Zhong, R. Big data analytics for intelligent manufacturing systems: A review. J. Manuf. Syst. 2022, 62, 738–752. [Google Scholar] [CrossRef]
- Shi, H.Y.; Yeh, S.C.J.; Chou, H.C.; Wang, W.C. Long-term care insurance purchase decisions of registered nurses: Deep learning versus logistic regression models. Health Policy 2023, 129, 104709. [Google Scholar] [CrossRef]
- Chen, Y.-S.; Lin, C.-K.; Chou, J.C.-L.; Chen, S.-F.; Ting, M.-H. Application of advanced hybrid models to identify the sustainable financial management clients of long-term care insurance policy. Sustainability 2022, 14, 12485. [Google Scholar] [CrossRef]
Figure 1.
The processing flow of the proposed AIHLCIM.
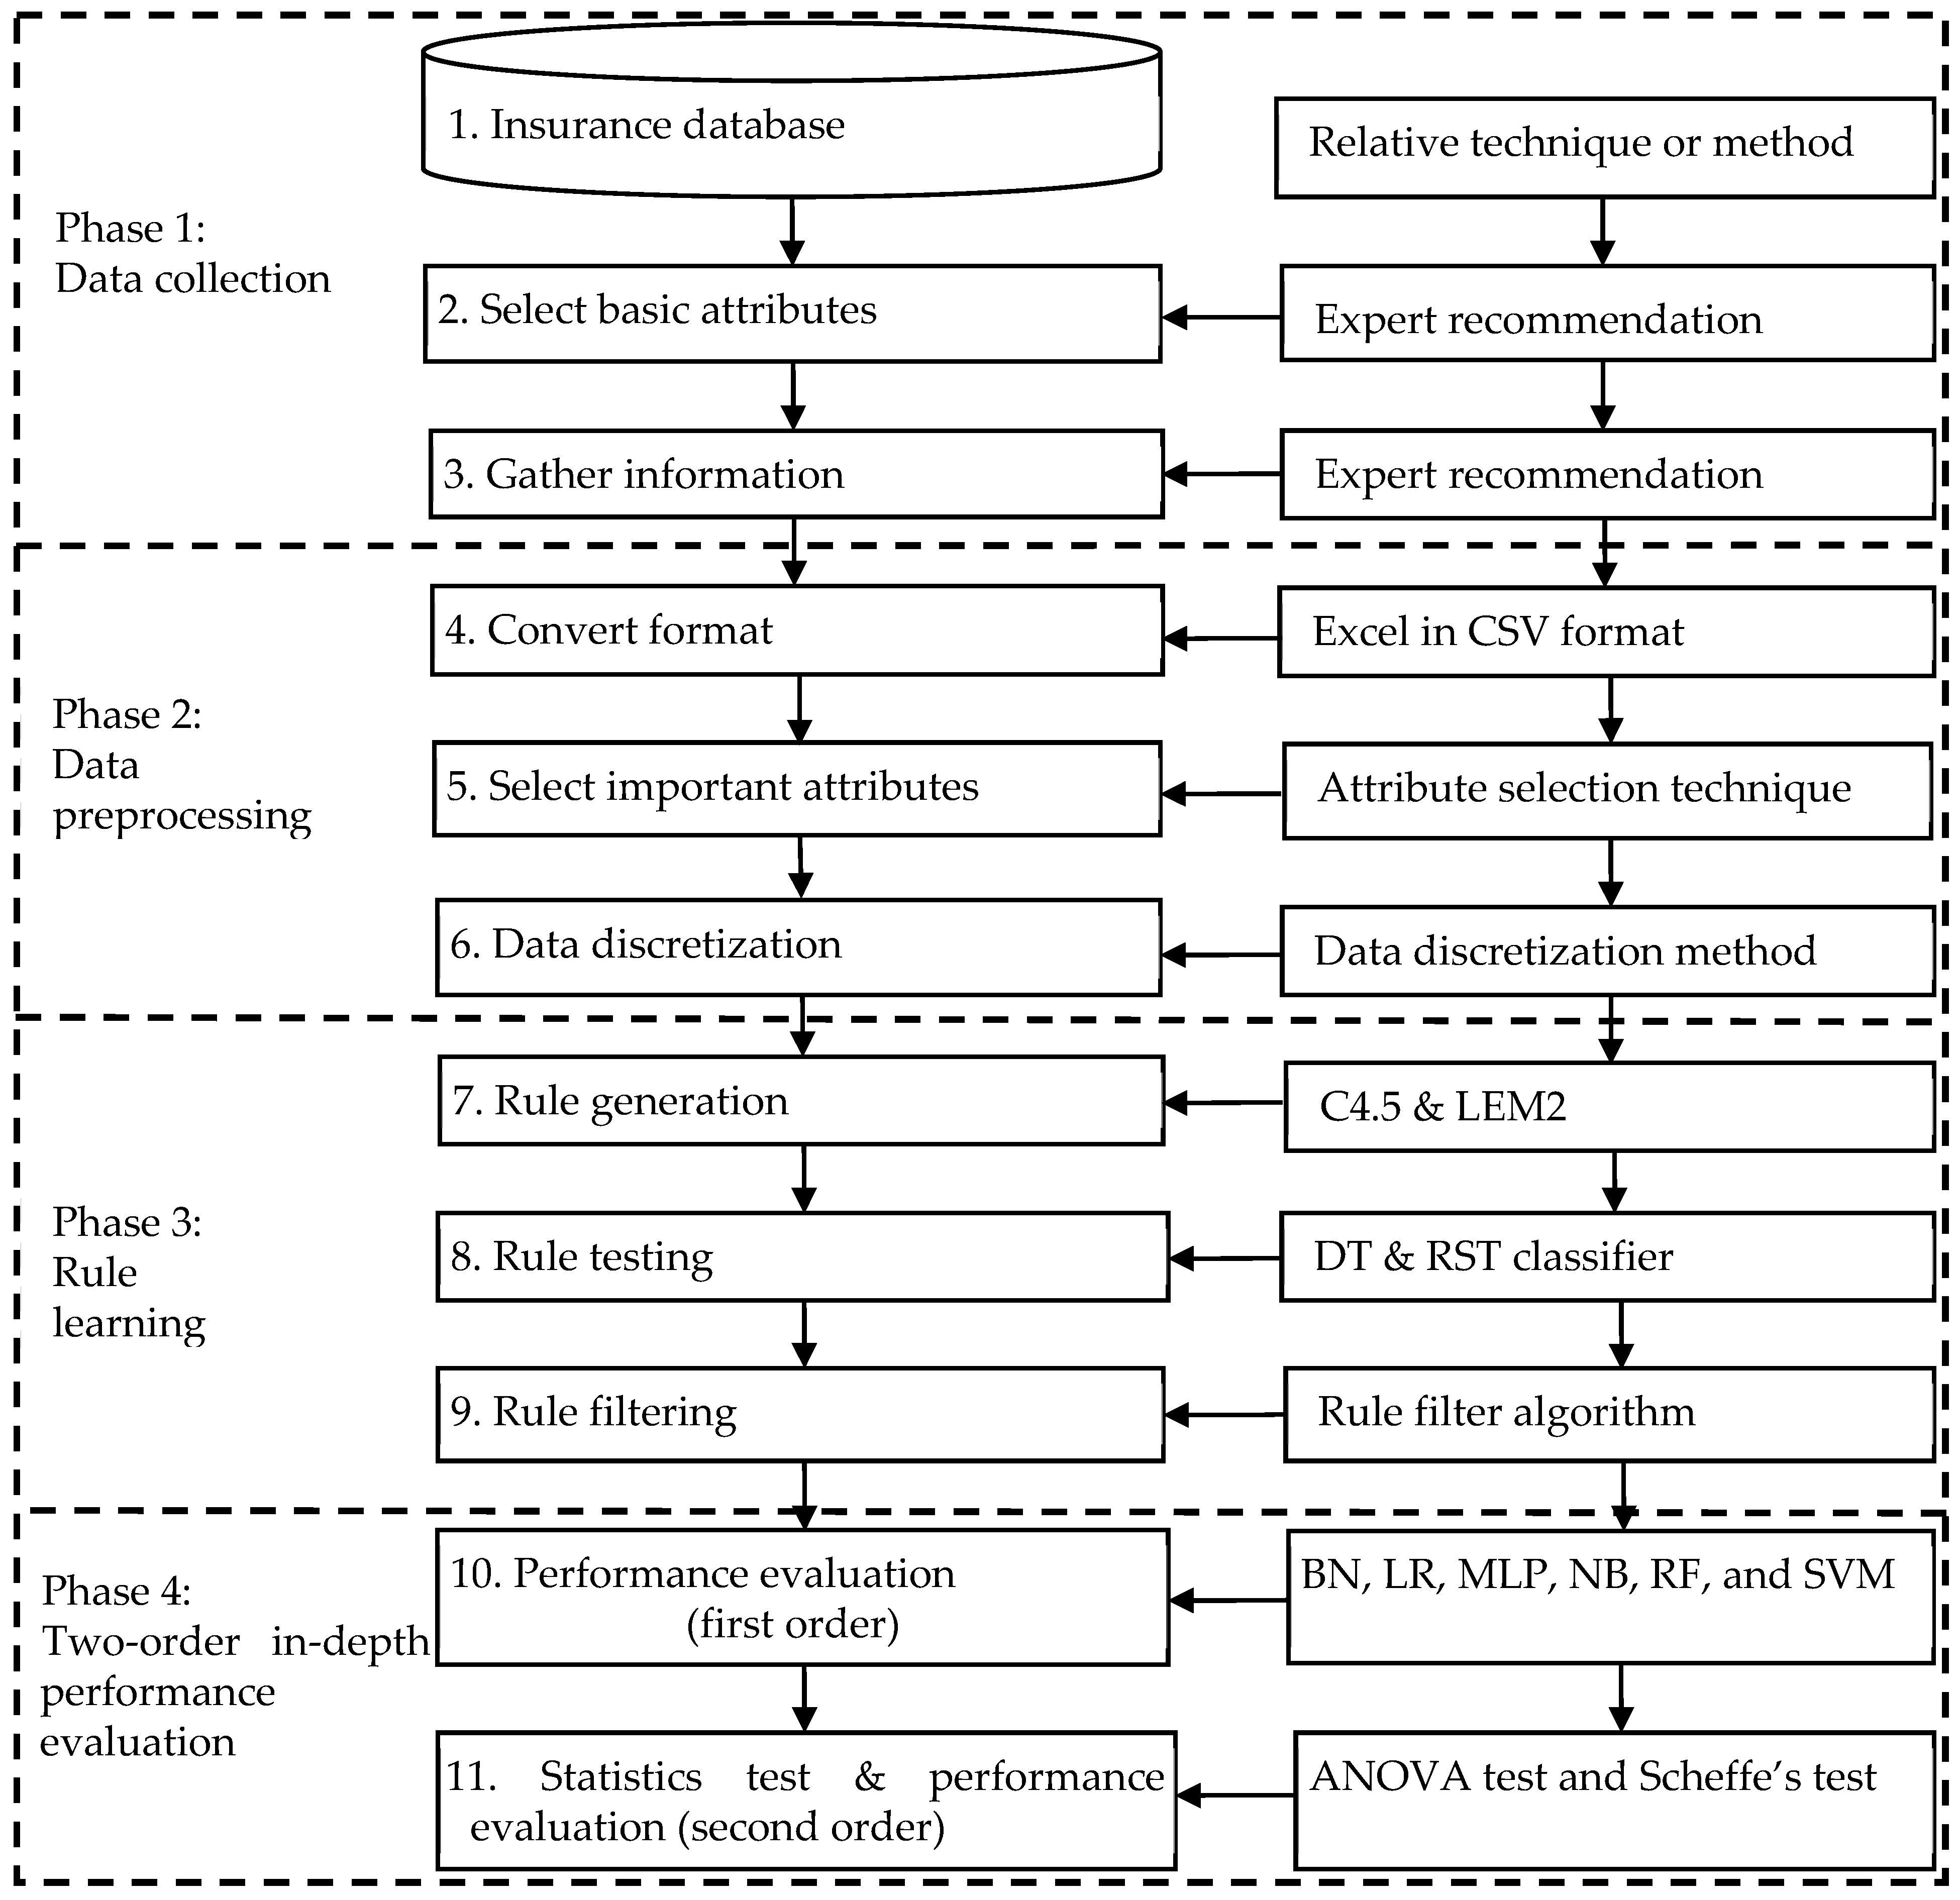
Figure 2.
Rule results for DT-C4.5 in 66%/34% after feature selection and data discretization techniques.
Figure 2.
Rule results for DT-C4.5 in 66%/34% after feature selection and data discretization techniques.
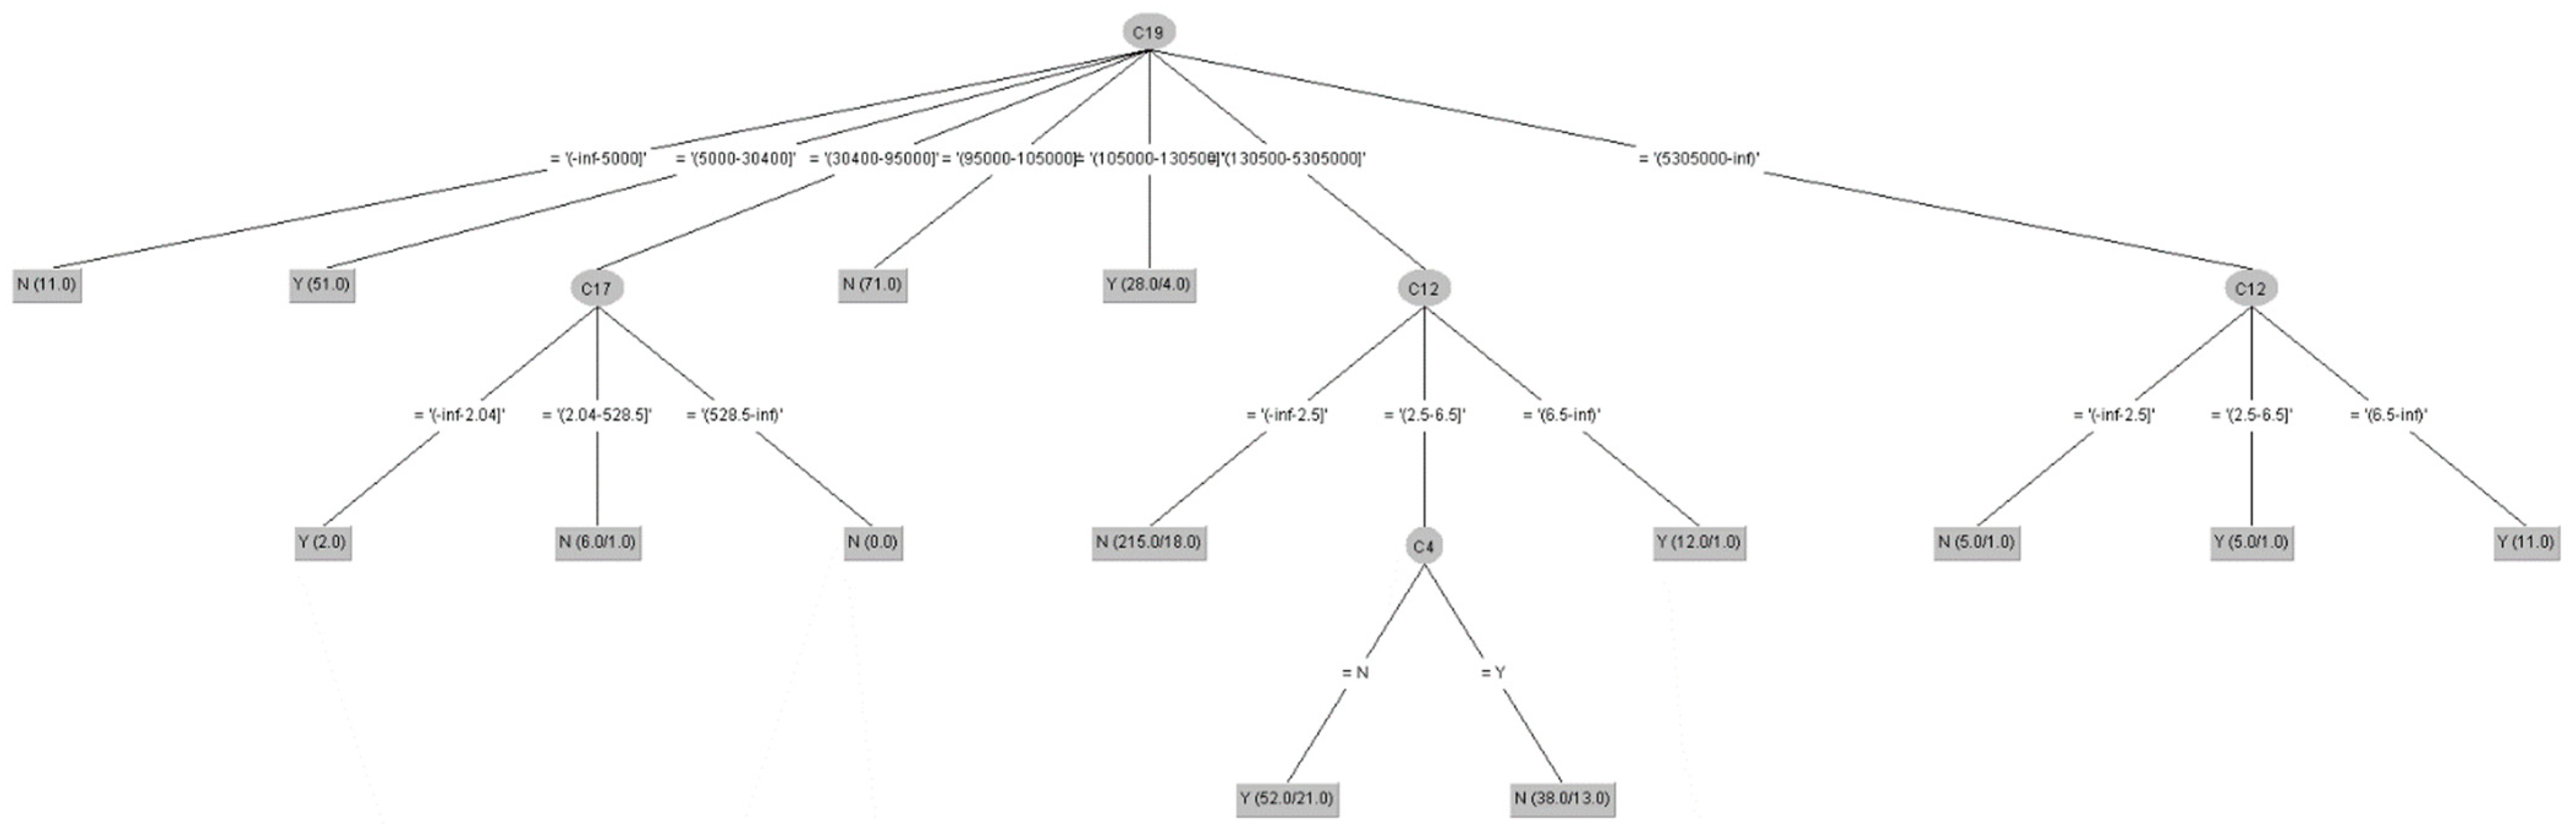
Figure 3.
Rule results for DT-C4.5 in 66%/34% without feature selection and data discretization techniques.
Figure 3.
Rule results for DT-C4.5 in 66%/34% without feature selection and data discretization techniques.
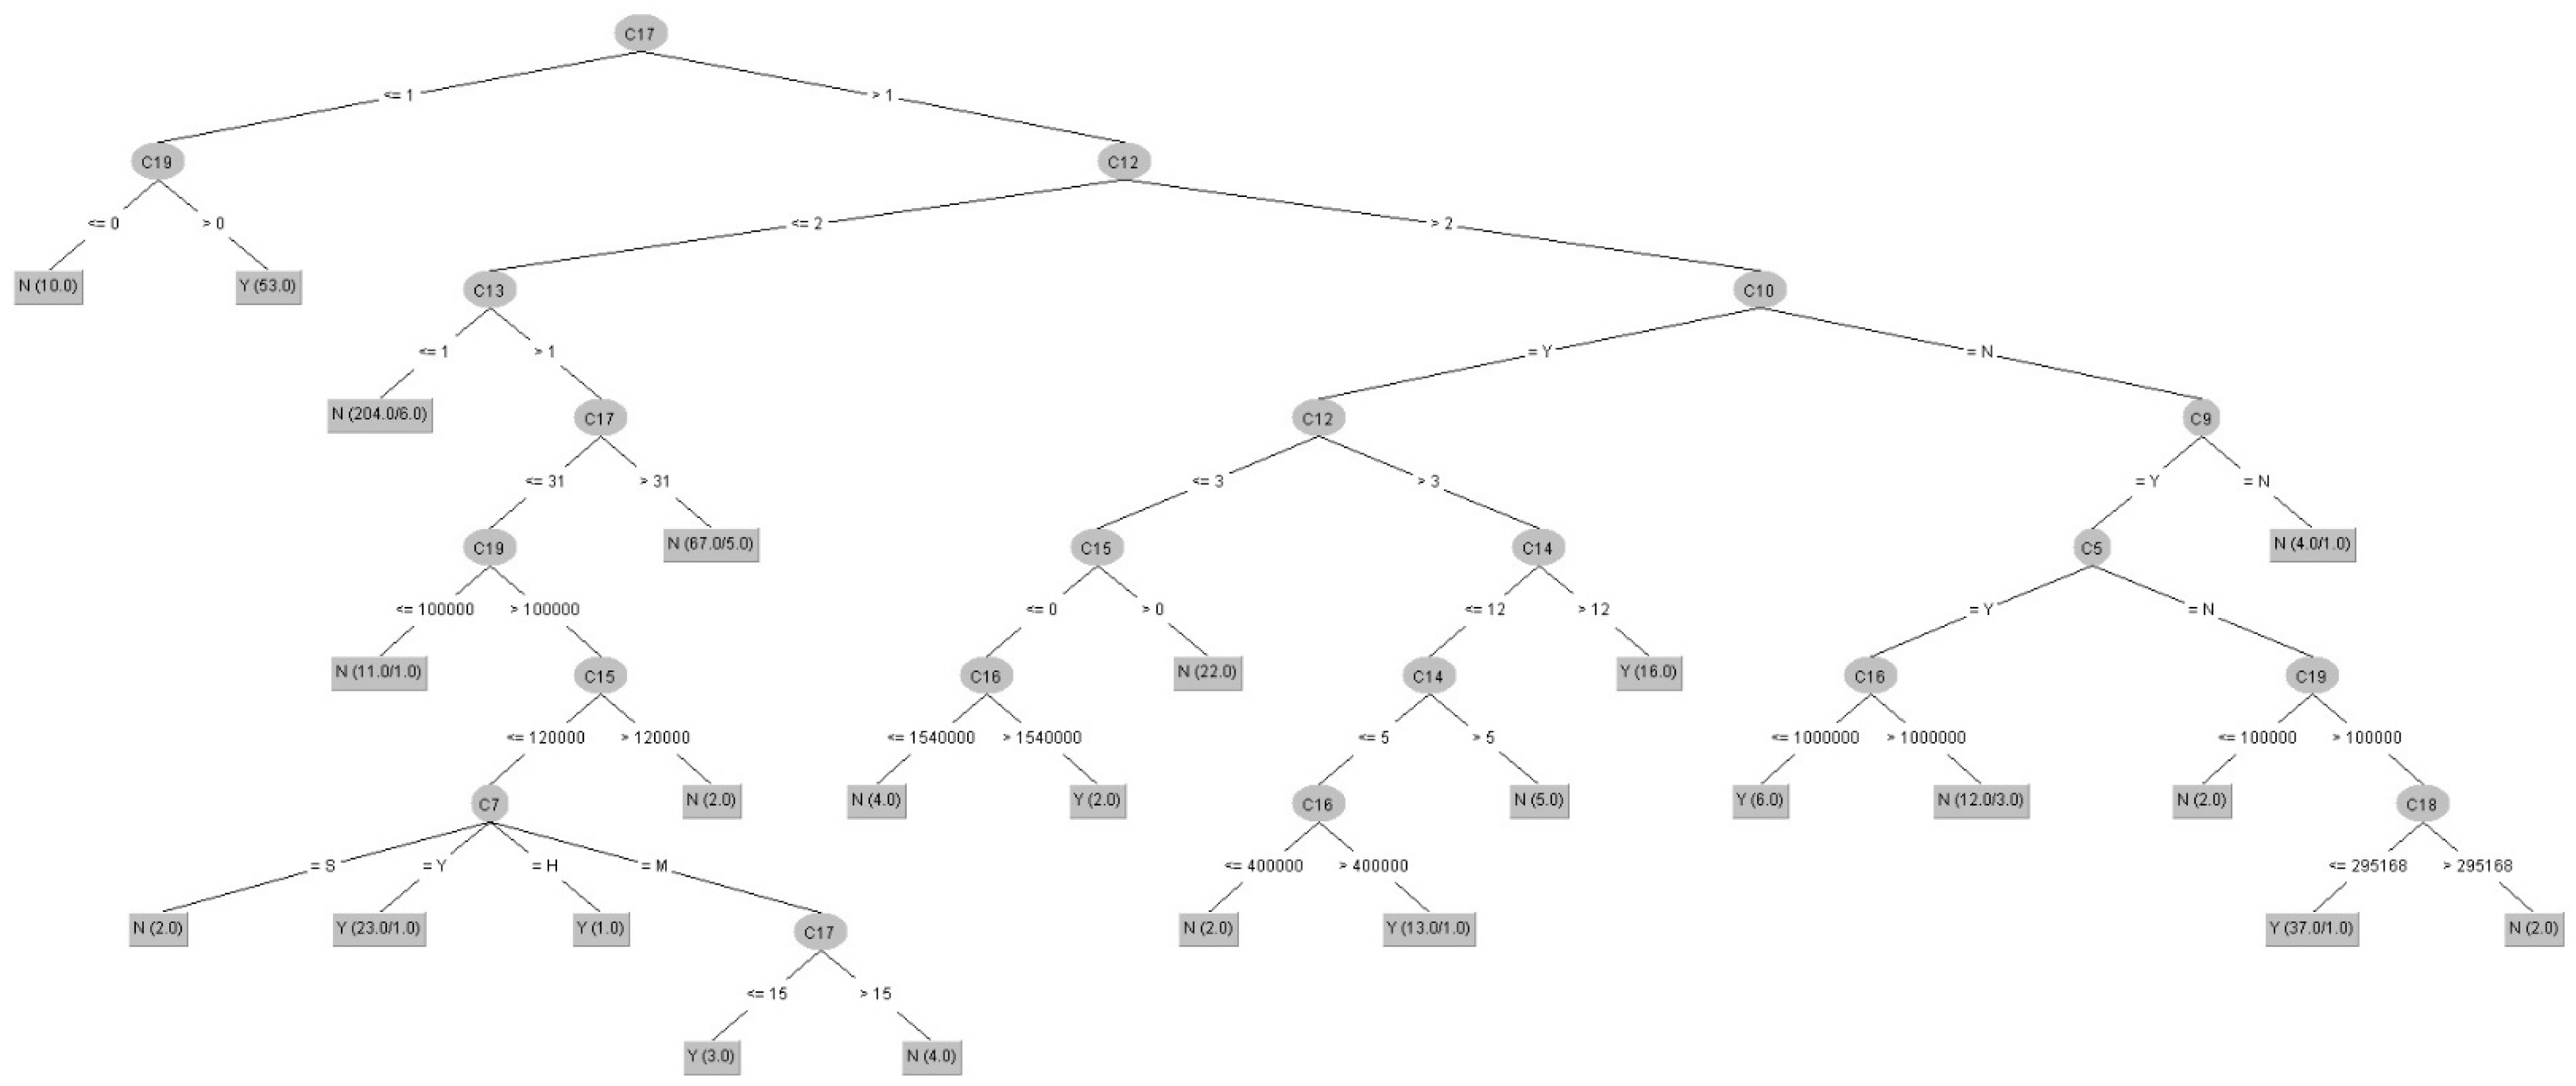
Figure 4.
Rule results of a set for RS-LEM2 for 66%/34% after feature selection and data discretization.
Figure 4.
Rule results of a set for RS-LEM2 for 66%/34% after feature selection and data discretization.
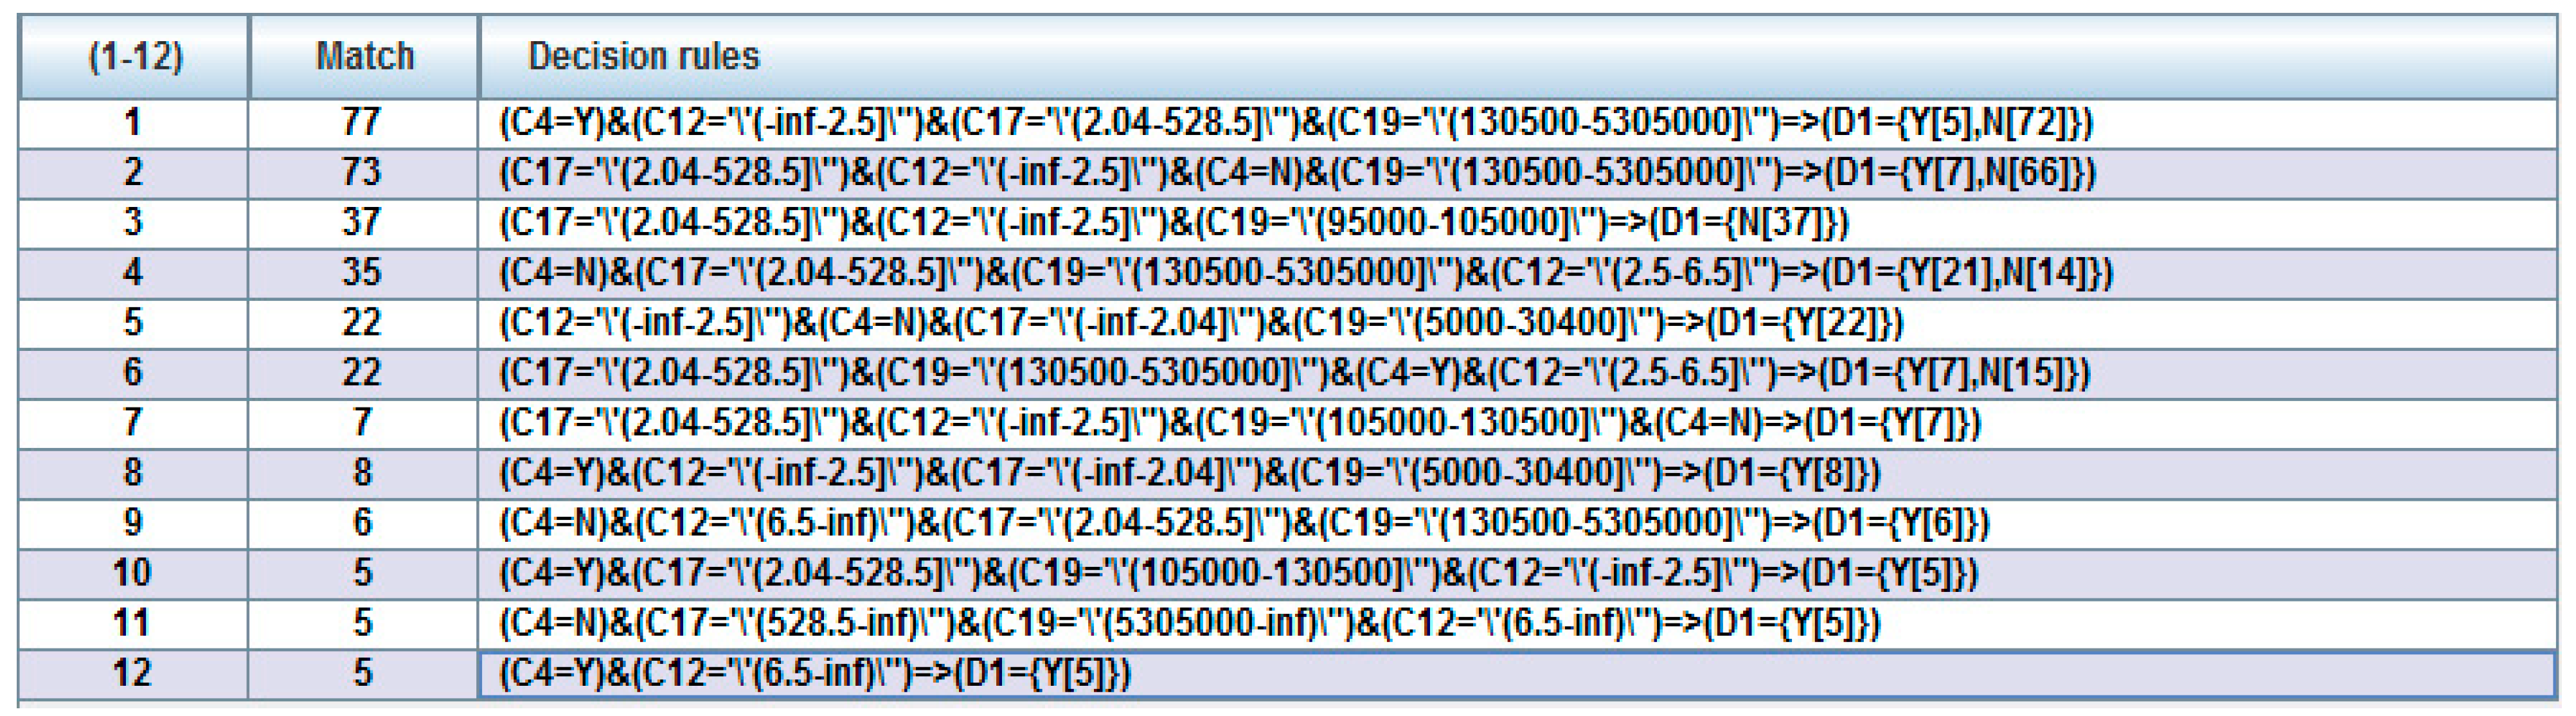

Table 1.
The detailed information of 16 advanced intelligent hybrid models.
| Model | A | B | C | D | E | F | G | H | I | J | K | L | M | N | O | P | |
|---|---|---|---|---|---|---|---|---|---|---|---|---|---|---|---|---|---|
| Element | |||||||||||||||||
| Feature selection method | √ | √ | √ | √ | √ | √ | √ | √ | |||||||||
| Data discretization technique | √ | √ | √ | √ | √ | √ | √ | √ | |||||||||
| Decision tree_DT-C4.5 | √ | √ | √ | √ | |||||||||||||
| Rough sets_RS-LEM2 | √ | √ | √ | √ | √ | √ | √ | √ | |||||||||
| Rule filter | √ | √ | √ | √ | |||||||||||||
| Comparative studies (BN, LR, MLP, NB, RF, and SVM) | √ | √ | √ | √ | |||||||||||||
| ANOVA test and Scheffe’s test | √ | √ | √ | √ | √ | √ | √ | √ | √ | √ | √ | √ | √ | √ | √ | √ | |
Table 2.
Important information of each attribute of the LTCI data set.
| Item | Attribute Encoding | Category | Attribute Length | Property Description |
|---|---|---|---|---|
| 1 | C1 | Symbolic | 1 | Gender (M: male, F: female, and T: third gender) |
| 2 | C2 | Symbolic | 1 | Educational background (G: below junior high school, H: high school, C: junior college, U: university, and M: master or above) |
| 3 | C3 | Symbolic | 1 | Nature of work (A: internal work, B: field work, C: mixed, O: other) |
| 4 | C4 | Symbolic | 1 | Marriage (Y: married and N: unmarried) |
| 5 | C5 | Symbolic | 1 | Whether the spouse is working (Y: yes and N: no) |
| 6 | C6 | Symbolic | 1 | Family salary structure (S: single salary, D: double salary or above, and O: other) |
| 7 | C7 | Symbolic | 1 | Payment method (Y: annual payment, H: semi-annual payment, S: quarterly payment, M: monthly payment, and O: other) |
| 8 | C8 | Symbolic | 1 | Payer (I: self, P: parents, S: spouse, C: children, and O: others) |
| 9 | C9 | Symbolic | 1 | Whether to pay the renewal premium (Y: yes and N: no) |
| 10 | C10 | Symbolic | 1 | Have you ever renewed an investment policy (Y: yes and N: no) |
| 11 | C11 | Symbolic | 1 | Whether to pay the insurance fee sustainably (Y: yes and N: no) |
| 12 | C12 | Numeric | 4 | Total number of policies purchased in the past |
| 13 | C13 | Numeric | 4 | Number of effective policies |
| 14 | C14 | Numeric | 4 | Time since first purchase in months |
| 15 | C15 | Numeric | 12 | Critical illness insurance |
| 16 | C16 | Numeric | 12 | Total life insurance amount |
| 17 | C17 | Numeric | 12 | Total sum insured of life insurance (including critical illness) |
| 18 | C18 | Numeric | 12 | Total premiums for policies in force for the current year |
| 19 | C19 | Numeric | 12 | Total sum of insured insurance |
| 20 | D1 (Class) | Symbolic | 1 | LTCI (decision attribute, Y: yes and N: no) |
Table 3.
Information of descriptive statistics for nominal attribute data.
| Data | Type | Missing | Distinct | Unique | Label | Count | |
|---|---|---|---|---|---|---|---|
| Feature | |||||||
| C1 | Nominal | 0 (0%) | 2 | 0 (0%) | F | 253 | |
| M | 254 | ||||||
| C2 | Nominal | 0 (0%) | 6 | 0 (0%) | C | 51 | |
| M | 35 | ||||||
| U | 150 | ||||||
| H | 165 | ||||||
| D | 4 | ||||||
| G | 102 | ||||||
| C3 | Nominal | 0 (0%) | 2 | 0 (0%) | Y | 427 | |
| N | 80 | ||||||
| C4 | Nominal | 0 (0%) | 2 | 0 (0%) | Y | 244 | |
| N | 263 | ||||||
| C5 | Nominal | 0 (0%) | 2 | 0 (0%) | Y | 218 | |
| N | 289 | ||||||
| C6 | Nominal | 0 (0%) | 2 | 0 (0%) | S | 239 | |
| D | 268 | ||||||
| C7 | Nominal | 0 (0%) | 4 | 0 (0%) | S | 43 | |
| Y | 331 | ||||||
| H | 18 | ||||||
| M | 115 | ||||||
| C8 | Nominal | 0 (0%) | 4 | 0 (0%) | I | 307 | |
| P | 180 | ||||||
| C | 5 | ||||||
| S | 15 | ||||||
| C9 | Nominal | 0 (0%) | 2 | 0 (0%) | Y | 305 | |
| N | 202 | ||||||
| C10 | Nominal | 0 (0%) | 2 | 0 (0%) | Y | 144 | |
| N | 363 | ||||||
| C11 | Nominal | 0 (0%) | 2 | 0 (0%) | Y | 459 | |
| N | 48 | ||||||
| D1 | Nominal | 0 (0%) | 2 | 0 (0%) | Y | 167 | |
| N | 340 | ||||||
Table 4.
Information of descriptive statistics for numerical attribute data.
| Data | Type | Missing | Distinct | Unique | Minimum | Maximum | Mean | Std. Deviation | |
|---|---|---|---|---|---|---|---|---|---|
| Feature | |||||||||
| C12 | Numeric | 0 (0%) | 17 | 3 (1%) | 0 | 20 | 2.400 | 2.542 | |
| C13 | Numeric | 0 (0%) | 13 | 2 (0%) | 0 | 15 | 2.014 | 1.852 | |
| C14 | Numeric | 1 (0%) | 30 | 5 (1%) | 0 | 33 | 4.280 | 6.736 | |
| C15 | Numeric | 0 (0%) | 33 | 14 (3%) | 0 | 6,500,000 | 248,165.680 | 563,763.809 | |
| C16 | Numeric | 0 (0%) | 129 | 85 (17%) | 0 | 77,700,000 | 1,625,192.787 | 6,422,077.476 | |
| C17 | Numeric | 0 (0%) | 150 | 107 (21%) | 0 | 7970 | 178.529 | 669.726 | |
| C18 | Numeric | 0 (0%) | 438 | 404 (80%) | 0 | 817,431 | 44,286.686 | 73,373.819 | |
| C19 | Numeric | 0 (0%) | 185 | 135 (27%) | 0 | 79,740,000 | 1,790,703.635 | 6,700,770.620 | |
Table 5.
Results of feature selection methods for implementing CFS and DT.
| Method | By CFS Subset Evaluator | By DT (Presentation Frequency) | |
|---|---|---|---|
| Result | |||
| Key attributes | C4, C12, C17, C19 vs. D1 | C16 (3), C17 (3), C19 (3), C12 (2), C14 (2), C15 (2), C5 (1), C7 (1), C13 (1), C9 (1), C10 (1), C18 (1) vs. D1 | |
Note: The red highlights the important factors.
Table 6.
Results of feature selection methods for implementing gain ratio, information gain, and OneR.
Table 6.
Results of feature selection methods for implementing gain ratio, information gain, and OneR.
| Method | Gain Ratio Feature Evaluator | Information Gain Ranking Filter | Oner Feature Evaluator | |
|---|---|---|---|---|
| Result | ||||
| Important attributes | C19➔C17➔C12➔C15➔C16➔C13➔C14➔C18➔C9➔C2➔C4➔C10➔C8➔C5➔C7➔C11➔C1➔C6➔C3 vs. D1 | C19➔C17➔C13➔C12➔C14➔C16➔C18➔C2➔C15➔C9➔C4➔C8➔C7➔C5➔C10➔C1➔C11➔C6➔C3 vs. D1 | C19➔C17➔C12➔C13➔C14➔C18➔C2➔C15➔C16➔C4➔C3➔C6➔C5➔C10➔C7➔C11➔C9➔C1➔C8 vs. D1 | |
Note: The red highlights the important factors.
Table 7.
Results of automatic data discretization.
| Feature | C12 | C13 | C14 | C15 | C16 | C17 | C18 | C19 |
|---|---|---|---|---|---|---|---|---|
| Value | (−inf~2.5] (2.5~6.5] (6.5~inf) | (−inf~2.5] (2.5~5.5] (5.5~inf) | (−inf~0.05] (0.05~inf) | (−inf~1,225,000] (1,225,000~inf) | (−inf~20,400] (20,400~5905,000] (5,905,000~inf) | (−inf~2.04] (2.04~528.5] (528.5~inf) | (−inf~36,517] (36,517~inf) | (−inf~5000] (5000~30,400] (30,400~95,000] (95,000~105,000] (105,000~130,500] (130,500~5305,000] (5,305,000~inf) |
Table 8.
Results of model comparison for all three different ratios of data partitioning in running one time in LTCI data.
Table 8.
Results of model comparison for all three different ratios of data partitioning in running one time in LTCI data.
| Model | A | B | C | D | E | F | G | H | I | J | K | L | M | N | O | P | |
|---|---|---|---|---|---|---|---|---|---|---|---|---|---|---|---|---|---|
| Ratio | |||||||||||||||||
| 66%/34% | 87.21 | 86.63 | 85.50 | 85.50 | 87.79 | 86.05 | 96.60 | 98.60 | 87.79 | 86.63 | 91.60 | 93.50 | 83.72 | 79.80 | 82.10 | 84.30 | |
| 75%/25% | 86.61 | 86.61 | 82.80 | 82.80 | 88.98 | 85.04 | 96.10 | 100.0 | 90.55 | 89.76 | 89.60 | 89.50 | 90.55 | 86.40 | 87.80 | 85.83 | |
| 80%/20% | 86.14 | 86.14 | 88.10 | 88.10 | 91.09 | 88.12 | 88.30 | 90.00 | 94.06 | 87.13 | 78.60 | 83.30 | 91.09 | 74.50 | 72.10 | 86.14 | |
| Average | 86.65 | 86.46 | 85.47 | 85.47 | 89.29 | 86.40 | 93.67 2 | 96.20 1 | 90.80 3 | 87.84 | 86.60 | 88.77 | 88.45 | 80.23 | 80.67 | 85.42 | |
Note: Unit is in % for accuracy; 1, 2, and 3 refer to the ranking of average accuracy; and the bold and black shadow refer to the importance.
Table 9.
Comparison results of eight pure classifiers for Models M, N, and P in one time.
| Model | BN | LR | MLP | NB | RF | SVM | DT | RST | The Best Classifier | |
|---|---|---|---|---|---|---|---|---|---|---|
| Ratio | ||||||||||
| 66%/34% | 83.14 | 75.58 | 76.16 | 70.93 | 84.30 | 71.51 | 83.72 | 82.10 | 84.30 for RF | |
| 75%/25% | 78.74 | 82.68 | 77.17 | 73.23 | 85.83 | 70.08 | 90.55 | 88.30 | 90.55 for DT | |
| 80%/20% | 84.16 | 85.15 | 70.30 | 71.29 | 86.14 | 69.31 | 91.09 | 86.30 | 91.09 for DT | |
| Average | 82.01 | 81.14 | 74.54 | 71.82 | 85.42 3 | 70.30 | 88.45 1 | 85.57 2 | 88.65 | |
Note: Unit is in % for accuracy; 1, 2, and 3 refer to the ranking of average accuracy; and the bold and black shadow refer to the importance.
Table 10.
Comparison results of eight classifiers with feature selection and data discretization in one time for Models A–C.
Table 10.
Comparison results of eight classifiers with feature selection and data discretization in one time for Models A–C.
| Model | BN | LR | MLP | NB | RF | SVM | DT | RST | The Best Classifier | |
|---|---|---|---|---|---|---|---|---|---|---|
| Ratio | ||||||||||
| 66%/34% | 86.05 | 81.98 | 87.21 | 86.05 | 87.21 | 81.98 | 86.63 | 85.50 | 87.21 for MLP and RF | |
| 75%/25% | 85.83 | 86.61 | 86.61 | 85.83 | 86.61 | 82.68 | 86.61 | 82.80 | 86.61 for LR, MLP, RF, and DT | |
| 80%/20% | 85.15 | 86.14 | 86.14 | 85.15 | 86.14 | 84.16 | 86.14 | 88.10 | 88.10 for RST | |
| Average | 85.68 | 84.91 | 86.65 1 | 85.68 | 86.65 1 | 82.94 | 86.46 3 | 85.47 | ||
Note: Unit is in % for accuracy; 1, and 3 refer to the ranking of average accuracy; and the bold and black shadow refer to the importance.
Table 11.
Comparison results of eight classifiers with feature selection in one time for Models E–H.
Table 11.
Comparison results of eight classifiers with feature selection in one time for Models E–H.
| Model | BN | LR | MLP | NB | RF | SVM | DT | RST | The Best Classifier | |
|---|---|---|---|---|---|---|---|---|---|---|
| Ratio | ||||||||||
| 66%/34% | 84.30 | 76.74 | 69.19 | 70.93 | 87.79 | 70.35 | 86.05 | 96.60 | 96.60 for RST | |
| 75%/25% | 78.74 | 81.10 | 70.08 | 71.65 | 88.98 | 70.08 | 85.04 | 96.10 | 96.10 for RST | |
| 80%/20% | 83.17 | 81.19 | 69.31 | 70.30 | 91.09 | 68.32 | 88.12 | 88.30 | 91.09 for RF | |
| Average | 82.07 | 79.68 | 69.53 | 70.96 | 89.29 2 | 69.58 | 86.40 3 | 93.67 1 | ||
Note: Unit is in % for accuracy; 1, 2, and 3 refer to the ranking of average accuracy; and the bold and black shadow refer to the importance.
Table 12.
Comparison results of eight classifiers with data discretization in one time for Models I–L.
Table 12.
Comparison results of eight classifiers with data discretization in one time for Models I–L.
| Model | BN | LR | MLP | NB | RF | SVM | DT | RST | The Best Classifier | |
|---|---|---|---|---|---|---|---|---|---|---|
| Ratio | ||||||||||
| 66%/34% | 83.14 | 87.21 | 84.30 | 83.14 | 87.21 | 87.79 | 86.63 | 91.60 | 91.60 for RST | |
| 75%/25% | 85.83 | 90.55 | 88.19 | 85.04 | 88.19 | 88.19 | 89.76 | 89.60 | 90.55 for LR | |
| 80%/20% | 84.16 | 92.08 | 89.11 | 84.16 | 94.06 | 89.11 | 87.13 | 78.60 | 94.06 for RF | |
| Average | 84.38 | 89.95 1 | 87.20 | 84.11 | 89.82 2 | 88.36 3 | 87.84 | 86.60 | ||
Note: Unit is in % for accuracy, 1, 2, and 3 refer to the ranking of average accuracy, and the bold and black shadow refer to the importance.
Table 13.
Comparison results of eight pure classifiers for Models M, N, and P in 10 times on 66%/34%.
Table 13.
Comparison results of eight pure classifiers for Models M, N, and P in 10 times on 66%/34%.
| Model | BN | LR | MLP | NB | RF | SVM | DT | RST | The Best Classifier | |
|---|---|---|---|---|---|---|---|---|---|---|
| Run | ||||||||||
| 1 | 83.14 | 75.58 | 76.16 | 70.93 | 84.30 | 71.51 | 83.72 | 82.40 | 84.30 for RF | |
| 2 | 84.88 | 77.33 | 73.26 | 73.26 | 87.21 | 75.00 | 82.56 | 72.60 | 87.21 for RF | |
| 3 | 84.88 | 78.49 | 73.84 | 73.84 | 86.63 | 75.58 | 87.21 | 79.70 | 86.63 for RF | |
| 4 | 82.56 | 98.26 | 76.74 | 72.09 | 88.95 | 76.74 | 87.79 | 90.80 | 98.26 for LR | |
| 5 | 87.79 | 73.84 | 73.84 | 72.09 | 90.70 | 73.84 | 91.28 | 76.30 | 91.28 for DT | |
| 6 | 80.81 | 73.84 | 70.93 | 72.09 | 84.88 | 71.51 | 87.21 | 75.00 | 87.21 for DT | |
| 7 | 80.23 | 77.33 | 72.67 | 70.35 | 81.98 | 70.35 | 84.88 | 79.80 | 84.88 for DT | |
| 8 | 84.30 | 79.07 | 66.86 | 72.09 | 90.12 | 75.00 | 88.37 | 77.60 | 90.12 for RF | |
| 9 | 83.72 | 98.84 | 70.93 | 72.67 | 86.05 | 80.23 | 89.53 | 72.10 | 98.84 for LR | |
| 10 | 77.33 | 79.07 | 72.67 | 72.09 | 83.72 | 76.74 | 83.14 | 68.30 | 83.72 for RF | |
| Average | 81.78 | 85.66 3 | 70.15 | 72.28 | 86.63 2 | 77.32 | 87.01 1 | 72.67 | 87.01 for DT | |
| Std. Dev. | 2.9257 | 9.3601 | 2.8186 2 | 1.0058 1 | 2.8494 3 | 2.9786 | 2.8928 | 6.2939 | ||
Note: Unit is in % for accuracy; 1, 2, and 3 refer to the ranking of average accuracy; and the bold and black shadow refer to the importance.
Table 14.
Comparison results of pure RST classifiers for Models N vs. O in 10 times on 66%/34%.
| Model | RST (No Filter) | Total Coverage | Rule Number | RST (With Filter) | Total Coverage | Rule Number | |
|---|---|---|---|---|---|---|---|
| Run | |||||||
| 1 | 82.40 | 0.491 | 131 | 83.10 | 0.445 | 90 | |
| 2 | 72.60 | 0.486 | 128 | 71.40 | 0.445 | 87 | |
| 3 | 79.70 | 0.399 | 130 | 82.00 | 0.353 | 90 | |
| 4 | 90.80 | 0.439 | 130 | 90.10 | 0.410 | 89 | |
| 5 | 76.30 | 0.538 | 113 | 74.70 | 0.503 | 83 | |
| 6 | 75.00 | 0.509 | 125 | 76.50 | 0.491 | 84 | |
| 7 | 79.80 | 0.543 | 113 | 78.40 | 0.509 | 88 | |
| 8 | 77.60 | 0.387 | 128 | 78.30 | 0.347 | 83 | |
| 9 | 72.10 | 0.497 | 119 | 73.80 | 0.462 | 84 | |
| 10 | 68.30 | 0.416 | 68 | 69.50 | 0.383 | 47 | |
| Average | 72.67 | 0.43 | 105.0 | 73.87 | 0.40 | 71.3 | |
| Std. Dev. | 6.29 | 0.06 | 19.02 | 6.10 | 0.06 | 12.78 | |
Table 15.
Results of automatic data discretization.
| RST Model | Accuracy | Coverage 0.9 | Number of Rules | Accuracy | Coverage 0.8 | Number of Rules | |
|---|---|---|---|---|---|---|---|
| Ratio | |||||||
| 66%/34% | 82.10 | 0.486 | 137 | 76.60 | 0.445 | 110 | |
| 75%/25% | 88.30 | 0.472 | 162 | 85.50 | 0.433 | 132 | |
| 80%/20% | 86.30 | 0.500 | 165 | 82.10 | 0.382 | 142 | |
| Average | 85.57 | 0.486 | 154.7 | 81.40 | 0.420 | 128.0 | |
Disclaimer/Publisher’s Note: The statements, opinions and data contained in all publications are solely those of the individual author(s) and contributor(s) and not of MDPI and/or the editor(s). MDPI and/or the editor(s) disclaim responsibility for any injury to people or property resulting from any ideas, methods, instructions or products referred to in the content. |
© 2023 by the authors. Licensee MDPI, Basel, Switzerland. This article is an open access article distributed under the terms and conditions of the Creative Commons Attribution (CC BY) license (https://creativecommons.org/licenses/by/4.0/).
Share and Cite
MDPI and ACS Style
Chen, Y.-S.; Hung, Y.-H.; Lin, Y.-S. A Study to Identify Long-Term Care Insurance Using Advanced Intelligent RST Hybrid Models with Two-Stage Performance Evaluation. Mathematics 2023, 11, 3010. https://doi.org/10.3390/math11133010
AMA Style
Chen Y-S, Hung Y-H, Lin Y-S. A Study to Identify Long-Term Care Insurance Using Advanced Intelligent RST Hybrid Models with Two-Stage Performance Evaluation. Mathematics. 2023; 11(13):3010. https://doi.org/10.3390/math11133010
Chicago/Turabian StyleChen, You-Shyang, Ying-Hsun Hung, and Yu-Sheng Lin. 2023. "A Study to Identify Long-Term Care Insurance Using Advanced Intelligent RST Hybrid Models with Two-Stage Performance Evaluation" Mathematics 11, no. 13: 3010. https://doi.org/10.3390/math11133010
Note that from the first issue of 2016, this journal uses article numbers instead of page numbers. See further details here.