
Phenotype Analysis of Arabidopsis thaliana Based on Optimized Multi-Task Learning

College of Artificial Intelligence, Nanjing Agricultural University, Nanjing 210095, China
*
Authors to whom correspondence should be addressed.
Mathematics 2023, 11(18), 3821; https://doi.org/10.3390/math11183821
Submission received: 5 June 2023
/
Revised: 19 August 2023
/
Accepted: 25 August 2023
/
Published: 6 September 2023
(This article belongs to the Special Issue Evolutionary Computation for Deep Learning and Machine Learning)
Abstract
:Deep learning techniques play an important role in plant phenotype research, due to their powerful data processing and modeling capabilities. Multi-task learning has been researched for plant phenotype analysis, which can combine different plant traits and allow for a consideration of correlations between multiple phenotypic features for more comprehensive analysis. In this paper, an intelligent and optimized multi-task learning method for the phenotypic analysis of Arabidopsis thaliana is proposed and studied. Based on the VGG16 network, hard parameter sharing and task-dependent uncertainty are used to weight the loss function of each task, allowing parameters associated with genotype classification, leaf number counting, and leaf area prediction tasks to be learned jointly. The experiments were conducted on the Arabidopsis thaliana dataset, and the proposed model achieved weighted classification accuracy, precision, and scores of , , and , respectively. Furthermore, the coefficient of determination values in the leaf number and leaf area regression tasks reached 0.7944 and 0.9787, respectively.
MSC:
68T01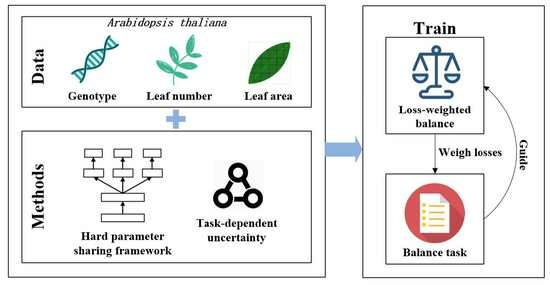
1. Introduction
Plant phenotypes are the physical, physiological, and biochemical characteristics of plants that reflect their structure and composition. Traditional phenotype analysis is performed manually, which introduces problems such as high labor and material costs, and low efficiency [1,2]. Therefore, traditional methods are unable to meet the demands of high-throughput plant phenotype research. Establishing a high-throughput phenotype analysis platform could allow plant phenotype data to be objectively, accurately, and quickly obtained, as well as facilitating the analysis of the associations between phenotypic traits, which could provide data-driven decision support for breeding, cultivation, and agricultural practices [3].
Deep learning techniques have became an important tool in plant phenotype research due to their powerful data processing and modeling capabilities [4,5]. Deep learning approaches have became the main technical tools in plant phenotype research and are effective in plant classification, identification, and feature extraction [6,7,8].
Convolutional neural network (CNN) is a widely acknowledged representative deep learning approach, that has achieved great success in many computer vision tasks. In recent years, researchers have proposed a large number of CNN-based models, such as AlexNet [9], VGG [10], GoogLeNet [11], and ResNet [12]. Additionally, these architectures have inspired subsequent contributions, such as Res2Net [13], Condensenet v2 [14], EdgeNeXt [15], and GhostNetV2 [16]. The above-mentioned CNNs have been widely used for plant phenotype data analysis [17,18].
There are many research works focused on single-task learning, for plant classification, leaf number prediction, and pest and disease detection. For example, Lee et al. [19] trained a fine-tuned AlexNet model to automatically extract leaf features. Dyrmann et al. [20] constructed a convolutional neural network to classify seedlings of plants or families. Barre et al. [21] proposed a method for the quantification of plant phenotypes associated with the growth of Arabidopsis thaliana in a controlled environment and conducted categorization by using a convolutional neural network structure for identification. Namin et al. [22] used a CNN for automatic joint feature and classifier learning, and applied a long short-term memory (LSTM) model to study the growth of plants and their dynamic behavior. Roitsch et al. [23] first provided a detailed description of genomics-based methods for plant phenotype feature extraction, followed by the idea of applying plant phenotype studies in conjunction with methods related to deep learning. Kong et al. [24] employed the Mask R-CNN algorithm to effectively identify and count full and wilted grains in rice spikes.
Single-task learning methods mainly focus on a specific phenotypic feature and characteristic of a plant, without considering the diversity and correlations between phenotypic features. On the other hand, multi-task learning mechanisms can bring related tasks together to learn the mutual generalization bias, allowing the use of priori knowledge [25,26,27] to improve the learning ability. For instance, Pound et al. [28] used multi-task learning for wheat spike phenotyping analysis. Wen et al. [29] proposed a multi-task learning network based on Mask R-CNN, which could achieve the multi-task detection of citrus in complex environments. La et al. [30] used a fully convolutional regression network-based multi-task learning architecture to detect individual full-grown tree, tree seedlings, and tree gaps in citrus orchards. Khaki et al. [31] utilized MobileNetV2 as a lightweight backbone feature extractor with two parallel sub-networks to perform density-based counting and localization tasks simultaneously, with a lower number of parameters, superior performance, and higher effectiveness when compared to other methods. Chaudhury et al. [32] proposed a multi-task deep learning framework to segment leaves and count the number of leaves in digital plant images, which showed an improved segmentation mean intersection over union score and difference. Keceli et al. [33] combined CNN features and transferred features to construct a multi-input multi-task learning model to predict the disease in plants. Wang et al. [34] proposed a dual-stream hierarchical bilinear pooling model and optimized the weights of two tasks using homoscedastic uncertainty, which improved the independent identification accuracy of plants and diseases.
In this paper, we propose an optimized multi-task learning model for phenotypic analysis of Arabidopsis thaliana with a hard parameter sharing approach and uncertainty weighting strategy. Based on the hard parameter sharing framework, the loss function of each task is weighed according to the uncertainty of task dependence. We tested three tasks related to Arabidopsis thaliana plant phenotypic analysis: (1) classifying the genotype, (2) counting the total number of leaves, and (3) estimating the leaf area. Different multi-task learning models are constructed and compared for the above three tasks.
2. Multi-Task Learning Architecture for Arabidopsis thaliana Phenotypic Analysis
The architecture of the multi-task model used for Arabidopsis thaliana phenotype analysis in this paper is shown in Figure 1. The hard parameter sharing framework was used as the underlying network, and each task had its own task-specific layer in order to extract different features related to the task. During the joint training of the multiple tasks, task-dependent uncertainty was used to weigh the loss function for each task layer, thus balancing the impact of regression and classification tasks. For this paper, we adopted the hard parameter sharing framework of [27], which describes a multi-task learning model with a sharing network based on ResNet for Arabidopsis thaliana phenotyping. The symbols appearing in the paper and their details are summarized in Table 1.
2.1. Modified Hard Parameter Sharing in VGG16 Network
VGG16 [10] is a CNN model, which uses stacked small convolutional kernels with a low number of parameters and more non-linear variations, making the extracted features more adaptable to complex patterns. Thus, VGG16 can be easily modified to achieve better classification performance [10]. For the above reasons, the VGG16 was chosen as the backbone network for the multi-task learning model proposed in this paper.
We added a specific task layer to the VGG16 network. The modified model structure is shown in Figure 2, where the dashed box indicates the specific task layer added to complete the genotype classification, leaf number counting, and leaf area estimation tasks.
As shown in Figure 2, the last maximum pooling layer of VGG16 was removed and replaced with fully connected layers. Then, fully connected layers were also applied to each of the three task-specific layers. The fully connected layers were used for extracting features associated with each of the tasks.
The three tasks were designed as follows: (1) the genotype classification task passes through fully connected layers, and the classification results are finally output through a softmax layer; (2) the leaf number counting task passes through fully connected layers, then outputs the regression prediction results; (3) and the construction of the leaf area estimation-specific task layer is the same as the leaf number counting task. The details of the model parameters for each task with the original VGG16 network are detailed in Table 2.
After the plant phenotype images are input to the network model, the corresponding feature vectors are extracted through the underlying shared network (i.e., VGG16) and the respective task-specific fully connected layers for each task. The genotype classification task involves multiple classifications of the feature vectors through the softmax layer to obtain the probabilities for each category.
The softmax layer applies the activation function, which transforms the inputs of multiple neurons into a value between 0 and 1, where the sum of the mapped elements in the vector is equal to 1. The softmax value is calculated using Equation (1):
where i and j are category labels in the multi-categorization problem, denotes the value for the input category i and maps the value to an exponential function, and denotes the exponential sum of all category values.
The leaf number regression task and the leaf area regression task apply the activation function in the task-specific fully connected layer to obtain the final prediction results. The function can overcome the problem of gradient disappearance, and is calculated using Equation (2).
where is the input value.
2.2. Loss Functions for Different Tasks
The loss functions used in this paper include the mean absolute error, mean square error, and cross-entropy loss function. The mean absolute error (MAE) loss function is applied to solve the problem of prediction of specific values. Its formula is shown in Equation (3):
The MAE measures the average of the sum of the absolute differences between the actual values and the predicted values , where n is the total number of actual values.
The mean squared error (MSE) loss function is applied to regression problems, and is shown in Equation (4). The MSE measures the mean value of the square of the difference between the predicted values and the actual observed values .
The cross-entropy measures the distance between the actual output probability and the expected output probability.The smaller the cross-entropy value, the closer the two probability distributions will be. The cross-entropy loss function is often used in solving the classification problems, and is calculated using Equation (5):
where M is the number of categories, is a symbolic function that takes 1 if the true category of sample i is equal to c and 0 otherwise, and is the predicted probability that observation sample i belongs to category c.
2.3. Loss Balance for Each Task
In this paper, each task-specific layer loss function is weighted training to balance the task-dependent uncertainty [35]. Thus, a joint loss is used during model training, which balances the impact of each task and can mitigate the impact of negative migration on weakly correlated tasks. In Figure 2, the circles represent the joint loss values. In the last task-specific layers for the three tasks, the task-dependent uncertainty is used to balance the loss function for each task, and the joint loss values are used to guide the next training round of the model. Finally, the final joint multi-task loss is evaluated by maximizing the maximum Gaussian likelihood.
2.3.1. Likelihood Function for the Regression Task
2.3.2. Likelihood Function for Classification Task
2.3.3. Multi-Task Joint Loss
The multi-task model in this paper consists of a classification task and two regression tasks. The joint loss was constructed, referring to the literature [35], to maximize the log-likelihood (i.e., minimize the negative log-likelihood) as shown in Equation (10):
where is the true label of the leaf area regression task, is the noise parameter of the leaf area regression task, is the true label of the leaf number regression task, is the noise parameter of the leaf number regression task, is the true label of the genotype classification task, and is the noise parameter of the classification task. Furthermore, , , and are equivalent to data-based adaptive weights, which are used for weighting the loss function of each task factor.
The term denotes the Euclidean distance between the output of the leaf area regression task and the true label , denotes the Euclidean distance between the output of the leaf number regression task and the true label , and is the cross-entropy loss for the classification task. Overall, the process of model training is the process of learning the weight relationship factor for each task.
2.3.4. Multi-Tasking Learning Processing
During training, the weight-related parameters are combined together, according to Equation (10), as a joint loss. Then, each weight-related parameter is updated gradually. Finally, a combination of a weight parameter matrix and multiple task weight relationship factors are learned, such that the multi-loss function for the multiple tasks reaches a minimum value and the influence of each task will be well-balanced.
During the model training process, the model optimizer automatically updates the parameters of the network, including the weight value for each task, according to the gradient information in order to reduce the value of the loss function. The update process for the weight-related parameters is shown in Figure 3.
In Figure 3, if the joint loss value of the model is calculated after the previous iteration and the proportion of the leaf area loss in the total loss is larger (i.e., the value of in Equation (10) is larger), then the optimizer will train the model in favor of the leaf area regression task in the next iteration, then increase the weight correlation factor of the leaf area regression task defined in Equation (10) for , in order to reduce the weight of this task. The adjustment procedure for and weighting each task’s loss in the total joint loss is calculated in a similar way.
3. Experimental Results
3.1. Experimental Environment
The experiment was conducted on a Windows 11 computer with an Intel i9-12900K CPU, 48 GB RAM, and a GeForce RTX 3060 Ti GPU with 8 GB RAM. The algorithms were implemented using Tensorflow 2.4.0, Python 3.7, Pytorch 1.3.1, and CUDA 10.0.
3.2. Dataset
The experiments were carried out on the Arabidopsis thaliana dataset from Ara2013-Canon [36]. The dataset contains 5 genotypes of Arabidopsis thaliana (col-0, ein2, ctr, adh1, and pgm) and has 165 images in total. Each image has been labeled with information regarding genotype, leaf number, and corresponding annotated color leaf segmentation images, as shown in Table 3.
3.3. Evaluation Metrics
3.3.1. Classification Metrics
For classification tasks, the accuracy, weighted precision, weighted recall, and weighted values are typically used for evaluation of the results.
The accuracy is the ratio of the number of correct samples predicted to the total number of samples, as defined in Equation (11):
The weighted precision is the ratio of the total number of truly positive cases to the total number of all samples predicted to be positive, as defined in Equation (12):
The weighted recall is the ratio of the number of correctly predicted positive samples to the actual number of positive samples, as defined in Equation (13):
The value is a comprehensive performance index based on precision and recall, as defined in Equation (14):
The concepts of , , , and used in the above equations are summarized in Table 4.
3.3.2. Regression Metrics
For regression tasks, the coefficient of determination (), mean absolute percentage error (MAPE), mean absolute error (MAE), and mean square error (MSE) are commonly used as evaluation metrics. The , MAPE, MAE, and MSE are defined in Equations (15)–(18), respectively.
is a numerical characteristic used to represent the relationship between a random variable and multiple random variables, as defined in Equation (15). The larger the value, the closer the regression value to the true value.
In the above equations, n denotes the number of samples, denotes the true value of the sample, denotes the predicted value of the sample, and denotes the average of the true values of all samples.
3.4. Experimental Results
3.4.1. Learning Rate Test
The learning rate is used to control the learning progress of a model by determining how fast it converges to a local minimum. Equation (19) shows the relationship between the current and previous model weight values for controlling the learning rate .
where denotes the network weights before the update, denotes the updated network weights, is the learning rate. The smaller the value of , the slower the loss gradient decreases and the slower the network convergence process.
In this paper, the epochs was set to 300 and the batch size was 1. The weighted balance was applied to the three loss functions to learn the multiple tasks model. The was set to the range of to to obtain the best learning rate for the optimal results. The results with different learning rate are shown in Figure 4.
Figure 4 showed that the weighted classification accuracy, precision, and value were similar under different values, and the best classification results were obtained when = . The results are detailed in Table 5.
From Figure 4, we can see the best value of was 0.8320 when = in the leaf number regression task, under which the value of was 0.9241 for the leaf area regression task. The best value of was 0.9787 when = in the leaf area regression task, while the value was 0.7944 for the leaf number regression task.
The value for the leaf number regression task decreased when increased from to , while the of the leaf area regression task increased. Thus, the hard parameter sharing model with VGG16 was used as the base network and was set to . Results of each regression task are shown in Table 6.
Based on the above parameter settings, the confusion matrix for the genotype classification task is shown in Figure 5.
3.4.2. Comparison with Different Networks
We adopted three different basic networks, i.e, VGG16, ResNet50 [12], and Xception [37] for comparison with the proposed hard parameter sharing model. The number of epochs, the batch size, and were set to 300, 1, and , respectively.
- (1)
- Classification task
A comparison of the best classification metrics in the training process for the different basic network models is shown in Figure 6. From Figure 6, it can be seen that our method outperformed the other two basic network models, in terms of the achieved classification evaluation metrics. The classification accuracy and recall of our method were 78.13% and 56.25% higher than those based on ResNet and Xception, respectively. For precision of classification, our method achieved 45.71% and 31.15% higher values than the other two models, respectively. The classification value obtained by the VGG16-based network model was 79.64% and 56.75% higher than those of ResNet and Xception, respectively.
- (2)
- Regression tasks
Figure 7 shows a comparison of the values obtained using the different basic networks in regression tasks. It can be seen that the model using VGG16 as the basic network performed better in both regression tasks, compared to the other two models. In the leaf number regression task, the of our method was 33.92% and 28.32% higher than those of the models based on ResNet50 and Xception, respectively; and the value of our method in the leaf area regression task was 61.46% and 22.43% higher than those of the other two models, respectively.
3.4.3. Weighted Loss Function Results
Based on the above parameter settings, the values of associated to the loss functions were continuously updated to balance the relationships between the tasks. The logarithmic values of () for each task during the training process are shown in Figure 8. The is used as the denominator to balance multiple tasks, with smaller values representing a larger proportion of the total loss for that task.
In Figure 8, it can be seen that the value of for the classification task gradually increased in the first 50 iterations, then gradually decreased, while the value for the leaf number regression task gradually increased in the first 200 iterations and then slowly became smaller. Finally, for the leaf area regression task, kept increasing. In the early stage of model training, each task may dominate the training of the model and, thus, increased for all three tasks.
By adjusting the proportion of loss in each task during the training process, the tasks are balanced and individual tasks are prevented from dominating the training process, which can allow the optimal solution for all tasks to be obtained.
- (1)
- Classification task
Table 7 provides the optimal classification results with the weighted and unweighted loss models. It can be seen that, for the classification task, the weighted accuracy and recall of the weighted loss model increased by 6.25%, the weighted precision increased by 3.75%, and increased by 5.78% over the unweighted loss model.
- (2)
- Regression tasks
The regression results for the unweighted and weighted loss models are provided in Table 8. The comparison indicates that, for the leaf number regression task, the of the weighted loss model increased by 7.73%, the value of MSE decreased by 22.17%, and the value of MAE decreased by 13.92% compared to the unweighted loss model. For the leaf area regression task, the MSE value of the weighted loss model was reduced by 11.80% and the MAE value was reduced by 9.14% compared to the unweighted one. Results showed that the task-dependent uncertainty to weigh the loss function achieved better results in both classification and regression tasks.
3.5. Comparison with Previous Works
Dobrescu et al. [27] constructed a multi-task learning model with ResNet50 as a hard parameter sharing network, trained using the Ara2013 dataset, and obtained the optimal multi-task prediction model when = . In the case of the size of the dataset used in this paper, the model proposed by Dobrescu et al. (denoted as DMWL) was trained with 300 epochs, a batch size of 1, and = . Their model was compared with the best model obtained in this paper.
- (1)
- Classification task
The classification accuracy results for DMWL and our method on the training set are shown in Figure 9. As can be seen from the figure, our method performed better than DMWL, with higher classification accuracy, in the first 140 iterations, while both models achieved 100.00% classification accuracy on the training set in the latter 160 iterations.
The classification accuracy results for DMWL and our method on the test set are shown in Figure 10. From Figure 10, it can be seen that our method outperformed DMWL on the test set, with its classification accuracy after each iteration almost always being higher than that of DMWL.
DMWL achieved the best classification effect at 278 iterations, which was compared with the best values of the classification evaluation metrics achieved by our method. The comparison histogram is shown in Figure 11. In the classification task, the values of each classification evaluation metric for our method were higher than those obtained by DMWL.
- (2)
- Regression tasks
For the leaf number regression task, the best values achieved by our method against those of DMWL are shown in Figure 12. As can be seen from the figure, the value obtained with our method was higher than that for DMWL.
For the leaf area regression task, a comparison of the two models in terms of MSE is shown in Figure 13. Figure 13 indicates the MSE values obtained by our method were lower than those of DMWL.
In summary, the best model obtained in this paper demonstrated improved accuracy, recall, and other metrics in the classification task, as well as outperforming a state-of-the-art model in both regression tasks on the considered dataset.
4. Conclusions and Future Work
In this study, we used VGG16 as a base network and implemented hard parameter sharing and task-dependent uncertainty trade-off loss functions for genotype classification, leaf number counting, and leaf area estimation tasks to enable phenotypic analysis of Arabidopsis thaliana. Our method demonstrated better prediction results, with a classification accuracy of 96.88%, precision of 97.50%, and of 96.74%, while also obtaining optimal values of 0.7944 and 0.9787 in the leaf number and leaf area regression tasks, respectively. The multi-task learning models using task-dependent uncertainty trade-off loss functions improved the phenotypic result.
The dataset used in this paper was small, in the future, the dataset can be added. For the acquisition of leaf area labels, methods for obtaining leaf area information directly through images without manual annotation. For the leaf number and leaf area tasks, the task-specific layers can be re-defined to segment each leaf with target detection to obtain the leaf number and leaf area information without requiring manually labeled images.
Author Contributions
Conceptualization, P.Y.; Investigation, H.X.; Data curation, S.X.; Writing—original draft, S.X.; Writing—review & editing, Z.Z.; Supervision, H.X.; Funding acquisition, P.Y. All authors have read and agreed to the published version of the manuscript.
Funding
This work is supported by the Jiangsu Agriculture Science and Technology Innovation Fund (JASTIF) (SCX(21)3059) and the National Innovation and Entrepreneurship Training Program for College Students (202310307095Z).
Data Availability Statement
Not applicable.
Conflicts of Interest
The authors declare no conflict of interest.
References
- Pieruschka, R.; Schurr, U. Plant phenotyping: Past, present, and future. Plant Phenomics 2019, 2019, 7507131. [Google Scholar] [CrossRef] [PubMed]
- Xu, S.; Zhang, Y.; Dong, W.; Bie, Z.; Peng, C.; Huang, Y. Early identification and localization algorithm for weak seedlings based on phenotype detection and machine learning. Agriculture 2023, 13, 212. [Google Scholar] [CrossRef]
- Song, P.; Wang, J.; Guo, X.; Yang, W.; Zhao, C. High-throughput phenotyping: Breaking through the bottleneck in future crop breeding. Crop J. 2021, 9, 633–645. [Google Scholar] [CrossRef]
- Fu, X.; Jiang, D. High-throughput phenotyping: The latest research tool for sustainable crop production under global climate change scenarios. In Sustainable Crop Productivity and Quality Under Climate Change; Elsevier: Amsterdam, The Netherlands, 2022; pp. 313–381. [Google Scholar]
- Xiao, Q.; Bai, X.; Zhang, C.; He, Y. Advanced high-throughput plant phenotyping techniques for genome-wide association studies: A review. J. Adv. Res. 2022, 35, 215–230. [Google Scholar] [CrossRef]
- Xiong, J.; Yu, D.; Liu, S.; Shu, L.; Wang, X.; Liu, Z. A review of plant phenotypic image recognition technology based on deep learning. Electronics 2021, 10, 81. [Google Scholar] [CrossRef]
- Kolhar, S.; Jagtap, J. Leaf segmentation and counting for phenotyping of rosette plants using xception-style u-net and watershed algorithm. In Proceedings of the International Conference on Computer Vision and Image Processing, Nagpur, India, 3–5 December 2020; Springer: Berlin/Heidelberg, Germany, 2022; pp. 139–150. [Google Scholar]
- Maghuly, F.; Molin, E.M.; Saxena, R.; Konkin, D.J. Functional genomics in plant breeding 2.0. Int. J. Mol. Sci. 2022, 23, 6959. [Google Scholar] [CrossRef]
- Krizhevsky, A.; Sutskever, I.; Hinton, G.E. Imagenet classification with deep convolutional neural networks. In Proceedings of the 25th International Conference on Neural Information Processing Systems—Volume 1, NIPS’12, Red Hook, NY, USA, 3–6 December 2012; Curran Associates Inc.: Nice, France, 2012; pp. 1097–1105. [Google Scholar]
- Simonyan, K.; Zisserman, A. Very deep convolutional networks for large-scale image recognition. arXiv 2014, arXiv:1409.1556. [Google Scholar]
- Szegedy, C.; Liu, W.; Jia, Y.; Sermanet, P.; Reed, S.; Anguelov, D.; Erhan, D.; Vanhoucke, V.; Rabinovich, A. Going deeper with convolutions. In Proceedings of the IEEE Conference on Computer Vision and Pattern Recognition (CVPR), Las Vegas, NV, USA, 17–30 June 2015. [Google Scholar]
- He, K.; Zhang, X.; Ren, S.; Sun, J. Deep residual learning for image recognition. In Proceedings of the IEEE Conference on Computer Vision and Pattern Recognition, Las Vegas, NV, USA, 27–30 June 2016; pp. 770–778. [Google Scholar]
- Gao, S.-H.; Cheng, M.-M.; Zhao, K.; Zhang, X.-Y.; Yang, M.-H.; Torr, P. Res2net: A new multi-scale backbone architecture. IEEE Trans. Pattern Anal. Mach. Intell. 2021, 43, 652–662. [Google Scholar] [CrossRef]
- Yang, L.; Jiang, H.; Cai, R.; Wang, Y.; Song, S.; Huang, G.; Tian, Q. Condensenet v2: Sparse feature reactivation for deep networks. In Proceedings of the IEEE/CVF Conference on Computer Vision and Pattern Recognition (CVPR), Nashville, TN, USA, 20–25 June 2021; pp. 3569–3578. [Google Scholar]
- Maaz, M.; Shaker, A.; Cholakkal, H.; Khan, S.; W. Zamir, S.; Anwer, R.M.; Shahbaz Khan, F. Edgenext: Efficiently Amalgamated Cnn-Transformer Architecture for Mobile Vision Applications. In Computer Vision—ECCV 2022 Workshops; Karlinsky, L., Michaeli, T., Nishino, K., Eds.; Springer: Cham, Switzerland, 2023; pp. 3–20. [Google Scholar]
- Tang, Y.; Han, K.; Guo, J.; Xu, C.; Xu, C.; Wang, Y. Ghostnetv2: Enhance cheap operation with long-range attention. In Advances in Neural Information Processing Systems; Koyejo, S., Mohamed, S., Agarwal, A., Belgrave, D., Cho, K., Oh, A., Eds.; Curran Associates, Inc.: Nice, France, 2022; Volume 35, pp. 9969–9982. [Google Scholar]
- Guo, X.; Qiu, Y.; Nettleton, D.; Schnable, P.S. High-throughput field plant phenotyping: A self-supervised sequential cnn method to segment overlapping plants. Plant Phenomics 2023, 5, 52. [Google Scholar] [CrossRef]
- Zan, X.; Zhang, X.; Xing, Z.; Liu, W.; Zhang, X.; Su, W.; Liu, Z.; Zhao, Y.; Li, S. Automatic detection of maize tassels from uav images by combining random forest classifier and vgg16. Remote Sens. 2020, 12, 3094. [Google Scholar] [CrossRef]
- Lee, S.H.; Chan, C.S.; Wilkin, P.; Remagnino, P. Deep-plant: Plant identification with convolutional neural networks. In Proceedings of the 2015 IEEE International Conference on Image Processing (ICIP), Quebec City, QC, Canada, 27–30 September 2015; pp. 452–456. [Google Scholar]
- Dyrmann, M.; Karstoft, H.; Midtiby, H.S. Plant species classification using deep convolutional neural network. Biosyst. Eng. 2016, 151, 72–80. [Google Scholar] [CrossRef]
- Barré, P.; Stöver, B.C.; Müller, K.F.; Steinhage, V. Leafnet: A computer vision system for automatic plant species identification. Ecol. Inform. 2017, 40, 50–56. [Google Scholar] [CrossRef]
- Namin, S.T.; Esmaeilzadeh, M.; Najafi, M.; Brown, T.B.; Borevitz, J.O. Deep phenotyping: Deep learning for temporal phenotype/genotype classification. Plant Methods 2018, 14, 66. [Google Scholar] [CrossRef] [PubMed]
- Roitsch, T.; Cabrera-Bosquet, L.; Fournier, A.; Ghamkhar, K.; Jiménez-Berni, J.; Pinto, F.; Ober, E.S. New sensors and data-driven approaches—A path to next generation phenomics. Plant Sci. 2019, 282, 2–10. [Google Scholar] [CrossRef]
- Kong, H.; Chen, P. Mask r-cnn-based feature extraction and three-dimensional recognition of rice panicle ct images. Plant Direct 2021, 5, e00323. [Google Scholar] [CrossRef]
- Zhang, Y.; Yang, Q. A survey on multi-task learning. IEEE Trans. Knowl. Data Eng. 2021, 34, 5586–5609. [Google Scholar] [CrossRef]
- Wallingford, M.; Li, H.; Achille, A.; Ravichandran, A.; Fowlkes, C.; Bhotika, R.; Soatto, S. Task adaptive parameter sharing for multi-task learning. In Proceedings of the IEEE/CVF Conference on Computer Vision and Pattern Recognition, Seattle, WA, USA, 14–19 June 2022; pp. 7561–7570. [Google Scholar]
- Dobrescu, A.; Giuffrida, M.V.; Tsaftaris, S.A. Doing more with less: A multitask deep learning approach in plant phenotyping. Front. Plant Sci. 2020, 11, 141. [Google Scholar] [CrossRef]
- Pound, M.P.; Atkinson, J.A.; Wells, D.M.; Pridmore, T.P.; French, A.P. Deep learning for multi-task plant phenotyping. In Proceedings of the IEEE International Conference on Computer Vision Workshops, Venice, Italy, 22–29 October 2017; pp. 2055–2063. [Google Scholar]
- Wen, C.; Zhang, H.; Li, H.; Li, H.; Chen, J.; Guo, H.; Cheng, S. Multi-scene citrus detection based on multi-task deep learning network. In Proceedings of the 2020 IEEE International Conference on Systems, Man, and Cybernetics (SMC), Toronto, ON, Canada, 11–14 October 2020; pp. 912–919. [Google Scholar]
- La Rosa, L.E.C.; Zortea, M.; Gemignani, B.; Oliveira, D.A.B.; Feitosa, R.Q. Fcrn-based multi-task learning for automatic citrus tree detection from uav images. In Proceedings of the 2020 IEEE Latin American GRSS & ISPRS Remote Sensing Conference (LAGIRS), Santiago, Chile, 22–26 March 2020; pp. 403–408. [Google Scholar]
- Khaki, S.; Safaei, N.; Pham, H.; Wang, L. Wheatnet: A lightweight convolutional neural network for high-throughput image-based wheat head detection and counting. Neurocomputing 2020, 489, 78–89. [Google Scholar] [CrossRef]
- Chaudhury, B.; Joshi, V.; Mitra, P.; Sahadevan, A.S. Multi task learning for plant leaf segmentation and counting. In Proceedings of the 2023 IEEE Applied Sensing Conference (APSCON), Bengaluru, India, 23– 25 January 2023; pp. 1–3. [Google Scholar]
- Keceli, A.S.; Kaya, A.; Catal, C.; Tekinerdogan, B. Deep learning-based multi-task prediction system for plant disease and species detection. Ecol. Inform. 2020, 69, 101679. [Google Scholar] [CrossRef]
- Wang, D.; Wang, J.; Ren, Z.; Li, W. Dhbp: A dual-stream hierarchical bilinear pooling model for plant disease multi-task classification. Comput. Electron. Agric. 2022, 195, 106788. [Google Scholar] [CrossRef]
- Kendall, A.; Gal, Y.; Cipolla, R. Multi-task learning using uncertainty to weigh losses for scene geometry and semantics. In Proceedings of the IEEE Conference on Computer Vision and Pattern Recognition, Seattle, WA, USA, 14–19 June 2018; pp. 7482–7491. [Google Scholar]
- Minervini, M.; Fischbach, A.; Scharr, H.; Tsaftaris, S.A. Finely-grained annotated datasets for image-based plant phenotyping. Pattern Recognit. Lett. 2016, 81, 80–89. [Google Scholar] [CrossRef]
- Chollet, F. Xception: Deep learning with depthwise separable convolutions. In Proceedings of the IEEE Conference on Computer Vision and Pattern Recognition, Honolulu, HI, USA, 21–26 July 2017; pp. 1251–1258. [Google Scholar]
Figure 1.
The overall multi-task model framework of hard parameter sharing for Arabidopsis thaliana phenotype analysis.
Figure 1.
The overall multi-task model framework of hard parameter sharing for Arabidopsis thaliana phenotype analysis.

Figure 2.
The hard parameter sharing model based on VGG16.

Figure 3.
Procedure of weight correlation factor updating for phenotypic multi-tasking learning.

Figure 4.
Evaluation metric values under different .

Figure 5.
Confusion matrix for genotype classification task.

Figure 6.
Comparison of classification evaluation metrics for different basic networks.

Figure 7.
Histogram of values obtained by different basic networks.

Figure 8.
Variation of the logarithmic value of the squared weighting relationship factor for each task during the training process.
Figure 8.
Variation of the logarithmic value of the squared weighting relationship factor for each task during the training process.

Figure 9.
Classification accuracy comparison with DMWL on the training set.

Figure 10.
Classification accuracy comparison with DMWL on the test set.

Figure 11.
Histogram comparison of classification evaluation metrics with DMWL.

Figure 12.
comparison with DMWL in leaf number regression task.

Figure 13.
MSE comparison between with DMWL in leaf area regression task.


Table 1.
Important mathematical symbols and their descriptions.
| Symbol | Description |
|---|---|
| Learning rate | |
| Weighting relationship factors | |
| Weighted precision of the classification task | |
| Weighted recall of the classification task | |
| A | Accuracy of the classification task |
| Weighted comprehensive performance of precision and recall | |
| Coefficient of determination | |
| Mean absolute percentage error in the regression task | |
| Mean absolute error in the regression task | |
| Mean square error in the regression task |
Table 2.
Network parameters for each task in the modified VGG16 model.
| No. | Genotype Classification | Leaf Number Counting Regression | Leaf Area Regression |
|---|---|---|---|
| 1 | input (224 × 224 RGB image) | ||
| 2 | conv3-64 | ||
| 3 | conv3-64 | ||
| 4 | maxpool | ||
| 5 | conv3-128 | ||
| 6 | conv3-128 | ||
| 7 | maxpool | ||
| 8 | conv3-256 | ||
| 9 | conv3-256 | ||
| 10 | conv3-256 | ||
| 11 | maxpool | ||
| 12 | conv3-512 | ||
| 13 | conv3-512 | ||
| 14 | conv3-512 | ||
| 15 | FC-1536 | ||
| 16 | FC-512 | FC-512 | FC-512 |
| 17 | FC-256 | FC-1 | FC-1 |
| 18 | softmax | - | - |
Table 3.
Sample Arabidopsis thaliana images from the Ara2013-Canon dataset [36].
Table 3.
Sample Arabidopsis thaliana images from the Ara2013-Canon dataset [36].
| Genotype | Col-0 | ein2 | pgm | ctr | adh1 |
|---|---|---|---|---|---|
| Original image |  |  |  |  |  |
| Leaf segmentation image |  |  |  |  |  |
| Leaf numbers | 7 | 8 | 5 | 6 | 7 |
| Total number of samples | 35 | 39 | 35 | 32 | 24 |
| Percentage of categories | 21.21% | 23.64% | 21.21% | 19.39% | 14.55% |
Table 4.
Descriptions of , and .
| True Results | Predicted Results | |
|---|---|---|
| Positive Example | Negative Example | |
| Positive example | True positive example () | False negative example () |
| Negative example | False positive example () | True negative example () |
Table 5.
The optimal results for different evaluation metrics for genotype classification tasks.
| Accuracy | |||
|---|---|---|---|
| 0.9688 | 0.9688 | 0.9750 | 0.9674 |
Table 6.
Regression results when learning rate = .
| Task | MSE | MAE | MAPE | |
|---|---|---|---|---|
| Leaf Number Regression | 0.7944 | 0.5892 | 0.5846 | 0.0691 |
| Leaf Area Regression | 0.9787 | 0.3029 | 0.4551 | 0.0328 |
Table 7.
Results comparison for unweighted loss and weighted loss models in the classification task.
Table 7.
Results comparison for unweighted loss and weighted loss models in the classification task.
| Accuracy | ||||
|---|---|---|---|---|
| Unweighted loss | 0.9063 | 0.9063 | 0.9375 | 0.9096 |
| Weighted loss | 0.9688 | 0.9688 | 0.9750 | 0.9674 |
Table 8.
Results comparison for unweighted loss and weighted loss models in the regression tasks.
| Task | Unweighted Loss | Weighted Loss | ||||
|---|---|---|---|---|---|---|
| R2 | MSE | MAE | R2 | MSE | MAE | |
| Leaf number regression | 0.7171 | 0.8109 | 0.7238 | 0.7944 | 0.5892 | 0.5846 |
| Leaf area regression | 0.9703 | 0.4209 | 0.5465 | 0.9787 | 0.3029 | 0.4551 |
Disclaimer/Publisher’s Note: The statements, opinions and data contained in all publications are solely those of the individual author(s) and contributor(s) and not of MDPI and/or the editor(s). MDPI and/or the editor(s) disclaim responsibility for any injury to people or property resulting from any ideas, methods, instructions or products referred to in the content. |
© 2023 by the authors. Licensee MDPI, Basel, Switzerland. This article is an open access article distributed under the terms and conditions of the Creative Commons Attribution (CC BY) license (https://creativecommons.org/licenses/by/4.0/).
Share and Cite
MDPI and ACS Style
Yuan, P.; Xu, S.; Zhai, Z.; Xu, H. Phenotype Analysis of Arabidopsis thaliana Based on Optimized Multi-Task Learning. Mathematics 2023, 11, 3821. https://doi.org/10.3390/math11183821
AMA Style
Yuan P, Xu S, Zhai Z, Xu H. Phenotype Analysis of Arabidopsis thaliana Based on Optimized Multi-Task Learning. Mathematics. 2023; 11(18):3821. https://doi.org/10.3390/math11183821
Chicago/Turabian StyleYuan, Peisen, Shuning Xu, Zhaoyu Zhai, and Huanliang Xu. 2023. "Phenotype Analysis of Arabidopsis thaliana Based on Optimized Multi-Task Learning" Mathematics 11, no. 18: 3821. https://doi.org/10.3390/math11183821
Note that from the first issue of 2016, this journal uses article numbers instead of page numbers. See further details here.