
Ranking of Service Quality Index and Solutions for Online English Teaching in the Post-COVID-19 Crisis

1
School of Education and Psychology, Minnan Normal University, Zhengzhou 363000, China
2
General Department, National and Kapodistrian University of Athens, GR-34400 Euripus Campus, 15772 Athens, Greece
3
Department of Visual Communication Design, Huzhou University, Huzhou 313000, China
4
School of Economics and Management, Sanming University, Sanming 365004, China
*
Author to whom correspondence should be addressed.
Mathematics 2023, 11(18), 4001; https://doi.org/10.3390/math11184001
Submission received: 30 August 2023
/
Revised: 19 September 2023
/
Accepted: 19 September 2023
/
Published: 20 September 2023
(This article belongs to the Special Issue Practice and Application of Emergency Management in Social Systems: Mathematical Modeling and the Use of Information Technology)
Abstract
:Online English teaching remains prevalent post-pandemic, yet there is a significant research gap in assessing service quality during this period. Thus, this study employs a hybrid FANP and GRA method to evaluate critical factors sustaining high service quality in online English teaching in the post-coronavirus era. The FANP model highlights key contributors like professional employees, trustworthy staff, flexible transaction times, and a secure transaction environment. In contrast, GRA identifies personnel quality, responsiveness to customer needs, and a secure transaction mechanism as top factors. Individual customer needs and service facilities are of less importance in both models. This study’s primary contribution is proposing an integrated FANP and GRA approach to rank potential solutions for online English teaching service quality in the post-COVID-19 fuzzy context. The findings guide the online English teaching industry in maintaining service quality in future similar scenarios.
1. Introduction
1.1. Research Background
The COVID-19 pandemic has had an impact on the education industry; in particular, the lockdown has resulted in the inability of people to move, thus changing the learning method from traditional face-to-face learning to online learning [1]. Meanwhile, scholars such as Ria [2] and Sarnoto et al. [3] mentioned that online learning is an effective way to deal with the challenges of the epidemic in developing countries. Aso, la Velle et al. [4] mentioned that learning disruption is the biggest challenge during the COVID-19 pandemic. Therefore, they proposed a new online learning framework to reduce the impact of learning interruptions. Hoofman et al. [5] reported that online learning has become normal due to the COVID-19 lockdown. Hazaymeh [6] pointed out that over 88% of students had a positive perception of online learning. Dhawan [7] proposed an importance analysis model for e-learning in India. Agarwal et al. [8] investigated the effectiveness of online learning from the perspective of students. They discovered that online learning was enjoyable and helpful during the period of the COVID-19 pandemic. Interestingly, some researchers [9,10,11] reported similar research results, demonstrating that online educational methods were effective in response to the development of the COVID-19 epidemic. Moreover, Ibrahim et al. [12] proposed a case study of online foreign language learning from the perspective of Russian students. They found that these characteristics of usefulness, comfort, and acceptability were important factors for students in the digital learning environment. Laili et al. [13] argued that applications of online learning should be easy to access, motivating, and in the form of a combination among various online learning media for providing the best way during the process of teaching and learning. Rifiyanti [14] indicated that shifting to online learning, particularly for English classes, was also an effective way during the pandemic. Almusharraf et al. [15] revealed that students were satisfied with the online learning environment during the pandemic. Furthermore, some researchers [16,17,18] provided advice on online education strategies and useful tools for teachers during this period.
1.2. Motivation
In addition, some scholars [19,20,21,22] paid attention to the trend of online English education in the post-coronavirus era. Among them, Younesi et al. [20] reported a case study of online language teaching in India in the post-COVID-19 era. Likewise, Kaoud et al. [21] investigated the perceptions of Egyptian universities’ students toward online English learning.
Interestingly, much research [23,24,25,26,27] mentioned that the service quality of online education was a major research need during the post-coronavirus era. Among them, Camilleri [23] proposed a systematic review of service quality measurement for online education in 2021. His research work was the first study related to service quality measurement in the post-epidemic era. Lin et al. [24] reported that service quality is the key factor in EFL students’ learning performance for the online educational industry in the post-coronavirus crisis. Additionally, some studies [25,26,27] reported that service quality assessment is also a research need for the blended educational industry during the post-COVID-19 era.
Despite this, the related research of service quality for online English teaching industry using SERVQUAL scale is insufficient in the post coronavirus era. Accordingly, the evaluation of service quality for online English teaching industry is needed for providing decision-making suggestions for online English industry in similar scenario in the future.
1.3. Objectives
In view of this, this research will establish a framework based on the SERVQUAL scale for measuring the quality of online English teaching services through expert questionnaires. Afterwards, a fuzzy analytic network process (FANP) will be implemented to calculate the weights of dimensions and indicators. Finally, gray rational analysis (GRA) will be applied to rank all alternatives, thereby achieving the following research purposes:
- To construct the evaluation structure based on the SERVQUAL scale for the online English teaching service quality;
- To integrate expert consensus for analyzing the weight of dimensions and indicators for online English teaching service quality using FANP;
- To evaluate and rank alternatives to online English teaching service quality by applying GRA;
- To provide suggestions for the online English teaching industry to maintain good service quality in similar scenarios in the future based on the research findings.
2. Literature Review
2.1. SERVQUAL Scale
The SERVQUAL scale is a multi-item scale for service quality measurement that evolved from the conceptual model of service quality proposed by Parasuraman et al. [28] in 1985. Meanwhile, it has also been verified by many scholars to summarize five main aspects and 22 evaluation indicators and has become the most widely known service quality measurement method [29,30,31]. The five main dimensions are shown in Table 1.
Meanwhile, Arambewela et al. [32] proposed a case study of higher educational service quality assessment in Australia based on the SERVQUAL scale. Stodnick et al. [33] mentioned that the SERVQUAL scale is superior to the traditional evaluation scales. It can effectively evaluate the quality of educational services and has positive advantages for the measurement of service quality in the education industry. Yousapronpaiboon et al. [34] applied the SERVQUAL scale to investigate the service quality of private higher education institutions in Thailand. This study found that the five major aspects of the SERVQUAL scale can effectively express Thai consumers’ expectations for higher education service quality.
Also, Aboubakr et al. [35] proposed a case study of educational service quality among dentistry and nursing students in the post-COVID-19 era. Lizarelli et al. [36] proposed a hybrid model of SERVQUAL scale and fuzzy approaches for educational service quality assessment in the post-coronavirus crisis period.
Moreover, some studies [37,38,39,40,41,42] have pointed out that a hybrid method of SERVQUAL and multi-criteria decision-making (MCDM) techniques can effectively examine service quality.
The above research results revealed the feasibility of applying the SERVQUAL scale to service quality assessment in the education field and integrating it with other MCDM methods. Accordingly, this research will integrate the SERVQUAL scale with FANP and GRA to assess customer needs in the post-COVID-19 period and provide a decision-making basis for online English teaching practitioners.
2.2. Fuzzy Analytic Network Process Model
The Analytic Network Process (ANP) proposed by Saaty [43] in 1996 has been confirmed by many studies and recognized as one of the most complete MCDM research methods nowadays [44,45,46,47,48,49,50]. Meanwhile, ANP is well suited to solve problems with special structures between identified nonlinear links.
Unfortunately, ANP does not provide a good explanation for problems involving uncertain phenomena. Therefore, it is necessary to introduce fuzzy approaches.
Fuzzy theory, first proposed by Dr. Lotfi Zadeh in 1965 [51]. It is a method to describe the fuzzy phenomenon of human psychology using mathematical language [52]. Since the variables of human psychological perception are often difficult to accurately estimate, the use of fuzzy theory can make the statistical results closer to the perceived state of human psychology [53].
Also, Kahraman et al. [54] considered that a relatively new research approach is needed in the face of decision analysis problems raised by imprecise variables of psychological perception. Therefore, an integrated approach consisting of fuzzy theory and ANP, called Fuzzy ANP (FANP), was proposed to deal with decision-making problems related to such imprecise psycho-perceptual variables [54].
For decades, FANP has been widely used in the research field of MCDM problems and has proven to be a highly reliable and valid research method for MCDM problems. For example, Lupo [55] proposed an integrated framework of fuzzy logic and ANP to measure the service quality of the healthcare industry. Chang et al. [56] and Ozdemir et al. [57] applied FANP to the e-book and aircraft industries for aircraft selection and business strategy formulation. In addition, Parameshwaran et al. [58] proposed a framework for product development factor evaluation in a fuzzy environment. Lin et al. [59] proposed a hybrid fuzzy approach for the service quality evaluation of the blended design teaching industry. Their research results demonstrated the feasibility of applying fuzzy methods to the industries of product development and education. Moreover, it was a major inspiration for this study’s application of the FANP method to the measurement of service quality in the online English teaching industry.
2.3. Grey Rational Analysis
Grey Rational Analysis (GRA) was proposed by Deng [60]. This method is mainly aimed at system models with uncertainty or incomplete information. It can effectively deal with uncertainty, multivariate input information, or discrete data through the use of system correlation analysis, model building, prediction, and decision-making methods [61]. Such properties make the GRA a suitable method for solving multi-attribute and multi-scenario MCDM problems [62,63,64,65].
In the meantime, many scholars [66,67,68,69] combined the GRA with other MCDM research methods (such as AHP and ANP) to deal with multi-domain MCDM problems. Also, some researchers [70,71] also point to the mixed use of FAHP, FANP, and GRA to evaluate energy storage and ERP.
Moreover, some scholars [72,73,74] applied GRA to research works in education-related fields before and after the COVID-19 pandemic. For example, Ertugrul et al. [72] presented a case study in 2016, applying the GRA to assess the academic performance of Turkish higher education institutions. Zhang et al. [73] proposed an algorithm for teaching evaluation based on GRA in the post-coronavirus era. Similarly, Wan et al. [74] proposed a study of the service quality evaluation for online art education based on FANP and GRA in the post-COVID-19 era.
2.4. Summary
According to the chapter of the literature review, it is known that FANP and GRA are effective techniques for solving MCDM problems in many fields. Meanwhile, the integrated approaches of FANP and GRA contribute to interdisciplinary research. However, the evaluation criteria for each alternative are obtained by integrating expert opinions into the FANP model. Therefore, the disadvantage of such models is that they rely on expert experience and are prone to subjective opinions.
With this perspective, some scholars [75,76] have advocated the use of GRA to rank all alternatives in the later stages of such research, thus mitigating any potential bias introduced by expert subjectivity.
Hence, this study will be grounded in the SERVQUAL scale to construct a framework for evaluating the service quality of online English teaching through expert interviews. Subsequently, FANP will be employed to determine the weights of dimensions and indicators. Finally, GRA will be applied to compute gray rational grades (GRGs) to identify potential optimal solutions that align with our primary research objectives using this integrated approach.
3. Materials and Methods
In this paper, an integrated method of FANP and GRA based on the SERVQUAL scale was proposed for the service quality estimation of online English teaching in the post-COVID-19 era. The research process is shown in Figure 1.
3.1. The Establishment of Hierarchy and Network Structure
Firstly, this study decomposed the research problem into dimensions, indicators, and alternatives based on the ANP and SERVQUAL scales. Then, a hierarchical structure was established by grouping them to discover the relationship between indicators. Meanwhile, Tsai et al. [77] suggested that the content used for evaluation should be revised through expert discussion. Therefore, expert questionnaires were utilized to gather the opinions of experts in this research. Afterwards, dimensions, indicators, and alternatives were revised according to the suggestions of all experts, thereby making the description and semantics of dimensions, indicators, and alternatives conform to the particularity of online English teaching in the post-coronavirus era.
3.2. Fuzzy Logic and Linguistic Variables
Linguistic variables, such as “Very important”, “Somewhat important”, and “Unimportant”, are seen as useful tools for service quality evaluation and measurement [78]. However, such linguistic variables indicating importance are often ambiguous. Thus, fuzzy logic is a useful method for clarifying mental perception when the state of human mental perception is unclear [79].
Fuzzy logic was proposed by Zadeh in 1975 [80]. It is an algorithm with fuzzy numbers that introduces a similar concept of reasoning to find the result that is closest to the variable of human psychological perception, further improving the content of fuzzy theory.
In view of this, fuzzy numbers were studied, and it was discovered that fuzzy numbers are generally expressed in mathematical ways [81,82,83,84,85,86,87,88]. For example, the triangular fuzzy number (, , ) given by the following equation is shown in Figure 2.
In the meantime, much research [81,82,83,84,85,86,87,88] has reported that the most likely evaluation value of triangular fuzzy numbers is the crisp value. The crisp value of triangular fuzzy numbers is given by the following equation:
Also, Buckley [89] reported that triangular fuzzy numbers transform fuzzy language into practical numbers and accurately measure psychological perception. Moreover, Pedrycz [90] proved that triangular fuzzy numbers are suitable for representing the relative judgment strengths of criteria and alternatives in a hierarchy.
3.3. Questionnaire Development and Establishment
As for the questionnaire development, it is necessary to consider the validity of the questionnaire before questionnaire measurement. Based on expert advice, this study revises the questionnaire description on the premise of retaining the original semantics for dimensions and indicators in the SERVQUAL scale, thereby maintaining the high efficiency of the questionnaire content [92]. Then, a pre-test is conducted to understand whether the meaning of the questionnaire is clear. Afterwards, the statement of questionnaires is revised according to the results of the pre-test. Finally, this study uses the expert questionnaire method to assess the weight of dimensions and indicators for online English teaching service quality in the post-COVID-19 era according to the FANP method.
As for the number of expert questionnaires, F. J. Parenté and J. K. Anderson-Parenté [93] suggested that there should be at least ten or more experts. Interestingly, we found that much research [94,95,96,97,98,99,100,101,102,103] used a small sample size of four to nine to obtain a valuable decision-making basis. In the meantime, Darko et al. [104] reported that a large sample size may not be helpful due to “cold-called” experts, which could profoundly affect the result of the consistency assessment.
In view of this, a total of 20 experts in online English teaching are selected by this research as the survey objects, thereby avoiding the influence of opinions from “cold-called” experts on the consistency evaluation results to achieve our main research objectives.
3.4. Fuzzy Analytic Network Process
3.4.1. Synthesize Opinions of All Experts
In this paper, the method of geometric mean is utilizes to generalize the results of expert questionnaires, largely because Saaty [105] considered that the geometric mean method is not easily affected by extreme values. Therefore, the consolidation result of all expert opinions is calculated by the following equation:
where
n is the number of experts.
3.4.2. Set up the Fuzzy Pairwise Comparison Matrix
In this step, a fuzzy pairwise comparison matrix is performed and presented as follows:
where
represents the fuzzy pairwise comparison matrix.
is triangular fuzzy mean value for comparing priority pairs among elements.
3.4.3. Fuzzy Decomposition
As for fuzzy decomposition, the process of defuzzification is presented as follows [106,107,108]:
where
where
is the lower bound value of the triangular fuzzy number.
represents the median value of the triangular fuzzy number.
is the upper bound value of the triangular fuzzy number.
When the diagonal matrix is matching, we have
3.4.4. Set up the De-Fuzzified Pairwise Comparison Matrix
After the process of fuzzy decomposition. The de-fuzzified pairwise comparison matrix is expressed as follows:
3.4.5. Consistency Test
The consistency index (C.I.) and consistency ratio (C.R.) were proposed by Saaty [109] to assess the consistency of the comparison matrix. The C.I. and C.R. are calculated as follows:
where
is the maximum value of the matrix,
n is the number of indicators.
When checking the consistency ratio (C.R.), it must first find the consistency index (C.I.). The consistency index is defined as follows:
where
C.I. is the consistency index.
R.I. represents the random index.
3.4.6. The Super Matrix Construction
After completing the above steps, the super matrix is formed as follows:
where
represents the weight of indicators in the super matrix.
is the vector of the feature.
means the vector of the criterion.
represents the dependency of dimensions.
is the dependency of criteria.
Afterwards, the weight of indicators in the super matrix () is calculated as follows:
where
is the weight matrix of main criteria considering the interdependence degree.
is the evaluation weight matrix of indicators considering the interdependence degree.
3.5. Grey Rational Analysis
3.5.1. The Definition of Evaluation Indicators and Data Treatment
Firstly, the five alternatives in the study correspond to the 18 indicators of the SERVQUAL scale. Then, the direct evaluation (with a rating from 1 to 9, with the higher value indicating better ability) is implemented for the assessment. Afterwards, the experts score the 18 indicators and take the average as the score of the five alternatives.
3.5.2. The Calculation of Referential Series and Compared Series
Firstly, the referential series () with the number of indicators () is defined as follows:
Then, the compared series () is defined as follows:
3.5.3. Normalization
Afterwards the data of referential series and compared series should be normalized, thereby making them comparable.
In this research, scores of all criteria are larger-the-better. Thus, the process of normalisation for referential series and compared series is expressed as follows [110]:
where
is the maximum value of indicator.
represents the minimum value of indicator.
3.5.4. Calculate the Difference between Referential Series and Compared Series
The series difference is calculated as follows:
where
is the referential series of 18 evaluation indicators.
represents the compared series of 18 evaluation indicators.
3.5.5. Calculate the Gray Rational Coefficient
The gray relational coefficient between the compared series () and the referential series () at the indicator is defined as follows:
3.5.6. The Calculation the Gray Rational Grade
The gray rational grade (GRG) of a series () is calculated as follows:
Finally, the alternatives are prioritised based on the magnitude of GRG values (Γ0i). The alternative with the largest GRG value represents the best alternative and so on.
4. Result
4.1. The Construction of Hierarchy and Network Structure
This research engaged ten experts in online English teaching, comprising four senior industry managers and six senior online English instructors, to review and refine dimensions, indicators, and alternatives. Subsequently, ten expert consultation questionnaires were administered to these experts to check the clarity of indicators within the SERVQUAL scale, yielding ten valid responses. Based on these inputs, a questionnaire assessing the quality of online English teaching services was developed.
Despite the questionnaire’s creation, a pre-test was conducted with ten additional experts to assess its semantic clarity. For example, the dimension of tangibility in the SERVQUAL scale originally refers to the material conditions such as the equipment, the personnel, or the appearance of the service provider. In the meantime, most experts argue that the tangibility dimensions represent the material conditions possessed by service providers in the post-epidemic era. Thus, they recommended retaining tangibility to evaluate whether the material conditions possessed by service providers will affect the service quality of online English education service providers in the post-epidemic era.
In terms of indicators, A2, for example, refers to the various equipment owned by online English language learning service providers that can be used by service providers and consumers. Meanwhile, all experts believed that online English teaching services involved online transactions of money or services. Therefore, experts recommend adding security-related descriptions to the D1 statement. Also, experts suggest that customized service delivery times should be provided in the indicators to meet customer needs. Therefore, this study modified the indicator description of E1 based on the experts’ suggestions.
Then, another ten experts revised the statements and added auxiliary descriptions to the semantics of the questionnaires based on the results of the pre-test survey. Afterwards, the evaluation structure of online English teaching service quality based on the SERVQUAL scale, including 5 main dimensions, 18 indicators, and 5 alternatives, was constructed and shown in Figure 3.
In addition, this study collected expert opinions on the interrelationships among various indicators through relevant questionnaires. While most expert-approved correlations confirm the interdependence of indicators, there is a chance that some correlated indicators might be overlooked. Conversely, this study could select indicators with low expert recognition, but this would significantly increase the interdependence among indicators, resulting in a larger number of questions in the comparison questionnaire. For instance, if more than six experts reach a consensus on the interdependence of indicators, the questionnaire would contain over 50 questions.
In light of this, the researchers have chosen to require the approval of over nine out of ten experts to prevent excessive questionnaire length. This approach allows the network relationships among indicators to be preserved, signifying that the majority of experts determine the interdependency of all indicators. For instance, if more than nine out of ten experts concur that indicator B1 impacts A1, it indicates a relationship between the two indicators, B1 and A1.
Finally, this research has condensed the viewpoints of all experts into a hierarchical and networked structure for evaluating the service quality of online English teaching in the post-COVID-19 era, as depicted in Figure 4.
4.2. Questionnaire Establishment and Measurement
After the hierarchy and network structure were obtained, we inputted the associated evaluation indicators in the hierarchy and network structure into the Super Decision software to create a pairwise comparison questionnaire on a nine-point evaluation scale. The results of pairwise comparison questionnaires were integrated using Equation (3) and analyzed by fuzzy ANP. Meanwhile, this study established a direct rating scale questionnaire with five alternatives. The results of direct rating scale questionnaires were analyzed using GRA.
Then, in this study, a total of 24 expert questionnaires were sent to the online English teaching experts from 10 March 2022 to 31 May 2022. Subsequently, a total of 20 valid questionnaires were recovered, including 10 valid pairwise comparison questionnaires and 10 valid direct rating scale questionnaires.
4.3. Numerical Analysis
4.3.1. Fuzzy Analytic Network Process Model
After collecting valid expert questionnaires, Equation (3) was used to integrate experts’ opinions. Afterwards, the fuzzy pairwise comparison matrix for all criteria from the FANP model was established.
Table 4 demonstrates the fuzzy pairwise comparison matrix for five dimensions.
Afterwards, and are used during the defuzzification [111,112,113]. The process of fuzzy decomposition for dimensions between tangibility (A) and reliability (B) is as follows:
The remaining process of fuzzy decomposition for other dimensions is similar to the above calculation. The de-fuzzified pairwise comparison matrix for five dimensions from the FANP model is shown in Table 5.
The calculation of the maximum individual value for each dimension (AM) is shown in Table 6.
The calculation of weight () for each dimension is shown in Table 7.
The calculation of the normalized matrix is shown in Table 8.
The calculation of maximum eigenvector () and eigenvalue () is shown in Table 9.
Since numbers of dimensions are 5, we obtain n = 5; C.I. is calculated as follows:
For C.R., with n = 5, we have R.I. = 1.12.
The final calculation result of de-fuzzified pairwise comparison matrix between five dimensions is shown in Table 10.
The calculation method of the de-fuzzified pairwise comparison matrix for the remaining dimensions and indicators is analogous to the above calculation method. Finally, C.I. and C.R. values for the remaining dimensions and indicators are shown in Table 11
Since both C.I. and C.R. are less than 0.1, the result of the consistency tests is acceptable.
After passing the consistency test, the super matrix is calculated using Super Decision software. The value of each column in the limit super matrix is the weight of each indicator, as shown in Table 12.
4.3.2. Gray Rational Analysis
In this study, scores of all alternatives given by experts are larger-the-better. Therefore, the largest value of each sub-criteria is considered as a referential series (x0), and the value of each indicator is considered a compared series (xi). Table 13 reveals the referential series (x0) and compared series (xi).
The normalized data is calculated using Equation (16), as shown in Table 14.
The calculation of deviation sequences using Equation (17) is shown in Table 15.
The calculation of gray rational coefficient using Equation (18) is shown in Table 16.
4.4. Research Result
4.4.1. Fuzzy Analytic Network Process Model
As for the ranking of all dimensions, it ranked according to their overall weight as reliability (0.402), assurance (0.303), responsiveness (0.139), tangibility (0.082), and empathy (0.074).
The overall weight of all dimensions in the FANP model is shown in Table 17.
As for the ranking of indicators, the top 3 weights of indicators are “Employees are professional and obtain adequate support to do their jobs well” (D3, 0.151), “When online English teaching service team promises to do something by a certain time, it does so” (B1, 0.129), and “Online English teaching service team can provide customers with flexible trading hours” (E2, 0.123).
Meanwhile, weights of indicators ranked fourth to sixth are “The service is provided legally, safely and reliably” (B3, 0.114), “Customers feel safe in their transactions with online English teaching service team” (D1, 0.100), and “Employees are never too busy to respond to customer requests promptly” (C3, 0.063).
Also, the seventh to eighth important indicators are “Online English teaching service team keeps its records accurately” (B4, 0.056) and “Employees of online English teaching service team are sympathetic and reassuring” (B2, 0.051).
The overall weight of all indicators in the FANP model is shown in Figure 5.
4.4.2. Gray Rational Analysis
The priority of all alternatives is based on the gray rational grade (Γ0i). The calculation of the gray rational grade using Equation (19) is shown in Table 18.
The larger value of gray rational grade represents that the alternative is closer to the optimal solution. Accordingly, rankings of all alternatives based on gray rational grade are “Personnel quality and stability” (Alt 2, 0.8347), “Response speed to customer need” (Alt 3, 0.5943), “Safe transaction environment” (Alt 3, 0.4855), “Personalised needs of customers” (Alt 5, 0.391), and “Appealing facility” (Alt 1, 0.3).
5. Discussion and Research Limitation
5.1. Discussion
Matzler et al. [114] found that customer satisfaction evaluation comprises three factors: basic, performance, and excitement factors. They emphasized the importance of identifying and fulfilling customers’ fundamental needs. In this study, the analysis of expert questionnaires revealed that reliability emerged as the most crucial dimension, while tangibility was identified as the least significant in the FANP model. Meanwhile, the top alternative in the GRA model is “Personnel quality and stability”, followed by “Response speed to customer need” and “Safe transaction environment”. Also, the indicators in order of overall weight in the reliability dimension are “When online English teaching service team promises to do something by a certain time, it does so”, “The service is provided legally, safely and reliably” and “Online English teaching service team keeps its records accurately”. This means that in the FANP and GRA models, experts believe that the basic needs of customers include the quality of employees, speed of response to customer needs, safe transaction environment, service team emphasis on commitment, legal service content, and correct customer record demand.
Moreover, experts are of the opinion that factors like the equipment and appearance of service providers will be less significant in the post-pandemic era. This primarily stems from the fact that consumers opt for online learning and frequently need to acquire their own equipment, resulting in a reduced emphasis on the service provider’s own equipment.
In addition, Kim et al. [115] and Uppal et al. [116] put forth research prior to the COVID-19 pandemic. They indicated that dimensions within the SERVQUAL scale, including reliability, responsiveness, assurance, and empathy, have a significant impact on the assessment of online learning and e-learning satisfaction. Furthermore, Sumi [117] and Ma et al. [118] stated that the dimensions and indicators in the SERVQUAL scale are suitable for assessing the service quality of the online teaching industry amidst the COVID-19 pandemic.
It is worth noting that the results of the previous research are very similar to those of the current study. For example, Kim et al. [115] found that the dimension of empathy has an impact on service quality. However, the dimension of empathy is relatively less important than the three dimensions of reliability, responsiveness, and assurance. Ma et al. [118] reported that the empathy aspect is a relatively low-ranking aspect from the perspective of online English educational service providers and consumers. In the meantime, indicators in the empathy facet, such as E1 and E2, also rank low from the perspective of online English teaching service providers and consumers. Thus, the dimensions and indicators used to assess the quality of educational services remain consistent, whether in the post-COVID-19 era, during the COVID-19 pandemic, or before the coronavirus pandemic.
Accordingly, service providers of online English teaching should address basic consumer needs, such as high-quality personnel, reliable service content, and a safe transactional environment, to deliver high-quality service in the post-COVID-19 era.
5.2. Research Limitation
This research approach integrates FANP and GRA methods. Within the hierarchy and network structure, over 90% of experts concur on the relationships, indicating a substantial consensus. Pairwise comparisons of indicator importance employ C.I. and C.R. values for validation. In the GRA model, 10 experts assessed the indicators and plans. It is important to note that this research relies on expert opinions, which constitutes a limitation of this study and the ANP and GRA methodologies. As such, experienced experts were specifically engaged to complete the questionnaires.
6. Conclusions
This research established the hierarchy and network structure of a crisis management plan for the online English teaching industry based on the SERVQUAL scale. Then, the weights of all dimensions and indicators were analyzed and calculated using FANP. Afterwards, all alternatives were ranked using GRA.
The main contribution of this study is to introduce a hybrid approach of FANP and GRA to assess the service quality of online English teaching in the post-COVID-19 era in a fuzzy environment. In the meantime, our findings highlight that having competent and reliable staff, legal and trustworthy service content, flexible business hours, and a secure transaction environment are crucial factors for providing quality services in the online English education industry in the post-coronavirus pandemic era.
As for the result of GRA in this study, it was reported that well-qualified teachers, low-mobility employees, and instant response speed to customer needs are also important factors in establishing optimized crisis management plan for online English teaching in the post-epidemic era.
Moreover, this study has an indicative role for the online English teaching industry to maintain excellent service quality in the post-COVID-19 era. Finally, the research findings of this study provide guidance for the online English teaching industry in future related scenarios.
Author Contributions
Conceptualisation, investigation, Y.-Y.M. and C.-L.L.; formal analysis, writing and editing, C.-L.L. and H.-L.L.; methodology, Y.-Y.M. and C.-L.L.; validation, Y.-Y.M. and C.-L.L.; writing—original draft preparation, Y.-Y.M.; writing—review and editing, Y.-Y.M. All authors have read and agreed to the published version of the manuscript.
Funding
This paper is supported by the Fujian Provincial Social Sciences Foundation Project [grant number FJ2021T016].
Data Availability Statement
Not applicable.
Conflicts of Interest
The authors declare no conflict of interest.
References
- Karakose, T. The Impact of the COVID-19 Epidemic on Higher Education: Opportunities and Implications for Policy and Practice. Educ. Process Int. J. EDUPIJ 2021, 10, 7–12. [Google Scholar] [CrossRef]
- Ria, N.S. Teaching during COVID-19 Pandemic: What Should Educators Do to Save Nations’ Educational Crisis? Lectio J. Lang. Lang. Teach. 2021, 1, 29–40. [Google Scholar]
- Sarnoto, A.Z.; Shunhaji, A.; Rahmawati, S.T.; Hidayat, R.; Amiroh, A.; Hamid, A. The Urgency of Education Crisis Management Based on Islamic Boarding Schools during the COVID-19 Pandemic. Linguist. Cult. Rev. 2021, 5, 1764–1774. [Google Scholar] [CrossRef]
- la Velle, L.; Newman, S.; Montgomery, C.; Hyatt, D. Initial Teacher Education in England and the Covid-19 Pandemic: Challenges and Opportunities. J. Educ. Teach. 2020, 46, 596–608. [Google Scholar] [CrossRef]
- Hoofman, J.; Secord, E. The Effect of COVID-19 on Education. Pediatr. Clin. 2021, 68, 1071–1079. [Google Scholar] [CrossRef]
- Hazaymeh, W.A. EFL Students’ Perceptions of Online Distance Learning for Enhancing English Language Learning during Covid-19 Pandemic. Int. J. Instr. 2021, 14, 501–518. [Google Scholar] [CrossRef]
- Dhawan, S. Online Learning: A Panacea in the Time of COVID-19 Crisis. J. Educ. Technol. Syst. 2020, 49, 5–22. [Google Scholar] [CrossRef]
- Agarwal, S.; Kaushik, J. Student’s Perception of Online Learning during COVID Pandemic. Indian J. Pediatr. 2020, 87, 554. [Google Scholar] [CrossRef]
- Syauqi, K.; Munadi, S.; Triyono, M.B. Students’ Perceptions toward Vocational Education on Online Learning during the COVID-19 Pandemic. Int. J. Eval. Res. Educ. 2020, 9, 881–886. [Google Scholar] [CrossRef]
- Muthuprasad, T.; Aiswarya, S.; Aditya, K.S.; Jha, G.K. Students’ Perception and Preference for Online Education in India during COVID -19 Pandemic. Soc. Sci. Humanit. Open 2021, 3, 100101. [Google Scholar] [CrossRef]
- Bączek, M.; Zagańczyk-Bączek, M.; Szpringer, M.; Jaroszyński, A.; Wożakowska-Kapłon, B. Students’ Perception of Online Learning during the COVID-19 Pandemic. Medicine 2021, 100, e24821. [Google Scholar] [CrossRef] [PubMed]
- Ibrahim, M.K.; Spitsyna, N.; Isaeva, A. Learning Foreign Languages in a Digital Environment Learners’ Perception of the Sudden Transition to e-Learning during COVID-19 Lockdown. Electron. J. E-Learn 2021, 19, 548–558. [Google Scholar] [CrossRef]
- Laili, R.N.; Nashir, M. Higher Education Students’ Perception on Online Learning during Covid-19 Pandemic. Edukatif J. Ilmu Pendidik. 2021, 3, 689–697. [Google Scholar] [CrossRef]
- Rifiyanti, H. Learners’ Perceptions of Online English Learning during COVID-19 Pandemic. Scope J. Engl. Lang. Teach. 2020, 5, 31–35. [Google Scholar] [CrossRef]
- Almusharraf, N.; Khahro, S. Students Satisfaction with Online Learning Experiences during the COVID-19 Pandemic. Int. J. Emerg. Technol. Learn. IJET 2020, 15, 246–267. [Google Scholar] [CrossRef]
- Bao, W. COVID-19 and Online Teaching in Higher Education: A Case Study of Peking University. Hum. Behav. Emerg. Technol. 2020, 2, 113–115. [Google Scholar] [CrossRef] [PubMed]
- Mahmood, S. Instructional Strategies for Online Teaching in COVID-19 Pandemic. Hum. Behav. Emerg. Technol. 2021, 3, 199–203. [Google Scholar] [CrossRef]
- König, J.; Jäger-Biela, D.; Glutsch, N. Adapting to Online Teaching during COVID-19 School Closure: Teacher Education and Teacher Competence Effects among Early Career Teachers in Germany. Eur. J. Teach. Educ. 2020, 43, 608–622. [Google Scholar] [CrossRef]
- Huang, R.; Tlili, A.; Wang, H.; Shi, Y.; Bonk, C.J.; Yang, J.; Burgos, D. Emergence of the Online-Merge-Offline (OMO) Learning Wave in the Post-COVID-19 Era: A Pilot Study. Sustainability 2021, 13, 3512. [Google Scholar] [CrossRef]
- Younesi, M.; Khan, M.R. English Language Teaching through the Internet at Post COVID-19 Age in India: Views and Attitudes. Int. J. Res. Anal. Rev. 2020, 7, 870–875. [Google Scholar]
- Kaoud, H.; El-Shihy, D.; Yousri, M. Online Learning in Egyptian Universities Post COVID-19 Pandemic: A Student’s Perspective. Int. J. Emerg. Technol. Learn. IJET 2021, 16, 38. [Google Scholar] [CrossRef]
- Peimani, N.; Kamalipour, H. Online Education in the Post COVID-19 Era: Students’ Perception and Learning Experience. Educ. Sci. 2021, 11, 633. [Google Scholar] [CrossRef]
- Camilleri, M.A. Evaluating Service Quality and Performance of Higher Education Institutions: A Systematic Review and a Post-COVID-19 Outlook. Int. J. Qual. Serv. Sci. 2021, 13, 268–281. [Google Scholar] [CrossRef]
- Lin, C.-L.; Jin, Y.Q.; Zhao, Q.; Yu, S.-W.; Su, Y.-S. Factors Influence Students’ Switching Behavior to Online Learning under COVID-19 Pandemic: A Push–Pull–Mooring Model Perspective. Asia-Pac. Edu. Res. 2021, 30, 229–245. [Google Scholar] [CrossRef]
- Busto, S.; Dumbser, M.; Gaburro, E. A Simple but Efficient Concept of Blended Teaching of Mathematics for Engineering Students during the COVID-19 Pandemic. Educ. Sci. 2021, 11, 56. [Google Scholar] [CrossRef]
- MacLeod, K.R.; Swart, W.W.; Paul, R.C. Continual Improvement of Online and Blended Teaching Using Relative Proximity Theory. Decis. Sci. J. Innov. Educ. 2019, 17, 53–75. [Google Scholar] [CrossRef]
- Li, X.; Yang, Y.; Chu, S.K.W.; Zainuddin, Z.; Zhang, Y. Applying Blended Synchronous Teaching and Learning for Flexible Learning in Higher Education: An Action Research Study at a University in Hong Kong. Asia Pac. J. Educ. 2022, 42, 211–227. [Google Scholar] [CrossRef]
- Parasuraman, A.; Zeithaml, V.A.; Berry, L.L. A Conceptual Model of Service Quality and Its Implications for Future Research. J. Mark. 1985, 49, 41–50. [Google Scholar] [CrossRef]
- Parasuraman, A.; Berry, L.L.; Zeithaml, V.A. Perceived Service Quality as a Customer-based Performance Measure: An Empirical Examination of Organizational Barriers Using an Extended Service Quality Model. Hum. Resour. Manag. 1991, 30, 335–364. [Google Scholar] [CrossRef]
- Asubonteng, P.; McCleary, K.J.; Swan, J.E. SERVQUAL Revisited: A Critical Review of Service Quality. J. Serv. Mark. 1996, 10, 62–81. [Google Scholar] [CrossRef]
- Iwaarden, J.V.; Wide, J.; Bell, V.L.; Miller, R. Applying SERVQUAL to Websites: An Exploratory Study. Int. J. Qual. Manag. 2003, 20, 919–935. [Google Scholar]
- Arambewela, R.; Hall, J. A Comparative Analysis of International Education Satisfaction Using Servqual. J. Serv. Res. 2006, 6, 141–163. [Google Scholar]
- Stodnick, M.; Rogers, P. Using SERVQUAL to Measure the Quality of the Classroom Experience. Decis. Sci. J. Innov. Educ. 2008, 6, 115–133. [Google Scholar] [CrossRef]
- Yousapronpaiboon, K. SERVQUAL: Measuring Higher Education Service Quality in Thailand. Procedia-Soc. Behav. Sci. 2014, 116, 1088–1095. [Google Scholar] [CrossRef]
- Aboubakr, R.M.; Bayoumy, H.M.M. Evaluating Educational Service Quality among Dentistry and Nursing Students with the SERVQUAL Model: A Cross-Sectional Study. J. Taibah Univ. Med. Sci. 2022, 17, 648–657. [Google Scholar] [CrossRef]
- Lizarelli, F.L.; Osiro, L.; Ganga, G.M.D.; Mendes, G.H.S.; Paz, G.R. Integration of SERVQUAL, Analytical Kano, and QFD Using Fuzzy Approaches to Support Improvement Decisions in an Entrepreneurial Education Service. Appl. Soft Comput. 2021, 112, 107786. [Google Scholar] [CrossRef]
- Nguyen, P.H. A Fuzzy Analytic Hierarchy Process (FAHP) Based on SERVQUAL for Hotel Service Quality Management: Evidence from Vietnam. J. Asian Financ. Econ. Bus. 2021, 8, 1101–1109. [Google Scholar]
- Stević, Ž.; Tanackov, I.; Puška, A.; Jovanov, G.; Vasiljević, J.; Lojaničić, D. Development of Modified SERVQUAL–MCDM Model for Quality Determination in Reverse Logistics. Sustainability 2021, 13, 5734. [Google Scholar] [CrossRef]
- Abdolvand, M.A.; Taghipouryan, M.J. Evaluation of Customs Service Quality by Using Fuzzy SERVQUAL and Fuzzy MCDM. Am. J. Sci. Res. 2011, 35, 89–103. [Google Scholar]
- Altuntas, S.; Dereli, T.; Yilmaz, M.K. Multi-Criteria Decision Making Methods Based Weighted SERVQUAL Scales to Measure Perceived Service Quality in Hospi-Tals: A Case Study from Turkey. Total Qual. Manag. Bus. Excell. 2012, 23, 1379–1395. [Google Scholar] [CrossRef]
- Liu, C.C.; Chen, J.J. Research on Service Quality Index of UAV Film Production-Dual Perspective. J. Qual. 2021, 28, 231–251. [Google Scholar]
- Afkham, L.; Abdi, F.; Komijan, A. Evaluation of Service Quality by Using Fuzzy MCDM: A Case Study in Iranian Health-Care Centers. Manag. Sci. Lett. 2012, 2, 291–300. [Google Scholar] [CrossRef]
- Saaty, T.L. Decision Making with Dependence and Feedback: The Analytic Network Process; RWS Publications: Pittsburgh, PA, USA, 1996. [Google Scholar]
- Chen, S. A Combined MCDM Model Based on DEMATEL and ANP for the Selection of Airline Service Quality Improvement Criteria: A Research Based on the Taiwan Airline Industry. J. Air. Transp. Manag. 2016, 57, 7–18. [Google Scholar] [CrossRef]
- Tsai, W.C. Applying Service Quality Gap Theory to Establish the Quality Indicators And Evaluate the Service Quality for Chinese Medicine. Yearb. Chin. Med. Pharm. 2005, 23, 241–302. [Google Scholar]
- Wu, C.S.; Lin, C.T.; Lee, C. Optimal Marketing Strategy: A Decision-Making with ANP and TOPSIS. Int. J. Prod. Econ. 2010, 127, 190–196. [Google Scholar] [CrossRef]
- Ashouri, F. Quality Indicators in the Mobile Industry Rankings Based on Indicators of Customer Satisfaction with the Hybrid Approach DEMATEL and ANP Appropriate Strategy Based on Gray System. Orig. Sci. Pap. 2016, 3, 62–72. [Google Scholar] [CrossRef]
- Saaty, T.L. Rank from Comparisons and from Ratings in the Analytic Hierarchy/Network Processes. Eur. J. Oper. Res. 2006, 168, 557–570. [Google Scholar] [CrossRef]
- Azimi, R.; Yazdani-Chamzini, A.; Fouladgar, M.M.; Zavadskas, E.K.; Basiri, M.H. Ranking the Strategies of Mining Sector through ANP and TOPSIS in a SWOT Framework. J. Bus. Econ. Manag. 2011, 12, 670–689. [Google Scholar] [CrossRef]
- Chen, C.C.; Lin, Y.J. The Key Success Factors of Development of New Products with Design Flexibility by Analytic Network Process—A Case Study of A High-Tech Company. Manag. Inf. Comput. 2015, 201503, 150–161. [Google Scholar]
- Zadeh, L. Fuzzy Sets. Inf. Control 1965, 9, 338–353. [Google Scholar] [CrossRef]
- Liu, C.C.; Chen, J.J. Analysis of the Weights of Service Quality Indicators for Drone Filming and Photography by the Fuzzy Analytic Network Process. Appl. Sci. 2019, 9, 1236. [Google Scholar] [CrossRef]
- Vanegas, L.V.; Labib, A.W. A Fuzzy Quality Function Deployment (FQFD) Model for Deriving Optimum Targets. Int. J. Prod. Res. 2001, 39, 99–120. [Google Scholar] [CrossRef]
- Kahraman, C.; Ertay, T.; Büyüközkan, G. A Fuzzy Optimization Model for QFD Planning Process Using Analytic Network Approach. Eur. J. Oper. Res. 2006, 171, 390–411. [Google Scholar] [CrossRef]
- Lupo, T. A Fuzzy Framework to Evaluate Service Quality in the Healthcare Industry: An Empirical Case of Public Hospital Service Evaluation in Sicily. Appl. Soft Comput. 2016, 40, 468–478. [Google Scholar] [CrossRef]
- Chang, S.C.; Tsai, P.H.; Chang, S.C. A Hybrid Fuzzy Model for Selecting and Evaluating the E-Book Business Model: A Case Study on Taiwan e-Book Firms. Appl. Soft Comput. 2015, 34, 194–204. [Google Scholar] [CrossRef]
- Ozdemir, Y.; Basligil, H. Aircraft Selection Using Fuzzy ANP and the Generalized Choquet Integral Method: The Turkish Airlines Case. J. Intell. Fuzzy Syst. 2016, 31, 589–600. [Google Scholar] [CrossRef]
- Parameshwaran, R.; Baskar, C.; Karthik, T. An Integrated Framework for Mechatronics Based Product Development in a Fuzzy Environment. Appl. Soft Comput. 2015, 27, 376–390. [Google Scholar] [CrossRef]
- Lin, C.-L.; Chen, J.-J.; Ma, Y.-Y. Ranking of Service Quality Solution for Blended Design Teaching Using Fuzzy ANP and TOPSIS in the Post-COVID-19 Era. Mathematics 2023, 11, 1255. [Google Scholar] [CrossRef]
- Deng, J.-L. Control Problems of Grey Systems. Syst. Control Lett. 1982, 1, 288–294. [Google Scholar] [CrossRef]
- Deng, J.-L. Introduction to Grey System. J. Grey Syst. 1989, 1, 1–24. [Google Scholar]
- Hinduja, A.; Pandey, M. Comparative Study of MCDM Methods under Different Levels of Uncertainty. Int. J. Inf. Decis. Sci. 2021, 13, 16–41. [Google Scholar] [CrossRef]
- Wang, Q.B.; Peng, A.H. Developing MCDM Approach Based on GRA and TOPSIS. Appl. Mech. Mater. 2010, 34–35, 1931–1935. [Google Scholar] [CrossRef]
- Asjad, M.; Talib, F. Selection of Optimal Machining Parameters Using Integrated MCDM Approaches. Int. J. Adv. Oper. Manag. 2018, 10, 109–129. [Google Scholar] [CrossRef]
- Esangbedo, M.O.; Xue, J.; Bai, S.; Esangbedo, C.O. Relaxed Rank Order Centroid Weighting MCDM Method With Improved Grey Relational Analysis for Subcontractor Selection: Photothermal Power Station Construction. IEEE Trans. Eng. Manag. 2022, 1–18. [Google Scholar] [CrossRef]
- Kabak, M.; Dagdeviren, M. A Hybrid Approach Based on ANP and Grey Relational Analysis for Machine Selection. Teh. Vjesn. -Tech. Gaz. 2017, 24, 109–118. [Google Scholar] [CrossRef]
- Hinduja, A.; Pandey, M. An ANP-GRA-Based Evaluation Model for Security Features of IoT Systems. In Intelligent Communication, Control and Devices; Choudhury, S., Mishra, R., Mishra, R.G., Kumar, A., Eds.; Springer: Singapore, 2020; pp. 243–253. [Google Scholar]
- Hsu, P.-F. Evaluation of Advertising Spokespersons via the ANP-GRA Selection Model. J. Grey Syst. 2009, 21, 35–48. [Google Scholar]
- Hsu, P.-F. Selection Model Based on ANP and GRA for Independent Media Agencies. Qual. Quant. 2012, 46, 1–17. [Google Scholar] [CrossRef]
- Gumus, A.T.; Yayla, A.Y.; Çelik, E.; Yildiz, A. A Combined Fuzzy-AHP and Fuzzy-GRA Methodology for Hydrogen Energy Storage Method Selection in Turkey. Energies 2013, 6, 3017–3032. [Google Scholar] [CrossRef]
- Ayağ, Z.; Yücekaya, A. A Fuzzy ANP-Based GRA Approach to Evaluate ERP Packages. IJEIS 2019, 15, 45–68. [Google Scholar] [CrossRef]
- Ertugrul, I.; Oztas, T.; Ozcil, A.; Oztas, G.Z. Grey Relational Analysis Approach in Academic Performance Comparison of University: A Case Study of Turkish Universities. Eur. Sci. J. ESJ 2016, 12, 128–139. [Google Scholar]
- Zhang, X.; Yang, X.; Yang, J. Teaching Evaluation Algorithm Based on Grey Relational Analysis. Complexity 2021, 2021, e5596518. [Google Scholar] [CrossRef]
- Wan, J.; Lin, C.-L. Research on the Service Quality Index and Alternatives Evaluation and Ranking for Online Yue Kiln Celadon Art Education in Post COVID-19 Era. Mathematics 2023, 11, 1339. [Google Scholar] [CrossRef]
- Han, W.; Han, L.; Bin, C.; Han, W.; Ying, W.B. The Selection Algorithm for Connection Modes of Medium Voltage Power Distribution Network Based on FAHP-GRA. Phys. Procedia 2012, 24, 345–353. [Google Scholar] [CrossRef]
- Altintas, K.; Vayvay, O.; Apak, S.; Cobanoglu, E. An Extended GRA Method Integrated with Fuzzy AHP to Construct a Multidimensional Index for Ranking Overall Energy Sustainability Performances. Sustainability 2020, 12, 1602. [Google Scholar] [CrossRef]
- Tsai, W.C.; Kung, P.T.; Wang, R.H.; Chang, Y.H.; Lee, S.Y. Applying the SERVQUAL Questionnaire to Establish Quality Indicators for Chinese Medicine. Taiwan J. Public Health 2008, 27, 309–319. [Google Scholar]
- Herrera, F.; Herrera-Viedma, E. Linguistic Decision Analysis: Steps for Solving Decision Problems under Linguistic Information. Fuzzy Sets Syst. 2000, 115, 67–82. [Google Scholar] [CrossRef]
- Zimmermann, H. Fuzzy Set Theory—And Its Applications, 2nd ed.; Kluwer Academic: Dordrecht, The Netherlands, 1992. [Google Scholar]
- Zadeh, L. The Concept of a Linguistic Variable and Its Application to Approximate Reasoning-I. Inf. Sci. 1975, 8, 199–249. [Google Scholar] [CrossRef]
- Lee, A.H.I. A Fuzzy Supplier Selection Model with the Consideration of Benefits, Opportunities, Costs and Risks. Expert Syst. Appl. 2009, 36, 2879–2893. [Google Scholar] [CrossRef]
- Lee, A.H.I.; Kang, Y.H.; Hsu, C.F.; Hung, H.C. A Green Supplier Selection Model for High-Tech Industry. Expert Syst. Appl. 2009, 36, 7917–7927. [Google Scholar] [CrossRef]
- Lee, A.H.I.; Kang, H.Y.; Chang, C.T. Fuzzy Multiple Goal Programming Applied to Tft-Lcd Supplier Selection by Downstream Manufacturers. Expert Syst. Appl. 2009, 36, 6318–6325. [Google Scholar] [CrossRef]
- Lee, A.H.I.; Kang, H.Y.; Wang, W.P. Analysis of Priority Mix Planning for the Fabrication of Semiconductors under Uncertainty. Int. J. Adv. Manuf. Technol. 2006, 28, 351–361. [Google Scholar] [CrossRef]
- Chang, C.H. Evaluating Weapon Systems Using Ranking Fuzzy Numbers. Fuzzy Sets Syst. 1999, 107, 25–35. [Google Scholar] [CrossRef]
- Lin, Y.-H. The Algorithm of Fuzzy Linguistic Numbers and Its Comparison of Scoring. J. Natl. Taichung Teach. Coll. 2003, 17, 279–304. [Google Scholar]
- Chen, D.-C. Evaluation and Inspection of Domestic Civil Aviation Safety Performance. Master’s Thesis, National Chiao Tung University, Hsinchu, Taiwan, 2003. [Google Scholar]
- Dehghani, M.; Esmaeilian, M.; Tavakkoli-Moghaddam, R. Employing Fuzzy Anp for Green Supplier Selection and Order Allocations: A Case Study. Int. J. Econ. Manag. Soc. Sci. 2013, 2, 565–575. [Google Scholar]
- Buckley, J.J. Fuzzy Hierarchical Analysis. Fuzzy Sets Syst. 1985, 17, 233–247. [Google Scholar] [CrossRef]
- Pedrycz, W. Why Triangular Membership Functions? Fuzzy Sets Syst. 1994, 64, 21–30. [Google Scholar] [CrossRef]
- Saaty, T.L. The Analytic Hierarchy Process: Planning, Priority Setting, Resources Allocation; McGraw-Hill: New York, NY, USA, 1980. [Google Scholar]
- Babakus, E.; Mangold, W.G. Adapting the SERVQUAL Scale to Hospital Services: An Empirical Investigation. Health Serv. Res. 1992, 22, 767–786. [Google Scholar]
- Parenté, F.J.; Anderson-Parenté, J.K. Delphi Inquiry Systems. Judgmental Forecast. 1987, 129–156. [Google Scholar]
- Zhang, G.; Zou, P.X.W. Fuzzy Analytical Hierarchy Process Risk Assessment Approach for Joint Venture Construction Projects in China. J. Constr. Eng. Manag. 2007, 133, 771–779. [Google Scholar] [CrossRef]
- Hyun, C.; Cho, K.; Koo, K.; Hong, T.; Moon, H. Effect of Delivery Methods on Design Performance in Multifamily Housing Projects. J. Constr. Eng. Manag. 2008, 134, 468–482. [Google Scholar] [CrossRef]
- Lam, K.C.; Lam, M.C.K.; Wang, D. MBNQA–Oriented Self-Assessment Quality Management System for Contractors: Fuzzy AHP Approach. Constr. Manag. Econ. 2008, 26, 447–461. [Google Scholar] [CrossRef]
- Pan, N.F. Fuzzy AHP Approach for Selecting the Suitable Bridge Construction Method. Autom. Constr. 2008, 17, 958–965. [Google Scholar] [CrossRef]
- Dalal, J.; Mohapatra, P.K.; Chandra, M.G. Prioritization of Rural Roads: AHP in Group Decision. Eng. Constr. Archit. Manag. 2010, 17, 135–158. [Google Scholar] [CrossRef]
- Zou, P.X.W.; Li, J. Risk Identification and Assessment in Subway Projects: Case Study of Nanjing Subway Line 2. Constr. Manag. Econ. 2010, 28, 1219–1238. [Google Scholar] [CrossRef]
- Li, J.; Zou, P.X.W. Fuzzy AHP-Based Risk Assessment Methodology for PPP Projects. J. Constr. Eng. Manag. 2011, 137, 1205–1209. [Google Scholar] [CrossRef]
- Pan, W.; Dainty, A.R.J.; Gibb, A.G.F. Establishing and Weighting Decision Criteria for Building System Selection in Housing Construction. J. Constr. Eng. Manag. 2012, 138, 1239–1250. [Google Scholar] [CrossRef]
- Akadiri, P.O.; Olomolaiye, P.O.; Chinyio, E.A. Multi-Criteria Evaluation Model for the Selection of Sustainable Materials for Building Projects. Autom. Constr. 2013, 30, 113–125. [Google Scholar] [CrossRef]
- Chou, J.; Pham, A.; Wang, H. Bidding Strategy to Support Decision-Making by Integrating Fuzzy AHP and Regression-Based Simulation. Autom. Constr. 2013, 35, 517–527. [Google Scholar] [CrossRef]
- Darko, A.; Chan, A.; Ameyaw, E.; Owusu, E.; Pärn, E.; Edwards, D. Review of Application of Analytic Hierarchy Process (AHP) in Construction. Int. J. Constr. Manag. 2018, 19, 436–452. [Google Scholar] [CrossRef]
- Saaty, T.L. Theory and Applications of the Analytic Network Process: Decision Making with Benefits, Opportunities, Costs, and Risks; RWS Publications: Pittsburgh, PA, USA, 2005. [Google Scholar]
- Adamo, J.M. Fuzzy Decision Tree. Fuzzy Sets Syst. 1980, 4, 207–219. [Google Scholar] [CrossRef]
- Kwong, C.K.; Bai, H. A Fuzzy AHP Approach to the Determination of Importance Weights of Customer Requirements in Quality Function Deployment. J. Intell. Manuf. 2002, 13, 367–377. [Google Scholar] [CrossRef]
- Lin, R.; Lin, J.S.-J.; Chang, J.; Tang, D.; Chao, H.; Julian, P.C. Note on Group Consistency in Analytic Hierarchy Process. Eur. J. Oper. Res. 2008, 190, 672–678. [Google Scholar] [CrossRef]
- Saaty, T.L. How to Make a Decision: The Analytic Hierarchy Process. Eur. J. Oper. Res. 1990, 48, 9–26. [Google Scholar] [CrossRef]
- Wu, H.J.; Chen, C.B. An Alternative Form for Grey Relational Grades. J. Grey Syst. 1999, 11, 7–12. [Google Scholar]
- Tseng, M.L.; Lin, Y.H.; Chiu, A.S.F.; Liao, J.C.H. Using FANP Approach on Selection of Competitive Priorities Based on Cleaner Production Implementation: A Case Study in PCB Manufacturer, Taiwan. Clean Technol. Environ. Policy 2008, 10, 17–29. [Google Scholar] [CrossRef]
- Wang, C.-N.; Yang, C.-Y.; Cheng, H.-C. Fuzzy Multi-Criteria Decision-Making Model for Supplier Evaluation and Selection in a Wind Power Plant Project. Mathematics 2019, 7, 417. [Google Scholar] [CrossRef]
- Wang, C.-N.; Su, C.-C.; Nguyen, V.T. Nuclear Power Plant Location Selection in Vietnam under Fuzzy Environment Conditions. Symmetry 2018, 10, 548. [Google Scholar] [CrossRef]
- Matzler, K.; Sauerwein, E. The Factor Structure of Customer Satisfaction: An Empirical Test of the Importance Grid and the Penalty-reward-contrast Analysis. Int. J. Serv. Ind. Manag. 2002, 13, 314–332. [Google Scholar] [CrossRef]
- Kim, W.; Kang, G.; Chul, K.Y. The Determinants of Continuous Usage Intention for One-on-one Online English Education Program. J. Internet Electron. Commer. Res. 2019, 19, 113–126. [Google Scholar] [CrossRef]
- Uppal, M.A.; Ali, S.; Gulliver, S.R. Factors Determining E-Learning Service Quality. Br. J. Educ. Technol. 2018, 49, 412–426. [Google Scholar] [CrossRef]
- Sumi, R.S. Satisfaction of E-Learners with Electronic Learning Service Quality Using the SERVQUAL Model. J. Open Innov. Technol. Mark. Complex. 2021, 7, 227. [Google Scholar] [CrossRef]
- Ma, Y.-Y.; Chen, J.-J.; Lin, C.-L. Research on the Priority of Service Quality Index for Online English Teaching during the COVID-19 Pandemic: Dual Perspective. Mathematics 2022, 10, 3642. [Google Scholar] [CrossRef]
Figure 1.
The research process of this study.
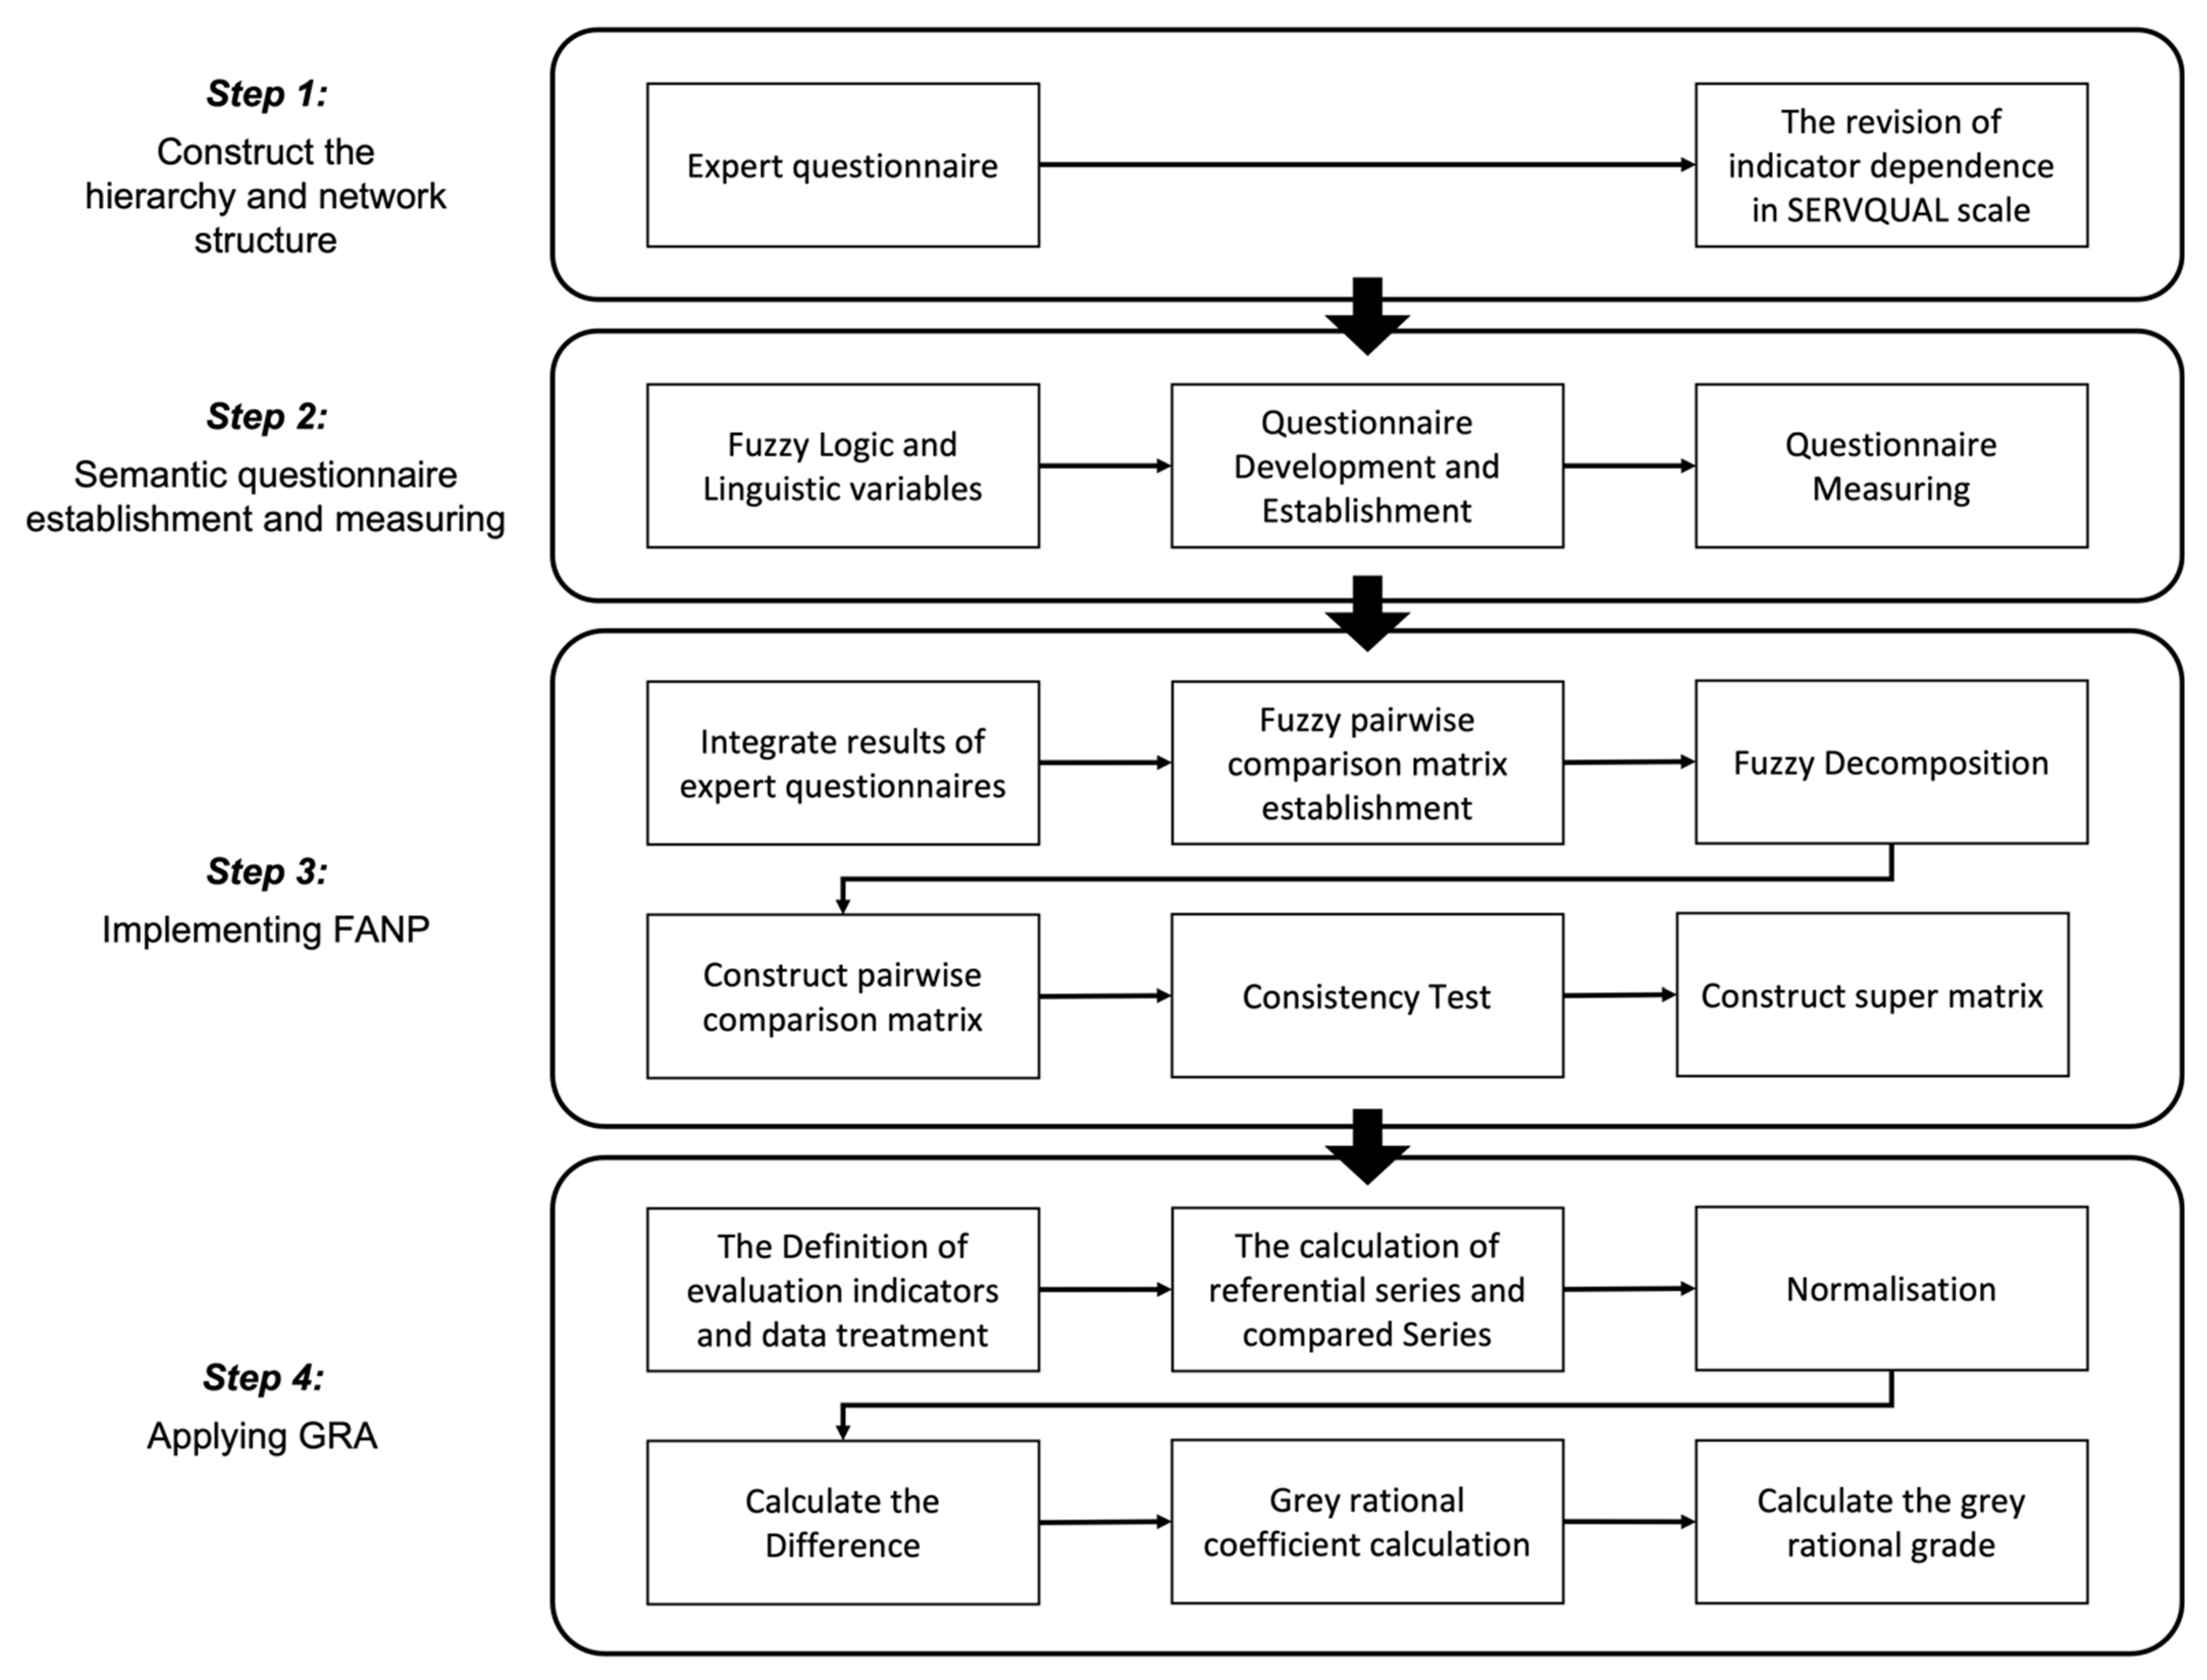
Figure 2.
Fuzzy triangular number.

Figure 3.
The evaluation structure of online English teaching service quality.

Figure 4.
The hierarchy and network structure of this research.

Figure 5.
The overall weight of all indicators in the FANP model.


Table 1.
Five main dimensions of the SERVQUAL scale.
| Dimensions | Description |
|---|---|
| Tangibility | Appearance of physical facilities, personnel, and written materials |
| Reliability | Reliable and correct performance of the promised service capabilities |
| Responsiveness | Willingness to help customers and provide prompt service |
| Assurance | The ability of employees to inspire trust and confidence in customers |
| Empathy | Give customers individualised treatment |
Table 2.
Fuzzy numbers and scales.
| Triangular Fuzzy Number | Linguistic Variables |
|---|---|
| = (1,1,1) | Equally Preferred |
| = (1,2,3) | Intermediate |
| = (2,3,4) | Moderately Preferred |
| = (3,4,5) | Intermediate |
| = (4,5,6) | Strongly Preferred |
| = (5,6,7) | Intermediate |
| = (6,7,8) | Very Strongly Preferred |
| = (7,8,9) | Intermediate |
| = (9,9,9) | Extremely Preferred |
Table 3.
Random indexes (R.I.).
| The Order of Matrix | 1 | 2 | 3 | 4 | 5 | 6 | 7 | 8 | 9 | 10 | 11 | 12 | 13 | 14 | 15 |
|---|---|---|---|---|---|---|---|---|---|---|---|---|---|---|---|
| R.I. | - | - | 0.58 | 0.90 | 1.12 | 1.24 | 1.32 | 1.41 | 1.45 | 1.49 | 1.51 | 1.53 | 1.56 | 1.57 | 1.59 |
Table 4.
The fuzzy pairwise comparison matrix for five dimensions from the FANP model.
| Dimensions | Tangibility (A) | Reliability (B) | Responsiveness (C) | Assurance (D) | Empathy (E) |
|---|---|---|---|---|---|
| Tangibility (A) | (1,1,1) | (3,4,5) | (3,4,5) | (3,4,5) | (1/3,1/2,1) |
| Reliability (B) | (1/5,1/4,1/3) | (1,1,1) | (1/5,1/4,1/3) | (1/3,1/2,1) | (1/5,1/4,1/3) |
| Responsiveness (C) | (1/5,1/4,1/3) | (3,4,5) | (1,1,1) | (2,3,4) | (1/3,1/2,1) |
| Assurance (D) | (1/5,1/4,1/3) | (1,2,3) | (1/4,1/3,1/2) | (1,1,1) | (1/5,1/4,1/3) |
| Empathy (E) | (1,2,3) | (3,4,5) | (1,2,3) | (3,4,5) | (1,1,1) |
Table 5.
The de-fuzzified pairwise comparison matrix for five dimensions from the FANP model.
| Dimensions | Tangibility (A) | Reliability (B) | Responsiveness (C) | Assurance (D) | Empathy (E) |
|---|---|---|---|---|---|
| Tangibility (A) | 1 | 4 | 4 | 4 | 1/2 |
| Reliability (B) | 1/4 | 1 | 1/4 | 1/2 | 1/4 |
| Responsiveness (C) | 1/4 | 4 | 1 | 3 | 1/2 |
| Assurance (D) | 1/4 | 2 | 1/3 | 1 | 1/4 |
| Empathy (E) | 2 | 4 | 2 | 4 | 1 |
Table 6.
The maximum individual value calculation.
| Dimensions | Maximum Individual Value (AM) |
|---|---|
| Tangibility (A) | |
| Reliability (B) | |
| Responsiveness (C) | |
| Assurance (D) | |
| Empathy (E) | |
Table 7.
The calculation of weight for five dimensions.
| Dimensions | The Calculation of Weight (ω) |
|---|---|
| Tangibility (A) | |
| Reliability (B) | |
| Responsiveness (C) | |
| Assurance (D) | |
| Empathy (E) |
Table 8.
Normalized matrix calculation.
| Dimensions | Tangibility (A) | Reliability (B) | Responsiveness (C) | Assurance (D) | Empathy (E) |
|---|---|---|---|---|---|
| Tangibility (A) | 1 × 0.3179 | 4 × 0.0602 | 4 × 0.1724 | 4 × 0.0842 | 1/2 × 0.3652 |
| Reliability (B) | 1/4 × 0.3179 | 1 × 0.0602 | 1/4 × 0.1724 | 1/2 × 0.0842 | 1/4 × 0.3652 |
| Responsiveness (C) | 1/4 × 0.3179 | 4 × 0.0602 | 1 × 0.1724 | 3 × 0.0842 | 1/2 × 0.3652 |
| Assurance (D) | 1/4 × 0.3179 | 2 × 0.0602 | 1/3 × 0.1724 | 1 × 0.0842 | 1/4 × 0.3652 |
| Empathy (E) | 2 × 0.3179 | 4 × 0.0602 | 2 × 0.1724 | 4 × 0.0824 | 1 × 0.3652 |
Table 9.
The calculation of maximum eigenvector and eigenvalue for five dimensions.
| A | B | C | D | E | Total | ω | W1 | |
|---|---|---|---|---|---|---|---|---|
| A | 0.3179 | 0.2410 | 0.6896 | 0.3368 | 0.1826 | 1.7679 | 0.3179 | 1.7679/0.3179 = 5.5604 |
| B | 0.0795 | 0.0602 | 0.0431 | 0.0421 | 0.0913 | 0.3162 | 0.0602 | 0.3162/0.0602 = 5.2495 |
| C | 0.0795 | 0.2410 | 0.1724 | 0.2526 | 0.1826 | 0.928 | 0.1724 | 0.928/0.1724 = 5.383 |
| D | 0.0795 | 0.1205 | 0.0575 | 0.0842 | 0.0913 | 0.4329 | 0.0842 | 0.4329/0.0842 = 5.1421 |
| E | 0.6359 | 0.2410 | 0.3448 | 0.3368 | 0.3652 | 1.9236 | 0.3652 | 1.9236/0.3652 = 5.2671 |
| λmax = 26.6021/5 = 5.3204 | ||||||||
Table 10.
The pairwise comparison matrix of five dimensions from FANP model.
| Dimensions | Tangibility (A) | Reliability (B) | Responsiveness (C) | Assurance (D) | Empathy (E) | Weights |
|---|---|---|---|---|---|---|
| Tangibility (A) | 1 | 1/4 | 1/4 | 1/4 | 2 | 0.0783 |
| Reliability (B) | 4 | 1 | 4 | 2 | 4 | 0.4133 |
| Responsiveness (C) | 4 | 1/4 | 1 | 1/3 | 2 | 0.1444 |
| Assurance (D) | 4 | 1/2 | 3 | 4 | 3 | 0.2957 |
| Empathy (E) | 1/2 | 1/4 | 1/2 | 1/4 | 1 | 0.0682 |
| Total | 1 | |||||
| C.I. = 0.0801, C.R. = 0.0715 | ||||||
Table 11.
C.I. and C.R. values for remaining dimensions and indicators.
| Compare Respect to | Group | Pairwise Comparison | C.I. | C.R. | |
|---|---|---|---|---|---|
| Dimensions | B | A and D, A and E, D and E | 0.0429 | 0.0739 | |
| C | B and E | 0.0000 | 0.0000 | ||
| D | A and B, A and C, A and D, B and C, B and D, C and D | 0.054 | 0.0601 | ||
| Indicators | Goal | A | A1 and A2, A1 and A3, A1 and A4, A2 and A3, A2 and A4, A3 and A4 | 0.0069 | 0.0076 |
| B | B1 and B2, B1 and B3, B1 and B4, B2 and B3, B2 and B4, B3 and B4 | 0.0262 | 0.0292 | ||
| C | C1 and C2, C1 and C3, C2 and C3 | 0.0046 | 0.0079 | ||
| D | D1 and D2, D1 and D3, D2 and D3 | 0.0091 | 0.0158 | ||
| E | E1 and E2, E1 and E3, E1 and E4, E2 and E3, E2 and E4, E3 and E4 | 0.0201 | 0.0224 | ||
| C2 | E | E2 and E3, E2 and E4, E3 and E4 | 0.0368 | 0.0634 | |
| D1 | C | C2 and C3 | 0.0000 | 0.0000 | |
| D2 | C | C2 and C3 | 0.0000 | 0.0000 |
Table 12.
The super matrix of experts’ opinions.
| Dimensions | Tangibility | Reliability | Responsiveness | Assurance | Empathy | ||||||||||||||
|---|---|---|---|---|---|---|---|---|---|---|---|---|---|---|---|---|---|---|---|
| Indicator | A1 | A2 | A3 | A4 | B1 | B2 | B3 | B4 | C1 | C2 | C3 | D1 | D2 | D3 | E1 | E2 | E3 | E4 | |
| Tangibility | A1 | 0.003 | 0.006 | 0.018 | 0.016 | 0.129 | 0.051 | 0.114 | 0.056 | 0.046 | 0.040 | 0.063 | 0.100 | 0.049 | 0.151 | 0.008 | 0.123 | 0.015 | 0.013 |
| A2 | 0.003 | 0.006 | 0.018 | 0.016 | 0.129 | 0.051 | 0.114 | 0.056 | 0.046 | 0.040 | 0.063 | 0.100 | 0.049 | 0.151 | 0.008 | 0.123 | 0.015 | 0.013 | |
| A3 | 0.003 | 0.006 | 0.018 | 0.016 | 0.129 | 0.051 | 0.114 | 0.056 | 0.046 | 0.040 | 0.063 | 0.100 | 0.049 | 0.151 | 0.008 | 0.123 | 0.015 | 0.013 | |
| A4 | 0.003 | 0.006 | 0.018 | 0.016 | 0.129 | 0.051 | 0.114 | 0.056 | 0.046 | 0.040 | 0.063 | 0.100 | 0.049 | 0.151 | 0.008 | 0.123 | 0.015 | 0.013 | |
| Reliability | B1 | 0.003 | 0.006 | 0.018 | 0.016 | 0.129 | 0.051 | 0.114 | 0.056 | 0.046 | 0.040 | 0.063 | 0.100 | 0.049 | 0.151 | 0.008 | 0.123 | 0.015 | 0.013 |
| B2 | 0.003 | 0.006 | 0.018 | 0.016 | 0.129 | 0.051 | 0.114 | 0.056 | 0.046 | 0.040 | 0.063 | 0.100 | 0.049 | 0.151 | 0.008 | 0.123 | 0.015 | 0.013 | |
| B3 | 0.003 | 0.006 | 0.018 | 0.016 | 0.129 | 0.051 | 0.114 | 0.056 | 0.046 | 0.040 | 0.063 | 0.100 | 0.049 | 0.151 | 0.008 | 0.123 | 0.015 | 0.013 | |
| B4 | 0.003 | 0.006 | 0.018 | 0.016 | 0.129 | 0.051 | 0.114 | 0.056 | 0.046 | 0.040 | 0.063 | 0.100 | 0.049 | 0.151 | 0.008 | 0.123 | 0.015 | 0.013 | |
| Responsiveness | C1 | 0.003 | 0.006 | 0.018 | 0.016 | 0.129 | 0.051 | 0.114 | 0.056 | 0.046 | 0.040 | 0.063 | 0.100 | 0.049 | 0.151 | 0.008 | 0.123 | 0.015 | 0.013 |
| C2 | 0.003 | 0.006 | 0.018 | 0.016 | 0.129 | 0.051 | 0.114 | 0.056 | 0.046 | 0.040 | 0.063 | 0.100 | 0.049 | 0.151 | 0.008 | 0.123 | 0.015 | 0.013 | |
| C3 | 0.003 | 0.006 | 0.018 | 0.016 | 0.129 | 0.051 | 0.114 | 0.056 | 0.046 | 0.040 | 0.063 | 0.100 | 0.049 | 0.151 | 0.008 | 0.123 | 0.015 | 0.013 | |
| Assurance | D1 | 0.003 | 0.006 | 0.018 | 0.016 | 0.129 | 0.051 | 0.114 | 0.056 | 0.046 | 0.040 | 0.063 | 0.100 | 0.049 | 0.151 | 0.008 | 0.123 | 0.015 | 0.013 |
| D2 | 0.003 | 0.006 | 0.018 | 0.016 | 0.129 | 0.051 | 0.114 | 0.056 | 0.046 | 0.040 | 0.063 | 0.100 | 0.049 | 0.151 | 0.008 | 0.123 | 0.015 | 0.013 | |
| D3 | 0.003 | 0.006 | 0.018 | 0.016 | 0.129 | 0.051 | 0.114 | 0.056 | 0.046 | 0.040 | 0.063 | 0.100 | 0.049 | 0.151 | 0.008 | 0.123 | 0.015 | 0.013 | |
| Empathy | E1 | 0.003 | 0.006 | 0.018 | 0.016 | 0.129 | 0.051 | 0.114 | 0.056 | 0.046 | 0.040 | 0.063 | 0.100 | 0.049 | 0.151 | 0.008 | 0.123 | 0.015 | 0.013 |
| E2 | 0.003 | 0.006 | 0.018 | 0.016 | 0.129 | 0.051 | 0.114 | 0.056 | 0.046 | 0.040 | 0.063 | 0.100 | 0.049 | 0.151 | 0.008 | 0.123 | 0.015 | 0.013 | |
| E3 | 0.003 | 0.006 | 0.018 | 0.016 | 0.129 | 0.051 | 0.114 | 0.056 | 0.046 | 0.040 | 0.063 | 0.100 | 0.049 | 0.151 | 0.008 | 0.123 | 0.015 | 0.013 | |
| E4 | 0.003 | 0.006 | 0.018 | 0.016 | 0.129 | 0.051 | 0.114 | 0.056 | 0.046 | 0.040 | 0.063 | 0.100 | 0.049 | 0.151 | 0.008 | 0.123 | 0.015 | 0.013 | |
Table 13.
Referential series and compared series.
| Indicators | Referential Series (x0) | Compared Series (xi) | ||||
|---|---|---|---|---|---|---|
| Alt 1 | Alt 2 | Alt 3 | Alt 4 | Alt 5 | ||
| A1 | 6.20 | 1.00 | 1.41 | 6.20 | 4.86 | 4.45 |
| A2 | 6.20 | 1.23 | 1.41 | 6.20 | 4.77 | 3.52 |
| A3 | 6.57 | 1.23 | 6.57 | 6.20 | 4.77 | 3.52 |
| A4 | 7.12 | 1.23 | 7.12 | 6.20 | 4.86 | 3.52 |
| B1 | 7.12 | 1.23 | 7.12 | 3.87 | 4.77 | 4.45 |
| B2 | 7.12 | 1.00 | 7.12 | 4.70 | 4.77 | 4.45 |
| B3 | 6.06 | 1.32 | 6.06 | 3.87 | 3.90 | 3.52 |
| B4 | 7.35 | 1.32 | 7.35 | 3.87 | 4.45 | 2.08 |
| C1 | 6.06 | 1.74 | 6.06 | 3.87 | 3.52 | 2.88 |
| C2 | 7.23 | 1.41 | 7.23 | 4.70 | 3.52 | 2.08 |
| C3 | 7.12 | 1.52 | 7.12 | 4.79 | 3.52 | 2.08 |
| D1 | 6.12 | 1.41 | 6.12 | 4.79 | 4.45 | 2.08 |
| D2 | 6.84 | 1.52 | 6.84 | 4.79 | 3.52 | 2.88 |
| D3 | 7.12 | 1.74 | 7.12 | 4.70 | 4.45 | 2.08 |
| E1 | 6.10 | 1.52 | 6.10 | 4.70 | 3.52 | 2.88 |
| E2 | 6.10 | 1.41 | 6.10 | 4.70 | 3.52 | 2.17 |
| E3 | 6.20 | 1.41 | 6.20 | 4.70 | 3.52 | 2.17 |
| E4 | 6.20 | 1.41 | 6.20 | 4.77 | 3.52 | 2.17 |
Table 14.
Normalized data.
| Indicators | Alt 1 | Alt 2 | Alt 3 | Alt 4 | Alt 5 |
|---|---|---|---|---|---|
| A1 | 0.0000 | 0.0788 | 1.0000 | 0.7423 | 0.6635 |
| A2 | 0.0000 | 0.0362 | 1.0000 | 0.7123 | 0.4608 |
| A3 | 0.0000 | 1.0000 | 0.9307 | 0.6629 | 0.4288 |
| A4 | 0.0000 | 1.0000 | 0.8438 | 0.6163 | 0.3888 |
| B1 | 0.0000 | 1.0000 | 0.4482 | 0.6010 | 0.5467 |
| B2 | 0.0000 | 1.0000 | 0.6046 | 0.6160 | 0.5637 |
| B3 | 0.0000 | 1.0000 | 0.5380 | 0.5443 | 0.4641 |
| B4 | 0.0000 | 1.0000 | 0.4229 | 0.5191 | 0.1260 |
| C1 | 0.0000 | 1.0000 | 0.4931 | 0.4120 | 0.2639 |
| C2 | 0.0000 | 1.0000 | 0.5653 | 0.3625 | 0.1151 |
| C3 | 0.0000 | 1.0000 | 0.5839 | 0.3571 | 0.1000 |
| D1 | 0.0000 | 1.0000 | 0.7176 | 0.6454 | 0.1423 |
| D2 | 0.0000 | 1.0000 | 0.6147 | 0.3759 | 0.2556 |
| D3 | 0.0000 | 1.0000 | 0.5502 | 0.5037 | 0.0632 |
| E1 | 0.0000 | 1.0000 | 0.6943 | 0.4367 | 0.2969 |
| E2 | 0.0000 | 1.0000 | 0.7015 | 0.4499 | 0.1620 |
| E3 | 0.0000 | 1.0000 | 0.6868 | 0.4405 | 0.1587 |
| E4 | 0.0000 | 1.0000 | 0.7015 | 0.4405 | 0.1587 |
Table 15.
Deviation sequences.
| Indicators | Alt 1 | Alt 2 | Alt 3 | Alt 4 | Alt 5 |
|---|---|---|---|---|---|
| A1 | 1.0000 | 0.9212 | 0.0000 | 0.2577 | 0.3365 |
| A2 | 1.0000 | 0.9638 | 0.0000 | 0.2877 | 0.5392 |
| A3 | 1.0000 | 0.0000 | 0.0693 | 0.3371 | 0.5712 |
| A4 | 1.0000 | 0.0000 | 0.1562 | 0.3837 | 0.6112 |
| B1 | 1.0000 | 0.0000 | 0.5518 | 0.3990 | 0.4533 |
| B2 | 1.0000 | 0.0000 | 0.3954 | 0.3840 | 0.4363 |
| B3 | 1.0000 | 0.0000 | 0.4620 | 0.4557 | 0.5359 |
| B4 | 1.0000 | 0.0000 | 0.5771 | 0.4809 | 0.8740 |
| C1 | 1.0000 | 0.0000 | 0.5069 | 0.5880 | 0.7361 |
| C2 | 1.0000 | 0.0000 | 0.4347 | 0.6375 | 0.8849 |
| C3 | 1.0000 | 0.0000 | 0.4161 | 0.6429 | 0.9000 |
| D1 | 1.0000 | 0.0000 | 0.2824 | 0.3546 | 0.8577 |
| D2 | 1.0000 | 0.0000 | 0.3853 | 0.6241 | 0.7444 |
| D3 | 1.0000 | 0.0000 | 0.4498 | 0.4963 | 0.9368 |
| E1 | 1.0000 | 0.0000 | 0.3057 | 0.5633 | 0.7031 |
| E2 | 1.0000 | 0.0000 | 0.2985 | 0.5501 | 0.8380 |
| E3 | 1.0000 | 0.0000 | 0.3132 | 0.5595 | 0.8413 |
| E4 | 1.0000 | 0.0000 | 0.2985 | 0.5595 | 0.8413 |
Table 16.
Gray rational coefficient.
| Indicators | Alt 1 | Alt 2 | Alt 3 | Alt 4 | Alt 5 |
|---|---|---|---|---|---|
| A1 | 0.3333 | 0.3518 | 1.0000 | 0.6599 | 0.5977 |
| A2 | 0.3333 | 0.3416 | 1.0000 | 0.6347 | 0.4811 |
| A3 | 0.3333 | 1.0000 | 0.8783 | 0.5973 | 0.4668 |
| A4 | 0.3333 | 1.0000 | 0.7620 | 0.5658 | 0.4500 |
| B1 | 0.3333 | 1.0000 | 0.4754 | 0.5562 | 0.5245 |
| B2 | 0.3333 | 1.0000 | 0.5584 | 0.5656 | 0.5340 |
| B3 | 0.3333 | 1.0000 | 0.5197 | 0.5232 | 0.4827 |
| B4 | 0.3333 | 1.0000 | 0.4642 | 0.5097 | 0.3639 |
| C1 | 0.3333 | 1.0000 | 0.4966 | 0.4596 | 0.4045 |
| C2 | 0.3333 | 1.0000 | 0.5349 | 0.4396 | 0.3610 |
| C3 | 0.3333 | 1.0000 | 0.5458 | 0.4375 | 0.3571 |
| D1 | 0.3333 | 1.0000 | 0.6391 | 0.5851 | 0.3683 |
| D2 | 0.3333 | 1.0000 | 0.5648 | 0.4448 | 0.4018 |
| D3 | 0.3333 | 1.0000 | 0.5264 | 0.5019 | 0.3480 |
| E1 | 0.3333 | 1.0000 | 0.6206 | 0.4702 | 0.4156 |
| E2 | 0.3333 | 1.0000 | 0.6262 | 0.4761 | 0.3737 |
| E3 | 0.3333 | 1.0000 | 0.6149 | 0.4719 | 0.3728 |
| E4 | 0.3333 | 1.0000 | 0.6261 | 0.4719 | 0.3728 |
Table 17.
The overall weight of all dimensions in the FANP model.
| Dimensions | Description | Overall Weight | Rank |
|---|---|---|---|
| Tangibility | Appearance of physical facilities, personnel and written materials | 0.082 | 4 |
| Reliability | Reliable and correct performance of the promised service capabilities | 0.402 | 1 |
| Responsiveness | Willingness to help customers and provide prompt service | 0.139 | 3 |
| Assurance | The ability of employees to inspire trust and confidence in customers | 0.303 | 2 |
| Empathy | Give customers individualised treatment | 0.074 | 5 |
Table 18.
Gray rational grade.
| Alternatives | Description | Grey Rational Grade (Γ0i) | Rank |
|---|---|---|---|
| Alt 1 | Appealing facility | 0.3 | 5 |
| Alt 2 | Personnel quality and stability | 0.8347 | 1 |
| Alt 3 | Response speed to customer need | 0.5727 | 2 |
| Alt 4 | Safe transaction environment | 0.4686 | 3 |
| Alt 5 | Personalised needs of customers | 0.3838 | 4 |
Disclaimer/Publisher’s Note: The statements, opinions and data contained in all publications are solely those of the individual author(s) and contributor(s) and not of MDPI and/or the editor(s). MDPI and/or the editor(s) disclaim responsibility for any injury to people or property resulting from any ideas, methods, instructions or products referred to in the content. |
© 2023 by the authors. Licensee MDPI, Basel, Switzerland. This article is an open access article distributed under the terms and conditions of the Creative Commons Attribution (CC BY) license (https://creativecommons.org/licenses/by/4.0/).
Share and Cite
MDPI and ACS Style
Ma, Y.-Y.; Lin, C.-L.; Lin, H.-L. Ranking of Service Quality Index and Solutions for Online English Teaching in the Post-COVID-19 Crisis. Mathematics 2023, 11, 4001. https://doi.org/10.3390/math11184001
AMA Style
Ma Y-Y, Lin C-L, Lin H-L. Ranking of Service Quality Index and Solutions for Online English Teaching in the Post-COVID-19 Crisis. Mathematics. 2023; 11(18):4001. https://doi.org/10.3390/math11184001
Chicago/Turabian StyleMa, Yu-Yu, Chia-Liang Lin, and Hung-Lung Lin. 2023. "Ranking of Service Quality Index and Solutions for Online English Teaching in the Post-COVID-19 Crisis" Mathematics 11, no. 18: 4001. https://doi.org/10.3390/math11184001
Note that from the first issue of 2016, this journal uses article numbers instead of page numbers. See further details here.