1. Introduction
EMG signals, which are electrical impulses produced by muscle activities, hold significant value across various fields due to their broad scope of application [
1,
2,
3]. Their pivotal role within the healthcare arena is particularly noteworthy. Interpreted as a distinctive bio-electrical language employed by muscles, EMG signals equip medical professionals with a powerful tool to assess muscular function, identify anomalies, and diagnose pathologies pertaining to the nervous system [
4,
5]. Rigorous analysis of these signals yields a comprehensive depiction of the interrelated health of the muscular and neurological systems. This affords clinicians the ability to navigate toward optimal treatment modalities and interventions for a myriad of neuromuscular disorders [
6].
While the foundational understanding of EMG signals is well-established, there are still gaps in effectively leveraging this knowledge, especially in the realm of myoelectric control. Current approaches often falter in real-time applications, especially when signal noise and environmental factors come into play. Our research, therefore, aims to address these challenges, shedding light on the intricate problem of myoelectric control and its applications.
Beyond medicine, EMG signals have found practical applications in prosthetics and assistive technologies. By capturing and interpreting EMG signals, researchers and engineers have developed advanced prosthetic limbs that can be controlled by the user’s muscle contractions, restoring mobility and independence to individuals with limb loss [
7,
8,
9]. This technology has revolutionized the lives of many, offering precise and intuitive control over prosthetic devices [
10,
11]. Moreover, EMG signals play a crucial role in sports science and rehabilitation. By monitoring muscle activation patterns through EMG recordings, researchers and therapists can analyze movement patterns, design tailored rehabilitation programs, optimize training regimes, and prevent injuries [
12]. EMG-based biofeedback systems provide real-time information, allowing individuals to adjust their movements and enhance their performance [
13]. Overall, EMG signals have proven to be a valuable tool in understanding muscle function, diagnosing disorders, improving prosthetic technology, and optimizing rehabilitation and sports performance.
The classification of EMG signals holds paramount importance due to its wide-ranging applications and implications across various fields. Accurate and reliable classification of EMG signals enables the precise assessment and understanding of muscle activity, aiding in the diagnosis and monitoring of neuromuscular disorders [
14,
15,
16]. This classification is instrumental in the development of assistive technologies, such as prosthetics, allowing for the intuitive control and restoration of mobility for individuals with limb loss. Additionally, EMG signal classification plays a vital role in rehabilitation and physical therapy, facilitating personalized treatment plans based on each patient’s unique muscular responses [
17]. It also contributes to sports science and biomechanics by analyzing muscle activation patterns, enhancing athletic performance, and preventing injuries [
18,
19].
Neural networks offer significant benefits for the classification of time series signals [
20,
21,
22]. The inherent ability of neural networks to learn complex patterns and relationships within data makes them well-suited for capturing the temporal dependencies present in time series signals. Long Short-Term Memory (LSTM), a specialized type of neural network, excels in modeling sequential data by effectively retaining and utilizing historical context through their memory cells [
23,
24]. This makes them particularly effective in handling long-term dependencies and capturing temporal dynamics. In the context of signal classification, neural networks and LSTMs can extract meaningful features from time series signals, automatically learn discriminative patterns, and make accurate predictions. Their ability to handle large amounts of data and adapt to different signal characteristics makes them invaluable for tasks such as speech recognition, gesture recognition, medical signal analysis, and financial market forecasting [
25,
26].
Many approaches have been proposed for EMG signal classification, and varying levels of accuracy have been obtained [
27]. To name a few, in [
28], an accuracy range of 75–84% is reported. Similarly, in [
29], an accuracy of 77.85% is documented. For a comprehensive analysis, readers are referred to [
30]. However, when comparing these results, it is essential to note that different datasets were used, and they possess varying levels of accuracy.
In [
31], the authors designed an HMI integrating EEG and sEMG signals for controlling lower extremity exoskeletons. Through a deep analysis of human walking, they achieved a high level of accuracy. However, this being a preliminary study, broader validation is needed. The simultaneous need for both EEG and sEMG signals might also pose challenges in practical applications. In [
32], a novel method was proposed that combines multiple signals from the lower extremity. By simulating human learning processes, they managed to reconstruct these signals to estimate joint angles. Their approach has outperformed other techniques in terms of the error rate. However, the limited number of participants (eight) could raise concerns about the generalizability of the results, and the complexity of multiple signal streams might challenge real-world applications. In [
33], the potential of transient sEMG signals for myoelectric control was investigated with both intact-limb subjects and transhumeral amputees. The 100 ms window length has emerged as optimal for classification. By focusing on transhumeral amputees, the study addressed a significant yet niche group. However, its niche focus could limit its broader applicability. In essence, these studies have highlighted the advancements and challenges in human–machine interfaces tailored for exoskeletons and assistive devices.
Given its wide-ranging implications and applications, there is still a pressing need to develop state-of-the-art classification techniques for accurately classifying EMG signals [
34,
35]. Accurate classification enables healthcare professionals to precisely diagnose and monitor neuromuscular disorders, allowing for timely intervention and tailored treatment plans. It facilitates the development of advanced prosthetics and assistive technologies that can be controlled intuitively by EMG signals, enhancing mobility and independence for individuals with limb loss. Furthermore, state-of-the-art classification techniques contribute to the optimization of rehabilitation programs by accurately assessing muscle activation patterns and designing personalized treatment strategies. Consequently, the development of state-of-the-art classification techniques for EMG signals empowers healthcare, rehabilitation, and assistive technology fields, leading to improved patient outcomes, enhanced quality of life, and advancements in human performance.
We propose an ensemble classification method for EMG signals, which offers several significant contributions. Firstly, our approach introduces a novel ensemble architecture specifically tailored for time series classification. This architecture combines projected LSTM models, harnessing their complementary strengths to enhance classification accuracy. Secondly, our method demonstrates efficiency by achieving fast processing speeds, enabling real-time or near-real-time applications. Thirdly, the ensemble model effectively addresses the challenge of overfitting by leveraging the diversity among individual models, resulting in improved robustness and generalization. Additionally, our proposed method exhibits resilience against noise, making it suitable for real-world EMG signal classification scenarios. Overall, the contributions of this study encompass enhanced accuracy, speed, noise robustness, and prevention of overfitting through the novel ensemble architecture for EMG signal classification.
The structure of the remainder of this study unfolds as follows:
Section 2 provides an overview of RNN, delves into LSTM neural networks, and explores the advantages of Attention LSTM (ALSTM). Following this, in
Section 3, we introduce and elaborate on our proposed ensemble technique.
Section 4 details the handling of EMG time-series data and the preprocessing stages required for classification. In
Section 5, we apply our proposed ensemble ALSTM and compare its performance with the conventional LSTM. In
Section 6, we provide an in-depth analysis of the results obtained. Finally,
Section 7 furnishes concluding remarks and future research recommendations.
2. RNN for Classification
RNN serves as a powerful tool for classification tasks due to its unique ability to process sequential data, making it particularly effective in situations where the temporal dynamics of the input carry crucial information [
36,
37]. RNNs, with their inherent ability to process and remember sequential data, are particularly beneficial for time series classifications. As a result, RNNs have been increasingly adopted for EMG signal classification to capture the temporal dynamics of muscle activations [
38,
39]. Unlike traditional feedforward networks, RNNs are designed with feedback connections that allow information to cycle through the network over time, providing the capacity for memory of past inputs [
40,
41]. This characteristic allows RNNs to exploit temporal dependencies, making them adept at tasks such as speech recognition, sentiment analysis, and time-series prediction. By training an RNN on the appropriate labeled data, we can classify new unseen sequences based on learned patterns, demonstrating its utility in diverse classification contexts.
2.1. LSTM
LSTM is a type of RNN architecture that has gained significant popularity in the field of time series classification. Unlike traditional RNNs, LSTM networks are designed to effectively capture long-term dependencies and temporal dynamics in sequential data [
42]. This is achieved through the use of memory cells, which can retain and update information over extended sequences. The gating mechanisms within LSTM allow for the selective retention and utilization of relevant contextual information, making it highly suitable for modeling complex patterns in time series data.
LSTM networks offer several advantages for time series classification tasks [
43]. Firstly, they can handle long-term dependencies, which is crucial for accurately capturing temporal patterns that may span across extended periods. This makes LSTM particularly effective in scenarios where the context and history of the data play a significant role. Secondly, LSTM networks are capable of learning and retaining information over time, allowing them to effectively model and adapt to changing patterns in the time series data. This adaptability is essential in dynamic environments where the characteristics of the data may vary. Lastly, LSTM networks are able to automatically extract relevant features from the input time series, alleviating the need for manual feature engineering and reducing the risk of missing important information.
The application of LSTM networks in the classification of EMG signals brings several advantages. LSTM’s ability to capture temporal dependencies makes it well-suited for this task. LSTM networks can effectively model the complex dynamics of muscle contractions and relaxations, enabling accurate classification of EMG signals. The adaptability of LSTM allows it to handle variations in signal characteristics and capture subtle changes in muscle activation patterns over time. This makes LSTM a valuable tool for diagnosing neuromuscular disorders, designing prosthetics, and optimizing rehabilitation programs in the field of EMG signal analysis.
Figure 1 shows an LSTM cell. As depicted in this figure, an incoming series of data points represented as
is fed into the network. This then results in a hidden sequence denoted by
. This transformation occurs as each network activation unit processes the sequence in an iterative manner over time, adhering to the following equations:
In this context, refers to the present time step’s hidden state output. Also, the forget, input, and output gates are represented by , and , correspondingly. The candidate cell vector is illustrated by , while symbolizes the cell activation vector. The weight matrices and bias vector are designated by the and terms, respectively. The symbol is used to signify the Hadamard product. The activation functions for sigmoid and hyperbolic tangent are expressed through the use of and tanh, respectively.
As shown in the abovementioned formulations and
Figure 1, within the architecture of an LSTM cell, there exist multiple gates, and each is necessitated to employ a specific activation function. The Sigmoid (or Logistic) function is one such function, proffering outputs that range between 0 and 1. It is predominantly utilized for the forget, input, and output gates within an LSTM cell, facilitating meticulous control over the dissemination of information. Another prevalent activation function is the Hyperbolic Tangent (tanh) function, producing outputs that span between −1 and 1. Within the context of LSTMs, the tanh function is commonly employed for the input modulation gate, governing the potential values that may be incorporated into the cell state. A less conventional function used in certain neural network paradigms, though less so in LSTMs, is the Rectified Linear Unit (ReLU). This function relays the input directly if it is positive, and otherwise, it yields zero. Its computational expediency is noteworthy. Additionally, there is the Leaky ReLU, a derivative of the ReLU, which permits a minimal gradient even in the absence of unit activation, thereby facilitating the preservation of gradient flow during the backpropagation process (see reference [
44] for detailed information on the activations functions for LSTM).
In our study, we have elected to utilize the tanh function as our primary activation function, attributing to its superior properties. The tanh function’s zero-centered output can expedite convergence, and its adeptness in processing negative values is of significance. Its inherent squashing mechanism, which maps values between −1 and 1, is instrumental in curtailing the challenges posed by the exploding gradient phenomenon. Furthermore, the uninterrupted gradient of the tanh function ensures that the LSTM modules sustain their learning trajectory across elongated sequences, thereby adeptly capturing long-term dependencies.
2.2. ALSTM
ALSTM is a potent combination of two crucial concepts in the realm of deep learning and natural language processing. The addition of the attention mechanism allows the model to dynamically focus on different parts of the input sequence for making predictions, essentially learning what to “pay attention to” based on the task at hand [
45,
46]. This imbues the model with the ability to create context-sensitive representations, providing significant improvements in performance across many tasks, including machine translation, speech recognition, and time series analyses.
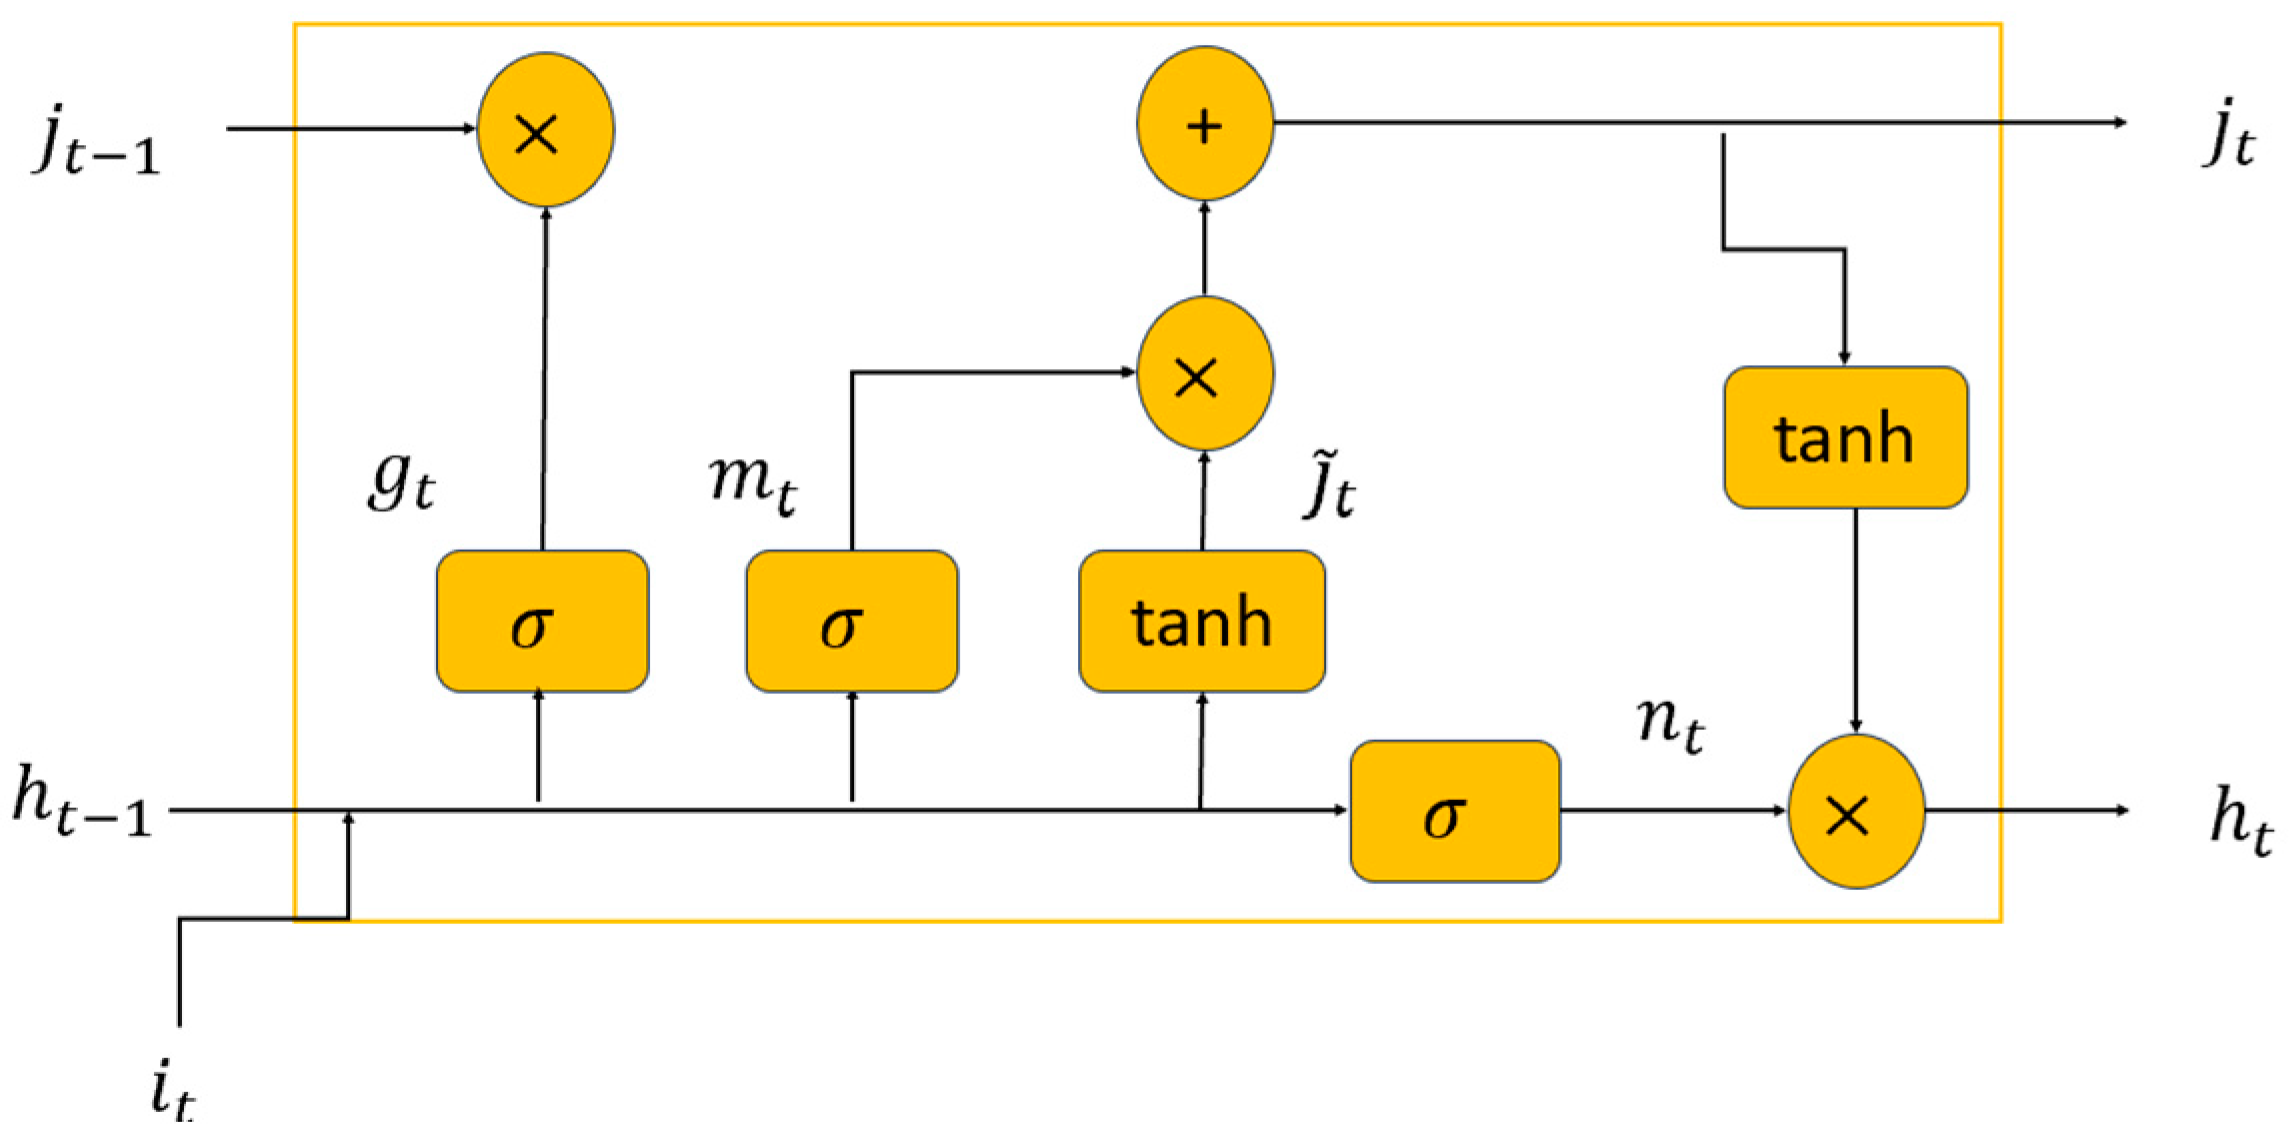
As portrayed in
Figure 2, the ALSTM cell generates two distinct outputs: the cell state
, which serves as the repository for long-term memory, and the hidden state
, that handles short-term memory storage. In this study, we incorporated a projected layer following the output gate
to shrink the size of the hidden state output. Suppose ‘p’ and ‘m’ represent the projected and hidden sizes of the ALSTM, respectively. The output size of the hidden state is then represented as
in the space of
, and the cell state is expressed as
in the space of
. At each time step
, the ALSTM cell accepts a vector corresponding to an input feature. The hidden and cell states from the prior time step (
t − 1) are used as additional inputs. In this proposed architecture, the key components, which are the four gates—the forget gate
, the input gate
, the candidate cell gate
, and the output gate
, operate in a manner identical to the traditional LSTM.
In addition to the input gate,
governs the information flow into the memory cell, while the forget gate
determines how this information is updated within the memory cell. The output gate
then controls the information that will be carried forward to the next time step. The output information from the input gate
and the candidate cell gate
often lack the necessary focus, which could result in missing out on key information related to the cell gate memory
. To overcome this, we introduce an attention gate designed to hold onto important information for the cell gate memory. This gate aims to discover the correlation between the previous hidden state output
and the Hadamard product of the input gate
and candidate cell gate
. The mathematical representation of the proposed attention gate is given below:
In Equations (7) and (8),
, and
represent trainable parameters, with
acting as the attention-scoring function. The transformation formulas defined for the proposed ALSTM model are provided below:
As per the given formulas, the input gate dictates the nature of the information that will enter the cell state. The attention gate is utilized to process the transformations in Equations (7) and (8). This approach significantly enhances the predictive capabilities of the traditional LSTM, and it achieves high accuracy when handling complex datasets characterized by noise and a broader spectrum of operational conditions.
3. Ensemble Architecture and Proposed Ensemble Technique
In this section, we first delve into the concept of ensemble neural networks. Subsequently, we introduce our proposed ensemble architecture. Lastly, we highlight the advantages of this ensemble approach, particularly for EMG signal classification.
3.1. Ensemble Architecture for Classification
An ensemble method in machine learning involves the combination of several models to solve a single prediction problem [
47]. It operates by constructing a set of classifiers and then classifying new data points by taking a (weighted) vote on their predictions. The underlying principle behind ensemble methods is that different algorithms may have varied misclassification rates in different regions of the input space. By strategically combining these models, we aim to produce a more robust model with better generalization performance.
3.2. Proposed Ensemble Technique
Ensemble architecture, involving the orchestration of multiple neural networks, is pivotal in enhancing the effectiveness of classification systems, with its application playing a paramount role in a diverse range of classification tasks. This architecture amalgamates predictions from numerous individual models—commonly known as base learners or weak classifiers—which are trained independently. The final classification verdict results from this collective decision-making process.
In the method we propose, the outputs of individual classifiers undergo one-hot encoding, are subsequently integrated with the raw time-series signal, and are finally utilized in the ultimate classifier, which is the LSTM with an attention mechanism.
Figure 3 visually presents the structure of the proposed classifier for EMG signal classification. The core philosophy behind our ensemble architecture is that the innate diversity among the individual models contributes to a substantial improvement in the system’s accuracy, robustness, and generalization.
It should be highlighted that within our established framework, we have incorporated four individual classifiers. Although the architecture permits the integration of a greater number of classifiers, it is imperative to weigh the computational implications against the potential enhancements in classification accuracy when considering such augmentations.
3.3. Benefits of the Proposed Approach for EMG Classification
The application of the proposed ensemble architecture in time series classification, specifically in EMG signal analysis, brings specific advantages. EMG signals are time-varying and complex, representing muscle activation patterns. Ensemble architecture helps address the challenges associated with the inherent variability and noise in EMG signals. By combining the predictions of multiple models, the ensemble model can capture a broader range of patterns and better adapt to the diverse characteristics of EMG signals. This enhances the accuracy of EMG signal classification, aiding in the diagnosis of neuromuscular disorders, optimizing prosthetic control, and improving rehabilitation outcomes. Moreover, ensemble architecture provides robustness against noisy EMG signals, enabling reliable analysis and reducing the impact of signal artifacts on the classification results.
Here we list the key advantages that emerge from using an ensemble approach for EMG signal classification:
(1) Diversity of Model Predictions: EMG signals are complex time-series data that can vary greatly across different muscles, individuals, and activities. No single model might be optimal for all scenarios. An ensemble approach allows us to harness the strengths of diverse models, ensuring a more comprehensive understanding of the signals.
(2) Robustness to Noise: EMG signals are notoriously noisy. An ensemble, by virtue of aggregating predictions, can provide a form of noise regularization, potentially filtering out erroneous predictions from individual models.
(3) Mitigation of Overfitting: Single models, especially deep learning architectures like LSTMs, might sometimes overfit to the training data. Ensemble methods, by averaging out the outputs of various models, can mitigate the risk of overfitting, ensuring that the classifier performs well on unseen data.
(4) Better Handling of Nonlinearities: EMG signals can display nonlinear behaviors, especially when considering dynamic muscle activities. An ensemble architecture, combining the predictions of multiple models, can better capture these nonlinear patterns, improving the classification accuracy.
(5) Increased Confidence in Predictions: With multiple models “agreeing” on a classification, there is higher confidence in the decision made by the ensemble. This can be particularly beneficial in applications where the cost of misclassification is high.
4. Data and Preprocessing
The dataset used in this study is identical to the dataset utilized in [
48]. It consists of data collected from a cohort of 30 subjects. EMG signals were recorded from seven predetermined sites on the forearm and one site on the bicep. High-quality Duo-trode Ag-AgCl electrodes (Myotronics, 6140) were employed for signal acquisition. To maintain a standardized reference point, an Ag-AgCl Red-Dot electrode (3M, 2237) was placed on the wrist. The acquired signals were amplified using a Model 15 amplifier (Grass Telefactor) with a gain of 1000 and a bandwidth of 1 Hz to 1 kHz. A sampling rate of 3 kHz was used, facilitated by an analog-to-digital converter board (National Instruments, PCI-6071E). Subsequently, the EMG data were downsampled to 1 kHz before conducting the pattern classification analysis, following established protocols.
Figure 4 presents a visualization of all eight channels of one EMG signal, effectively showcasing the muscle activity during a single test trial. Each trial has consisted of the subject repeating each limb motion four times, with each motion being sustained for a duration of three seconds per repetition. The order of the limb motions was randomized to ensure unbiased data collection. To prevent any data cutoff during the recording process, a five-second rest period was introduced at the beginning and end of each trial. As a result, each trial was a duration of 94 s. A total of six trials were completed during each session, and the study encompassed four sessions conducted on separate days, ensuring a comprehensive dataset was gathered for analysis.
In this research, a systematic process was followed to preprocess our dataset. First, we excluded extended periods of rest from both the start and end of each signal, ensuring the focus on the active portions of data. Second, we omitted the pronation and supination movements. This decision was based on the fact that the EMG did not record from the core muscles contributing to forearm pronation, and only one of the muscles involved in supination was recorded. Third, we systematically removed any remaining periods of inactivity. Fourth, we employed a bandpass filter on the signal, applying a lower cutoff frequency of 10 Hz and an upper cutoff frequency of 400 Hz. This aimed to improve the signal clarity. Fifth, we downsampled the signal and label data to a frequency of 1000 Hz to streamline the data processing. Sixth, we developed a signal mask for regions of interest (motions) and generated corresponding labels. This enabled a sequence-to-sequence classification, where each signal sample was matched with a label. Finally, in the seventh step, we divided the signals into shorter segments, each containing 12,000 samples, allowing for easier analysis.
Remark 1. It is noteworthy that, in our methodology, we employed a bandpass filter with an upper cutoff frequency of 400 Hz, indicating our focus on signals up to this frequency. As dictated by the Nyquist theorem [49], for adequate sampling of a signal, the rate should be a minimum of twice the highest frequency present in the signal. Consequently, a signal with a frequency of 400 Hz necessitates a minimum sampling rate of 800 Hz. Subsequently, we opted to downsample to 1000 Hz, which aligns with the Nyquist theorem and is a valid approach. While this decision is not directly contradictory, there might be perceived redundancy, as filtering out frequencies up to 400 Hz and then downsampling to 1000 Hz would naturally confine us to discerning frequencies up to 500 Hz. However, this combination provides an advantage: the additional 100 Hz buffer above our bandpass filter’s upper limit ensures a safeguard against potential aliasing or marginal frequency components, thereby preserving the integrity and fidelity of our signal. In this research, our attention was centered on four specific movements: the hand opening, hand closing, wrist flexing, and wrist extending. Our primary aim was to categorize the data in accordance with these particular actions. After the preprocessing was completed,
Figure 5 shows the tagged motion areas for the first channel of the initial signal, providing a graphical depiction of the manipulated data.
5. Simulation Results
We divided the data into training and testing subsets, which are crucial for training the network and evaluating its performance, respectively. More specifically, we assigned 80% of the data to train the network, a step essential for adjusting the model parameters. The remaining 20% of the data was utilized for testing the network, enabling the evaluation of the model’s effectiveness on data it had not encountered before.
In our proposed ensemble configuration, we employed a quartet of unique classifiers, each exhibiting a distinctive structure. The first individual classifier had an eight-node sequence input layer, a layer normalization layer, an 80-node BiLSTM layer operating in “sequence” output mode, a four-node fully connected layer, a softmax layer, and concluded with a classification layer. The second classifier mirrored the first but incorporated an LSTM projected layer with 100 hidden units, 30 cell units, and 16 output units instead of the BiLSTM layer. The third classifier echoed the previous architectures but featured a GRU (Gated Recurrent Unit) layer with 80 units in place of the LSTM projected layer. The fourth classifier replicated the first’s structure but enhanced the BiLSTM layer to 120 nodes while maintaining the “sequence” output mode. For the collective ensemble network, we orchestrated a structure that commenced with a sequence input layer accommodating 24 inputs, proceeded with a layer normalization layer, an 80-node LSTM layer with attention mechanism, a four-node fully connected layer, a softmax layer, and culminated with a classification layer. This ensemble structure was tailored to leverage the advantages of each individual classifier, thus enhancing the overall model’s performance.
The individual classifiers in the ensemble were strategically designed to harness the strengths of the distinct recurrent architectures: the bidirectional nature of BiLSTM for capturing forward and backward sequence information, the compactness of the projected LSTM for efficiency, and the streamlined GRU for balancing performance with fewer parameters. The variations in node configurations, like the 80- versus 120-node BiLSTM, offer differentiated modeling capacities, catering to potential sequence intricacies. In the ensemble structure, a 24-input sequence layer likely amalgamates the diverse outputs of individual classifiers. The inclusion of an 80-node LSTM with attention ensures that the ensemble concentrates on pivotal sequence segments while maintaining computational parsimony. Importantly, one of the salient benefits of our ensemble method is its resilience against architectural sensitivities; by deploying four classifiers, we are granted the flexibility to experiment with various architectures, thereby reducing the risk of over-reliance on a singular structure. This collective approach integrates the individual classifiers’ advantages and boosts overall performance, while also offering a safeguard against potential architectural pitfalls.
We employed the Adam optimizer, a popular choice for training deep learning models, along with a mini-batch size of 32 to streamline the learning process. The initial learning rate was set at 0.001, providing a balanced starting point between the learning speed and model accuracy. We further capped the maximum number of epochs at 100 to avoid overfitting while ensuring sufficient training iterations. Additionally, to enhance the model’s robustness and ability to generalize, we shuffled the data in each epoch.
5.1. Results of Individual Classifier and the Proposed Ensemble Technique
To illustrate the superior performance of our ensemble mechanism, we present the results of each individual classifier alongside the ensemble’s output. Each of our classifiers employed state-of-the-art techniques. Thus, by evaluating the outcomes of the proposed ensemble structure, we juxtapose them with four state-of-the-art methods.
Figure 6,
Figure 7,
Figure 8,
Figure 9 and
Figure 10 offer graphical illustrations of the training progression for each individual classifier as well as the ensemble model, charting the evolution of both the loss function and accuracy. These figures showcase both the training and validation loss and accuracy metrics. We set the batch size at 32, resulting in a total of 69 batches per epoch. The total number of epochs was set to 100. The x-axis represents the number of iterations, calculated as the product of the total number of batches and epochs. Every 20 epochs, we evaluated the improvements in accuracy for the validation data. If there was no observed improvement in the validation data accuracy over 20 consecutive epochs, we would terminate the learning process. Nonetheless, as evidenced by our figures, this condition was not met for any of the models, and the training continued up to the 100th epoch, which was the maximum number set.
Remark 2. In machine learning, one of the primary concerns when training a model is overfitting, where the model performs exceptionally well on the training data but poorly on unseen data. One way to ascertain whether a model is overfitting is to compare its performance on the training data versus a separate validation set. In our case, the accuracy and loss function values for the validation data closely match those of the training set (see Figure 6, Figure 7, Figure 8, Figure 9, Figure 10, Figure 11, Figure 12, Figure 13, Figure 14 and Figure 15). This congruence in performance is a robust indication that our model is generalizing effectively to new unseen data. Therefore, based on this evidence, we confidently assert that our model does not suffer from overfitting. In addition, to mitigate overfitting, we instituted a check every 20 epochs to monitor accuracy improvements in the validation data. If no discernible enhancement in the validation data accuracy was noticed over these 20 consecutive epochs, the learning process was halted.
Figure 11,
Figure 12,
Figure 13,
Figure 14 and
Figure 15 offer a comprehensive visual representation, showcasing the classification outcomes for each individual classifier as well as the proposed ensemble model, all benchmarked against the testing dataset.
5.2. Using More Data for Training
To evaluate the significance of the provided data and verify the sufficiency of the training dataset, we opted not to set aside 10 percent of the data for validation. Instead, we used those samples for training, effectively utilizing 10 percent more data than was used in the simulations for
Figure 11,
Figure 12,
Figure 13,
Figure 14 and
Figure 15. Here, we only report the results of the ensemble structure.
Figure 16 displays the classification results for different motions within the testing dataset using our proposed method.
5.3. Comparison with an LSTM with Optimized Structure
To ensure a rigorous comparison in this paper, we juxtaposed our proposed method with an optimized LSTM. To determine the optimal structure for the LSTM, we employed Bayesian optimization. Bayesian optimization is a global optimization technique tailored for optimizing intricate, costly, and potentially noisy objective functions. It functions by creating a probabilistic model of the objective function and then leverages this model to identify the most promising evaluation candidates based on a chosen acquisition function. Gaussian Processes (GPs) are frequently adopted as models due to their adaptability and resilience in modeling unfamiliar functions. The acquisition function plays a critical role in this method, striking a balance between exploring uncharted areas of the domain and capitalizing on well-understood promising regions. For an in-depth discussion on Bayesian optimization and its framework, readers can refer to [
50,
51]. For finding optimal structure in neural networks like LSTM, Bayesian optimization provide substantial advantages over traditional methods like grid or random search. Bayesian optimization adopts a more structured approach, enabling the discovery of optimal or near-optimal solutions with fewer evaluations—a boon in the realm of deep learning where model training can be both computationally intensive and time-consuming.
We utilized Bayesian optimization to determine the optimal values for several hyperparameters: the number of hidden layers in the LSTM, the initial learning rate, mini-batch size, and the number of epochs. The objective function for this optimization is defined as the negative of the accuracy achieved across all class classifications. To evaluate the performance, we set aside 10 percent of the training data. In each iteration of Bayesian optimization, the model was trained on 90 percent of the training data. Subsequently, the accuracy was assessed based on predictions for the remaining 10%. Thus, the aim of Bayesian optimization is to maximize this accuracy, which is equivalent to minimizing its negative value. We utilized the ‘expected improvement’ as the acquisition function, and the chosen kernel function was ‘Matern52’. We capped the Bayesian optimization process at 25 iterations.
Figure 17 displays the progression of the objective function. As illustrated in
Figure 17, the minimum objective value remained unchanged after the eighth iteration. This suggests that the Bayesian optimization identified the optimal structure within these initial eight iterations and did not find a superior structure thereafter.
The resulting optimal structure defined by Bayesian optimization was as follows: 123 epochs, 62 hidden layers in the LSTM, a mini-batch size of 26, and an initial learning rate of 0.002713. Utilizing this optimized LSTM structure, we trained our model. The subsequent figure presents the results of the optimized LSTM on this dataset (
Figure 18).
The average accuracy across all classes stands at 86.15%, which is considerably lower than that achieved by our proposed ensemble, as shown in
Figure 16 with the same training and testing data sets. This result illustrates that our proposed method surpasses the performance of an optimized LSTM classifier.
6. Discussion
Figure 6,
Figure 7,
Figure 8,
Figure 9 and
Figure 10 illustrate that the accuracy and loss function values for the validation data closely align with those of the training set, providing a strong indication that overfitting did not occurred.
Figure 11,
Figure 12,
Figure 13,
Figure 14 and
Figure 15 illustrate the nuanced performance of various classifiers; while some demonstrate proficiency in certain tasks, they fall short in others, indicating the varied strengths and weaknesses across different scenarios. As previously mentioned at the outset of the simulation section, all classifiers utilize powerful and state-of-the-art architectures. However, they do not always yield satisfactory results. For instance:
In Individual Classifier 1, the accuracy for all positions is below 90%. Notably, for the wrist extension position in the hand, the accuracy drops to 77.2%.
Individual Classifier 2 performs better in detecting wrist extensions, yet its average accuracy remains at 84.67%.
In Individual Classifier 3, only wrist flexion exceeds 90% accuracy, with all other measurements falling below this mark.
Individual Classifier 4 detects an open hand with an accuracy of 77.9%, and its average accuracy stands at 85.92%.
Figure 11,
Figure 12,
Figure 13,
Figure 14 and
Figure 15 reveal that while some classifiers excel in specific tasks, they underperform in others. This inconsistency underscores the advantages of our architecture: it harnesses the strengths of each classifier to yield superior results.
Figure 15 substantiates this claim, with only the wrist extension position falling below 90% accuracy. All other positions, when evaluated using our proposed ensemble technique, have an accuracy exceeding 90%. The ensemble’s average accuracy is 91.28%, whereas, for all individual classifiers, the average accuracy remains below 90%.
Figure 16 showcases the results of the classification process when there is an additional 10% of data available in the training process. When directly comparing the results in
Figure 16 to the results in
Figure 15, where we had 10% less training data, it is evident that having more training data significantly improves the detection of wrist expansion. The wrist expansion task is particularly challenging as the wrist expansion and hand open motion share the involvement of the same muscle.
In
Figure 16, the average accuracy of the proposed method stands at 91.5%, with accuracies for all motions exceeding 90%. In comparison, when we allocated 10% of the data for validation, resulting in 10% less data for training, the ensemble’s average accuracy was slightly reduced to 91.28%, with wrist extension accuracy being the only one below 90% at 87.2%. Hence, a close examination of both figures reveals that our approach consistently delivers commendable results under both conditions. In addition, in
Section 5.3, we compared our method to an optimized LSTM.
Figure 16 shows the results, with an average accuracy of 86.15% across all classes. This performance indicates our method’s superiority over the optimized LSTM classifier.


