
Analyzing Employee Attrition Using Explainable AI for Strategic HR Decision-Making


1
Faculty of Statistics, Complutense University, Puerta de Hierro, 28040 Madrid, Spain
2
Management Department, Universitat Politècnica de València, Camí de Vera s/n, 46022 Valencia, Spain
*
Author to whom correspondence should be addressed.
Mathematics 2023, 11(22), 4677; https://doi.org/10.3390/math11224677
Submission received: 8 October 2023
/
Revised: 11 November 2023
/
Accepted: 15 November 2023
/
Published: 17 November 2023
(This article belongs to the Special Issue Symbolic Methods of Machine Learning in Knowledge Discovery and Explainable Artificial Intelligence)
Abstract
:Employee attrition and high turnover have become critical challenges faced by various sectors in today’s competitive job market. In response to these pressing issues, organizations are increasingly turning to artificial intelligence (AI) to predict employee attrition and implement effective retention strategies. This paper delves into the application of explainable AI (XAI) in identifying potential employee turnover and devising data-driven solutions to address this complex problem. The first part of the paper examines the escalating problem of employee attrition in specific industries, analyzing the detrimental impact on organizational productivity, morale, and financial stability. The second section focuses on the utilization of AI techniques to predict employee attrition. AI can analyze historical data, employee behavior, and various external factors to forecast the likelihood of an employee leaving an organization. By identifying early warning signs, businesses can intervene proactively and implement personalized retention efforts. The third part introduces explainable AI techniques which enhance the transparency and interpretability of AI models. By incorporating these methods into AI-based predictive systems, organizations gain deeper insights into the factors driving employee turnover. This interpretability enables human resources (HR) professionals and decision-makers to understand the model’s predictions and facilitates the development of targeted retention and recruitment strategies that align with individual employee needs.
Keywords:
XAI; interpretability; decision-making; employee attrition; machine learning; human resourcesMSC:
68T201. Introduction
The rapid evolution of the labor market, particularly within the domain of human resources (HR), has been significantly impacted by a burgeoning phenomenon known as ‘involuntary turnover’—referring to employee departures that are contrary to the employer’s intentions [1]. This transformation, affecting enterprises across all sectors and nations, gained momentum with the onset of the pandemic and experienced an upsurge during the phenomenon termed the ‘Great Resignation’, which initiated during the spring of 2021 in the United States [2]. The substantial rise in employee turnover presents a multidimensional challenge for companies, manifesting in tangible and intangible costs.
This issue is extensively addressed in the recent publication titled “Labour Turnover Report in Spain” by Randstad Research [3]. According to the study, nearly 38.5% of Spanish enterprises have witnessed an escalation in their turnover rates over the past twelve months, while more than half (55%) have maintained stability, and only 6.5% have observed a decline. The average turnover rate in Spain currently stands at 17%.
Though a predominant 77% of these companies attribute this turnover to their employees finding enhanced opportunities in other sectors or organizations, it is imperative to acknowledge that this is not an exclusive reason. The crises of the past two years have significantly impacted the workforce, prompting concerns regarding the perceived risks associated with specific sectors. This concern has been highlighted as a secondary justification by 31% of the surveyed companies. Furthermore, aspirational salary expectations, exacerbated by inflation during the present year, and the demand for increased flexibility rank as the third most cited reasons.
The burgeoning field of artificial intelligence (AI) presents a promising avenue to address the contemporary challenges of high employee turnover. By employing advanced AI algorithms and embracing an explainable AI (XAI) methodology, it is plausible to discern intricate patterns and criteria that signify an employee’s inclination toward leaving an organization [4]. XAI not only illuminates the predictive model’s decision-making process but also identifies the crucial features or factors that contribute most significantly to predictions [5].
Understanding these contributing elements allows organizations to tailor strategic initiatives to incentivize and engage employees who are potentially inclined to leave. By gaining insights into their needs, concerns, and motivations, employers can proactively implement targeted retention strategies. These strategies may encompass enhanced professional development opportunities, flexible work arrangements, competitive compensation packages, or initiatives to improve the overall work environment [6].
Moreover, armed with this knowledge, companies can reshape their recruitment processes. They can actively seek candidates who align with the identified criteria for higher retention, thus aiming to build a workforce predisposed to long-term commitment. Additionally, organizations can customize their recruitment pitches to emphasize the aspects that resonate with employees who exhibit a propensity to remain loyal.
The integration of AI, particularly with an emphasis on explainability, offers a transformative approach to address the pervasive issue of employee turnover. By deciphering the intricate web of factors contributing to attrition, companies can proactively design strategies that not only retain existing talent but also attract new personnel who are likely to forge enduring associations with the organization. This paradigm shift has the potential to significantly impact organizational stability, productivity, and overall growth.
The novelty of this article lies in the development of a methodological approach for an interpretable study on employee attrition. This study is designed to provide valuable insights into the factors influencing employee turnover, thus enabling informed decision-making related to both employee retention and recruitment strategies.
By leveraging the innovative methodology proposed herein, organizations can comprehensively analyze and interpret the multifaceted determinants of employee attrition. This interpretability is instrumental in deriving actionable intelligence from the model, elucidating the ‘why’ behind predictions. Such understanding is crucial for decision-makers, as it allows organizations to tailor strategies and interventions effectively.
The interpretability of the model empowers organizations to identify the pivotal factors driving attrition within their specific context. Consequently, decision-makers can devise targeted interventions to mitigate turnover risks. These interventions may encompass fostering a supportive work culture, offering growth opportunities, improving work–life balance, or addressing compensation concerns, among other initiatives.
Furthermore, the developed methodology facilitates an actionable approach to recruitment. By discerning the attributes associated with employee longevity within an organization, recruitment efforts can be redirected to identify candidates who align with these attributes. This targeted approach enhances the potential for successful and enduring employment relationships.
This article advocates for a paradigm shift in how organizations perceive and address employee attrition. By harnessing the potential of an interpretable methodology, organizations can proactively implement strategies that enhance employee retention and optimize recruitment processes. This study’s findings serve as a beacon guiding the path toward a stable and motivated workforce, thereby fostering sustainable organizational growth.
In the remainder of this article, the XAI model will be developed and implemented, via the following structure: in Section 2, the current state of XAI methodologies and their application scenarios will be reviewed, highlighting the disparity between the application of machine learning (ML) algorithms and the incorporation of explainability in relation to employee attrition rate; in Section 3, the methodological framework that will be employed in predicting and explaining attrition will be discussed; in Section 4, the XAI model will be applied to the employee attrition rate within a business context, addressing a decision-making process within the interpretability framework (the analysis will demonstrate how the developed methodology can be employed as an alternative to the analytic hierarchy process (AHP) approach for personnel selection); and finally, in Section 5 and Section 6, the discussions, conclusions, and future work will be presented.
2. Related Work
The attrition of employees has become a significant area of interest for organizations, particularly within the dynamic landscape of modern workplaces. From a psychological perspective, several influential factors contribute to an employee’s decision to leave a job. This phenomenon is especially prominent in the technology sector, where employee turnover rates have surged in recent years [7].
In this fast-paced industry, newly onboarded employees often prioritize elements such as job satisfaction, a conducive work environment, and substantial financial compensation over traditional notions of stability and long-term commitment. Factors influencing attrition encompass not only the intrinsic aspects of the job role but also the overall organizational culture, growth prospects, and the alignment of individual values with those of the company [8].
Modern employees, especially in the technology sector, are increasingly valuing their holistic well-being, seeking a balance between professional and personal spheres. Consequently, organizations are recognizing the importance of employee-centric policies, flexible work arrangements, and initiatives fostering a healthy work–life equilibrium.
Understanding the dynamics and psychological underpinnings of employee attrition, particularly in technology-driven sectors, is crucial for designing effective retention strategies. Research in this domain aims to decipher the complex interplay of variables that affect attrition rates, thus providing organizations with valuable insights to tailor their human resource policies and mitigate turnover challenges.
A preliminary search of works related to employee attrition in the Web of Science Core Collection is presented in Figure 1, with a total of 599 articles identified. The most relevant areas are outlined in Table 1.
Within the research process, it is essential to comprehend the number of articles pertaining to the application of exploratory data analysis (EDA) and machine learning (ML) algorithms in predicting employee attrition. Additionally, understanding the adoption of techniques aimed at mitigating attrition is of significant interest. Figure 2 provides a graphical representation, illustrating a notable decline in the number of studies—28 articles—upon introducing this new variable. Furthermore, Table 2 presents a detailed list of these articles.
This adjustment improves readability and maintains the same meaning.
If one wishes to analyze articles related to employee attrition that apply predictive models and emphasize interpretability (TS = ‘XAI’ OR ‘INTERPRETABLE’ OR ‘EXPLAINABLE’) to said models, from the list, the following study is found which delves into the ML algorithm’s intrinsic interpretability models [26]. Furthermore, there is the following article from the 2022 International Conference on Decision Aid Sciences and Applications (DASA) [36], which delves into the global agnostic interpretability models Shapley and local LIME.
In recent years, there has been a growing emphasis on the interpretability of machine learning (ML) algorithms. Historically, the focus primarily revolved around algorithmic accuracy, often leading to a trade-off between accuracy and interpretability. Higher precision usually accompanied reduced interpretability [37]. This trade-off has fueled the rise of explainable AI (XAI) as a crucial tool. XAI not only aims to provide high prediction accuracy through ‘black-box’ algorithms but also addresses the critical need to interpret AI-driven decisions.
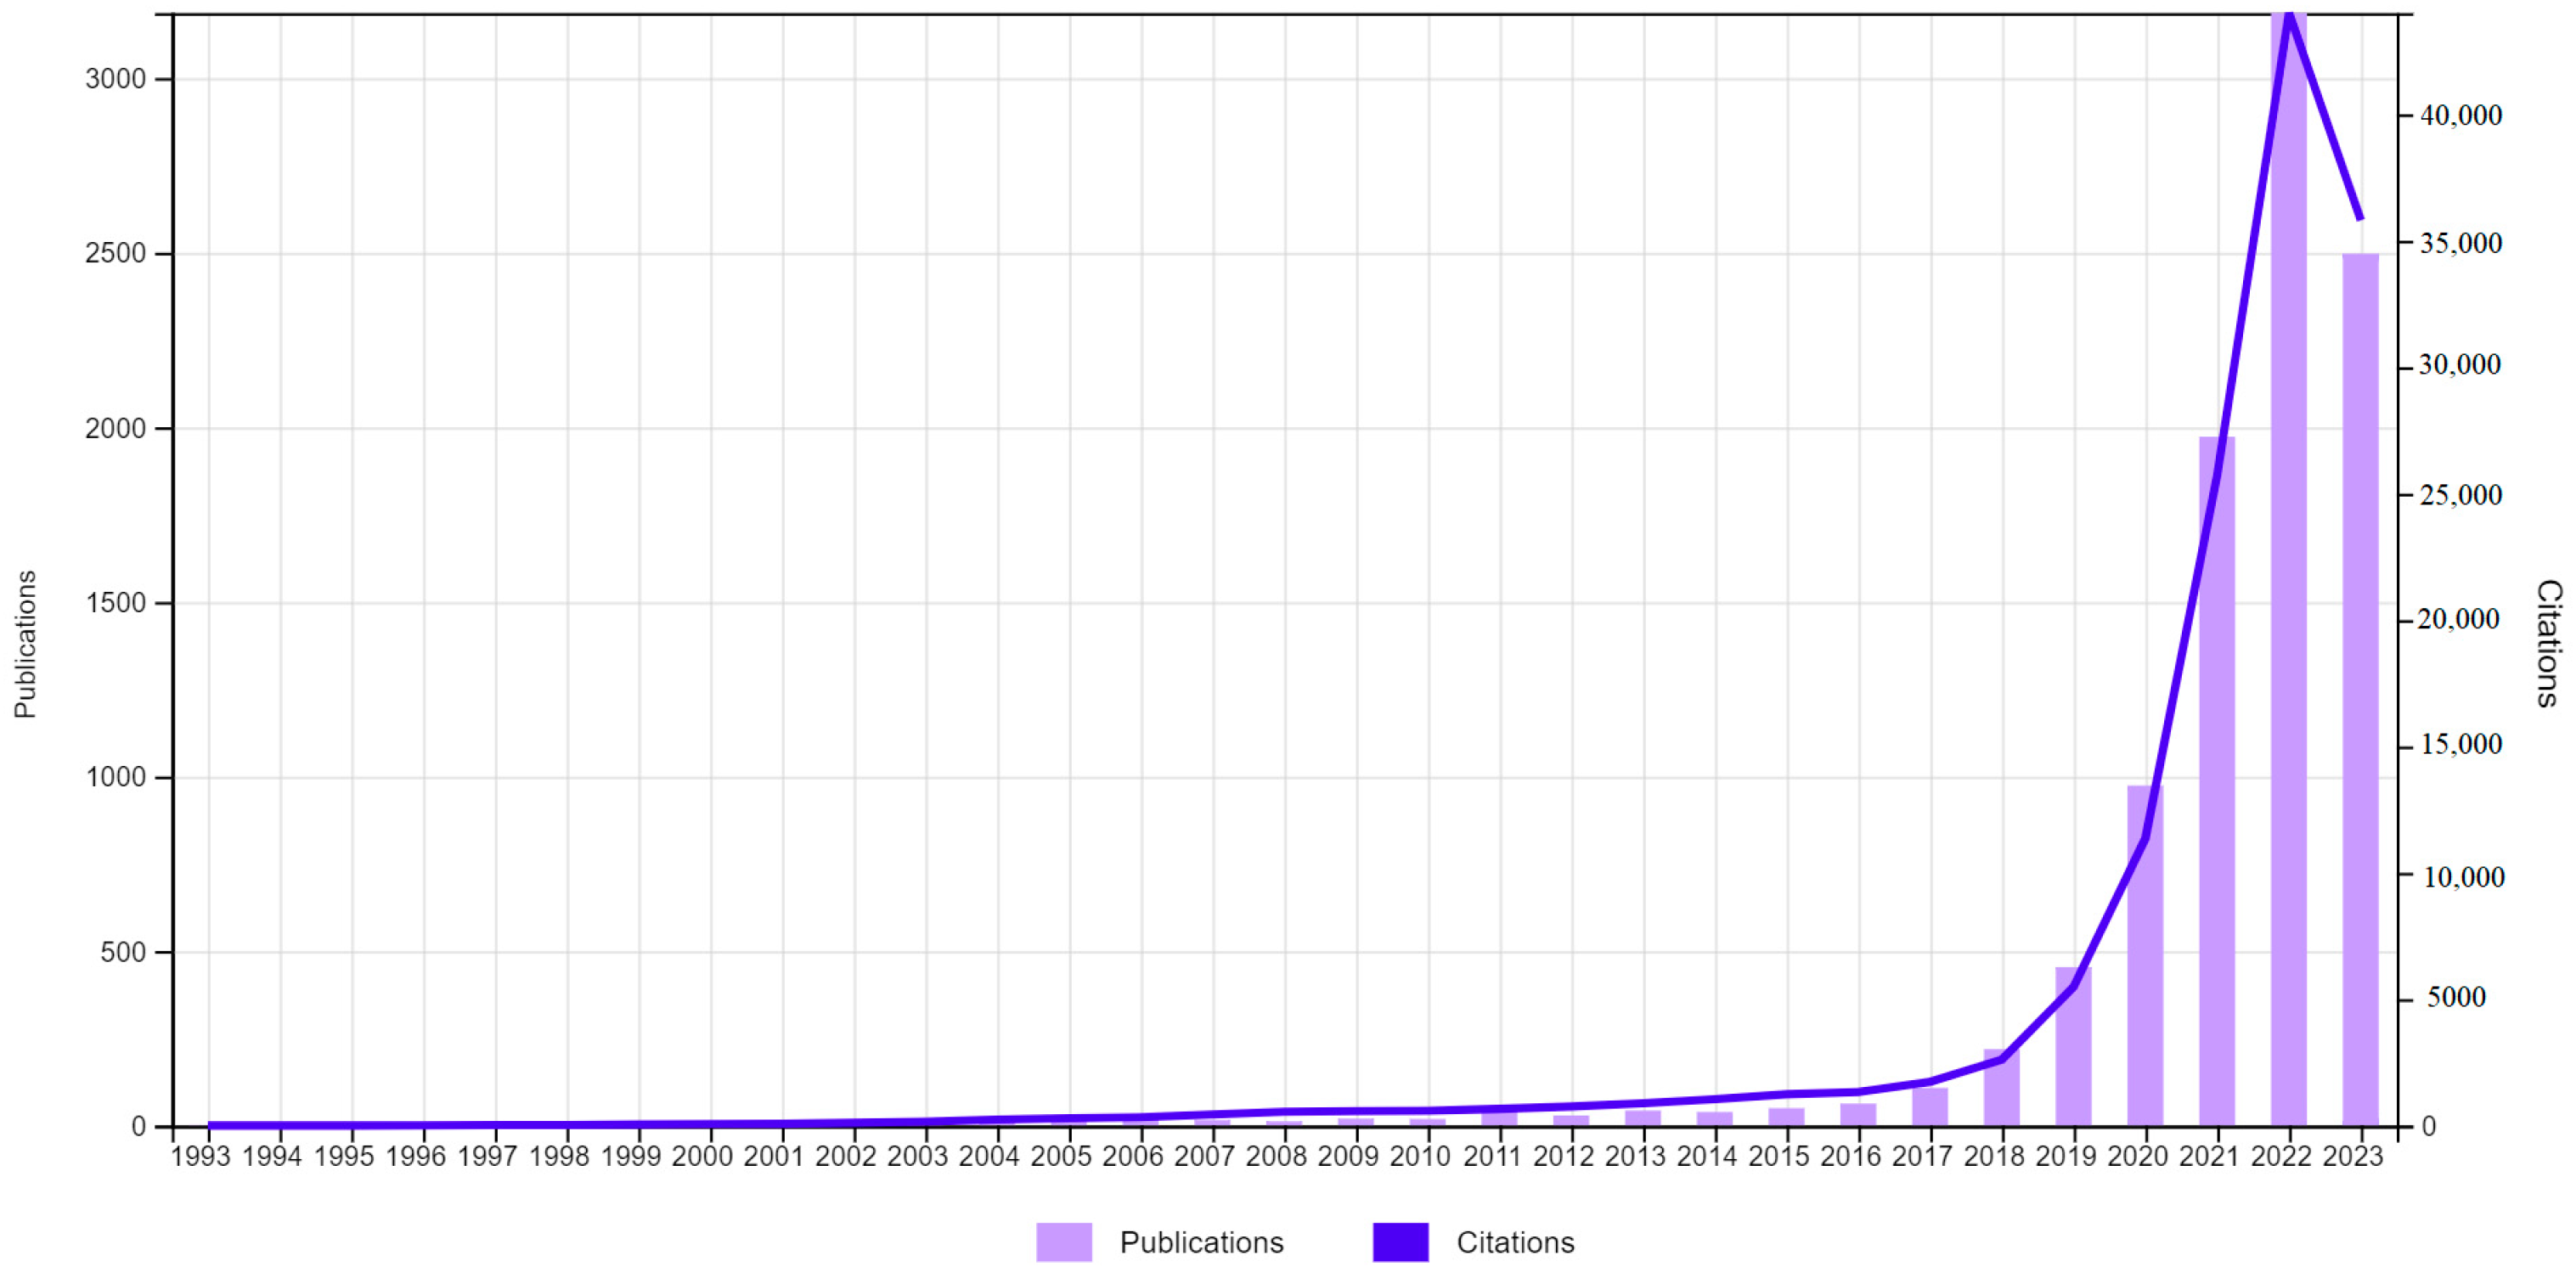
The surge of interest in XAI underscores the shift toward comprehensible AI systems, especially in contexts where decisions impact individuals or society at large. Achieving the right balance between predictive accuracy and interpretability remains an ongoing challenge in the field. This balance is vital for fostering trust and the acceptance of AI systems in real-world applications, spanning from healthcare to finance and beyond. Figure 3 illustrates the progression in the number of studies related to the interpretability of algorithms over time.
The current prevailing trend is to focus on model-agnostic interpretability tools. It is much easier to automate interpretability when we separate the interpretation method from the model used. With agnostic methods, we can replace both the learning model and the interpretation method, providing highly scalable capabilities [37]. In Table 3, a list of studies related to interpretability methods applied to black-box ML models is presented.
3. Methodology
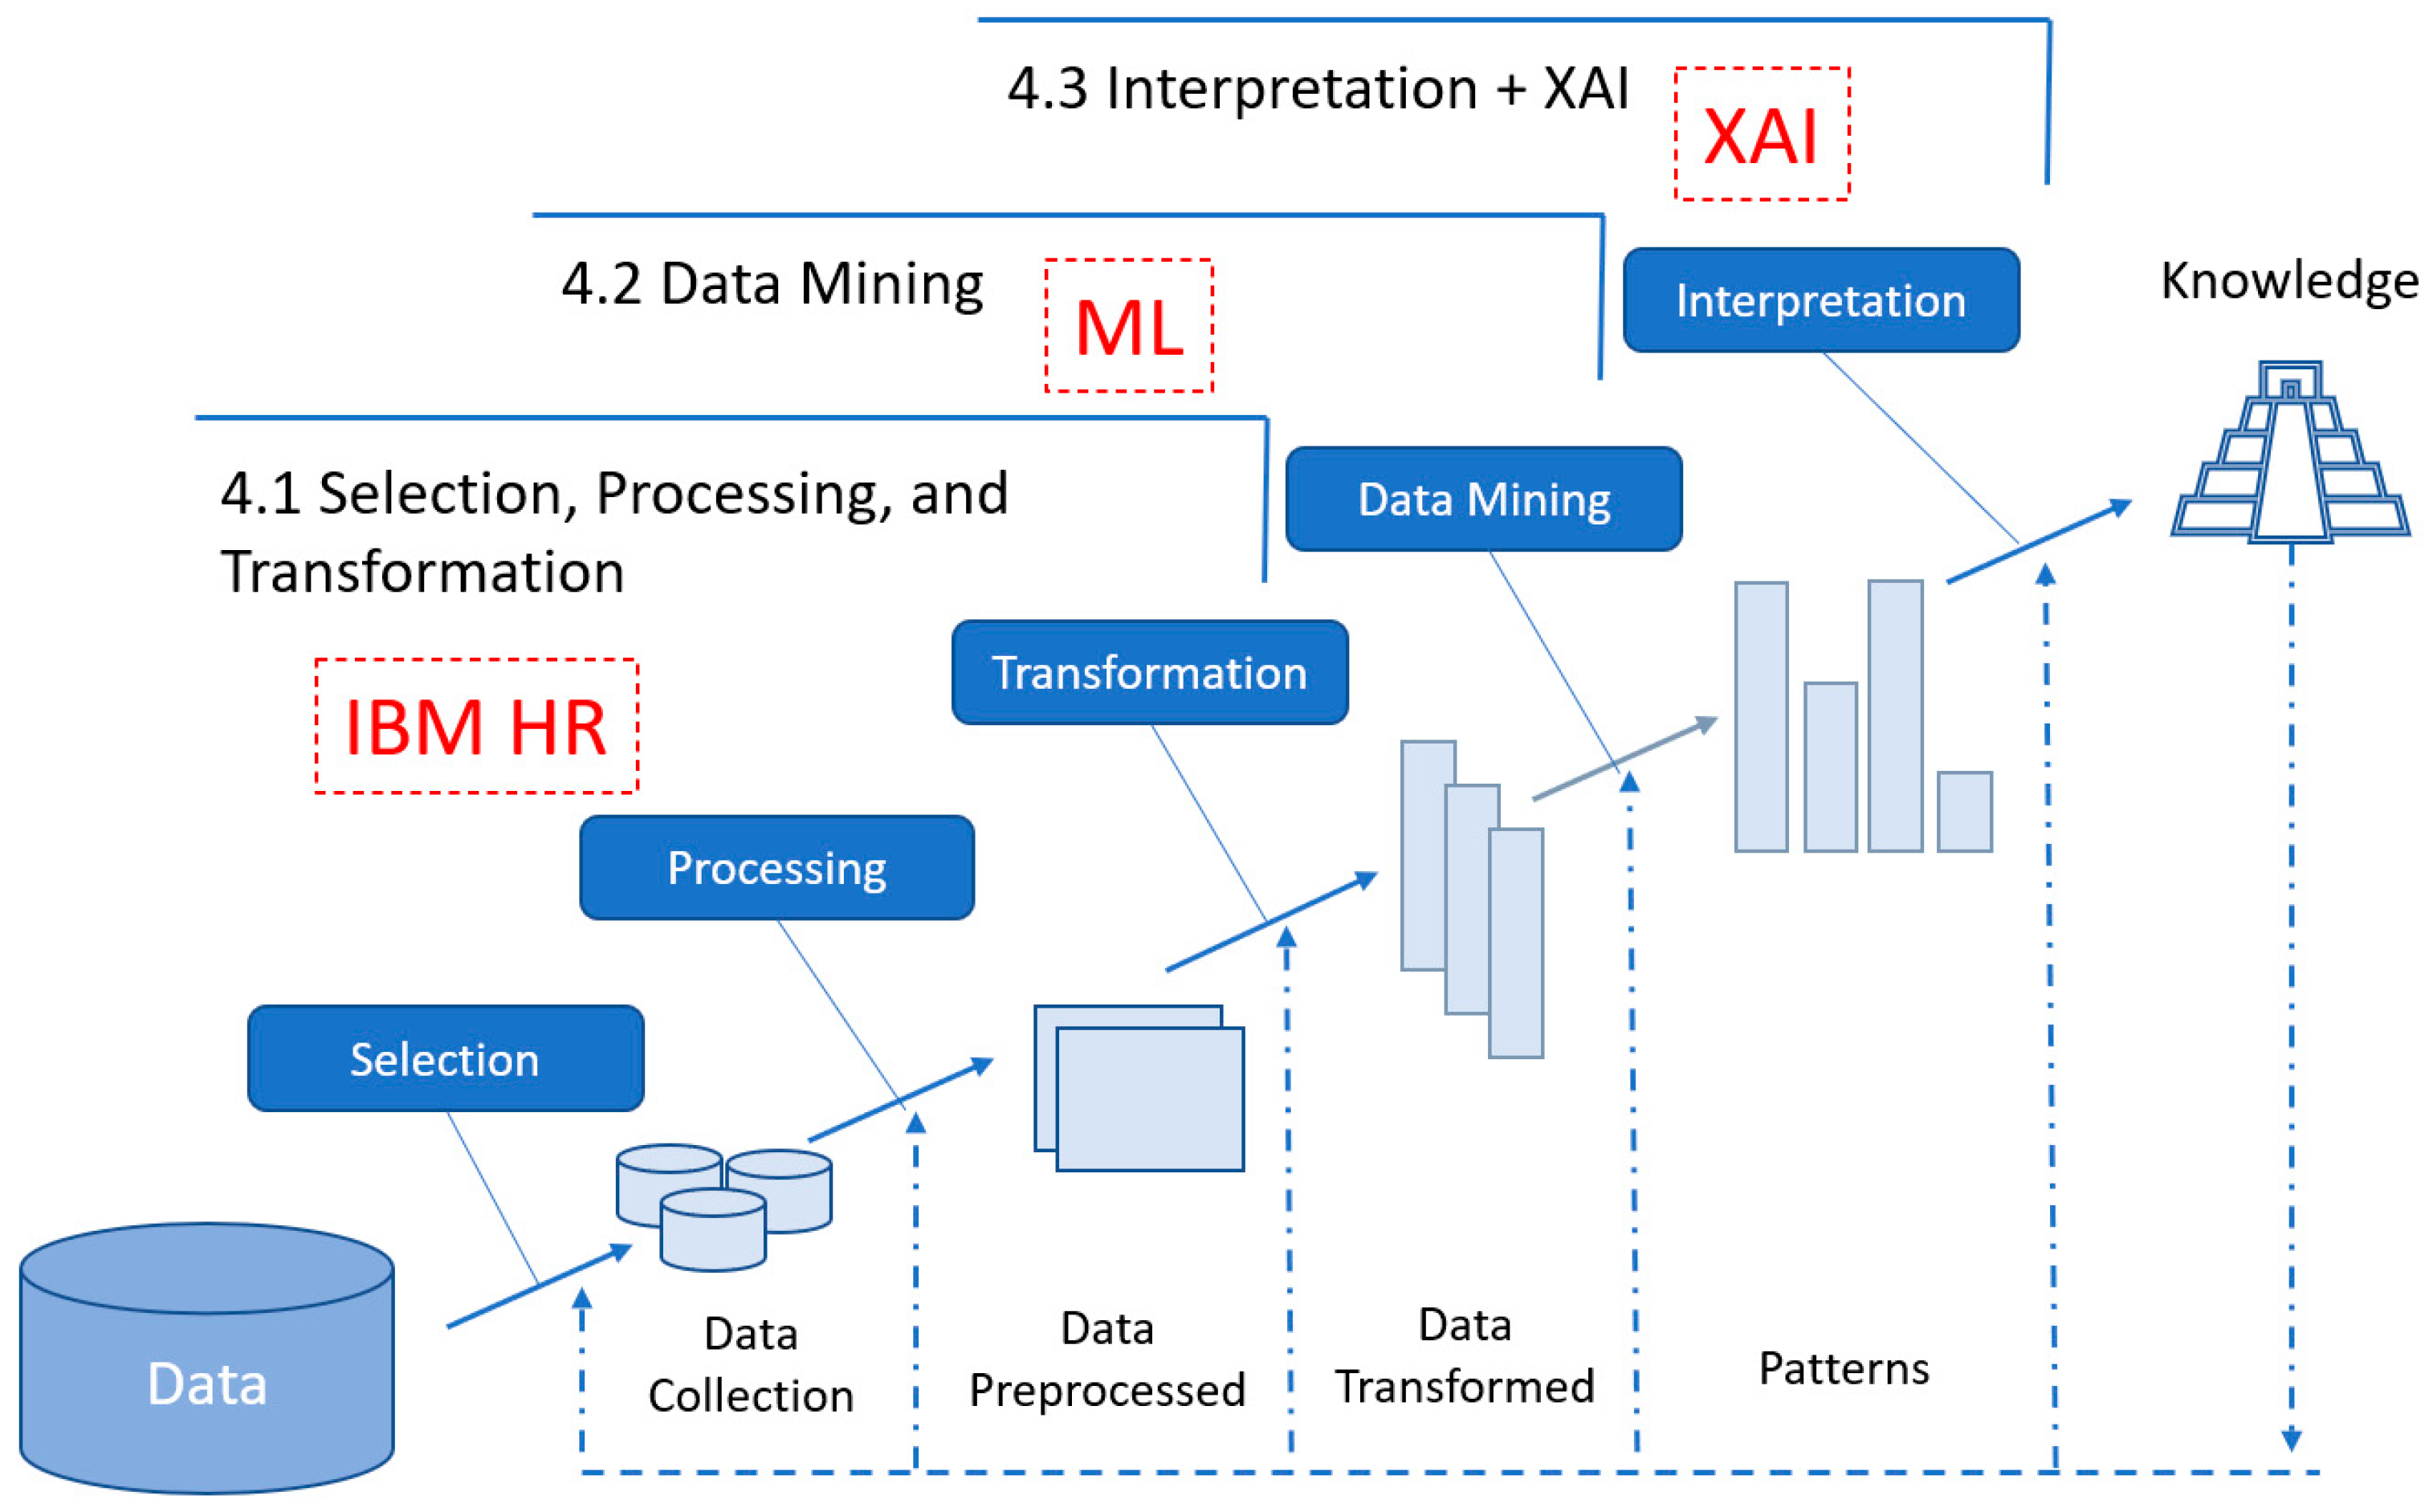
The methodology that is employed in this work is related to the knowledge discovery in databases (KDD) method and the standard process for data mining, cross-industry standard process for data mining (CRISP-DM) [43]. Figure 4 details the steps followed to achieve this objective:
The data collected in this study correspond to the IBM HR open dataset [44]. Once the data source is selected, we proceed to develop each of the stages that are part of the model.
3.1. Data Object
The ‘Data Object’ stage is the initial step in the KDD process [45]. It primarily involves understanding the domain and setting the foundations for the entire data analysis endeavor.
- Understanding the Domain: In the domain of employee attrition analysis, it is essential to comprehend HR processes, industry-specific terminologies, challenges related to employee retention, and other relevant aspects that influence employee attrition.
- Defining Objectives:
- Goal Clarity: Clearly defining the objectives, such as identifying key factors influencing employee attrition and predicting attrition risk accurately.
- Success Criteria: Establishing measurable success criteria, like achieving a certain prediction accuracy, to evaluate the effectiveness of the analysis in addressing the attrition problem.
- Creating Target Dataset:
- Data Collection: Utilizing the IBM HR dataset, a publicly available dataset widely used for studying employee attrition, as the primary data source.
- Data Scope: Defining the scope of the analysis by considering specific features in the dataset, such as employee satisfaction, work environment, and performance, which are crucial for predicting attrition.
- Selecting Relevant Data:
- Feature Selection: Choosing relevant features from the dataset, like job satisfaction levels, working hours, and promotions, which are likely to influence employee attrition and align with the defined objectives.
- Data Sampling: If the dataset is extensive, considering appropriate sampling methods to make the analysis computationally manageable while retaining the dataset’s representativeness.
3.2. Data Preprocessing
Data preprocessing involves cleaning, transforming, and organizing raw data into a suitable format for further analysis [46]. This step addresses issues such as missing values, outliers, and noise in the dataset.
- Handling Missing Values:
- Identifying Missing Data: Identifying features with missing values in the dataset, such as null entries in important employee attributes like satisfaction levels or work performance.
- Imputation: Applying appropriate imputation techniques, like mean or median imputation, to fill in missing values and ensure the completeness of the dataset for meaningful analysis.
- Addressing Outliers:
- Outlier Detection: Identifying outliers in relevant features, such as extremely high or low values in variables like work hours or years at the company.
- Outlier Treatment: Applying suitable outlier treatment methods, such as capping or transformation, to mitigate the impact of outliers on the analysis while preserving important information.
- Handling Noise:
- Identifying Noise: Recognizing noisy data points that might distort the analysis, for instance, erroneous entries in salary figures or performance ratings.
- Noise Reduction: Employing noise reduction techniques, like smoothing or filtering, to reduce the impact of noise and enhance the accuracy of subsequent analysis.
3.3. Data Transformation
Data transformation involves converting raw data into a suitable format that enhances its quality and facilitates effective analysis [47]. This stage employs techniques such as normalization, aggregation, discretization, and attribute construction.
- Scaling Features:
- Scaling numerical features to a standard range to ensure a uniform influence on the analysis, particularly beneficial for algorithms sensitive to feature magnitudes.
- Encoding Categorical Data:
- Converting categorical features, such as job roles or education levels, into numerical representations using techniques like one-hot encoding for compatibility with machine learning models.
This involves converting raw HR data into a structured and usable format for analysis. Techniques such as normalization (to standardize metrics like salary and performance), aggregation (to summarize employee data), discretization (to categorize experience levels), and attribute construction (to create derived features like employee satisfaction index) are vital for a better understanding and prediction of employee attrition.
3.4. Data Mining
In the context of this case study on employee attrition prediction, a structured workflow will be executed. This process involves the application of various classification algorithms to assess an employee’s tendency to leave the company [4]. Below are the key steps of the procedure:
- Application of Classification Algorithms: Various classification algorithms like logistic regression, decision trees, random forest, support vector machines, or gradient boosting will be utilized. Each algorithm will provide a predictive analysis on whether an employee is likely to leave based on relevant features and variables.
- Evaluating the Attrition Trend: Once the algorithms generate predictions, the attrition tendency of each employee will be evaluated. This analysis will provide insights into the probability of a specific employee leaving the company soon.
- Measuring Accuracy: Model accuracy will be computed using metrics such as accuracy, representing the proportion of correct predictions made by the model.
- AUC/ROC Curves (area under the receiver operating characteristic curve): AUC/ROC curves will be constructed and analyzed. These curves are visual tools for evaluating the predictive ability of classification models. They plot the true positive rate against the false positive rate for different classification thresholds. The area under the curve (AUC) provides a quantitative measure of model quality.
- Detailed Confusion Matrix: The confusion matrix will be generated for each algorithm. This matrix presents a summary of the model’s predictions compared to the actual values. It contains four main components: true positives (TPs), true negatives (TNs), false positives (FPs), and false negatives (FNs). From this matrix, metrics like precision, recall, specificity, and F1 score are calculated.
3.5. XAI
When considering the interpretability of machine learning models, researchers often categorize them into two primary types [48]. Firstly, there are ‘white-box models’ designed to establish a clear correspondence between input variables and resulting outputs. Conversely, ‘black-box models’ lack easily interpretable decision rules. It is worth noting that interpretability remains a subject of debate even within the domain of white-box models, as evidenced in a separate study where questions regarding their interpretability are raised [49].
Figure 5 illustrates an inverse relationship between interpretability and accuracy. This further highlights the complexity of achieving a balance between model interpretability and predictive accuracy [37]. Differentiating between these model types offers valuable insights into the interpretability spectrum within the realm of machine learning, adding depth to our understanding of model behaviors and performance.
For years, algorithms have been primarily focused on exploratory data analysis to facilitate decision-making. In many cases, acquiring and analyzing data suffices for informed decision-making. However, at times, substantiating decisions based on patterns becomes necessary. In this context, AI gains particular significance. Historically, machine learning algorithms have emphasized achieving high precision in results, increasingly employing black-box algorithms. Consequently, the interpretability of these algorithms designed for decision-making has been limited. This necessitates the emergence of interpretable algorithms [37], explored through various methods detailed below.
- Inherent Interpretable Models [49]: These models are characterized by their transparent structures and explicit relationships between features and predictions, making them inherently interpretable, e.g., linear regression, decision trees, logistic regression.
- Rule-based Interpretable Models [50]: These models belong to a category that strives to simplify intricate patterns into clear-cut rules. These rules are crafted to improve the transparency of the decision-making process. Rather than depending on complex mathematical functions, these models utilize simple and understandable rules that establish direct connections between input features and predictions. This methodology promotes a more intuitive understanding of how each feature impacts the result, rendering the decision-making process easy to interpret and grasp. Instances of interpretable models based on rules encompass decision trees and rule-based systems.
- Local Interpretable Models [51]: Local interpretable models focus on explaining predictions at the instance level. Their primary goal is to offer a detailed understanding of how the model arrived at a specific prediction for a particular data point. Techniques like LIME (local interpretable model-agnostic explanations) fall into this category, providing insights into the model’s behavior around a specific data point.
- Model-Agnostic Approaches: Model-agnostic methods, such as SHAP (Shapley additive explanations), LIME, and permutation feature importance, provide interpretability for a wide range of models without relying on their internal architecture. These approaches enhance transparency across diverse machine learning models.
- Feature Importance Techniques [52]: Feature importance techniques, including gain-based approaches and permutation importance, highlight the significance of each feature in the model’s predictions. They offer a straightforward understanding of feature contributions. Techniques like ELI5 (explain like I’m 5) and partial dependence plot (PDP) are used in this study.
- Surrogate Models [53]: Surrogate models are simpler and more interpretable models trained to approximate the predictions of complex models. The primary motivation behind employing surrogate models is to gain a better understanding of the intricate decision-making processes of complex models. These surrogate models serve as a bridge between the highly complex, less interpretable models and the need for comprehensible insights into their functioning.
- Visualizations and Plots [39]: Visualization techniques, like partial dependence plots, SHAP summary plots, and feature contribution plots, offer intuitive graphical representations of the model’s behavior and feature influences.
In the case of the present study, the interpretability techniques described in Table 4 are developed.
3.5.1. Partial Dependency Plot (PDP)
Data visualization is one of the most powerful interpretation tools, but our mind can analyze the dependence of one or two variables on a third. When we consider more than a certain number of variables, it is necessary to analyze the partial dependence of one or two variables in relation to the prediction of the response variable [40].
We define the following vector of predictor variables of dimension and the vector of input variables ), where . On the other hand, we define as the set such that . We define partial dependence in this way [40],
Each subset of predictors has its own partial dependency function , which provides the average value of when is fixed and varies about its marginal normal distribution .
The above partial function is estimated by calculating averages over the input data:
It is important to point out that the correlation between the set of characteristics and should not be strong, and this is not always the case. On the other hand, the maximum number of predictors for this type of function should be two; the limitation is given by the abovementioned. We cannot represent any model with more than three dimensions.
3.5.2. Local Interpretable Model-Agnostic Explanations (LIME)
This model is used to explain the individual predictions of the black-box ML models. LIME works by checking what happens to the predictions when variations in the input data are introduced. LIME does this by generating new datasets with these variations, thus obtaining sets of predictions. Basically, the explanations are based on local surrogate models. Surrogate models are interpretable models (such as a linear model or a decision tree) that learn about the predictions of the original black-box model. But, instead of trying to fit a global surrogate model, LIME focuses on fitting local surrogate models to explain why the predictions were made individually [51].
The workflow that could represent the above operation is as follows:
- Choose the instance for which you wish to have an explanation of the predictions;
- Perturb the dataset and obtain the predictions for the new points obtained after the perturbation;
- Weight new samples by their proximity to the instance of interest;
- Fit a weighted and interpretable model (surrogate) on the dataset with the variations;
- Explain the prediction by interpreting the local model.
Consider that is an instance which we wish to interpret, and the set is a binary vector to represent its possible interpretation.
If we consider an ML model that belongs to the set of of potentially interpretable models, being the domain of , i.e., a binary vector representing the domain’s interpretability , the degree of complexity of the explanation of the model we represent as . If we define as the likelihood (or a binary indicator) that belongs to the binary vector defined above and if we use as a measure of proximity between an instance y , then, the function is a measure of the fidelity of when approaching in the proximity defined by . To ensure both interpretability and local fidelity, we must minimize and at the same time make low enough to be interpretable. The explanation produced by LIME is obtained in the following way [51]:
The measure of fidelity represented by gives us an idea of the reliability of the interpretable model to explain the predictions made by the black-box models. An unfavorable factor of the model is that it is still under development, and certain problems derived from the instability of the explanations need to be solved [55].
3.5.3. Feature Importance Techniques (ELI5)
The concept of feature importance is simple; it is a matter of assessing the importance of a given feature by calculating the increase in prediction error after making a permutation of the feature. The greater the increase in prediction error, the more important the feature is for the predictive value. A first model was introduced by L. Breiman [54], based on random forest. The model proposed by Fisher et al. [56] is based on the previous one, but in this case, it is independent of the ML algorithm used.
If corresponds to the characteristic matrix, the response variable, and the measurement of error, we follow these steps:
- We estimate the root mean squared error of the original model ;
- We generate the characteristics matrix swapping one for each of the characteristics belonging to the dataset ;
- Based on the predictions of the permuted data, the mean square error is calculated such that ;
- Finally, the importance of the permutation characteristic is calculated as and is sorted by downwards.
In the work conducted with Python and for the cases we are going to deal with in this paper, we will use ELI5 as a tool for debugging classifiers and machine learning regression, explaining its predictions in an intuitive way.
ELI5 provides a global view on the behavior of the learning model and global model agnostic. If two or more features are highly correlated and the estimator uses all of them equally, the significance of the permutation may be low for all features and consequently may present unlikely results.
3.5.4. Shapley Additive Explanations (SHAP)
The objective of the SHAP interpretability model is to be able to provide an explanation for an instance based on the contribution of each of the features to the prediction [39]. SHAP values attempt to account for the output of a function f as a sum of the effects of each conditionally entered characteristic. It is important to note that for nonlinear functions, the order in which the characteristics are introduced matters.
The theoretical model proposed by S. M. Lundberg et al. [57] complies with the following properties.
The SHAP values result from averaging all possible values, such that .
The additive feature attribution methods have an interpretable model represented by a linear function of binary variables:
where , is the number of input characteristics, and .
The variables usually represent an observed characteristic (, or unknown and correspond to the attribution of a characteristic to Shapley’s values.
An important property of the class of additive feature attribution methods is that the possible solution must have three desirable properties: local precision, feature absence, and consistency. Local precision states that the sum of the feature attributions is equal to the output of the function we seek to explain. The absence of features indicates that ; no importance is attributed to them. Consistency states that changing a model so that a feature has a greater impact on it will not decrease the attribution assigned to that feature.
By applying SHAP, we obtain contrasting explanations that compare the prediction with the mean prediction. On the other hand, SHAP connects LIME and Shapley values. This is very useful to better understand both methods. It also helps to unify the field of interpretable machine learning.
4. Implementing XAI Methodology for Employee Attrition Analysis
Decision-making in the domain of human resources (HR), particularly concerning aspects such as employee retention or hiring processes, constitutes the fundamental core of any company’s business model. Hence, the analysis and prediction of employee attrition play a pivotal role within HR processes. While we can conduct a study based on the analysis and prediction of employee attrition, this study should be complemented with a thorough analysis of the interpretability processes of the ML models used in making the predictions [36]. This will help us determine the most important variables in the attrition process, thus refining the company’s internal processes to address talent retention. Consequently, we can establish rules based on the analysis to carry out hiring processes, aligned with attrition reasons and complementary to retention processes. As discussed in Section 3 of this study, we will address the end-to-end HR process using the KDD and CRISP methodologies [43] (Figure 4) by identifying the following subprocesses:
- In Section 4.1, one will start by thoroughly understanding the problem, using the IBM HR open dataset. Next, the necessary preprocessing steps will be carried out and the data will be converted to a format suitable for numerical analysis;
- In Section 4.2, in the initial phase, a set of techniques will be applied to conduct an initial exploratory data analysis. Subsequently, a series of ML algorithms will be employed to develop a predictive model as accurate as possible for detecting employee attrition;
- In Section 4.3, an interpretability study of the results will be conducted. It is necessary to interpret and evaluate which attributes are most influential in detecting employee attrition. The models indicated in Table 4 will be applied for this purpose.
4.1. Data Collection, Processing, and Transformation
The data are collected from the open database IBM HR [44]; the features that make up the dataset are listed in Table 5.
Attrition corresponds to the target variable, with values being ‘Yes’ if the employee has left the company and ‘No’ if they remain. All attributes are of integer type, except Attrition, Business Travel, Department, Education Field, Gender, Marital Status, Over18, and Over Time, which are categorical. The provided data do not contain any missing values.
As outlined in the methodologies presented in Section 3, we will implement certain premodeling techniques, alongside essential data visualization and exploration methods. These are crucial for a thorough exploration, interpretation, and initial understanding of the dataset. They aid to determine the significant features for the model. Importantly, these techniques are model agnostic, making them universally applicable to any dataset, preceding the selection of any initial ML model.
Exploratory data analysis (EDA) will help us determine the most influential features in the model, which we can summarize in the following correlation matrix (Figure 6).
- Let us summarize the results of this EDA:
- The dataset has no missing or incorrect data values, and all features are of the correct data type;
- The strongest positive correlations with the target features are Performance Rating, Monthly Rate, Number of Companies Worked, and Distance from Home;
- The strongest negative correlations with the target features are Years at Company, Job Level, Years in Current Role, and Monthly Income;
- The dataset is imbalanced with most observations describing currently active employees;
- Several features (i.e., columns) are redundant for our analysis, namely, Employee Count, Employee Number, Standard Hours, and Over18.
- Other observations:
- Single employees show the highest proportion of attrition compared to their married and divorced counterparts;
- Approximately 10% of those who leave the company do so upon completing two years with the company;
- Loyal employees with higher salaries and more responsibilities display a lower proportion of attrition compared to their counterparts;
- Individuals living farther from work exhibit a higher proportion of attrition compared to their counterparts;
- Individuals who travel frequently demonstrate a higher proportion of attrition compared to their counterparts;
- Individuals who must work overtime demonstrate a higher proportion of attrition compared to their counterparts;
- Employees working in sales roles show a significant percentage of attrition in the presented dataset;
- Employees who have worked at multiple companies before (have ‘hopped’ between workplaces) display a higher proportion of attrition compared to their counterparts.
4.2. Employee Attrition Prediction
After analyzing the data and drawing initial conclusions, the next step is to proceed with normalization using scaling techniques, specifically ‘MinMaxScaler’. Machine learning algorithms typically rely on numerical values for prediction variables. Hence, label encoding becomes essential as it translates categorical labels into numerical values. To prevent undue emphasis on categorical features with numerous unique values, a combination of label encoding and one-hot encoding will be applied. Finally, before processing, columns that hold no decisive significance for the model, namely, ‘EmployeeCount’, ‘EmployeeNumber’, ‘StandardHours’, and ‘Over18’, will be removed.
Next, a preliminary evaluation of ML algorithms will be conducted, yielding the following results as shown in Table 6. Each of the ML models is assessed through a cross-validation process (K-fold), evaluating the receiver operating characteristic (ROC), area under the curve (AUC), and mean accuracy. This approach provides an initial insight into the optimal algorithm for the case study.
The selected model to be applied based on the obtained results is XGBoost, a black-box model; hence, interpretability is necessary. We have proceeded to fine-tune the hyperparameters, aiming to balance the ‘attrition’ class representation, as the samples from both classes are imbalanced, as shown in Figure 7.
In an initial phase, parameter tuning was conducted using cross-validation with the ‘GridSearchCV’ function.
The resulting outcomes are presented below, as shown in Figure 8.
As can be observed, the model fits the variable Attrition = ‘No’ very well, with a recall of 0.99. However, for the value Attrition = ‘Yes’, the model operates with a recall value of 0.25. It is necessary to balance the data to adjust the model output and, consequently, enhance the recall result for the variable of interest, i.e., accurately predict employees who leave.
To address potential imbalances in the dropout class within the dataset, we have taken steps to modify the XGBoost training algorithm. This modification involves adjusting the hyperparameter ‘scale_pos_weight’, specifically designed to adapt the algorithm’s behavior in unbalanced classification scenarios. A suitable value for this parameter is derived by estimating a correction that corresponds to the inverse of the class distribution. For instance, in a dataset where the ratio between the minority and majority class is 16.1%, an appropriate value for ‘scale_pos_weight’ would be 5.21 [58]. Furthermore, we have integrated ‘scale_pos_weight’ with the SMOTE–Tomek process [59], which simultaneously applies subsampling and oversampling techniques to the dataset. This combined approach yielded the best result in one of the model training iterations (Figure 9 and Figure 10).
The recall for the variable Attrition = ‘Yes’ has significantly improved, increasing from 0.25 to a value of 0.65. However, the recall value for the class Attrition = ‘No’ has slightly decreased, shifting from an initial value of 0.99 to 0.86. Our primary interest lies in predicting employees who leave, prioritizing this over making minor errors in predicting employees who the model anticipates will leave but stay.
As can be observed, the ROC/AUC value has improved from 79.23 (Table 6) to a value of 0.85, enhancing the prediction scores for the variable Attrition = ‘Yes’. This represents a notable enhancement in the model, leading to an improved accuracy in predicting employees who are likely to leave the company.
The next step involves conducting an interpretability analysis, considering that XGBoost is a black-box algorithm.
4.3. ML Interpretability
In the following sections, a practical application of the models detailed in Section 3.5 will be carried out.
4.3.1. Partial Dependency Diagram (PDP)
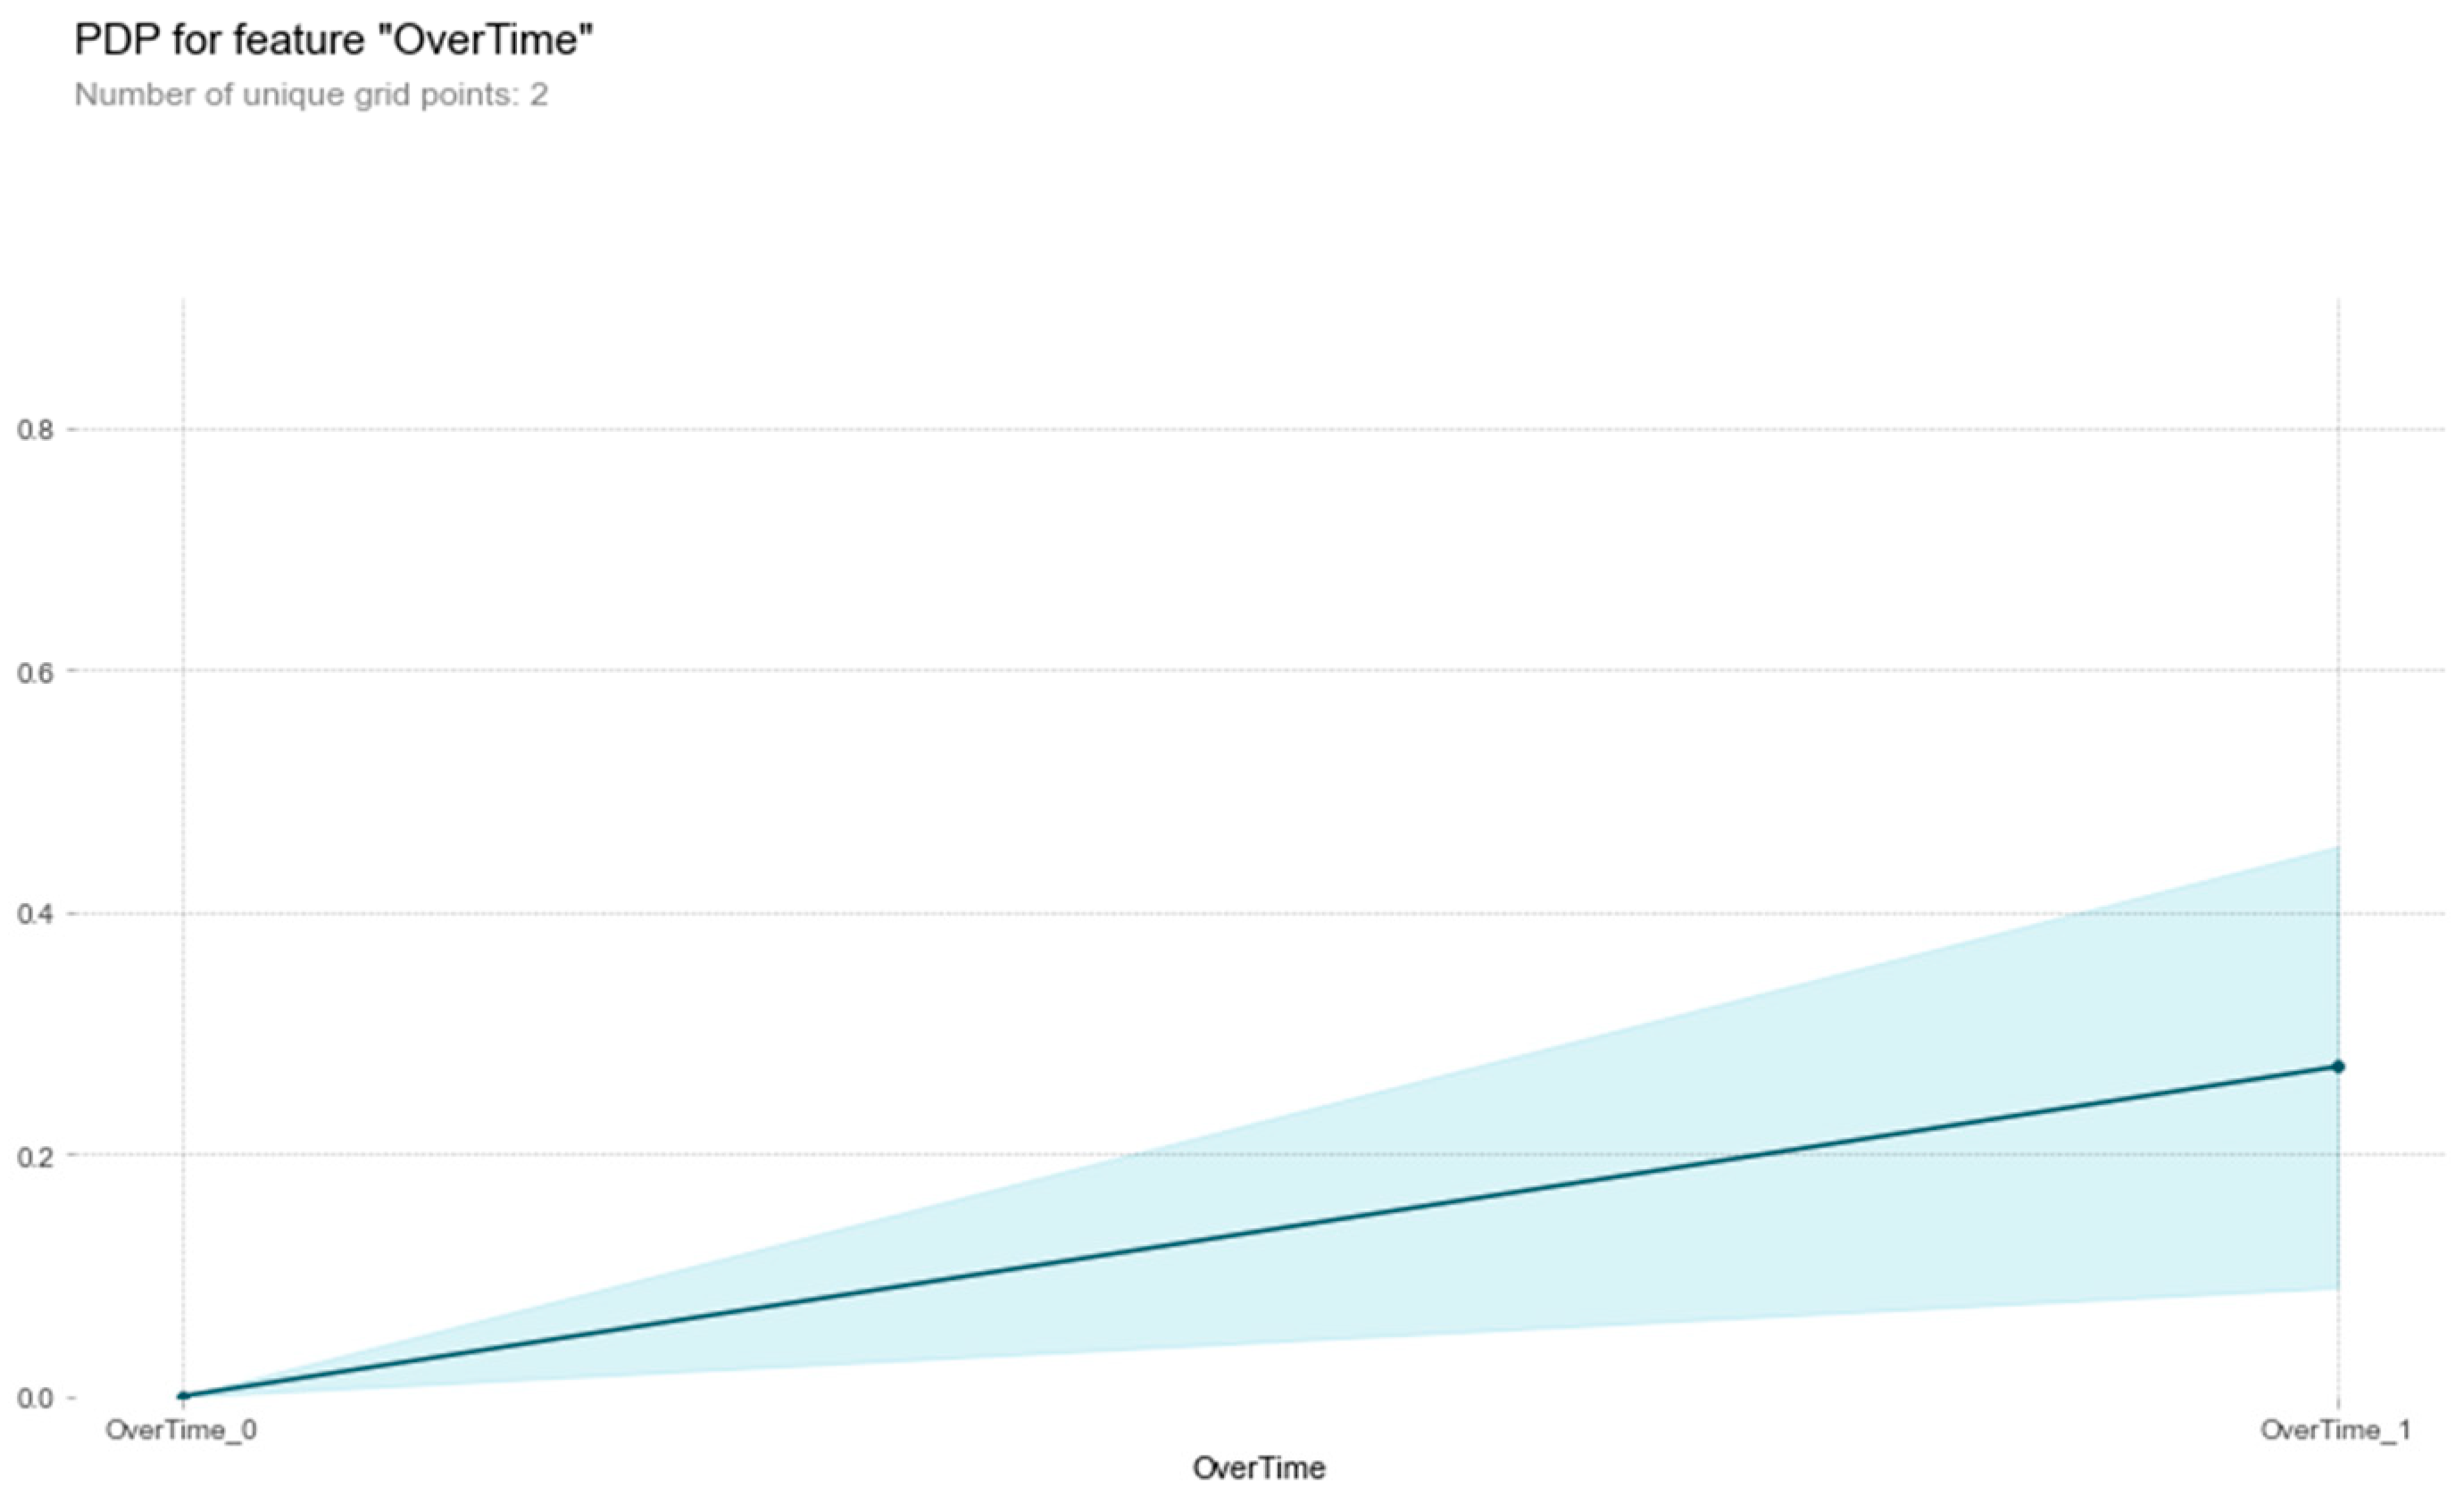
The utilization of the partial dependence plot (PDP) model implies gaining insights into how specific variables influence the prediction of employee attrition within the constructed machine learning model. By isolating the effect of a variable while keeping others constant, PDP illustrates the relationship between that variable and the model’s predictions, aiding in the understanding of its impact on the outcome of employee attrition prediction. This facilitates a more comprehensive interpretation of the model’s behavior concerning the identified significant features. The area represents the confidence interval, which is a range of values that is likely to contain the true value of a parameter with a certain level of confidence [40].
The dependence of features has been contrasted through exploratory data analysis (EDA). At this point, we gather the most significant characteristics regarding employee attrition. All data are normalized using the ‘MinMaxScaler’ function within the interval [0, 1].
The diagrams in Figure 11, Figure 12, Figure 13 and Figure 14 illustrate the impact of several key factors that contribute to employee attrition: JobSatisfaction, DistanceFromHome, MonthlyIncome, and Overtime.
As observed, a decrease in employee satisfaction corresponds to a greater tendency to leave the company.
In this case, the proportionality between employee attrition and distance from home is direct: the greater the distance from home, the higher the tendency to leave the company.
As can be observed, the tendency to leave the company is higher for lower salaries: the higher the salary, the lower the likelihood of attrition.
As observed, the likelihood of leaving the company is higher for employees working overtime.
4.3.2. Local Substitute (LIME)
LIME works by generating locally faithful explanations. It selects a data point and creates a dataset of similar but slightly perturbed instances, generating a simpler and interpretable surrogate model (like linear regression) to explain the predictions of the complex model in the vicinity of the chosen data point.
This technique is valuable for understanding the factors influencing specific predictions, especially in cases where the underlying model might be a ‘black box’ like deep neural networks or ensemble methods [51].
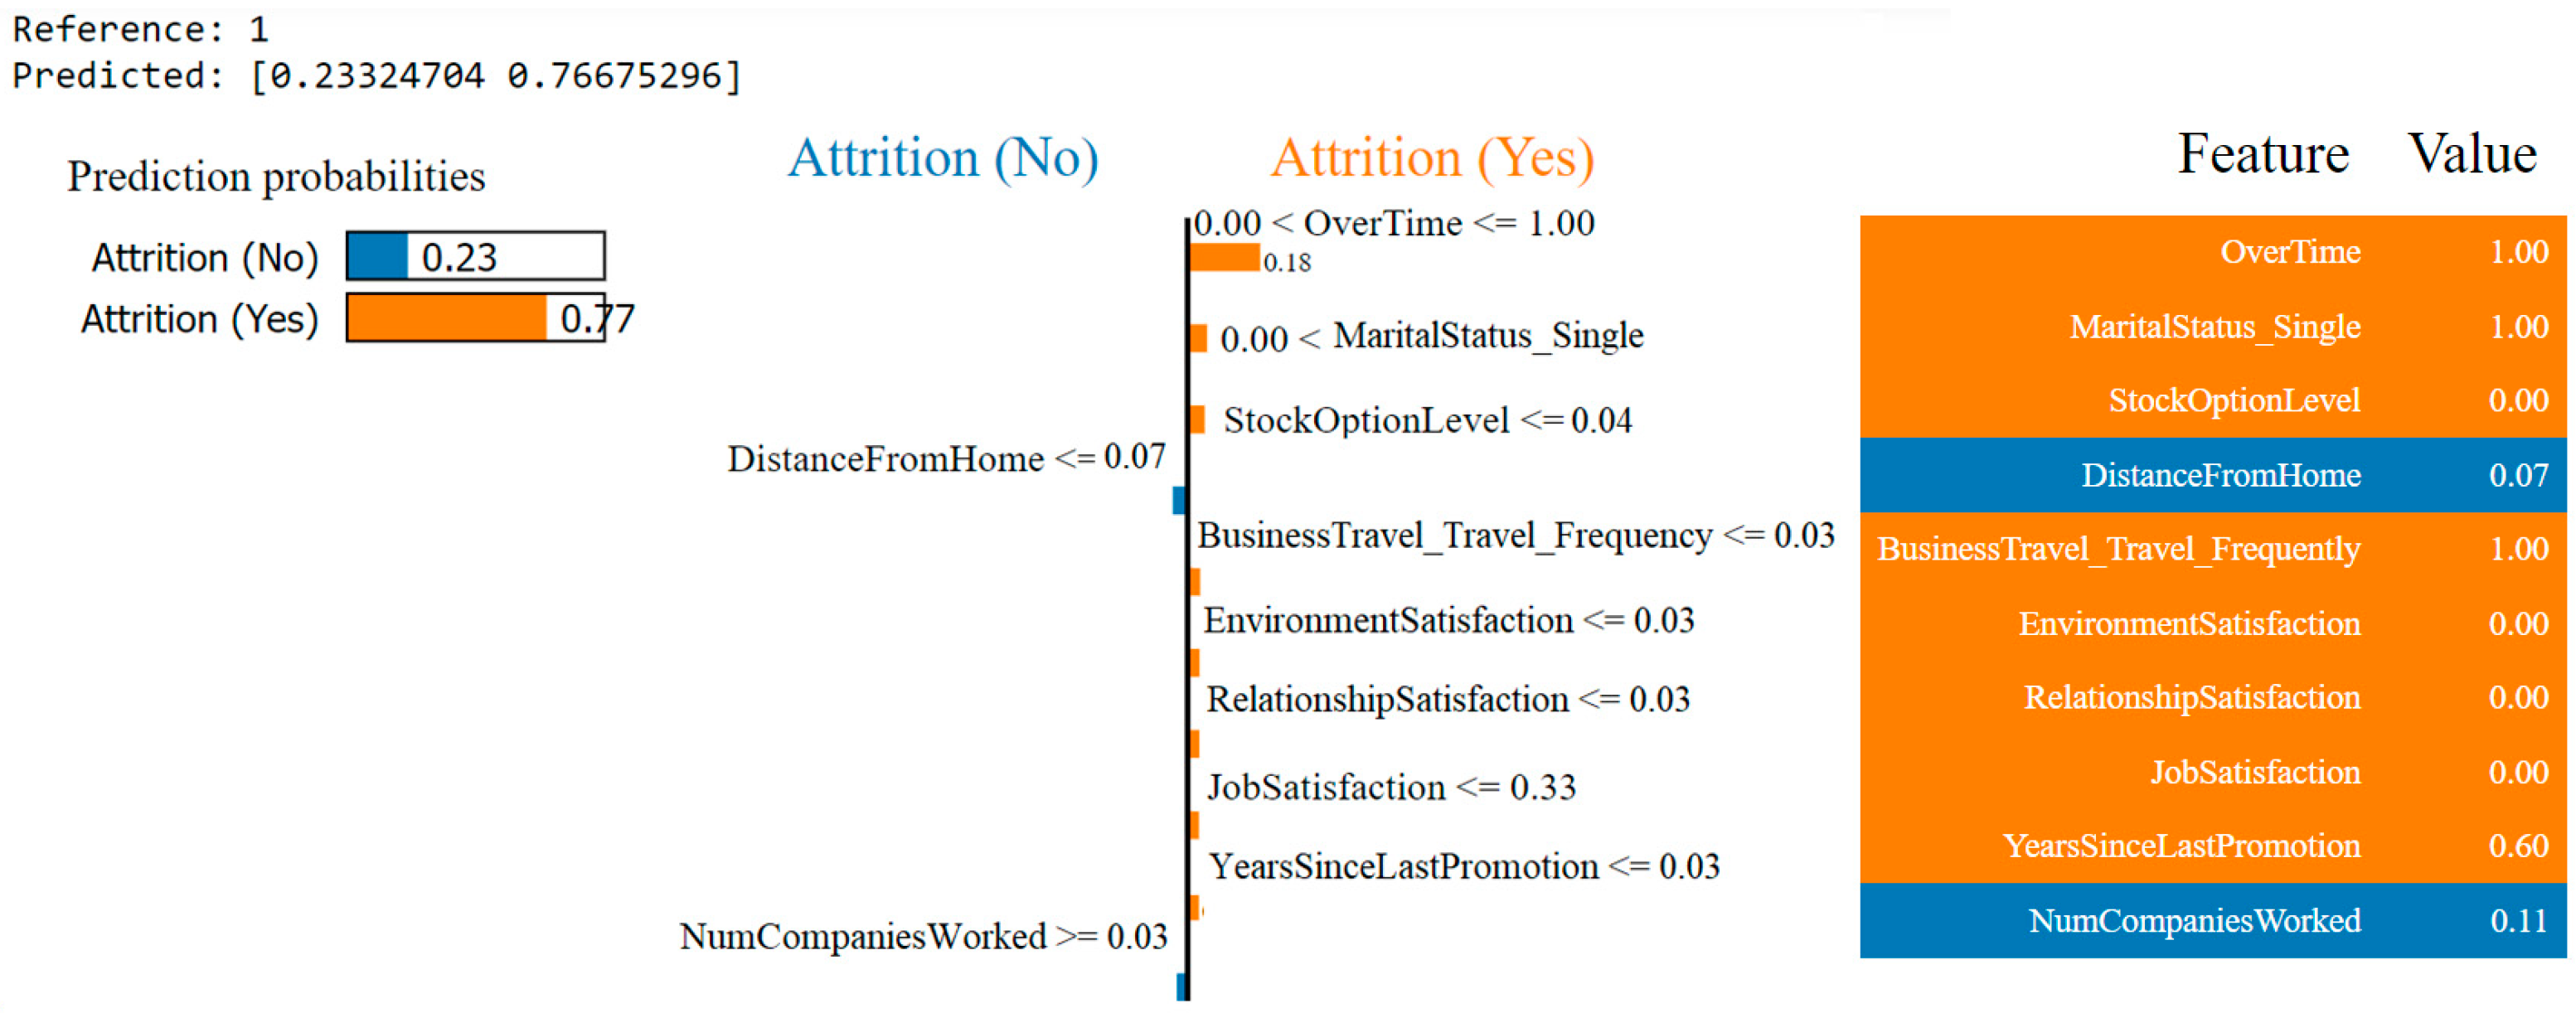
In the first case (Figure 15), the prediction of not leaving the company reaches 100% for the selected subject in the sample. In Figure 16, the prediction of leaving the company is 77%, corresponding to an employee who left the company.
LIME analyzes the most relevant features determining employee attrition (‘Yes’ or ‘No’), making it a local interpretable model-agnostic explanations (LIME).
4.3.3. Feature Importance Techniques (ELI5)
To enhance the interpretability of XGBoost predictions, each model prediction can be presented as a sum of feature contributions (plus bias), demonstrating how the features lead to a particular prediction. ELI5 achieves this by displaying the weights of each feature, indicating their influence on the final prediction decision across all trees [60]. For the model developed, the importance of the characteristics can be summarized in Table 7; the first 12 features have been selected.
4.3.4. Shapley Additive Explanations (SHAP)
The goal of the SHAP (Shapley additive explanations) model for interpreting ML is to explain the output of a machine learning model by assigning each feature an importance value for a particular prediction [37].
It is possible to determine the impact of SHAP values on the model based on the ‘Attrition’ attribute (Figure 17). Additionally, we can conduct an individual interpretation of an employee’s attrition (Yes/No) (Figure 18 and Figure 19).
SHAP provides sound reasoning by revealing which features were most influential in enabling the model to accurately predict whether an employee leaves the company or not.
5. Discussion
The aim of this paper is to develop a comprehensive methodology for applying interpretability in an environment such as human resources management. In business domains, including this one, decision-making should be data driven. Through the proposed model and following the defined phases of exploratory data analysis, prediction, and interpretability, we can identify the attributes most related to employee attrition. Consequently, recruitment and personnel selection processes can base decision-making on models that consider the most influential characteristics in attrition. Employee retention strategies should follow the same considerations. The proposed model helps understand and prioritize the need for AI usage in business environments, especially those related to people management, the most important and decisive asset for the company [61]. Regarding the obtained results, interpretability corroborates the conclusions drawn from the initial exploratory data analysis. Indeed, interpreting the predictions helps us identify attrition risk factors and take mitigation actions promptly.
The decisive features for attrition have been developed through the interpretability of ML algorithms. The process followed is as follows:
- A detailed exploratory data analysis was conducted, identifying key features correlated with employee attrition. The study emphasizes the conduct of a preliminary data analysis with the aim of avoiding biases;
- Data cleaning was performed, and an initial analysis of ML models was established, starting from the least to the most interpretable, assigning a score to each model;
- Hyperparameter tuning and data balancing between the majority class (Attrition = ‘No’) and the minority class (Attrition = ‘Yes’) were carried out;
- The tuning was applied to the model that initially showed higher precision, XGBoost, resulting in acceptable outcomes for both the majority and minority class predictions;
- Finally, interpretability was applied using agnostic models (XGBoost), both locally and globally. The techniques outlined in Section 4.3 of this paper were utilized for this purpose. The interpretability process allowed us to comprehend the influential features affecting attrition prediction and aided in making informed decisions for employee retention strategies.
- In the conducted work, the novel contributions can be outlined as follows:
- Comprehensive Methodological Framework: This study presents a comprehensive methodological framework for integrating interpretability into the machine learning pipeline, specifically tailored for the human resources domain. The framework encompasses data preprocessing, model selection, hyperparameter tuning, and model-agnostic interpretability techniques, providing a structured approach to enhancing the transparency and applicability of predictive models.
- Enhanced Decision-making in HR: By employing machine learning models and interpretability techniques, this research aims to empower HR professionals to make more informed and effective decisions regarding employee attrition. Understanding the influential factors contributing to attrition can guide HR strategies, ultimately aiding in the retention of valuable employees and fostering a more productive work environment.
- Strategic Employee Retention and Recruitment: This study emphasizes the importance of identifying key factors associated with employee attrition. The developed models, along with interpretability, highlight variables that significantly influence attrition, enabling organizations to proactively design targeted retention and recruitment strategies. This strategic approach can potentially result in cost savings associated with hiring and training new employees.
- Model-Agnostic Interpretability for Enhanced Trust: The adoption of model-agnostic interpretability techniques, particularly for complex models like XGBoost, enhances the trust and transparency of predictive models. The ability to interpret and explain model predictions to stakeholders fosters a greater understanding and acceptance of the machine learning outcomes, especially in HR decision-making.
- Consideration of Class Imbalance for Interpretability: Addressing class imbalance and applying interpretability techniques that consider this imbalance is vital in the context of employee attrition prediction. This study demonstrates the importance of understanding influential features for both attrition and non-attrition cases, promoting a more balanced interpretation and a nuanced understanding of the prediction process.
Continuous Model Evaluation. Exploratory data analysis (EDA) offers an initial understanding of variable behavior in relation to the output attribute, attrition. Despite potential biases in the data, preemptive identification of these biases is imperative before embarking on the machine learning process. Furthermore, the articulated methodology must be adaptive, continuously learning from employee data to proactively mitigate bias introduction.
These novel elements collectively advance the understanding of employee attrition prediction and its application in HR management, promoting informed decision-making and efficient employee retention strategies.
6. Conclusions and Future Work
In conclusion, the proposed methodology provides a robust framework to construct a data-driven decision-making process leveraging an organization’s historical data. This approach signifies a paradigm shift, allowing recruitment and selection processes, as well as employee retention strategies, to be firmly rooted in data-driven insights. By systematically analyzing past data, organizations can tailor their hiring procedures, identify potential attrition indicators, and strategically design retention initiatives. This proactive use of data fosters a more efficient and informed approach to human resource management, ultimately contributing to the organization’s growth and stability.
As a result of this present article, the research paths that unfold are numerous and extensive. We propose at least the following points of advancement, on which we are already working:
- Comprehensive Methodological Framework for Data-Driven Decision-Making in HR: Developing a comprehensive methodological framework to enable data-driven decision-making processes based on an organization’s historical data. Recruitment, personnel selection, and retention processes can be data-informed, aiding in HR strategies and improving organizational performance.
- Weight Assignment using AHP/FAHP and End-to-End Decision-Making: Assigning weights to each criterion using the analytic hierarchy process (AHP) or fuzzy AHP (FAHP) methodologies and implementing an end-to-end decision-making process. Weights can be derived from the importance of features determined by the ML model, leading to a methodology based on fuzziness to be applied in selection processes, employee retention, and internal promotion.
- Biases and Explainable Artificial Intelligence: With the aim of reducing biases introduced in the initial data, a model for ongoing data review and evaluation is proposed to decrease the likelihood of bias in decision-making. In future work, the combination of the proposed methodology with a decision-making model based on the analytic hierarchy process (AHP) is suggested. This approach ensures that the criteria determining employee turnover or any other human resources process are guided by explainable AI and validated against a decision-making model based on mathematics and psychology, such as Saaty’s model [62].
- Employee Clustering for Personalized Actions: Creating employee clusters and devising personalized actions based on cluster membership. Tailoring strategies and actions for employees based on their cluster can enhance employee engagement, satisfaction, and productivity.
- Integration of External and Contextual Data: Exploring the integration of external and contextual data in the predictive analysis of employee retention. This can encompass economic, social, or even weather-related data that may influence employees’ decisions to stay or leave the company. Combining internal organizational data with these external sources can enrich the understanding of factors affecting retention.
- Impact of Technology Adoption and AI in Selection Processes: Investigate and assess the impact of technology adoption, specifically artificial intelligence, on personnel selection processes. This would involve developing a technology acceptance model (TAM) tailored to the employee context, identifying the factors influencing its adoption and how they affect the efficiency and effectiveness of selection processes. Additionally, exploring the implementation of training and development programs to ensure all employees are proficient in effectively using these technologies. This line of research is crucial to ensure that technology adoption, especially in the realm of human resources, is beneficial and equitable for all employees, contributing to optimizing talent management and decision-making in organizations.
Each of these future works represents a valuable direction to delve deeper into the field of employee retention and data-driven decision-making in the business domain. Each has the potential to generate more advanced and applicable knowledge and tools to optimize human resource management and enhance organizational performance.
Author Contributions
Conceptualization, G.M.D.; methodology, G.M.D.; software, G.M.D. and J.J.G.H.; validation, G.M.D., J.J.G.H. and J.L.G.S.; formal analysis, G.M.D.; investigation, G.M.D.; resources, G.M.D.; data curation, G.M.D.; writing—original draft preparation, G.M.D.; writing—review and editing, G.M.D., J.J.G.H. and J.L.G.S.; visualization, G.M.D.; supervision, G.M.D., J.J.G.H. and J.L.G.S.; project administration, G.M.D. All authors have read and agreed to the published version of the manuscript.
Funding
This research received no external funding.
Data Availability Statement
Publicly accessible datasets were utilized for the analysis in this study. The data source can be accessed via the following link: https://www.kaggle.com/pavansubhasht/ibm-hr-analytics-attrition-dataset (accessed on 8 January 2022).
Conflicts of Interest
The authors declare no conflict of interest.
References
- Rughoobur-Seetah, S. The Unprecedented Lockdown: The consequences of job loss. Zagreb Int. Rev. Econ. Bus. 2021, 24, 1–23. [Google Scholar] [CrossRef]
- Serenko, A. The Great Resignation: The great knowledge exodus or the onset of the Great Knowledge Revolution? J. Knowl. Manag. 2023, 27, 1042–1055. [Google Scholar] [CrossRef]
- Randstad Research. Informe de rotación laboral en España. Randstad Res. 2022. Available online: https://www.randstadresearch.es/informe-rotacion-2022/ (accessed on 1 September 2023).
- Marín Díaz, G.; Galán, J.J.; Carrasco, R.A. XAI for Churn Prediction in B2B Models: A Use Case in an Enterprise Software Company. Mathematics 2022, 10, 3896. [Google Scholar] [CrossRef]
- Linardatos, P.; Papastefanopoulos, V.; Kotsiantis, S. Explainable ai: A review of machine learning interpretability methods. Entropy 2021, 23, 18. [Google Scholar] [CrossRef]
- Mishra, D. Review of literature on factors influencing attrition and retention. Int. J. Organ. Behav. Manag. Perspect. 2013, 2, 435–445. [Google Scholar]
- Colomo-Palacios, R.; Casado-Lumbreras, C.; Misra, S.; Soto-Acosta, P. Career Abandonment Intentions among Software Workers. Hum. Factors Ergon. Manuf. Serv. Ind. 2014, 24, 641–655. [Google Scholar] [CrossRef]
- Climek, M.; Henry, R.; Jeong, S. Integrative literature review on employee turnover antecedents across different generations: Commonalities and uniqueness. Eur. J. Train. Dev. 2022. ahead of print. [Google Scholar] [CrossRef]
- Saradhi, V.V.; Palshikar, G.K. Employee churn prediction. Expert Syst. Appl. 2011, 38, 1999–2006. [Google Scholar] [CrossRef]
- Fallucchi, F.; Coladangelo, M.; Giuliano, R.; De Luca, E.W. Predicting Employee Attrition Using Machine Learning Techniques. Computers 2020, 9, 86. [Google Scholar] [CrossRef]
- Srivastava, P.R.; Eachempati, P. Intelligent Employee Retention System for Attrition Rate Analysis and Churn Prediction: An Ensemble Machine Learning and Multi- Criteria Decision-Making Approach. J. Glob. Inf. Manag. 2021, 29, 1–29. [Google Scholar] [CrossRef]
- Jain, N.; Tomar, A.; Jana, P.K. A novel scheme for employee churn problem using multi-attribute decision making approach and machine learning. J. Intell. Inf. Syst. 2021, 56, 279–302. [Google Scholar] [CrossRef]
- Khera, S.N. Divya Predictive Modelling of Employee Turnover in Indian IT Industry Using Machine Learning Techniques. Vis. J. Bus. Perspect. 2019, 23, 12–21. [Google Scholar] [CrossRef]
- Yahia, N.B.; Hlel, J.; Colomo-Palacios, R. From Big Data to Deep Data to Support People Analytics for Employee Attrition Prediction. IEEE Access 2021, 9, 60447–60458. [Google Scholar] [CrossRef]
- Jain, P.K.; Jain, M.; Pamula, R. Explaining and predicting employees’ attrition: A machine learning approach. SN Appl. Sci. 2020, 2, 757. [Google Scholar] [CrossRef]
- Najafi-Zangeneh, S.; Shams-Gharneh, N.; Arjomandi-Nezhad, A.; Zolfani, S.H. An Improved Machine Learning-Based Employees Attrition Prediction Framework with Emphasis on Feature Selection. Mathematics 2021, 9, 1226. [Google Scholar] [CrossRef]
- Raza, A.; Munir, K.; Almutairi, M.; Younas, F.; Fareed, M.M.S. Predicting Employee Attrition Using Machine Learning Approaches. Appl. Sci. 2022, 12, 6424. [Google Scholar] [CrossRef]
- Ozmen, E.P.; Ozcan, T. A novel deep learning model based on convolutional neural networks for employee churn prediction. J. Forecast. 2022, 41, 539–550. [Google Scholar] [CrossRef]
- Pratt, M.; Boudhane, M.; Cakula, S. Employee Attrition Estimation Using Random Forest Algorithm. Balt. J. Mod. Comput. 2021, 9, 49–66. [Google Scholar] [CrossRef]
- Mansor, N.; Sani, N.S.; Aliff, M. Machine Learning for Predicting Employee Attrition. Int. J. Adv. Comput. Sci. Appl. 2021, 12, 435–445. [Google Scholar] [CrossRef]
- Alsheref, F.K.; Fattoh, I.E.; Ead, W.M. Automated Prediction of Employee Attrition Using Ensemble Model Based on Machine Learning Algorithms. Comput. Intell. Neurosci. 2022, 2022, 7728668. [Google Scholar] [CrossRef]
- Al-Darraji, S.; Honi, D.G.; Fallucchi, F.; Abdulsada, I.A.; Giuliano, R.; Abdulmalik, H.A. Employee Attrition Prediction Using Deep Neural Networks. Computers 2021, 10, 141. [Google Scholar] [CrossRef]
- Wang, P.; Shi, T.; Reddy, C.K. A Novel Tensor-Based Temporal Multi-Task Survival Analysis Model. IEEE Trans. Knowl. Data Eng. 2021, 33, 3311–3322. [Google Scholar] [CrossRef]
- Guerranti, F.; Dimitri, G.M. A Comparison of Machine Learning Approaches for Predicting Employee Attrition. Appl. Sci. 2023, 13, 267. [Google Scholar] [CrossRef]
- Naz, K.; Siddiqui, I.F.; Koo, J.; Khan, M.A.; Qureshi, N.M.F. Predictive Modeling of Employee Churn Analysis for IoT-Enabled Software Industry. Appl. Sci. 2022, 12, 10495. [Google Scholar] [CrossRef]
- Jain, N.; Jana, P.K. XRRF: An eXplainable Reasonably Randomised Forest algorithm for classification and regression problems br. Inf. Sci. 2022, 613, 139–160. [Google Scholar] [CrossRef]
- Liu, J.; Ng, Y.C.; Gui, Z.; Singhal, T.; Blessing, L.T.M.; Wood, K.L.; Lim, K.H. Title2Vec: A contextual job title embedding for occupational named entity recognition and other applications. J. Big Data 2022, 9, 99. [Google Scholar] [CrossRef]
- Bandyopadhyay, N.; Jadhav, A. Churn Prediction of Employees Using Machine Learning Techniques. Teh. Glas. J. 2021, 15, 51–59. [Google Scholar] [CrossRef]
- Alshiddy, M.S.; Aljaber, B.N. Employee Attrition Prediction using Nested Ensemble Learning Techniques. Int. J. Adv. Comput. Sci. Appl. 2023, 14, 932–938. [Google Scholar] [CrossRef]
- Vergnolle, G.; Lahrichi, N. Data-Driven Analysis of Employee Churn in the Home Care Industry. Home Health CARE Manag. Pract. 2023, 35, 75–85. [Google Scholar] [CrossRef]
- Chung, D.; Yun, J.; Lee, J.; Jeon, Y. Predictive model of employee attrition based on stacking ensemble learning. Expert Syst. Appl. 2023, 215, 119364. [Google Scholar] [CrossRef]
- Abhiraj, N.; Deepa, N. Effective comparison of logistic regression and support vector machine classifier to predict enhanced employee attrition for increasing accuracy of non-numerical data. Int. J. Early Child. Spec. Educ. 2022, 14, 5587–5596. [Google Scholar]
- Chaudhary, M.; Gaur, L.; Jhanjhi, N.Z.; Masud, M.; Aljahdali, S. Envisaging Employee Churn Using MCDM and Machine Learning. Intell. Autom. Soft Comput. 2022, 33, 1009–1024. [Google Scholar] [CrossRef]
- Dhanalakshmi, R.V.; Tiwari, R.; Misra, S.; Punniyamoorthy, R. Understanding Employee Attrition-An Organizational Change Perspective-using Predictive Analysis Techniques. J. Coast. Life Med. 2022, 10, 612–618. [Google Scholar]
- Vanegas, J.M.A.; Wine, W.; Drasgow, F. Predictions of attrition among US Marine Corps: Comparison of four predictive methods. Mil. Psychol. 2022, 34, 147–166. [Google Scholar] [CrossRef]
- Sekaran, K.; Shanmugam, S. Interpreting the Factors of Employee Attrition using Explainable AI. In Proceedings of the 2022 International Conference on Decision Aid Sciences and Applications (DASA), Chiangrai, Thailand, 23–25 March 2022; pp. 932–936. [Google Scholar] [CrossRef]
- Molnar, C. Interpretable Machine Learning. A Guide for Making Black Box Models Explainable. Book. 2019, p. 247. Available online: https://christophm.github.io/interpretable-ml-book (accessed on 1 September 2023).
- Ribeiro, M.T.; Singh, S.; Guestrin, C. Anchors: High-precision model-agnostic explanations. In Proceedings of the 32nd Proceedings of the AAAI Conference on Artificial Intelligence, New Orleans, LA, USA, 2–7 February 2018; pp. 1527–1535. [Google Scholar] [CrossRef]
- Lundberg, S.M.; Lee, S.I. A unified approach to interpreting model predictions. Adv. Neural Inf. Process. Syst. 2017, 2017, 4766–4775. [Google Scholar]
- Friedman, J. Greedy Function Approximation: A Gradient Boosting Machine. Ann. Stat. 2001, 29, 1189–1232. [Google Scholar] [CrossRef]
- Goldstein, A.; Kapelner, A.; Bleich, J.; Pitkin, E. Peeking Inside the Black Box: Visualizing Statistical Learning With Plots of Individual Conditional Expectation. J. Comput. Graph. Stat. 2015, 24, 44–65. [Google Scholar] [CrossRef]
- Hassija, V.; Chamola, V.; Mahapatra, A.; Singal, A.; Goel, D.; Huang, K.; Scardapane, S.; Spinelli, I.; Mahmud, M.; Hussain, A. Interpreting Black-Box Models: A Review on Explainable Artificial Intelligence. Cognit. Comput. 2023, 2023, 1–30. [Google Scholar] [CrossRef]
- Shafique, U.; Qaiser, H. A Comparative Study of Data Mining Process Models (KDD, CRISP-DM and SEMMA). Int. J. Innov. Sci. Res. 2014, 12, 217–222. [Google Scholar]
- Kaggle HR Analytic Data Set. Available online: https://www.kaggle.com/pavansubhasht/ibm-hr-analytics-attrition-dataset (accessed on 14 July 2023).
- Kaufman, S.; Rosset, S.; Perlich, C.; Stitelman, O. Leakage in data mining: Formulation, detection, and avoidance. ACM Trans. Knowl. Discov. Data 2012, 6, 1–21. [Google Scholar] [CrossRef]
- Kamiran, F.; Calders, T. Data Preprocessing Techniques for Classification without Discrimination. Knowl. Inf. Syst. 2012, 33, 1–33. [Google Scholar] [CrossRef]
- Alasadi, S.A.; Bhaya, W.S. Review of Data Preprocessing Techniques. J. Eng. Applie Sci. 2017, 12, 4102–4107. [Google Scholar]
- Carvalho, D.V.; Pereira, E.M.; Cardoso, J.S. Machine learning interpretability: A survey on methods and metrics. Electron. 2019, 8, 832. [Google Scholar] [CrossRef]
- Lipton, Z.C. The mythos of model interpretability. Commun. ACM 2018, 61, 35–43. [Google Scholar] [CrossRef]
- Letham, B.; Rudin, C.; McCormick, T.H.; Madigan, D. Interpretable classifiers using rules and bayesian analysis: Building a better stroke prediction model. Ann. Appl. Stat. 2015, 9, 1350–1371. [Google Scholar] [CrossRef]
- Ribeiro, M.T.; Singh, S.; Guestrin, C. “Why Should I Trust You?” Explaining the Predictions of Any Classifier. In Proceedings of the 2016 Conference of the North American Chapter of the Association for Computational Linguistics: Demonstrations, San Diego, CA, USA, 12–17 June 2016; pp. 97–101. [Google Scholar] [CrossRef]
- Lou, Y.; Caruana, R.; Gehrke, J.; Hooker, G. Accurate intelligible models with pairwise interactions. In Proceedings of the 19th ACM SIGKDD International Conference on Knowledge Discovery and Data Mining, Chicago, IL, USA, 11–14 August 2013; Part F1288. pp. 623–631. [Google Scholar] [CrossRef]
- Breiman, L. Stacked regressions. Mach. Learn. 1996, 24, 49–64. [Google Scholar] [CrossRef]
- Breiman, L. Random Forests. Mach. Learn. 2001, 45, 5–32. [Google Scholar] [CrossRef]
- Alvarez-Melis, D.; Jaakkola, T.S. On the Robustness of Interpretability Methods. arXiv 2018, arXiv:1806.08049. [Google Scholar]
- Fisher, A.; Rudin, C.; Dominici, F. All models are wrong, but many are useful: Learning a variable’s importance by studying an entire class of prediction models simultaneously. J. Mach. Learn. Res. 2019, 20, 177. [Google Scholar]
- Lundberg, S.M.; Erion, G.G.; Lee, S.-I. Consistent Individualized Feature Attribution for Tree Ensembles. arXiv 2018, arXiv:1802.03888. [Google Scholar]
- Wang, C.; Deng, C.; Wang, S. Imbalance-XGBoost: Leveraging weighted and focal losses for binary label-imbalanced classification with XGBoost. Pattern Recognit. Lett. 2020, 136, 190–197. [Google Scholar] [CrossRef]
- Batista, G.E.A.P.A.; Bazzan, A.L.C.; Monard, M.C. Balancing Training Data for Automated Annotation of Keywords: A Case Study. In Proceedings of the II Brazilian Workshop on Bioinformatics, Macaé, Brazil, 3–5 December 2003; pp. 35–43. [Google Scholar]
- Altmann, A.; Toloşi, L.; Sander, O.; Lengauer, T. Permutation importance: A corrected feature importance measure. Bioinformatics 2010, 26, 1340–1347. [Google Scholar] [CrossRef] [PubMed]
- Koch, M.J.; Mcgrath, R.G. I- Resource Management Policies do Malter. Strateg. Manag. J. Manag. 1996, 17, 335–354. [Google Scholar]
- Saaty, T.L. The Analytic Hierarchy Process: Planning, Priority Setting, Resource Allocation LK; McGraw-Hill International Book Co.: New York, NY, USA, 1980; p. SE-Xiii. 287p, ISBN 0070543712/9780070543713. Available online: https://ucm.on.worldcat.org/oclc/911278091 (accessed on 11 September 2023).
Figure 1.
Publications (599) and citations. TS = (ATTRITION OR ABANDONMENT OR CHURN) AND TS = (EMPLOYEE).
Figure 1.
Publications (599) and citations. TS = (ATTRITION OR ABANDONMENT OR CHURN) AND TS = (EMPLOYEE).

Figure 2.
Publications (28) and citations. TS = (ATTRITION OR ABANDONMENT OR CHURN) AND TS = (EMPLOYEE) AND TS = (MACHINE LEARNING OR DEEP LEARNING).
Figure 2.
Publications (28) and citations. TS = (ATTRITION OR ABANDONMENT OR CHURN) AND TS = (EMPLOYEE) AND TS = (MACHINE LEARNING OR DEEP LEARNING).

Figure 3.
Publications (9856) and citations. TS = (XAI OR EXPLAINABLE OR INTERPRETABLE) AND TS = (MACHINE LEARNING OR DEEP LEARNING).
Figure 3.
Publications (9856) and citations. TS = (XAI OR EXPLAINABLE OR INTERPRETABLE) AND TS = (MACHINE LEARNING OR DEEP LEARNING).

Figure 4.
Methodology.

Figure 5.
Interpretability vs. Accuracy.

Figure 6.
Correlation matrix.

Figure 7.
Employee Attrition Yes/No.

Figure 8.
Evaluation of XGBoost predictions, unbalanced data.

Figure 9.
Evaluation of XGBoost predictions with balanced data.

Figure 10.
XGBoost ROC/AUC with balanced data.

Figure 11.
PDP Job Satisfaction vs. Attrition.

Figure 12.
PDP Distance from Home vs. Attrition.

Figure 13.
PDP Monthly Income vs. Attrition.

Figure 14.
PDP Over Time vs. Attrition.

Figure 15.
Local Attrition Prediction (Attrition = ‘No’).

Figure 16.
Local Attrition Prediction (Attrition = ‘Yes’).

Figure 17.
Feature importance (SHAP).

Figure 18.
SHAP prediction (Attrition = ‘No’).

Figure 19.
SHAP prediction (Attrition = ‘Yes’).


Table 1.
Publications by research areas.
| Area | Publications | % |
|---|---|---|
| Business Economics | 247 | 41.24% |
| Computer Science | 100 | 16.69% |
| Education | 97 | 16.19% |
| Psychology | 90 | 15.03% |
| Others | 65 | 10.85% |
Table 2.
Publications, employee attrition prediction.
| Author | Description | Models |
|---|---|---|
| V. V. Saradhi et al., 2011 [9] | Naive Bayes, Support Vector Machine, Decision Tree, Random Forest | EDA, ML Model Comparison |
| F. Fallucchi et al., 2020 [10] | Gaussian Naive Bayes, Logistic Regression, K-Nearest, Decision Tree, Random Forest, Support Vector Machine | EDA, ML Model Comparison |
| P. R. Srivastava et al., 2021 [11] | Random Forest, XGBoost, Deep Neural Network | EDA, ML Model Comparison |
| N. Jain et al., 2021 [12] | Support Vector Machine, Logistic Regression, Decision Tree, Random Forest, XGBoost | EDA, TOPSIS, ML Model Comparison |
| S. N. Khera et al., 2019 [13] | Support Vector Machine | EDA, ML Model |
| N. Ben Yahia et al., 2021 [14] | Support Vector Machine, Decision Tree, Logistic Regression, Random Forest, XGBoost, K-Nearest | EDA, ML Model Comparison, Feature Exploratory Study |
| P. K. Jain et al., 2020 [15] | Support Vector Machine, Decision Tree, Random Forest | EDA, ML Model Comparison |
| S. Najafi-Zangeneh et al., 2021 [16] | Logistic Regression, Random Forest, K-Nearest | EDA, ML Model Comparison |
| A. Raza et al., 2022 [17] | Support Vector Machine, Logistic Regression, Decision Tree Classifier, Extra Trees Classifier | EDA, ML Model Comparison |
| E. P. Ozmen et al., 2022 [18] | Naive Bayes, Decision Tree, Support Vector Machine | EDA, ML Model Comparison |
| M. Pratt et al., 2021 [19] | Random Forest | EDA, ML Model |
| N. Mansor et al., 2021 [20] | Decision Tree, Support Vector Machine, Artificial Neural Networks | EDA, ML Model Comparison |
| F. K. Alsheref et al., 2022 [21] | Multilayer Perceptron Classifier, Random Forest, Gradient Boosting, Ensemble Model, | EDA, ML Model Comparison |
| S. Al-Darraji et al., 2021 [22] | Deep Neural Networks | EDA, ML Model Comparison |
| P. Wang et al., 2021 [23] | Multitask Model | ML Model Comparison |
| F. Guerranti et al., 2023 [24] | Logistic Regression, Classification Trees, Random Forest, Naive Bayes Classifier, Neural Network | EDA, ML Model Comparison |
| P K. Naz et al., 2022 [25] | Support Vector Machine, Decision Tree, Neural Network, Logistic Regression, Random Forest | EDA, ML Model Comparison |
| N. Jain et al., 2022 [26] | Random Forest, Explainability | Explainability Models based on Random Forest |
| J. Liu et al., 2022 [27] | Logistic Regression, Long Short-Term Memory | EDA, ML Models Comparison |
| N. Bandyopadhyay et al., 2021 [28] | Naive Bayes Classifier, Random Forest, Support Vector Machine | EDA, ML Model Comparison |
| M. S. Alshiddy et al., 2023 [29] | Naive Bayes Classifier, Support Vector Machine, Random Forest | EDA, ML Model Comparison |
| G. Vergnolle et al., 2023 [30] | Analysis | EDA |
| D. Chung et al., 2023 [31] | Logistic Regression, Random Forest, XGBoost, Support Vector Machine, Neural Networks | EDA, ML Model Comparison |
| N. Abhiraj et al., 2022 [32] | Logistic Regression, Support Vector Machine | EDA, ML Model Comparison |
| E M. Chaudhary et al., 2022 [33] | Multi-criteria Decision-Making, CatBoost, Support Vector Machine, Decision Tree, Random Forest, XGBoost | EDA, ML Model Comparison |
| U R. V Dhanalakshmi et al., 2022 [34] | Naive Bayes, Support Vector Machine, Decision Tree, Random Forest, Logistic Regression, K-Nearest | EDA, ML Model Comparison |
| J. M. A. Vanegas et al., 2022 [35] | Logistic Regression, Classification Trees, Random Forest | EDA, ML Model Comparison |
| K. Sekaran et al., 2022 [36] | LightGBM, Interpretable ML (SHAP, LIME) | Interpretable Model-Agnostic |
Table 3.
Interpretable methods, studies.
| Author | Models | Description |
|---|---|---|
| Ribeiro et al., 2018 [38] | LIME | Anchors: High-Precision Model-Agnostic Explanations |
| Lundberg et al., 2017 [39] | SHAP | A Unified Approach to Interpreting Model Predictions |
| Friedman, 2001 [40] | PDP, Features Importance | Greedy Function Approximation: A Gradient Boosting Machine |
| Goldstein et al., 2014 [41] | PDP, ICE | Peeking Inside the Black Box: Visualizing Statistical Learning with Plots of Individual Conditional Expectation |
| Hassija et al., 2023 [42] | PDP, ICE, ALE, LIME | Interpreting Black-Box Models: A Review on Explainable Artificial Intelligence |
| Molnar, 2019 [37] | LIME, SHAP, Feature Importance | Interpretable Machine Learning |
Table 4.
Interpretable methods applied.
| Explanation Method | Scope | Group Method |
|---|---|---|
| PDP [41] | Global | Feature Importance Techniques, Visualizations and Plots |
| LIME [51] | Local | Model-Agnostic Approaches, Surrogate Models |
| ELI5 [54] | Global | Feature Importance Techniques |
| SHAP [39] | Local | Model-Agnostic Approaches, Visualizations and Plots |
Table 5.
Dataset IBM HR features.
| Features | |
|---|---|
| Age | Monthly Income |
| Attrition | Monthly Rate |
| Business Travel | Number of Companies Worked |
| Daily Rate | Over18 |
| Department | Over Time |
| Distance from Home | Percent Salary Hike |
| Education | Performance Rating |
| Education Field | Relationship Satisfaction |
| Employee Count | Standard Hours |
| Employee Number | Stock Option Level |
| Environment Satisfaction | Total Working Years |
| Gender | Training Times Last Year |
| Hourly Rate | Work Life Balance |
| Job Involvement | Years at Company |
| Job Level | Years in Current Role |
| Job Role | Years since Last Promotion |
| Job Satisfaction | Years with Current Manager |
| Marital Status | |
Table 6.
Algorithms ML.
| Algorithm | ROC AUC Mean | ROC AUC STD | Accuracy Mean | Accuracy STD | |
|---|---|---|---|---|---|
| 6 | XGBoost | 79.23 | 5.54 | 85.91 | 2.51 |
| 1 | Random Forest | 79.20 | 4.33 | 85.81 | 2.61 |
| 3 | KNN | 66.94 | 5.82 | 84.55 | 2.58 |
| 2 | SVM | 80.78 | 5.15 | 83.87 | 3.04 |
| 4 | Decision Tree Classifier | 65.24 | 6.21 | 80.66 | 2.99 |
| 0 | Logistic Regression | 81.20 | 4.72 | 75.90 | 5.36 |
| 5 | Gaussian NB | 74.63 | 3.21 | 60.32 | 12.47 |
Table 7.
Feature importance, ELI5.
| Weight | Feature |
|---|---|
| 0.0867 ± 0.0119 | OverTime |
| 0.0373 ± 0.0113 | MonthlyIncome |
| 0.0089 ± 0.0072 | DailyRate |
| 0.0056 ± 0.0033 | DistanceFromHome |
| 0.0052 ± 0.0010 | RelationshipSatisfaction |
| 0.0051 ± 0.0015 | JobSatisfaction |
| 0.0047 ± 0.0019 | NumCompaniesWorked |
| 0.0043 ± 0.0029 | MonthlyRate |
| 0.0041 ± 0.0015 | MaritalStatus_Single |
| 0.0041 ± 0.0026 | StockOptionLevel |
| 0.0033 ± 0.0020 | Age |
| 0.0025 ± 0.0016 | EnvironmentSatisfaction |
Disclaimer/Publisher’s Note: The statements, opinions and data contained in all publications are solely those of the individual author(s) and contributor(s) and not of MDPI and/or the editor(s). MDPI and/or the editor(s) disclaim responsibility for any injury to people or property resulting from any ideas, methods, instructions or products referred to in the content. |
© 2023 by the authors. Licensee MDPI, Basel, Switzerland. This article is an open access article distributed under the terms and conditions of the Creative Commons Attribution (CC BY) license (https://creativecommons.org/licenses/by/4.0/).
Share and Cite
MDPI and ACS Style
Marín Díaz, G.; Galán Hernández, J.J.; Galdón Salvador, J.L. Analyzing Employee Attrition Using Explainable AI for Strategic HR Decision-Making. Mathematics 2023, 11, 4677. https://doi.org/10.3390/math11224677
AMA Style
Marín Díaz G, Galán Hernández JJ, Galdón Salvador JL. Analyzing Employee Attrition Using Explainable AI for Strategic HR Decision-Making. Mathematics. 2023; 11(22):4677. https://doi.org/10.3390/math11224677
Chicago/Turabian StyleMarín Díaz, Gabriel, José Javier Galán Hernández, and José Luis Galdón Salvador. 2023. "Analyzing Employee Attrition Using Explainable AI for Strategic HR Decision-Making" Mathematics 11, no. 22: 4677. https://doi.org/10.3390/math11224677
Note that from the first issue of 2016, this journal uses article numbers instead of page numbers. See further details here.