1. Introduction
Functional movement screening (FMS) serves as a crucial tool in the realm of exercise rehabilitation and training, aimed at assessing an individual’s physical function and motion capabilities. By identifying adverse movement patterns or functional deficiencies, FMS offers the opportunity for intervention before exercise, thereby facilitating health management and rehabilitation plans to mitigate the risk of sports-related injuries. However, conventional FMS heavily relies on subjective judgments made by human assessors, leading to inefficiencies and subjective biases, which may not fully align with the needs of athletes and individuals. Consequently, the need to realize a rapid and objective FMS evaluation process is of paramount social importance and practical significance.
In recent years, researchers have introduced a multitude of methods to automate the evaluation of FMS. Hong et al. [
1] utilized a Gaussian mixture model and explored various machine learning techniques, such as naïve Bayes, AdaBoost, M1, and traditional Gaussian models, to address this issue. However, these methods face difficulties in modeling complex human motion patterns, which can lead to a decrease in accuracy. FMS involves coordinated movements of multiple joints, muscles, and body parts. These movements require a comprehensive understanding and accurate grasp of continuous changes in joint angles, speeds, and accelerations [
2]. A comprehensive understanding of these features is crucial for the accurate analysis and assessment of human motion. In a distinct approach, Spilz et al. [
3] harnessed 17 inertial measurement units to gather data, training a neural network consisting of convolutional layers, long-term and short-term memory layers, and fully connected layers to generate FMS scores. While this deep learning method introduces a faster and more objective assessment tool, it exhibits a substantial reliance on training data, leaving room for further enhancements. Wang et al. [
4] adopted skeleton joint points as shared features and leveraged depth sensors in the evaluation process.
Nevertheless, the existing FMS methods are not devoid of limitations. Firstly, some approaches lack well-defined key points, impeding their capacity to fully capture the nuances of entire movements, thus compromising evaluation accuracy. Secondly, certain methods grapple with complexities when modeling intricate human movement patterns, resulting in decreased accuracy. Additionally, current methodologies heavily lean on training data and network structures, posing challenges for optimization and parameter adjustments.
To address the aforementioned shortcomings, this paper introduces an innovative automated evaluation method grounded in the attention mechanism and score distribution prediction. This novel approach leverages the I3D network for video feature extraction, combining the attention mechanism and multilayer perception to acquire the score distribution features of individual movements, thereby elevating evaluation accuracy and reliability. The primary contributions of this paper encompass the effective handling of missing frames through video frame interpolation, the introduction of an I3D network enriched with self-attention mechanisms to enhance evaluation accuracy, and the adoption of a score prediction methodology to comprehensively evaluate FMS based on probability distribution. In summary, the main contributions of the paper are as follows:
We handle the missing frames by means of video frame interpolation based on linear interpolation. Through pixel interpolation, we achieve smooth transitions between image frames and the frame number supplement, which enhances the availability of the dataset.
We propose an I3D network based on the self-attention mechanism to learn the subtle changes in complex action quality assessment (AQA), and apply it to FMS to improve the accuracy of the evaluation results. At the same time, we conducted ablation and comparison experiments on the attention module for this network to verify the effectiveness of the attention mechanism in FMS.
We adopt a score prediction method to convert the label data after the multilayer perceptron into a score distribution and use the Gaussian distribution to compare the loss of the true value and the predicted value of the samples. The prediction score based on the probability distribution can perform FMS more comprehensively.
2. Related Work
2.1. Functional Movement Screening
Functional movement screening (FMS) stands as a vital tool in the assessment of an individual’s motion abilities and potential risks associated with movements, particularly within the context of sports and physical activity. FMS scrutinizes the subject’s stability during movement execution and the flexibility of their joints. This comprehensive evaluation encompasses diverse tests, including deep-squat assessments, hurdle exercises, front and rear split squats, shoulder joint flexibility tests, straight leg raises, trunk stability push-ups, and rotational stability assessments.
The effectiveness of FMS lies in its scoring system, which quantifies the quality and stability of an individual’s movements. Scores are categorized into four levels: 0, 1, 2, and 3. A higher score reflects a superior performance in executing the movements, indicating greater proficiency. It is noteworthy that a score of 0 is assigned if the subject experiences pain during any part of the evaluation, relying on the physical sensations reported by the subjects themselves. Therefore, the scoring system’s other three levels are contingent on the degree and stability of movement execution without discomfort or pain. FMS has proven instrumental in the prevention of sports injuries, with notable applications in a variety of domains.
These insights underscore the instrumental role of FMS as a robust assessment tool with a substantial impact on the prevention and evaluation of sports-related injuries. The adoption of FMS facilitates the development of personalized training plans aimed at enhancing movement proficiency while minimizing the risk of injury. Furthermore, this approach possesses versatile applications spanning diverse sports and specialized environments. However, the conventional FMS scoring methods primarily rely on human adjudicators to assess movement completion and stability. As the volume of subjects increases, this manual scoring process becomes increasingly burdensome, amplifying the probability of judgment errors. The ensuing sections will elucidate a novel and automated approach to FMS evaluation, addressing these limitations and offering a more efficient and objective methodology.
2.2. Video Action Quality Assessment
Video action quality assessment (AQA) serves the fundamental purpose of detecting and evaluating the execution of actions within video content. In methodologies employing quality score-based evaluations, the video under consideration is typically segmented into suitable units at either the clip or the frame level. Subsequently, a feature extraction module is employed to process this segmented data and derive feature vectors that capture pertinent action features. These feature vectors are then utilized as input for regression or classification functions to determine the corresponding quality assessment scores.
In the domain of video action quality assessment, previous efforts have been made to enhance the accuracy and reliability of the evaluation process. Bai et al. [
5] explored the use of a time decoder for AQA; however, limitations arise due to the absence of labeled data, which can impact performance. Gordon [
6] devised a scoring method based on human center trajectory, an approach that has shown promise in small-scale applications but requires further validation in larger-scale scenarios. Li et al.’s key segment extraction system [
7] primarily captures partial scores, a characteristic misaligned with the intricacies of certain sports like diving, where comprehensive assessments are necessary. Tao et al. [
8] introduced a hierarchical classification framework based on the hidden Markov model (HMM). While demonstrating merit, this model grapples with a small dataset, limiting its generalization capabilities. Parmar et al. [
9] employed diverse techniques, including support vector machines, neural networks, and enhanced decision trees, for the classification of physical therapy rehabilitation. However, the paucity of data samples poses a challenge. Meanwhile, Xu et al.’s [
10] proposed multi-scale convolution LSTM network, tailored for figure skating, displays promise. Still, it may encounter significant prediction errors when confronted with complex backgrounds.
2.3. C3D and I3D Architecture
The C3D-LSTM framework, as introduced by previous work [
11], represents an amalgamation of 3D convolutional networks and long-term and short-term memory networks, with a primary focus on predicting video action quality in the context of individual Olympic Games events.
Figure 1 (adapted from [
11]) illustrates the network structure of C3D-LSTM. C3D integrates the power of convolutional neural networks (CNN) with 3D convolutional operations, facilitating spatiotemporal modeling and video data feature extraction. The LSTM model, with its ability to capture long-term dependencies in sequential data, has an advantage in handling time-series data such as videos. At each time step, the LSTM model receives activation features from the C3D network as input, which contain information from individual frames of the video and exist in a more compact representation than independently processing each frame with a CNN [
12]. After each LSTM layer, an FC (fully connected) regression layer can be connected to map the LSTM features to a score. However, for tasks demanding a more intricate and nuanced quality assessment, the network architecture of C3D-LSTM may exhibit limitations in achieving the desired outcomes.
In scenarios necessitating intricate quality assessment, the deployment of deeper and more intricate network structures, such as I3D-LSTM, proves advantageous in capturing critical video quality-related information. Wang et al. [
13] have introduced a network architecture known as I3D-LSTM, showcasing a leading performance on the UCF-101 dataset. The design of the I3D-LSTM network structure revolves around two key components: I3D and LSTM. The initial step entails employing a pre-trained Inception 3D CNN [
14] as a feature extractor, with pre-training conducted on the Kinetics dataset to extract rich spatiotemporal information and semantic features from videos. The I3D network model, stemming from the Inception v1 module of GoogLeNet [
15] through temporal convolution kernel expansion, is adept at parallel processing of feature extraction via multiple branches. Subsequently, the feature vectors derived from I3D are fed into the LSTM network, which excels in capturing temporal dependencies and modeling in video sequences. The LSTM network transforms the I3D output features, generating a high-level temporal feature representation. Lastly, through the incorporation of a Softmax layer, the resulting temporal features facilitate prediction and classification. The I3D-LSTM network structure excels at comprehensive spatiotemporal information and semantic feature extraction from videos, making it well-suited for complex and delicate quality assessment tasks, aligning with the anticipated outcomes.
3. Scheme in This Article
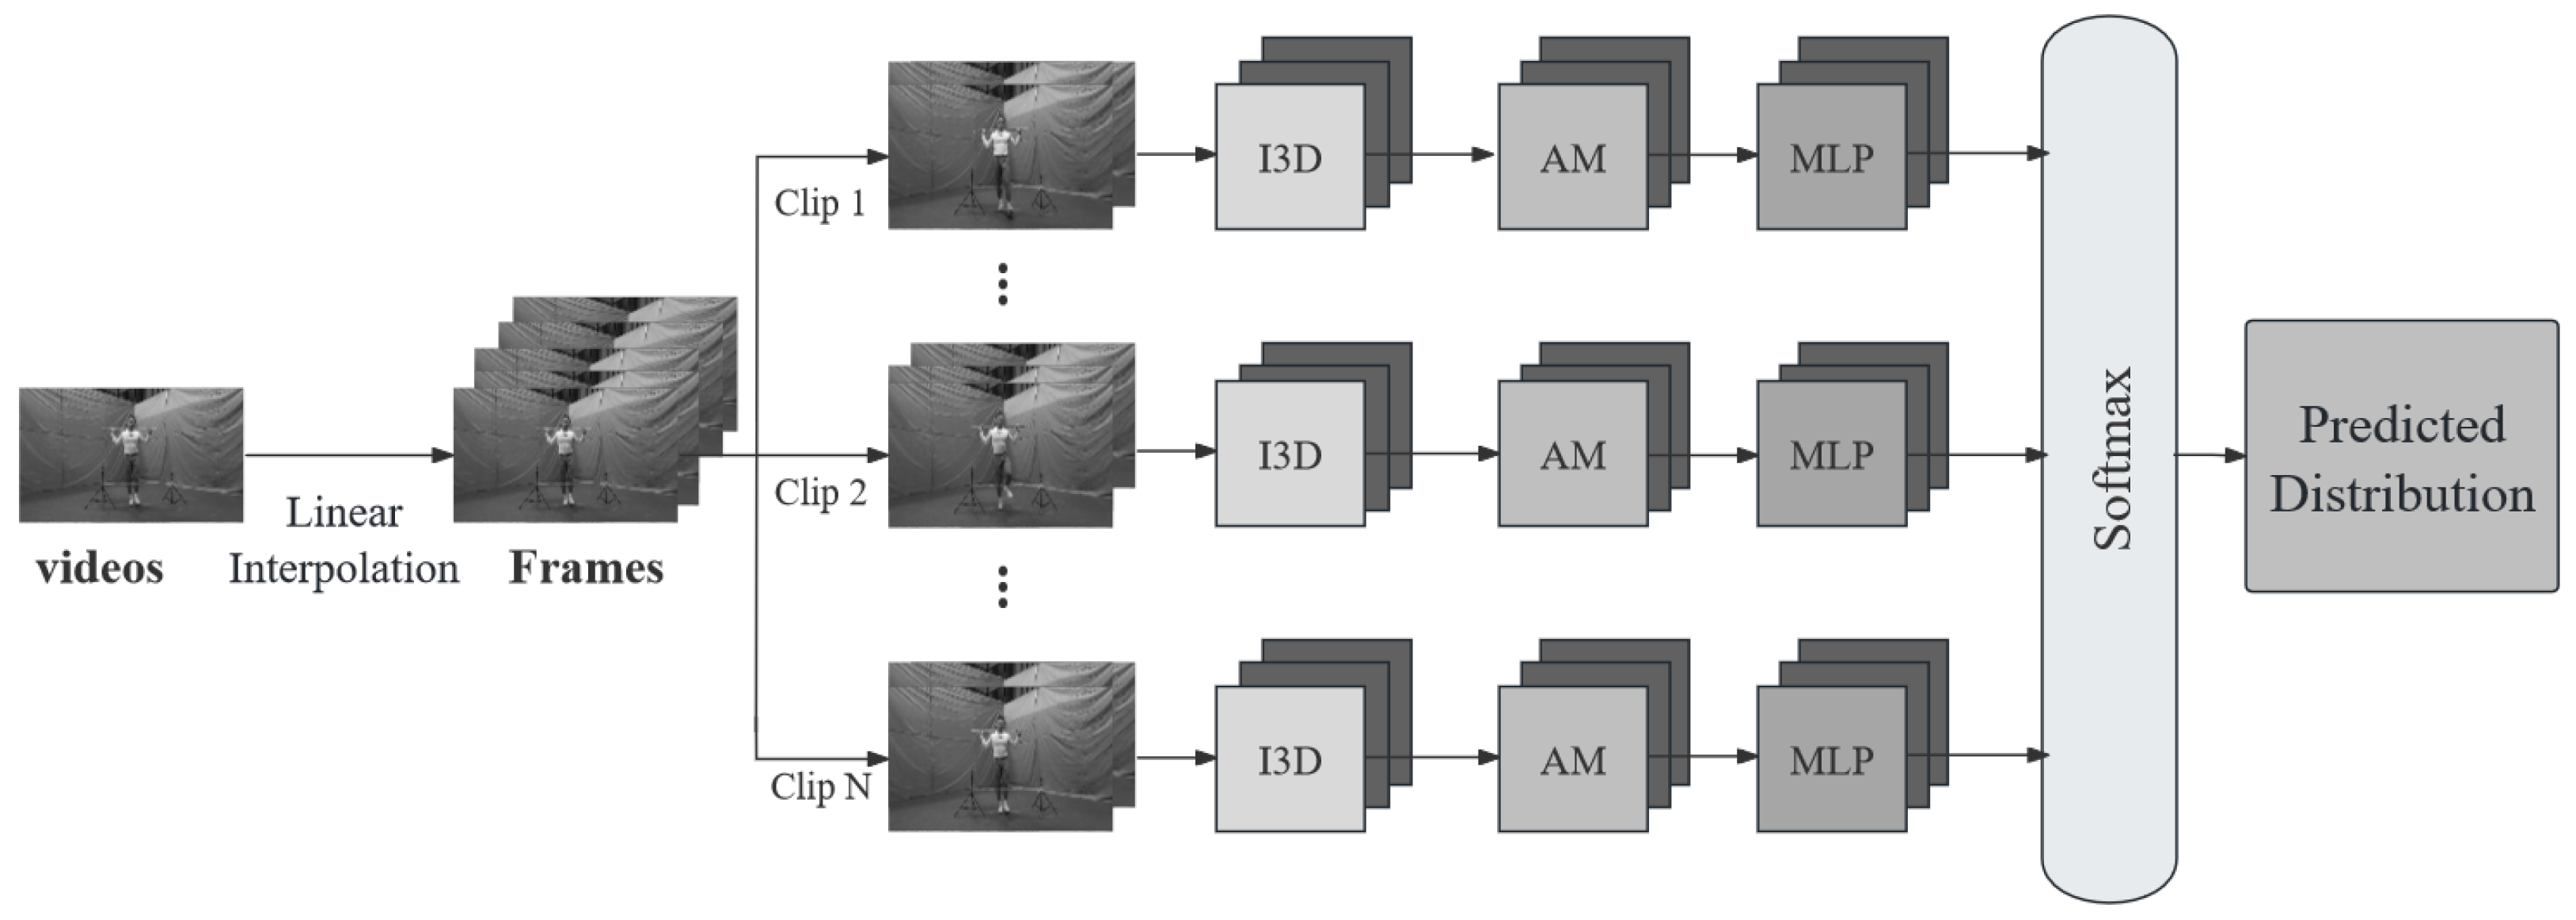
This study presents a comprehensive network model designed for the evaluation of functional movement screening. The model encompasses a three-dimensional initial network, an attention mechanism, and a multilayer perceptron, as depicted in
Figure 2. To begin, the irregular dataset undergoes processing via linear interpolation, ensuring a uniform time dimension for the input data. Subsequently, the I3D network takes a sequence of video frames as input, effectively considering both temporal and spatial features through 3D convolution operations. The I3D network’s inherent capacity for feature extraction at varying scales and levels empowers it to capture the intricate spatiotemporal dependencies and feature expression capabilities within video data.
The subsequent step involves the application of an attention mechanism that adaptively assigns weights to different feature positions, enhancing the model’s sensitivity and its capacity to represent key information. The features, now imbued with improved representation, are then relayed to the multilayer perceptron. This section of the network imparts weight to the input data through multiple fully-connected layers and employs nonlinear activation functions to facilitate the learning of nonlinear data representations. Through the multilayer perceptron, the model engages in a deeper exploration and representation of high-level spatial features inherent in the video data. Finally, the model conducts Softmax operations on the features generated by the multilayer perceptron, yielding a predicted distribution that signifies the model’s analytical insights and learning from the input videos. This predicted distribution provides a measure of the model’s confidence in various categories.
In essence, the proposed comprehensive network model combines the strengths of 3D convolutional operations, attention mechanisms, and multilayer perceptrons to yield a holistic approach to functional movement screening evaluation. This approach leverages spatiotemporal information, feature representation, and adaptive weighting to enhance the model’s understanding and prediction capabilities, offering a robust solution for video-based assessment tasks.
3.1. Data Preprocessing
In FMS data, there are some cases where the number of video frames does not meet the requirements of the model, resulting in the failure to obtain effective features. To solve this problem, this scheme uses a video frame interpolation based on linear interpolation to interpolate between adjacent frames, generating the additional interpolate frames. It ensures that the motion and movements from the original video are preserved in the interpolated frames. By approximating the motion trajectories between frames through linear interpolation, not only does it maintain overall temporal consistency of the video, but it also has higher efficiency compared to optical flow-based and deep learning-based frame interpolation methods. It effectively preserves the motion and actions in FMS videos while minimizing the generation of erroneous motion information.
Firstly, two adjacent frames are selected as the starting and ending points of the interpolation. Using linear interpolation techniques, a series of equidistant interpolation frames are generated between these two frames. The interpolation frames can be achieved by weighted summation of adjacent two frames of images. The method is as follows:
a represents the interpolation factor. By adjusting the size of the interpolation factor, the weighting ratio between two values can be controlled. and represent the value to be interpolated, and the value of two adjacent pictures. Specifically, in video interpolation, the value can represent the pixel value of the image or video frame, and the color component value or other feature values that need to be interpolated. If the interpolation is performed at the pixel level, the value can represent the value of the image in each RGB color channel. If the interpolation is performed at the feature level, the value can represent the coordinates of the feature points, i.e., the feature vectors. The value used in the preprocessing here is the interpolation of pixel level, which weights each pixel in the previous and next frames to obtain a new frame. It can achieve a smooth transition between image frames and supplement the number of frames.
3.2. Feature Extraction
In the feature extraction section, a comprehensive network model is used to address the limitations of traditional 2D CNN in extracting video features. The backbone network of this model selects the I3D model, which extends 2D convolution operations to 3D convolution operations while considering the time and space dimensions of the video. The I3D model divides the video into a series of consecutive video frames and processes them through an RGB feature flow. In the feature flow, each video frame extracts the space features through the convolution operations, and then fuses and transmits them over time to model the temporal information in the video. The structure of the I3D network is shown in
Figure 3, where the Inc. module is the expanded Inception 3D module.
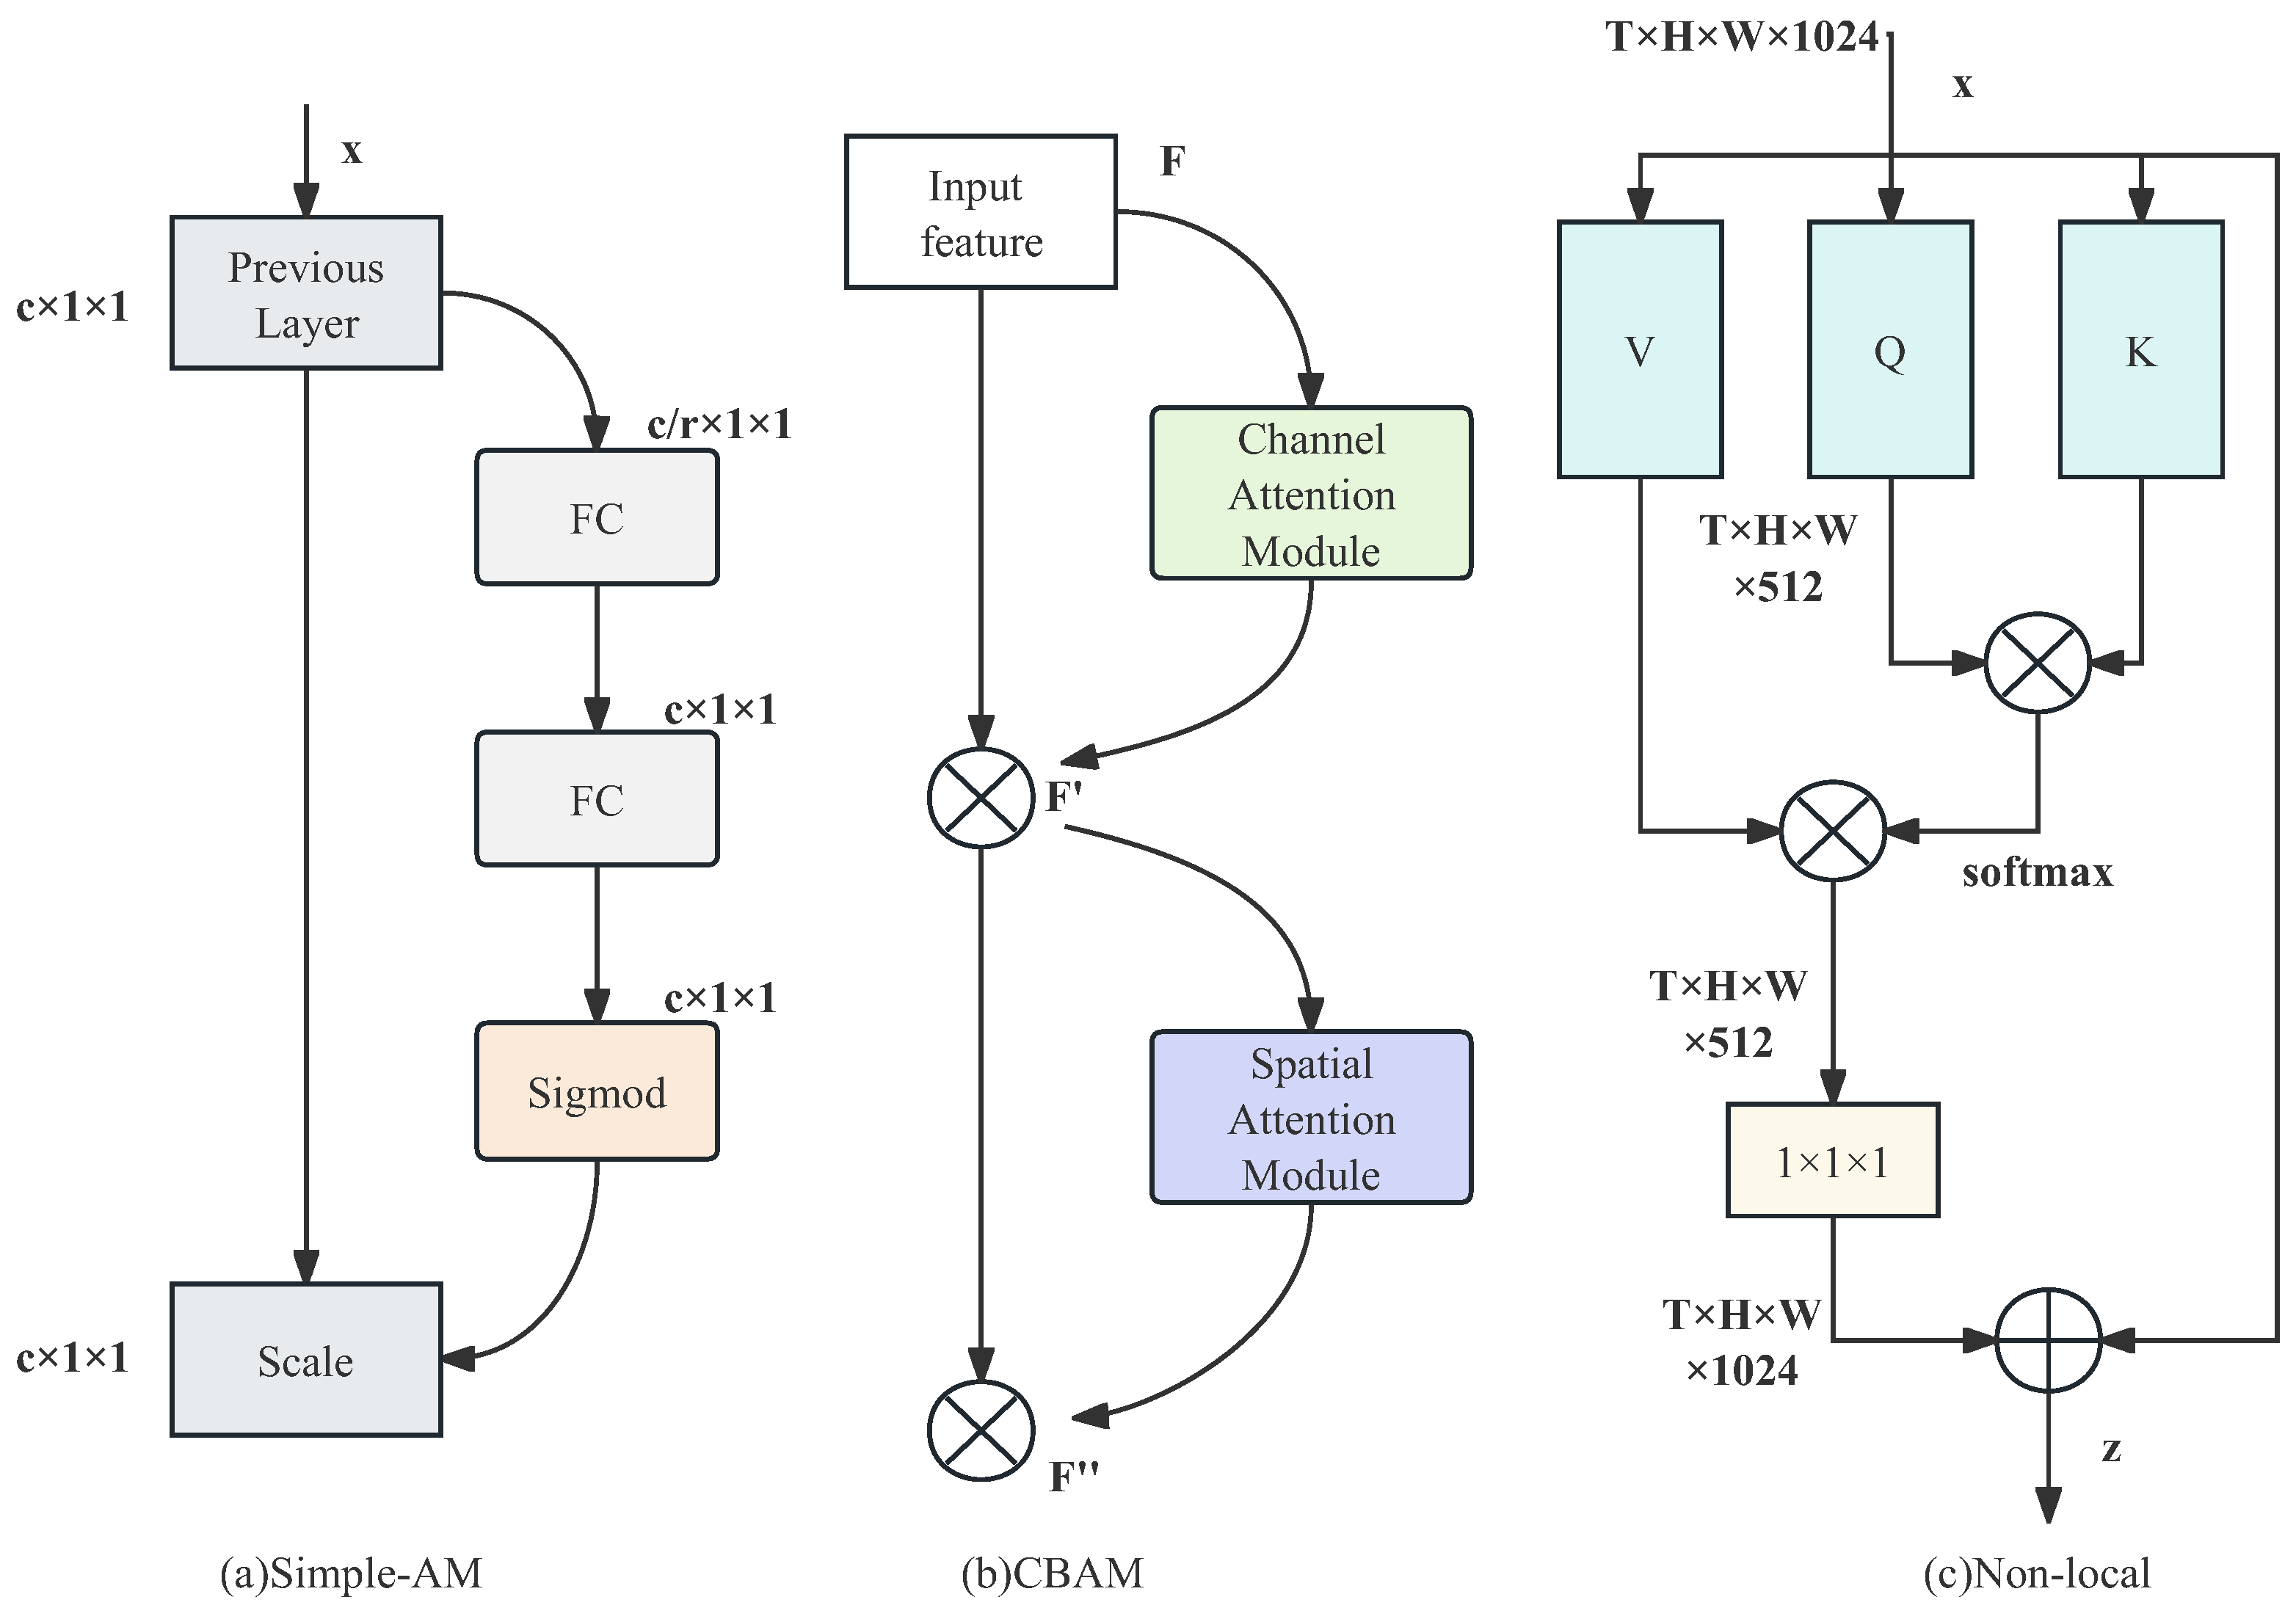
To further capture key features in the video, this paper introduces three attention mechanism modules. By employing attention, dependencies between channels are captured, and the learned attention weights are normalized and weighted onto each channel feature. The introduction of attention mechanisms enables the model to learn action features for each score in the input data and prominently reflect these features in subsequent MLP layers. This helps enhance the model’s learning ability for motion information in the input data, achieve weighted processing of video features, and enable the model to extract and utilize relevant information more effectively. As a result, the algorithm’s performance is improved. The attention mechanism is shown in
Figure 4.
Figure 4a illustrates Simple-AM, a simple yet effective version of attention mechanism derived from the adjustment of the SE attention mechanism [
16]. This attention module is capable of adaptively focusing on specific parts or elements of the data, thereby enhancing the model’s sensitivity and representation capacity for video information.
Figure 4b showcases CBAM [
17], which consists of two sub-modules, namely the channel attention module (CAM) and the spatial attention module (SAM). CAM performs attention on the channel dimension, while SAM focuses on spatial attention. This design not only saves parameters and computational resources but also allows for CBAM to be easily integrated as a plug-and-play module into existing network architectures.
Figure 4c represents the non-local attention mechanism [
18]. The proposed non-local operations capture long-range dependencies by directly computing interactions between arbitrary positions, rather than being limited to neighboring points. It can be viewed as constructing a convolutional kernel with the same size as the feature map, thereby maintaining more information. Non-local attention has demonstrated significant performance improvements in video classification tasks.
Finally, the MLP model is used to improve the advanced features of the modeled videos. MLP is a multilayer feedforward neural network used to learn nonlinear representations of data. In the model, the features learned by the underlying I3D model are transmitted to the MLP network. Through the weighted summation of multiple fully connected layers and nonlinear activation function processing, MLP can further learn and represent the advanced space features of the videos. This process helps to better understand the motion function in the video, and enhances the discrimination of individual movement differences.
As shown in
Figure 5, the attention mechanism module first compresses and motivates the input through blocks, enhancing the model’s attention to different parts of the input data. Subsequently, the features are transmitted through a series of linear and ReLU layers to learn nonlinear representations. Finally, the predicted distribution is obtained through linear and Softmax layers. Formula (
2) is the Softmax activation function. Given the input vector
, each element
is converted into
, where
e is the base number of the natural logarithm (Euler Number) and the output
represents the probability of
i-th category of the output.
The comprehensive network integrating the I3D model, the AM, and the MLP model can process the video features effectively and play an important role in the evaluation of functional movement screening. It can simultaneously capture the low-level motion features and model the advanced space features. The introduction of the attention mechanism module enables the model to focus on the motion changes in the data, which improves the model’s performance and generalization ability. Learning nonlinear representation, the MLP model further improves the ability to represent video features. These components work together to enable the comprehensive network to accurately evaluate movement function and provide important information about an individual’s motion ability.
4. Score Prediction
Video action quality assessment is different from image recognition in that each of the two adjacent frames has similar image features. Therefore, when processing the features learned by both I3D and MLP models, introducing uncertainty into the scoring process can better capture changes and fluctuations in action quality, which can provide more accurate and reliable scoring results.
4.1. Gaussian Distribution of Initial Data
In the last fully connected layer of the algorithm structure in
Figure 2, four outputs are set, representing four levels that meet the FMS scoring standards. In the phase of data preprocessing, the label data are converted into a score distribution, and the Gaussian function is used to process it.
represent the probability density value. m is the number of categories. is the normalized probability value.
4.2. Kullback–Leibler Divergence
After passing through the last fully connected layer of the MLP model, the dimension of the feature output is
m, where
m is the total number of categories. Using the Softmax layer, the output values are converted into the probability distribution scores, i.e.,
. In the process of optimizing neural network parameters through backpropagation, KL divergence is used to measure the difference between two probability distributions. Formula (
5) represents the calculation of KL divergence.
When making predictions, the value with the highest probability in the prediction score is selected to determine the final prediction category. The final prediction result can be determined by the index corresponding to this probability value.
5. Experiment
5.1. Data and Experimental Environment
The dataset used in this paper was constructed by Xing et al. [
19]. It was collected from two Azure Kinect depth cameras, with 45 participants aged 18 to 45. The dataset includes a squat test, hurdle stands, front and rear split squats, shoulder joint flexibility, straight leg up, trunk stable push-ups, rotational stability, and other movements. Each action is divided into left and right sides. Using this dataset, we find that there are too many videos with a score of 2. In order to achieve better results, we select a dataset of 8 movements, that is, M01, M03, M05, M07, M09, M11, M12, and M14. Only the left side of the body was analyzed.
The experiment was run on the server provided by AutoDL Computing Cloud. The operating environment was a 32 vCPU AMD EPYC 9654 96-Core Processor, with 120 G memory. GPU is RTX 4090(24GB) * 2, PyTorch is 1.10.0, and python is 3.8 (ubuntu20.04).
Table 1 describes the composition structure of the dataset for each action, including the training and testing sets of the action, as well as the composition of each action on 1, 2, and 3 points.
5.2. Evaluation Indicators
The evaluation indicators in this paper include accuracy, macroscopic F1, and the Kappa coefficient. Accuracy is used to predict the effectiveness of the model. Formula (
6) shows the ratio of the number of all correctly predicted samples to the total number of samples.
C is the number of categories,
is the number of
i-th correctly classified samples, and
n is the total number of samples.
Macroscopic F1 (macro_F1): This is used to measure the accuracy of multiple classification problems. The prerequisite for calculating macro_F1 is to calculate F1_Score first. C represents number of categories.
The Kappa coefficient is used to measure consistency and can also be used as an indicator of precision. The difference between Kappa and accuracy is that Kappa can penalize the “bias” of the model, that is, if the number of samples in each category is unbalanced, the model can easily favor large categories and abandon small categories. According to Formula (
8), it can be obtained that:
In Formula (
8),
is the precision and is consistent with Formula (
6).
represents the accidental consistency.
6. Experiment and Result Analysis
6.1. Analysis of Prediction Results
Unless otherwise specified, the AM used in this work defaults to Simple-AM. This paper conducts comparative experiments on a single action between the FMS dataset and the improved Gaussian mixture model (GMM) [
1]. It also conducts comparative experiments with the advanced methods of video action quality evaluation in this paper, verifying that the proposed method can effectively predict the FMS dataset and achieve excellent results. Subsequently, to verify the effectiveness of the attention mechanism module, ablation experiments are conducted.
In this paper, the ratio of the training set to the testing set is 3:1. The train batch size (train_batch_size) of 8 and the test batch (test_batch_size) size of 20 are selected. The number of training iterations is 100. In order to address the uncertainty of learning rate selection, this paper uses the Adam optimizer as a common gradient optimization algorithm. The Adam optimizer combines the characteristics of the momentum method and the adaptive learning rate. It can automatically adjust the learning rate in accordance with the gradient of each parameter, and use the momentum to accelerate the convergence of the model. When calculating the loss value, the KL divergence is used as an indicator to measure the difference between probability distributions predicted by the model. KL divergence can be used to evaluate the gap between the prediction and the actual distribution. The training process is shown in
Figure 5. When the epoch is 38, the model almost reaches its optimal level, with a Kappa coefficient value of approximately 0.85 and an accuracy of 0.9. Overall, the model performs well on FMS.
This paper selects three movements, M01, M03, and M14, for display. As shown in
Figure 6, the model in this paper predicts the probability distributions for action videos.
Figure 6a,
Figure 6b, and
Figure 6c, respectively, represent the original video, the predicted probability distribution of the video, and the true probability distribution of the video. In M01, the probability distribution with a result of 2 points is the highest; therefore, the model predicts it to be 2 points. The model will calculate KL divergence according to the probability distribution of the true score, perform the backpropagation, and optimize the parameters.
6.2. Analysis of Comparative Experiments
(1) Comparative Experiment for a Single Movement
In order to verify the effect of the I3D-AM-MLP method proposed in this paper, the comparative experiment for a single movement is analyzed. The evaluation indicator is accuracy. The predicted results of three scores for a single movement are shown in
Table 2.
According to the analysis in
Table 2, the average accuracy of the I3D-AM-MLP model is
higher than that of the improved GMM model. In addition, in the test of single movements (such as M01, M09, M12, and M14), the method proposed in this paper shows an excellent performance, and the accuracy of some movements can even reach
. This result further proves the superiority of this method. The experimental results indicate that the I3D-AM-MLP model has a better performance in action recognition tasks and provides higher accuracy. Thanks to the attention mechanism and multilayer perceptron introduced in this model, the model can better capture the information of movements and perform accurate classification.
From
Table 1 and
Table 2, it can be analyzed that the model in this paper can achieve good accuracy in an unbalanced data environment, which reflects that the model is effective on this dataset. However, there are also situations in which the results are not satisfactory, such as M14, where the accuracy rate is 0. As the number of samples with scores of 1 and 3 in M14 is too small, the feature extraction on the samples with scores of 1 and 3 is insufficient, resulting in poor prediction results. From
Table 1, it is found that the number of samples in M03 is relatively balanced, which can serve as a good example for automatically scoring a single movement. The accuracies of these samples are, respectively,
,
, and
higher than those of the Improved GMM model.
(2) Comparative Experiment for the Overall Data
In this paper, the superiority of this method is verified by comparing it with the advanced video quality assessment algorithms in terms of the FMS dataset. As shown in
Figure 7a–d respectively represent the C3D-LSTM, I3DLSTM, I3D-MLP I3D-AM-MLP models. The x-axis Epoch of the coordinate graph represents the training frequency of all the samples in the training set, while the y-axis represents the corresponding value of evaluation indicators such as Kappa, Accuracy, and Loss. The model begins to converge in the 32nd round and reaches the optimum in the 64th round of the training process. At this time, Kappa and Accuracy are, respectively, 0.91 and 0.94. From the figure, it can be seen that the method using I3D as the backbone network has a fast fitting speed during training. The method using C3D as the backbone network has a slow fitting speed. It indicates that using a more complex network like I3D can better extract the spatiotemporal features of FMS. Compared to I3D-LSTM and I3D-MLP, the model proposed in this paper shows more stable changes in evaluation indicators during the training.
As shown in
Figure 8, the x-axis represents the predicted score, and the y-axis represents the true score. The sum of each row is the true number of samples. From the results of these four models, using I3D as the backbone network to extract features can improve the accuracy of the test. The accuracies of the four models are not high in action evaluation with a score of 2. As for the actions with scores of 1 and 3, the accuracy of the model in this paper is
and
, respectively. This model is closer to the real value than the other three advanced methods. Generally speaking, the model proposed in this paper is better than the above three advanced methods.
The final experimental results of each model are further compared in
Table 3. Compared with I3D-MLP, the method in this paper has improved the Accuracy index by
and improved the maF1 and Kappa indexes by
and
. These results show that the method proposed in this paper has good performance and superiority on FMS datasets.
6.3. Analysis of Ablation Experiments
In this paper, the contribution of the attention mechanism to model performance is studied through ablation experiments. The attention mechanism adjusts the importance of different parts by assigning weights, making the model pay less attention to edge information while focusing on specific image regions. As shown in
Table 4, under the same number of MLP layers, the models with the attention mechanism increased the Kappa coefficient by
,
, and
compared to those without the attention mechanism. This shows that the introduction of an attention mechanism has a significant positive impact on the performance of the model. Specifically, when the number of MLP layers is 4 and the attention mechanism module is included, the model reaches the best performance. The accuracy, maF1 and Kappa coefficient of its prediction are
,
, and
. The experimental results indicate that the attention mechanism has played a positive role in improving model performance. By weighting the pixels, the model can better distinguish and focus on the subtle changes in the FMS, thereby improving the classification accuracy and consistency of the model.
This work further compares the impacts of the three mentioned attention mechanisms in the I3D-AM-MLP model. The experiment result is presented in
Table 5. The CBAM mechanism achieves an accuracy of
and an maF1 score of
, which are both
higher than that of the Simple-AM. However, the Kappa coefficient slightly decreases, indicating that CBAM improves precision but compromises a bit on discrimination. In other words, the ability to differentiate between the four levels of actions in the FMS task slightly decreases. On the other hand, the non-local attention mechanism, although more complex compared to Simple-AM, results in a decrease of approximately
in both Accuracy and maF1. This suggests that the effectiveness of the non-local mechanism is relatively mediocre when extracting low-dimensional features from the I3D model. Since the non-local mechanism typically requires more feature dimensions to capture global relationships, it may struggle to effectively model long-range dependencies between features when the input feature dimension is limited.
7. Conclusions
In this paper, a comprehensive network based on an attention mechanism and score distribution prediction, which is superior to some mainstream methods in terms of performance, is introduced for the automatic evaluation of FMS. This algorithm learns the advanced spatiotemporal features of FMS video actions by inputting the data into the I3D model and uses an attention weight mechanism to allow the model to focus on the relevant features of FMS. MLP is used to perform nonlinear transformation and learning on the input data, and the results are mapped to a nonlinear space through the activation function. With the performance being verified on the FMS dataset, the algorithm proposed in this paper shows significant advantages compared with other mainstream methods. It demonstrates the potential application of deep learning in FMS automatic evaluation.
In future research, we will continue to improve the performance of the model on the FMS dataset. The possible research directions include adding more data and annotation information to further improve the generalization ability of the model. In addition, you can try to introduce other deep learning models or improve the structure of existing models to further improve the performance of the FMS automatic evaluation algorithm based on deep learning.
Author Contributions
Conceptualization, X.L.; methodology, T.H., Z.R.; software, G.Z.; experiment and validation, X.Y., C.F. and Z.C.; writing—original draft preparation, X.L. and G.Z.; writing—review and editing, G.Z.; supervision, T.H. All authors have read and agreed to the published version of the manuscript.
Funding
This paper is supported by National Natural Science Foundation of China (62277010), Nature Science Foundation of Fujian Province (2021J011013), Science and Technology Project of Fuzhou Institute of Oceanography (2023F03), Fujian Provincial Health Commission Technology Plan Project (2021CXA001), and Fujian Institute of Education Special Research Project on Training Reform (2023PX-06).
Data Availability Statement
Data in this paper are available from the corresponding authors upon request.
Conflicts of Interest
The authors declare no conflict of interest.
References
- Hong, R.; Xing, Q.; Shen, Y.; Shen, Y. Effective Quantization Evaluation Method of Functional Movement Screening with Improved Gaussian Mixture Model. Appl. Sci. 2023, 13, 7487. [Google Scholar] [CrossRef]
- Debnath, B.; O’brien, M.; Yamaguchi, M.; Behera, A. A review of computer vision-based approaches for physical rehabilitation and assessment. Multimed. Syst. 2022, 28, 209–239. [Google Scholar] [CrossRef]
- Spilz, A.; Munz, M. Automatic Assessment of Functional Movement Screening Exercises with Deep Learning Architectures. Sensors 2022, 23, 5. [Google Scholar] [CrossRef] [PubMed]
- Wang, W.; Wang, C. A skeleton-based method and benchmark for real-time action classification of functional movement screen. Comput. Electr. Eng. 2022, 102, 108151. [Google Scholar]
- Bai, Y.; Zhou, D.; Zhang, S.; Wang, J.; Ding, E.; Guan, Y.; Wang, J. Action quality assessment with temporal parsing transformer. In European Conference on Computer Vision; Springer Nature: Cham, Switzerland, 2022; pp. 422–438. [Google Scholar]
- Gordon, A.S. Automated video assessment of human performance. In Proceedings of the AI-ED, Washington, DC, USA, 16–19 August 1995; p. 2. Available online: https://people.ict.usc.edu/gordon/public_html/publications/AVA.PDF (accessed on 16 August 2023).
- Li, Y.; Chai, X.; Chen, X. Scoringnet: Learning key fragment for action quality assessment with ranking loss in skilled sports. In Proceedings of the Asian Conference on Computer Vision, Perth, Australia, 2–6 December 2018; Springer: Cham, Switzerland, 2018; pp. 149–164. [Google Scholar]
- Tao, L.; Elhamifar, E.; Khudanpur, S.; Hager, G.D.; Vidal, R. Sparse hidden markov models for surgical gesture classification and skill evaluation. In Proceedings of the Information Processing in Computer-Assisted Interventions: Third International Conference, IPCAI 2012, Pisa, Italy, 27 June 2012; Proceedings 3. Springer: Berlin/Heidelberg, Germany, 2012; pp. 167–177. [Google Scholar]
- Parmar, P.; Morris, B.T. Measuring the quality of exercises. In Proceedings of the 2016 38th Annual International Conference of the IEEE Engineering in Medicine and Biology Society (EMBC), Orlando, FL, USA, 16–20 August 2016; IEEE: New York, NY, USA, 2016; pp. 2241–2244. [Google Scholar]
- Xu, C.; Fu, Y.; Zhang, B.; Chen, Z.; Jiang, Y.G.; Xue, X. Learning to score figure skating sport videos. IEEE Trans. Circuits Syst. Video Technol. 2019, 30, 4578–4590. [Google Scholar] [CrossRef]
- Parmar, P.; Tran Morris, B. Learning to score olympic events. In Proceedings of the IEEE Conference on Computer Vision and Pattern Recognition Workshops, Honolulu, HI, USA, 21–26 July 2017; pp. 20–28. [Google Scholar]
- Ye, Y.; Tian, Y. Embedding sequential information into spatiotemporal features for action recognition. In Proceedings of the IEEE Conference on Computer Vision and Pattern Recognition Workshops, Las Vegas, NV, USA, 16–30 June 2016; pp. 37–45. [Google Scholar]
- Wang, X.; Miao, Z.; Zhang, R.; Hao, S. I3d-lstm: A new model for human action recognition. In IOP Conference Series: Materials Science and Engineering; IOP Publishing: Bristol, UK, 2019; Volume 569, p. 032035. [Google Scholar]
- Carreira, J.; Zisserman, A. Quo vadis, action recognition? A new model and the kinetics dataset. In Proceedings of the IEEE Conference on Computer Vision and Pattern Recognition, Honolulu, HI, USA, 21–26 July 2017; pp. 6299–6308. [Google Scholar]
- Szegedy, C.; Liu, W.; Jia, Y.; Sermanet, P.; Reed, S.; Anguelov, D.; Erhan, D.; Vanhoucke, V.; Rabinovich, A. Going deeper with convolutions. In Proceedings of the IEEE Conference on Computer Vision and Pattern Recognition, Boston, MA, USA, 7–12 June 2015; pp. 1–9. [Google Scholar]
- Hu, J.; Shen, L.; Sun, G. Squeeze-and-excitation networks. In Proceedings of the IEEE Conference on Computer Vision and Pattern Recognition, Salt Lake City, UT, USA, 18–23 June 2018; pp. 7132–7141. [Google Scholar]
- Woo, S.; Park, J.; Lee, J.Y.; Kweon, I.S. Cbam: Convolutional block attention module. In Proceedings of the European conference on computer vision (ECCV), Munich, Germany, 8–14 September 2018; pp. 3–19. [Google Scholar]
- Wang, X.; Girshick, R.; Gupta, A.; He, K. Non-local neural networks. In Proceedings of the IEEE Conference on Computer Vision and Pattern Recognition, Salt Lake City, UT, USA, 18–23 June 2018; pp. 7794–7803. [Google Scholar]
- Xing, Q.-J.; Shen, Y.-Y.; Cao, R.; Zong, S.-X.; Zhao, S.-X.; Shen, Y.-F. Functional movement screen dataset collected with two azure kinect depth sensors. Sci. Data 2022, 9, 104. [Google Scholar] [CrossRef] [PubMed]
- Tang, Y.; Ni, Z.; Zhou, J.; Zhang, D.; Lu, J.; Wu, Y.; Zhou, J. Uncertainty-aware score distribution learning for action quality assessment. In Proceedings of the IEEE/CVF Conference on Computer Vision and Pattern Recognition, Seattle, WA, USA, 13–19 June 2020; pp. 9839–9848. [Google Scholar]
| Disclaimer/Publisher’s Note: The statements, opinions and data contained in all publications are solely those of the individual author(s) and contributor(s) and not of MDPI and/or the editor(s). MDPI and/or the editor(s) disclaim responsibility for any injury to people or property resulting from any ideas, methods, instructions or products referred to in the content. |
© 2023 by the authors. Licensee MDPI, Basel, Switzerland. This article is an open access article distributed under the terms and conditions of the Creative Commons Attribution (CC BY) license (https://creativecommons.org/licenses/by/4.0/).

 ,
, 


