

Low-Rank Matrix Completion via QR-Based Retraction on Manifolds

1
Department of Mathematics, Shanghai University, Shanghai 200444, China
2
Qianweichang College, Shanghai University, Shanghai 200444, China
*
Author to whom correspondence should be addressed.
Mathematics 2023, 11(5), 1155; https://doi.org/10.3390/math11051155
Submission received: 17 January 2023
/
Revised: 23 February 2023
/
Accepted: 23 February 2023
/
Published: 26 February 2023
(This article belongs to the Special Issue Advanced Optimization Methods and Applications)
Abstract
:Low-rank matrix completion aims to recover an unknown matrix from a subset of observed entries. In this paper, we solve the problem via optimization of the matrix manifold. Specially, we apply QR factorization to retraction during optimization. We devise two fast algorithms based on steepest gradient descent and conjugate gradient descent, and demonstrate their superiority over the promising baseline with the ratio of at least .
MSC:
90C29; 57R57; 49Q10; 90C301. Introduction
The problem of matrix completion (MC) has generated a great deal of interest over the last decade [1], and several variant problems have been considered, such as non-negative matrix completion (NMC) [2], structured matrix completion [3,4] (including Hankel matrices [5]), and low-rank matrix completion (LRMC) [6,7]. Because of its wide applications in sensor network localization [8], system identification [9], machine learning [10,11], computer vision [12], recommendation systems [13], etc., LRMC has drawn a great deal of attention. Let be an observed matrix and be an index set of the observed position. Then, the desired low-rank matrix X can be recovered by solving the following rank minimization problem [14,15]:
where , and 0, otherwise. Unfortunately, the calculation of the rank function is (non-deterministic polynomial) NP-hard, and thus all known algorithms need double exponential time on the dimension of n.
To overcome this limitation, many approaches have been proposed [13]. For instance, Candès and Recht [16] replaced the rank function with the nuclear norm, and (1) can be rewritten as
where and represents the i-th largest non-zero singular value. They proved that if the number of observed entries obeys with c being some positive constant and r being the rank of X, then most matrices of rank r can be perfectly recovered with very high probability by solving a simple convex optimization program. However, when the size of the matrix is large, the computation is still burdensome. To mitigate the computational burden, Cai et al. [17] introduced the singular value thresholding algorithm. The key idea of this approach is to place the regularization term into the objective function of the nuclear norm minimization problem. On the other hand, given the rank of a matrix, Lee and Bresler [18] replaced the rank function with the Frobenius norm, and (1) can be rewritten as
According to matrix theory, the matrix of rank r can be decomposed into two matrices and such that . A straightforward method is to determine X and Y by minimizing the residual between the original M and the recovered one (that is, ) on the sampling set [19,20]:
To solve this multiple objective optimization program, one can employ the alternating minimization technique: (i) set X first and determine Y via minimizing the residual and; (ii) fix Y and determine X in the same way.
To accelerate the completing process, a novel utilization of the rank information is definition of an inner product and a differentiable structure, which formulates a manifold-based optimization program [21,22]. Then, one can compute the Riemannian gradient and Hessian matrix to solve the following problem [14,23]:
where . Specially, Mishra et al. [24] discussed singular value decomposition, rank factorization, and QR factorization on manifolds. Following this line, Cambier and Absil [25] simultaneously considered singular value decomposition and regularization:
where and is a regularization parameter. Yet, the improvement of the accuracy is not remarkable. More recently, Dong et al. [26] devised a preconditioned gradient descent algorithm for the rank factorization problem:
which is a multiple objective problem on the product space that can be defined as a manifold. Although it shows good performance in comparison to single-objective problems, the algorithm hardly considers the structure on a per matrix basis.
In this paper, we consider QR factorization on manifolds. Different from single-objective optimization on the manifold [24,27,28], we study LRMC using multiple objective optimization in the product space . During iteration, we first obtain the gradient of the objective function in the tangent space and then retract it with QR factorization. Specially, we introduce a measure to characterize the degree of orthogonality of Q for retraction, based on which we design two fast algorithms and show their advantage in comparison to rank factorization [26].
The paper is organized as follows. In Section 2, we introduce some preliminaries, including basic notations, problem formulation, and the element of manifolds. In Section 3, we show algorithms based on the choice of initial point, descent direction, step size, and retraction. In Section 4, we prove convergence and analyze the reason why the proposed algorithms outperform those in [26]. In Section 5, we demonstrate the superior performance of the proposed algorithms using numerical experiments. Finally, in Section 6 we provide a conclusion.
2. Preliminary
Notation. The Euclidean inner product and norm for the product space , respectively, denoted with and , are defined by
for any pair of points .
Problem statement. The purpose of this paper is to solve the problem (5). With QR factorization, it becomes:
QR factorization. QR factorization [29] can be carried out by using Householder transformation, Givens rotations, Gram–Schmidt process, and their variants. In this paper, we choose the modified Gram–Schmidt algorithm for a more reliable procedure. (see Algorithm 7 for details.)
Geometric element on . The tangent space (see Figure 1) at a point is the finite Cartesian product of the tangent spaces of the two element matrix spaces. Then, (see Section 3.5.2, [21]) where indicates that there is a homeomorphism between the topological space X and Y.
Comparing the performance of several metrics, we consider the following. Given two tangent vectors (see Section 4, [26]) at point , the preconditioned metric is
where , , is a constant, which keeps the metric well defined and positive definite if Q or R does not have full rank. Furthermore, if , one can write as a kind of norm at point x.
Definition 1.
For a point , the gradient of is the unique vector in , denoted with , such that
where is directional derivative defined [21] by
3. Algorithms
Initial point . Following the widely used spectral initialization [30], we apply SVD to a zero-filled matrix and yield three matrices , and such that . Then, the initial point is set as (see Algorithm 1 for details)
| Algorithm 1 Initialization |
| Input: data M and rank r Output: initialization
|
Descent direction . Here, we consider two kinds of directions, the steepest descent (SD) direction (see Algorithm 2) and the conjugate descent (CD) direction (see Algorithm 3 and Figure 1), defined, respectively, by
Although there are several calculations of , we adopt from [31] because it outperforms the others.
| Algorithm 2 Steepest descent (SD) direction of the function in (9) with orthogonality of Q |
| Input: Data M, iterate , rank r, and metric constant . Output: SD direction
|
| Algorithm 3 Conjugate descent (CD) direction of the function in (9) |
| Input: Last conjugate direction (Set ), conjugate direction . Output: Conjugate direction .
|
Stepsize . For the SD direction, we apply exact line search (ELS) [22] (see Algorithm 4). Let be a given descent direction; then,
where , , and . The differential of the formula above reads as:
As a cubic equation, one can obtain its roots easily. The step size is exactly the real positive root.
| Algorithm 4 Exact line search |
| Input: Data M, iterate , Conjugate direction . Output: Step size s.
|
For the CD direction, we apply the inexact line search (IELS) [32] (see Algorithm 5). For this purpose, we set , where is constant, and . Then, the step size at the th iteration is the largest one in the set , and therefore
| Algorithm 5 Inexact line search |
| Input: Data M, iterate x, constant , times limitation , parameter , SD direction , and CD direction . Output: Stepsize s.
|
Retraction. With the descent direction and stepsize s, one can apply retraction (see Figure 1 and Algorithm 6). For this purpose, we introduce the concept of the degree of orthogonality.
Definition 2.
For a matrix , we definite its degree of orthogonality as:
| Algorithm 6 Retraction with QR factorization |
| Input: Iteration , direction , stepsize and parameter . Output: Next iterate .
|
| Algorithm 7 Modified Gram–Schmidt algorithm |
| Input: with . Output: and .
|
Given a small parameter , we say that the matrix has good orthogonality if . Then, we adopt as the value for the next iterate. On the contrary, we have to decompose [33] and obtain , , and hence, the next iteration point .
In summary, we present Algorithms 8 and 9 as the whole process of solving the optimization problem (9), respectively.
| Algorithm 8 QR Riemannian gradient descent (QRRGD) |
| Input: Function (see (9)), initial point (generated by Algorithm 1), tolerance parameter Output:
|
| Algorithm 9 QR Riemannian conjugate gradient (QRRCG) |
| Input: Function (see (9)), initial point , tolerance parameter p Output:
|
4. Analysis
4.1. Convergence
We conduct analysis of Algorithm 8 as an instance and Algorithm 9 can be proved using a similar method. First, we prove that the objective function (9) is Lipschitz continuously differentiable [34] on the product space over the Euclidean geometry. Then, we demonstrate that the proposed Riemannian gradient descent direction (14) has a sufficient decrease in the function value provided that the step size is selected properly depending on the local geometry at each iteration.
The Lipschitz continuity of the gradient of f in the sublevel set [35]
with respect to a point is shown below.
Lemma. 1
Proof.
By the definition of function (9), set , where is bounded with respect to any . Furthermore, let B be a closed ball that contains . For all , according to f is , we have
Then,
This means that (20) is true on B, and it functions on its subset . □
Next, we obtain the following sufficient decrease property with Lemma 1.
Lemma 2.
At any iterate produced by Algorithm 8 before stopping, the following sufficient decrease property holds, provided that the step size s satisfies for a positive value ,
where and is defined by
under the gradient setting (14).
Proof.
In Algorithm 8, at iterate , the Riemannian gradient descent step is . Let denote the step size for producing the next iterate: . In the gradient setting (14), the partial differentials are
According to Lemma 1, it follows that
□
Next, we prove that Algorithm 8 with the step size selected by the exact line search (16) ensures sufficient decrease at each iteration.
Lemma 3.
The iterates produced by Algorithm 8, with step size chosen by the exact line search (see Algorithm 4) satisfy the following sufficient decrease property,
Proof.
In Algorithm (8), let denote the Riemannian gradient descent direction at the iterate . From Lemmas 2 and 3, one obtains
for with defined in (22). On the other hand, let be the step size computed using Algorithm 4, and the next iterate is the minimum of f along the direction : by procession, for all . Therefore,
In Equation (27), the conclusion is applied. □
In both Lemmas 2 and 3, the sufficient decrease quantity depends on the local parameter . The quality is useful only when it is a strictly positive number. We address this in Proposition 1 for the gradient setting (12).
Proposition 1.
Under the same settings as in Lemmas 2 and 3, there exists a positive numerical constant such that the quantities (22) are lower bounded,
Proof.
In the gradient setting (12),
It is easy to find the result (28) can be ensured by as claimed. □
Now, we reach the main result using the following theorem.
Theorem 1.
Under the problem statement (9), given the initial point and the gradient setting (12), the sequence generated by Algorithm 8 with the step size (16) converges and a upper bound of the gradient norm shows as follows,
after N iterations, where is the Lipschitz constant in Lemma 1, the numerical constant is given in Proposition (28), and is a lower bound of the function value of (9).
Proof.
The convergence of the sequence is a direct result of the sufficient decrease property (21) in Lemma 2 and the boundedness of the sequence of function values
Let denote the number of iterations needed for reaching an iterate such that , for a tolerance parameter .
Because Algorithm 8 does not terminate at , the gradient norms for all . Adding up the right hand sides of (24) for follows
In Equation (32), Proposition 1 is applied. Therefore, the number of iterations satisfies
In other words, the iterate produced by the algorithm after N iteration obeys
□
4.2. Computational Cost
In this subsection, we analyze the computation cost of our QR-based method with the other. It demonstrates the reason that we can obtain better performance than the compared method. After we make a QR factorization to matrix Q, it leads to some computational cost, but what the factorization reaps, the benefits greatly exceeds what it costs using an ingenious trick.
Cost increase. In Figure 2, we mark three parts including computations in retraction as , , and , respectively. For , we compute as the leading part where , the cost of which is . For , we compute the QR decomposition of a matrix in by the MGS algorithm, which costs . For , it just computes the product of matrices and ; hence, it costs . Assume that the rate of the good orthogonality is , and the iteration number is ; then, the whole increasing cost is .
Cost decrease. A simple thought is to reduce the cost in each iteration process. First, we consider the gradient of the objective function (9), and the computational costs are summarized in Table 1, where is a coefficient in the Cholesky decomposition while computing the inverse. Therefore, once we compute the gradient we have reductions directly with respect to algorithms without QR. Second, we consider the metric (10), and the computational costs are summarized in Table 2. When we compute the metric, the reduction is under the QR method than those without it.
In Algorithm 8, if we find the step size using the exact line search (Algorithm 4), then the reduction is , because the exact line search needs not to compute the metric. Furthermore, the reduction in the computational cost at one iteration is .
In Algorithm 9, if we find the step size using the inexact line search (Algorithm 5), the reduction in the worst case is . Furthermore, the reduction in the computational cost at one iteration is .
5. Numerical Experiments
This section shows a numerical comparison of our algorithms with the recent RGD/RCG algorithms [26], which outperforms existing matrix factorization models on manifolds. The experiments are divided into two parts: in the first part, we test our algorithm on synthetic data, whereas in the second part, we provide the results on an empirical dataset PeMS Traffic [37].
To assess the algorithmic performance, we use the root mean square error (RMSE). Given a matrix observed on , the RMSE of with respect to M is defined by
Other parameters used in experiments are as follows: (1) p is the probability of an entry being observed; (2) the stopping parameter is one of the two parameters stop the iteration process when RMSE reaches it; (3) the iteration budget parameter is another parameter that stops the iteration process when iterating a specific amount of times over it; (4) the metric parameter helps the metric be well defined; (5) the orthogonality parameter is used to judge whether a matrix has good orthogonality; and (6) the oversampling factor according to [14], defined by , which decides the difficulty of the problem.
In our experiment, we first fix the values of , , and p. Next, we determine the difficulty of recovery, which can be characterized by the over sampling factor (OSF). Following [14], we set the OSF in . Finally, we determine the value of the rank by . To ensure that the matrix M is low ranked (e.g., ), there are two methods. One is setting and as small as possible given the values of p. For example, given , the values of and are about 250. Because of the small size, the problem is trivial. The other is letting p be smaller given the larger values of and . This is what was performed in our experiment. For example, given in Figure 2, we set and obtain .
All numerical experiments were performed on a desktop with 16-core Intel i7-10700F CPUs and 32GB of memory running Windows10 and MATLAB R2022b. The source code is available at https://github.com/Cz1544252489/qrcode (accessed on 14 February 2023).
5.1. Synthetic Data
Initially, we provide some comments about the chosen rank on synthetic data. We first fix the values of , , and p. Next, we determine the difficulty of recovery, which can be characterized by the oversampling factor (OSF). Following [14], we set the OSF in . Finally, we can determine the value of the rank by .
We generate two observed matrices and with probability p, which is the ratio of an entry being observed defined by with and , where are composed of columns that are i.i.d. Gaussian vectors. The reason why we generate them is to test our algorithm on different scale of entries, and it will be measured by that is the average of random entries.
5.2. Empirical Data
In this part, we test our algorithm on the PeMS Traffic [37] dataset. It is a matrix with a size of containing traffic occupancy rates (between 0 and 1) recorded across time by sensors placed along different lanes of freeways in the San Francisco Bay Area. The recordings are sampled every 10 minutes, covering a period of 15 months. The column index set corresponds to the time domain and the row index set corresponds to geographical points (sensors), which are referred to as the spatial domain. In the experiment, we use the part of test dataset; it has 173 rows and 6837 columns with . Table 6 shows the results on the empirical data.
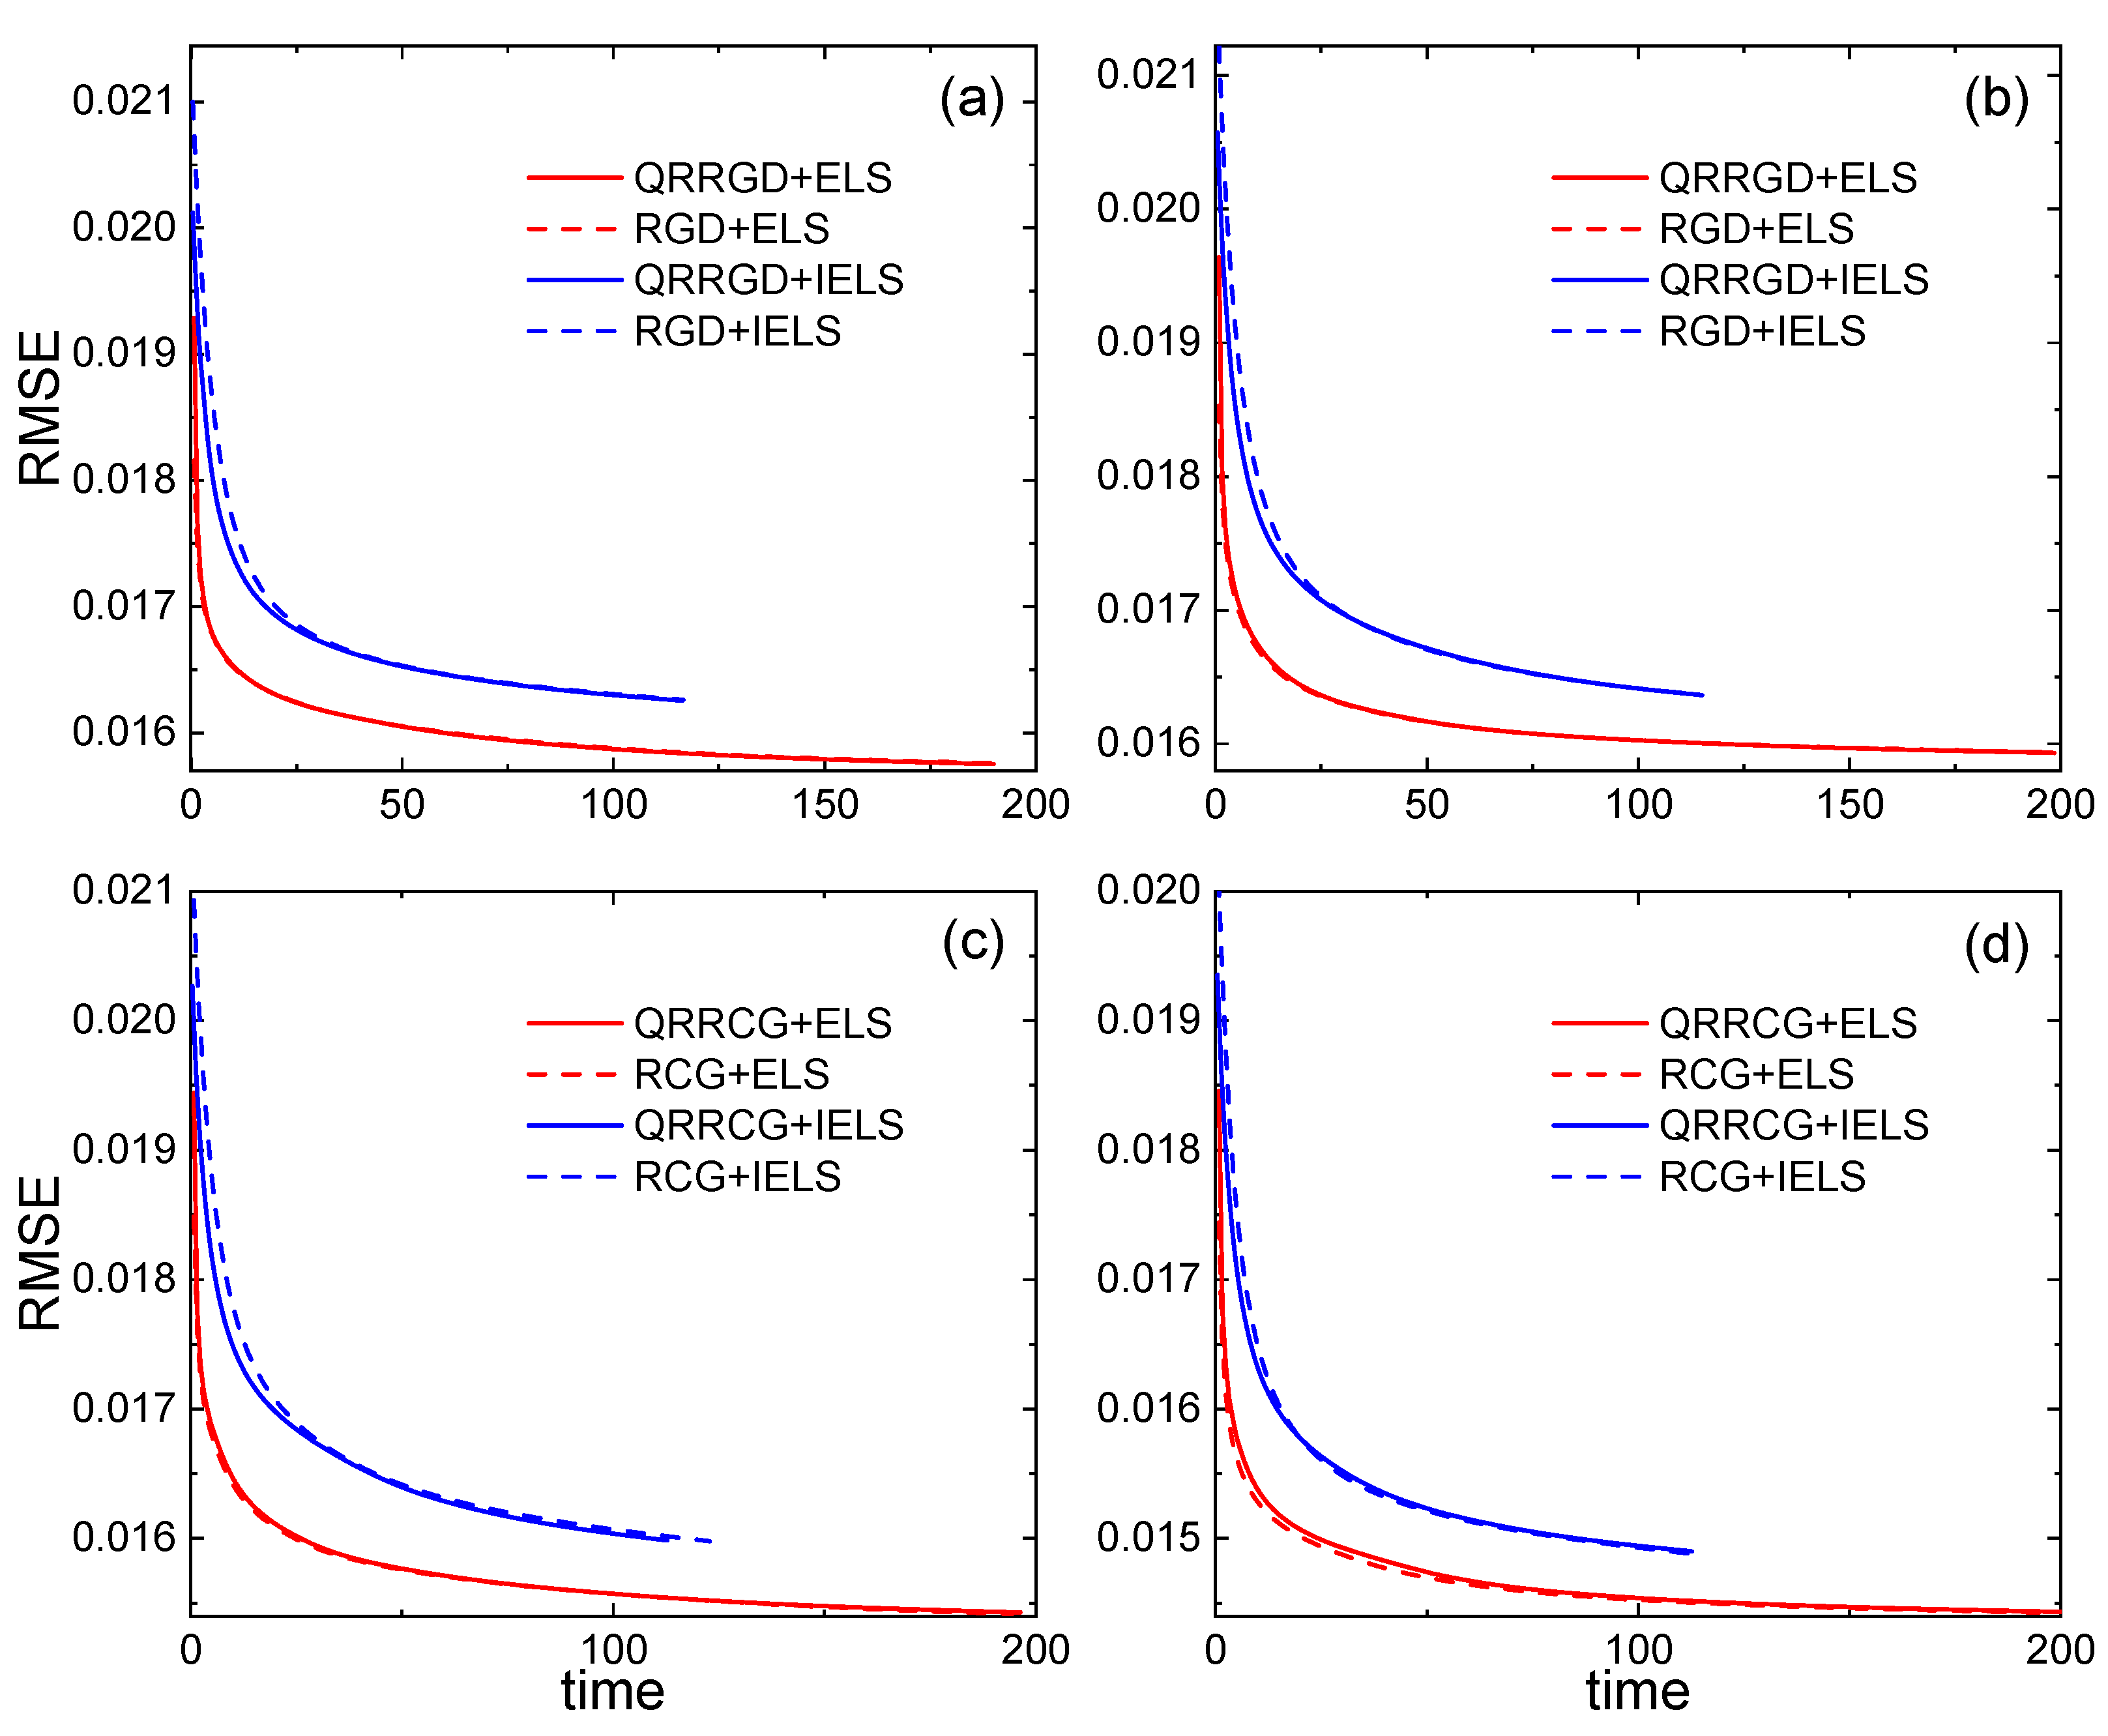
As shown above, solid lines represent the results of our algorithms with QR factorization, whereas dashed lines correspond to those of the algorithms with rank factorization [26]. For synthetic data, our algorithms either yield better solutions or run with less time in comparison to [26] on most cases. Whereas for the empirical dataset, it shows a slight advantage for weak structures on earth. It has been demonstrated that the algorithms in [26] outperform the state-of-the-art methods using alternating minimization and the manifold concept.
Furthermore, we briefly measure the ratio of speedup from the compared algorithm. It can be defined by the means of speedup on all our experiment, that is, , where E is the set of experiments. Furthermore, a single speedup defined as below:
where and are the time in seconds and theRMSE of the QR method, respectively, whereas and are the time in seconds and the RMSE of the compared method. Finally, we obtain .
6. Conclusions
We have proposed two LRMC algorithms, QRRGD and QRRCG, for reconstruction of an observed matrix via QR-based retraction on manifolds. These two algorithms are computationally efficient and have higher accuracy, demonstrated by theoretical analysis of computational costs and numerical experiments with synthetic data and a real-world dataset PeMS Traffic. To improve efficacy, one could adjust the values of other parameters such as using smaller for orthogonality, a larger , and a more suitable value for the metric. On the other hand, different conjugate methods [38], as well as the rank adaptive method [39], can be considered.
Author Contributions
Conceptualization, S.Y. and X.X.; Methodology, S.Y. and X.X.; Validation, X.X.; Formal analysis, K.W. and Z.C.; Investigation, K.W. and Z.C.; Writing—original draft, K.W. and Z.C.; Writing—review & editing, S.Y. and X.X.; Project administration, X.X.; Funding acquisition, S.Y. and X.X. All authors have read and agreed to the published version of the manuscript.
Funding
This work was supported by the Natural Science Foundation of China under Grant Nos. 11971296 and 12071281.
Data Availability Statement
Data available in a publicly accessible repository that does not issue DOIs Publicly available datasets were analyzed in this study. This data can be found here: https://file.cz123.top/DatainManQR/.
Acknowledgments
The authors thank anonymous referees for their valuable comments.
Conflicts of Interest
The authors declare no conflict of interest.
References
- Candes, E.J.; Plan, Y. Matrix Completion With Noise. Proc. IEEE 2010, 98, 925–936. [Google Scholar] [CrossRef] [Green Version]
- Xu, Y.; Yin, W.; Wen, Z.; Zhang, Y. An alternating direction algorithm for matrix completion with nonnegative factors. Front. Math. China 2012, 7, 365–384. [Google Scholar] [CrossRef] [Green Version]
- Markovsky, I.; Usevich, K. Structured Low-Rank Approximation with Missing Data. SIAM J. Matrix Anal. Appl. 2013, 34, 814–830. [Google Scholar] [CrossRef] [Green Version]
- Markovsky, I. Recent progress on variable projection methods for structured low-rank approximation. Signal Process. 2014, 96, 406–419. [Google Scholar] [CrossRef]
- Usevich, K.; Comon, P. Hankel Low-Rank Matrix Completion: Performance of the Nuclear Norm Relaxation. IEEE J. Sel. Top. Signal Process. 2016, 10, 637–646. [Google Scholar] [CrossRef] [Green Version]
- Davenport, M. An overview of low-rank matrix recovery from incomplete observations. IEEE J. Sel. Top. Signal Process. 2016, 10, 608–622. [Google Scholar] [CrossRef]
- Chi, Y. Low-rank matrix completion [lecture notes]. IEEE Signal Process. Mag. 2018, 35, 178–181. [Google Scholar] [CrossRef]
- Ding, Y.; Krislock, N.; Qian, J.; Wolkowicz, H. Sensor Network Localization, Euclidean Distance Matrix completions, and graph realization. Optim. Eng. 2010, 11, 45–66. [Google Scholar] [CrossRef] [Green Version]
- Liu, Z.; Vandenberghe, L. Interior-Point Method for Nuclear Norm Approximation with Application to System Identification. SIAM J. Matrix Anal. Appl. 2010, 31, 1235–1256. [Google Scholar] [CrossRef] [Green Version]
- Jacob, M.; Mani, M.P.; Ye, J.C. Structured Low-Rank Algorithms: Theory, Magnetic Resonance Applications, and Links to Machine Learning. IEEE Signal Process. Mag. 2020, 37, 54–68. [Google Scholar] [CrossRef] [Green Version]
- Jawanpuria, P.; Mishra, B. Structured low-rank matrix learning: Algorithms and applications. arXiv 2017, arXiv:1704.07352. [Google Scholar]
- Lu, S.; Ren, X.; Liu, F. Depth Enhancement via Low-rank Matrix Completion. In Proceedings of the IEEE Conference on Computer Vision and Pattern Recognition (CVPR), Columbus, OH, USA, 23–28 June 2014; pp. 3390–3397. [Google Scholar]
- Nguyen, L.T.; Kim, J.; Shim, B. Low-rank matrix completion: A contemporary survey. IEEE Access 2019, 7, 94215–94237. [Google Scholar] [CrossRef]
- Vandereycken, B. Low-rank matrix completion by Riemannian optimization. SIAM J. Optim. 2013, 23, 1214–1236. [Google Scholar] [CrossRef] [Green Version]
- Wang, H.; Zhao, R.; Cen, Y.; Liang, L.; He, Q.; Zhang, F.; Zeng, M. Low-rank matrix recovery via smooth rank function and its application in image restoration. Int. J. Mach. Learn. Cybern. 2018, 9, 1565–1576. [Google Scholar] [CrossRef]
- Candès, E.J.; Recht, B. Exact matrix completion via convex optimization. Found. Comput. Math. 2009, 9, 717–772. [Google Scholar] [CrossRef] [Green Version]
- Cai, J.F.; Candès, E.J.; Shen, Z. A singular value thresholding algorithm for matrix completion. SIAM J. Optim. 2010, 20, 1956–1982. [Google Scholar] [CrossRef]
- Lee, K.; Bresler, Y. Admira: Atomic decomposition for minimum rank approximation. IEEE Trans. Inf. Theory 2010, 56, 4402–4416. [Google Scholar] [CrossRef] [Green Version]
- Jain, P.; Netrapalli, P.; Sanghavi, S. Low-rank matrix completion using alternating minimization. In Proceedings of the 45th Annual ACM Symposium on Theory of Computing, Palo Alto, CA, USA, 1–4 June 2013; pp. 665–674. [Google Scholar]
- Tanner, J.; Wei, K. Low rank matrix completion by alternating steepest descent methods. Appl. Comput. Harmon. Anal. 2016, 40, 417–429. [Google Scholar] [CrossRef]
- Absil, P.A.; Mahony, R.; Sepulchre, R. Optimization Algorithms on Matrix Manifolds; Princeton University Press: Princeton, NJ, USA, 2009. [Google Scholar]
- Boumal, N. An Introduction to Optimization on Smooth Manifolds; Cambridge University Press: Cambridge, UK, 2023. [Google Scholar]
- Guglielmi, N.; Scalone, C. An efficient method for non-negative low-rank completion. Adv. Comput. Math. 2020, 46, 31. [Google Scholar] [CrossRef]
- Mishra, B.; Meyer, G.; Bonnabel, S.; Sepulchre, R. Fixed-rank matrix factorizations and Riemannian low-rank optimization. Comput. Stat. 2014, 29, 591–621. [Google Scholar] [CrossRef] [Green Version]
- Cambier, L.; Absil, P.A. Robust low-rank matrix completion by Riemannian optimization. SIAM J. Sci. Comput. 2016, 38, S440–S460. [Google Scholar] [CrossRef] [Green Version]
- Dong, S.; Absil, P.A.; Gallivan, K. Riemannian gradient descent methods for graph-regularized matrix completion. Linear Algebra Its Appl. 2021, 623, 193–235. [Google Scholar] [CrossRef]
- Zhu, X. A Riemannian conjugate gradient method for optimization on the Stiefel manifold. Comput. Optim. Appl. 2017, 67, 73–110. [Google Scholar] [CrossRef]
- Sato, H.; Aihara, K. Cholesky QR-based retraction on the generalized Stiefel manifold. Comput. Optim. Appl. 2019, 72, 293–308. [Google Scholar] [CrossRef]
- Golub, G.H.; Van Loan, C.F. Matrix Computations; JHU Press: Baltimore, MD, USA, 2013. [Google Scholar]
- Keshavan, R.H.; Montanari, A.; Oh, S. Matrix completion from noisy entries. J. Mach. Learn. Res. 2010, 11, 2057–2078. [Google Scholar]
- Dai, Y.H.; Yuan, Y. A nonlinear conjugate gradient method with a strong global convergence property. SIAM J. Optim. 1999, 10, 177–182. [Google Scholar] [CrossRef] [Green Version]
- Armijo, L. Minimization of functions having Lipschitz continuous first partial derivatives. Pac. J. Math. 1966, 16, 1–3. [Google Scholar] [CrossRef] [Green Version]
- Björck, Å.; Paige, C.C. Loss and recapture of orthogonality in the modified Gram–Schmidt algorithm. SIAM J. Matrix Anal. Appl. 1992, 13, 176–190. [Google Scholar] [CrossRef]
- O’Searcoid, M. Metric Spaces; Springer Science & Business Media: Berlin/Heidelberg, Germany, 2006. [Google Scholar]
- Boyd, S.; Boyd, S.P.; Vandenberghe, L. Convex optimization; Cambridge University Press: Cambridge, UK, 2004. [Google Scholar]
- Nesterov, Y. Introductory Lectures on Convex Optimization: A Basic Course; Springer Science & Business Media: Berlin/Heidelberg, Germany, 2003. [Google Scholar]
- Dua, D.; Graff, C. UCI Machine Learning Repository. 2017. Available online: http://archive.ics.uci.edu/ml (accessed on 10 February 2019).
- Liu, J.; Feng, Y.; Zou, L. Some three-term conjugate gradient methods with the inexact line search condition. Calcolo 2018, 55, 1–16. [Google Scholar] [CrossRef]
- Zhou, G.; Huang, W.; Gallivan, K.A.; Van Dooren, P.; Absil, P.A. A Riemannian rank-adaptive method for low-rank optimization. Neurocomputing 2016, 192, 72–80. [Google Scholar] [CrossRef] [Green Version]
Figure 1.
Illustration of the tangent space, the conjugate direction, and the retraction process.

Figure 2.
Illustration of the QR factorization in retraction.
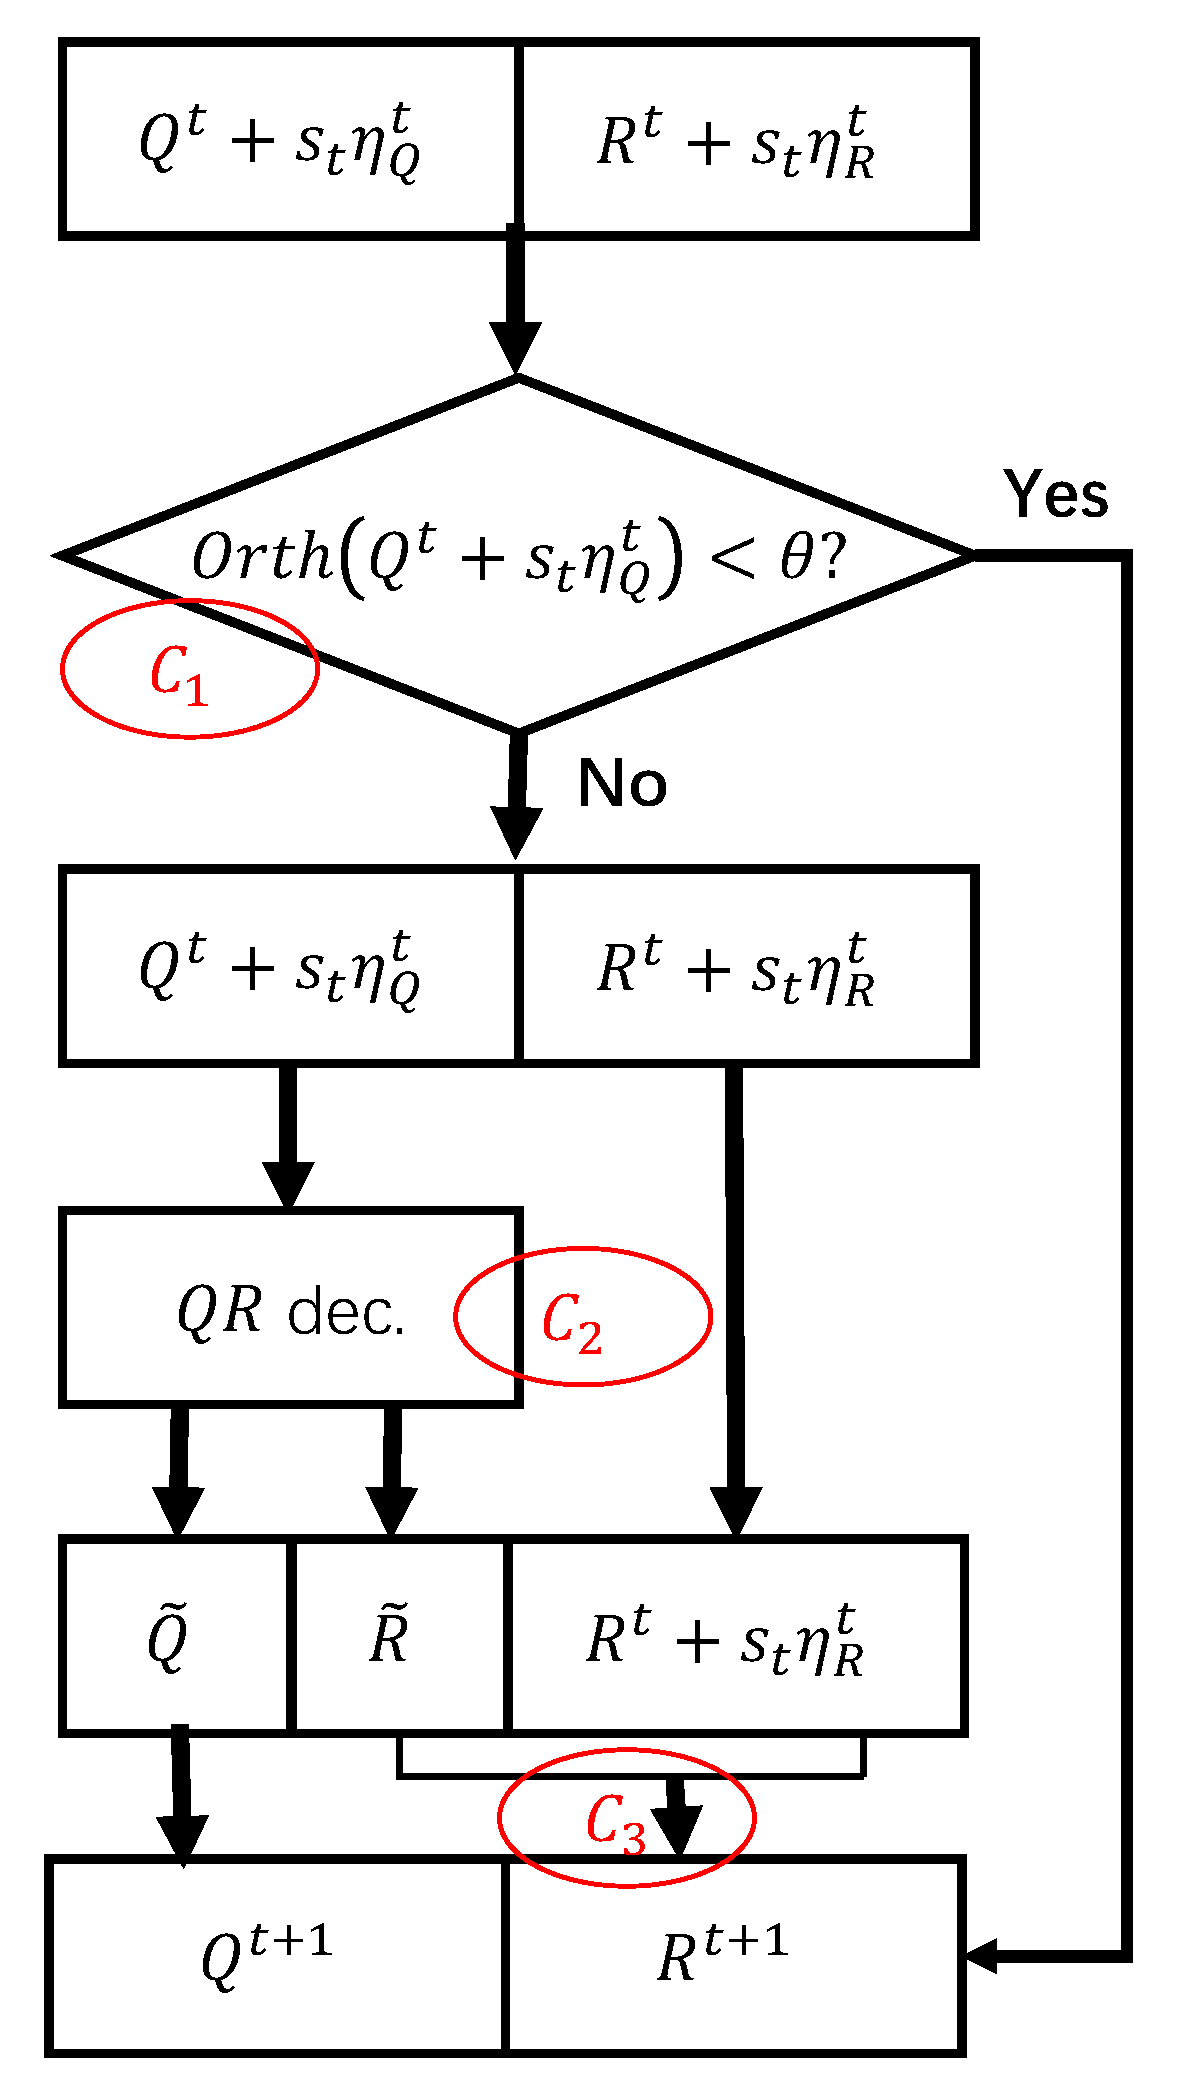
Figure 3.
Performance comparison of RGD (a,b) and RCG (c,d) with and without QR factorization. Simulations were carried out on square matrices (a,c) and (b,d). We apply the ELS and IELS to find the step size. The parameter values are , , , and .
Figure 3.
Performance comparison of RGD (a,b) and RCG (c,d) with and without QR factorization. Simulations were carried out on square matrices (a,c) and (b,d). We apply the ELS and IELS to find the step size. The parameter values are , , , and .
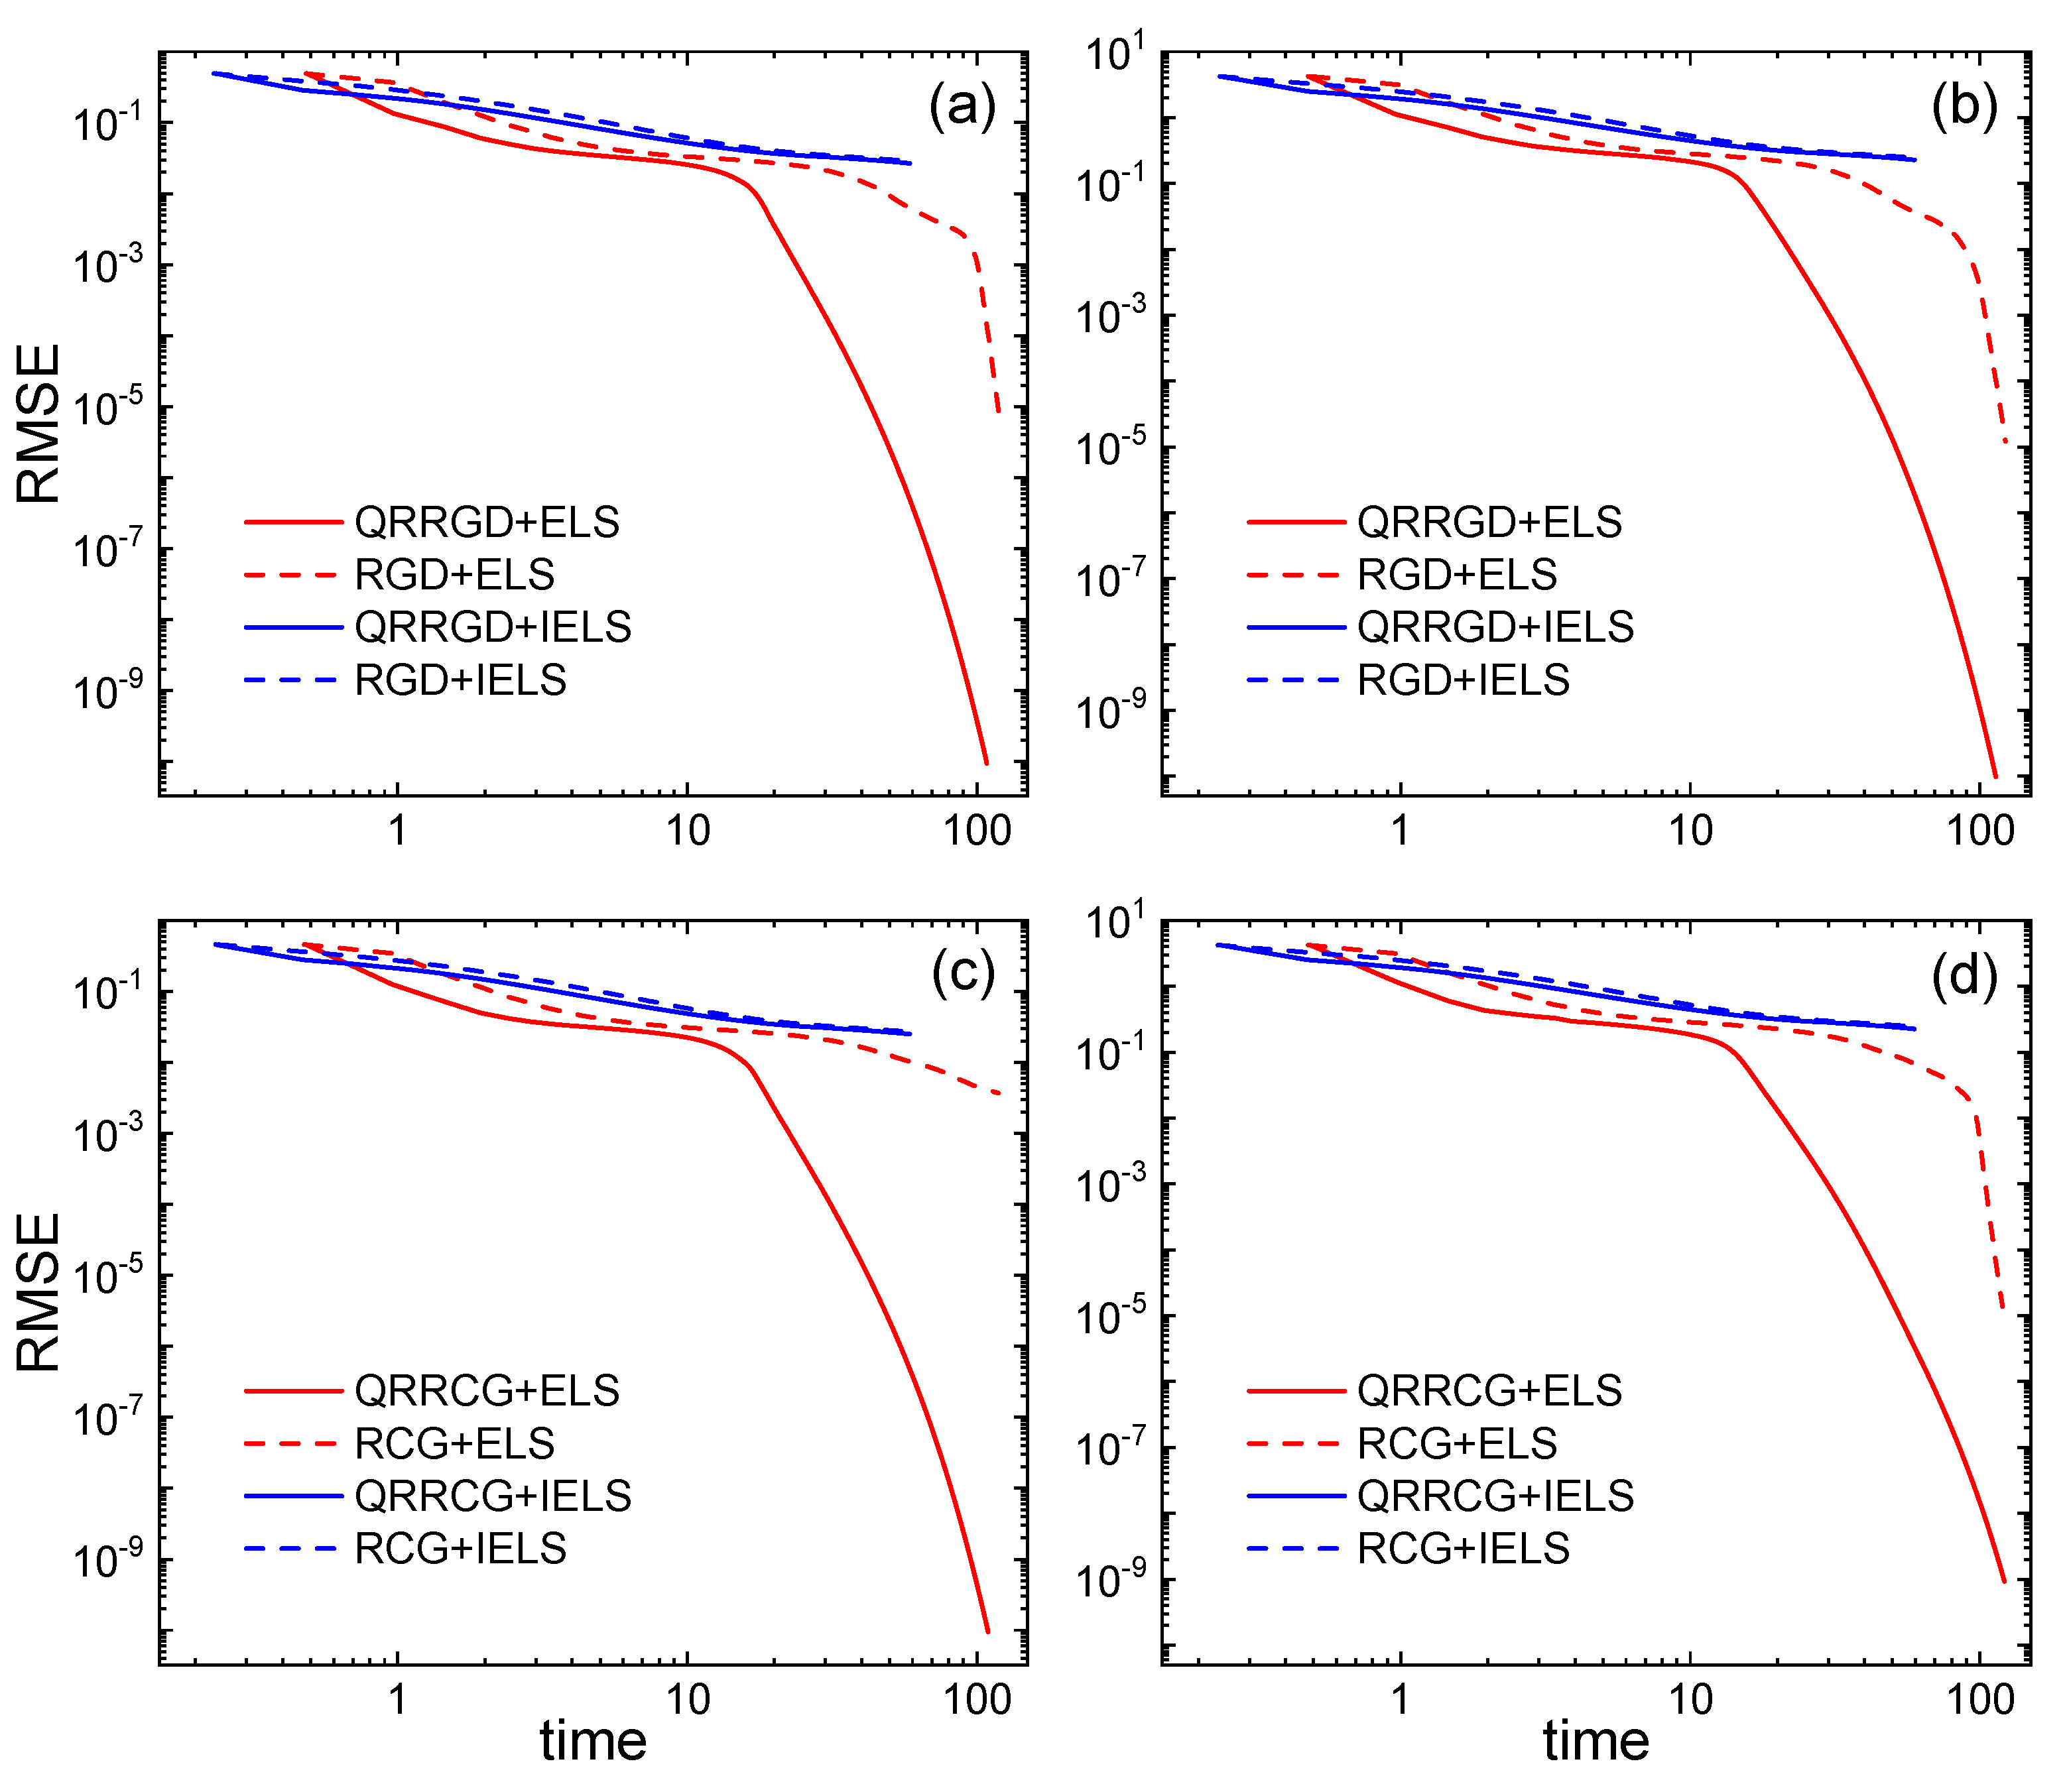
Figure 4.
Performance comparison of the RCG with and without QR factorization. Simulations were carried out on square matrices (a,c) and (b,d). We apply ELS and IELS to find the step size. The parameter values are , , , and .
Figure 4.
Performance comparison of the RCG with and without QR factorization. Simulations were carried out on square matrices (a,c) and (b,d). We apply ELS and IELS to find the step size. The parameter values are , , , and .
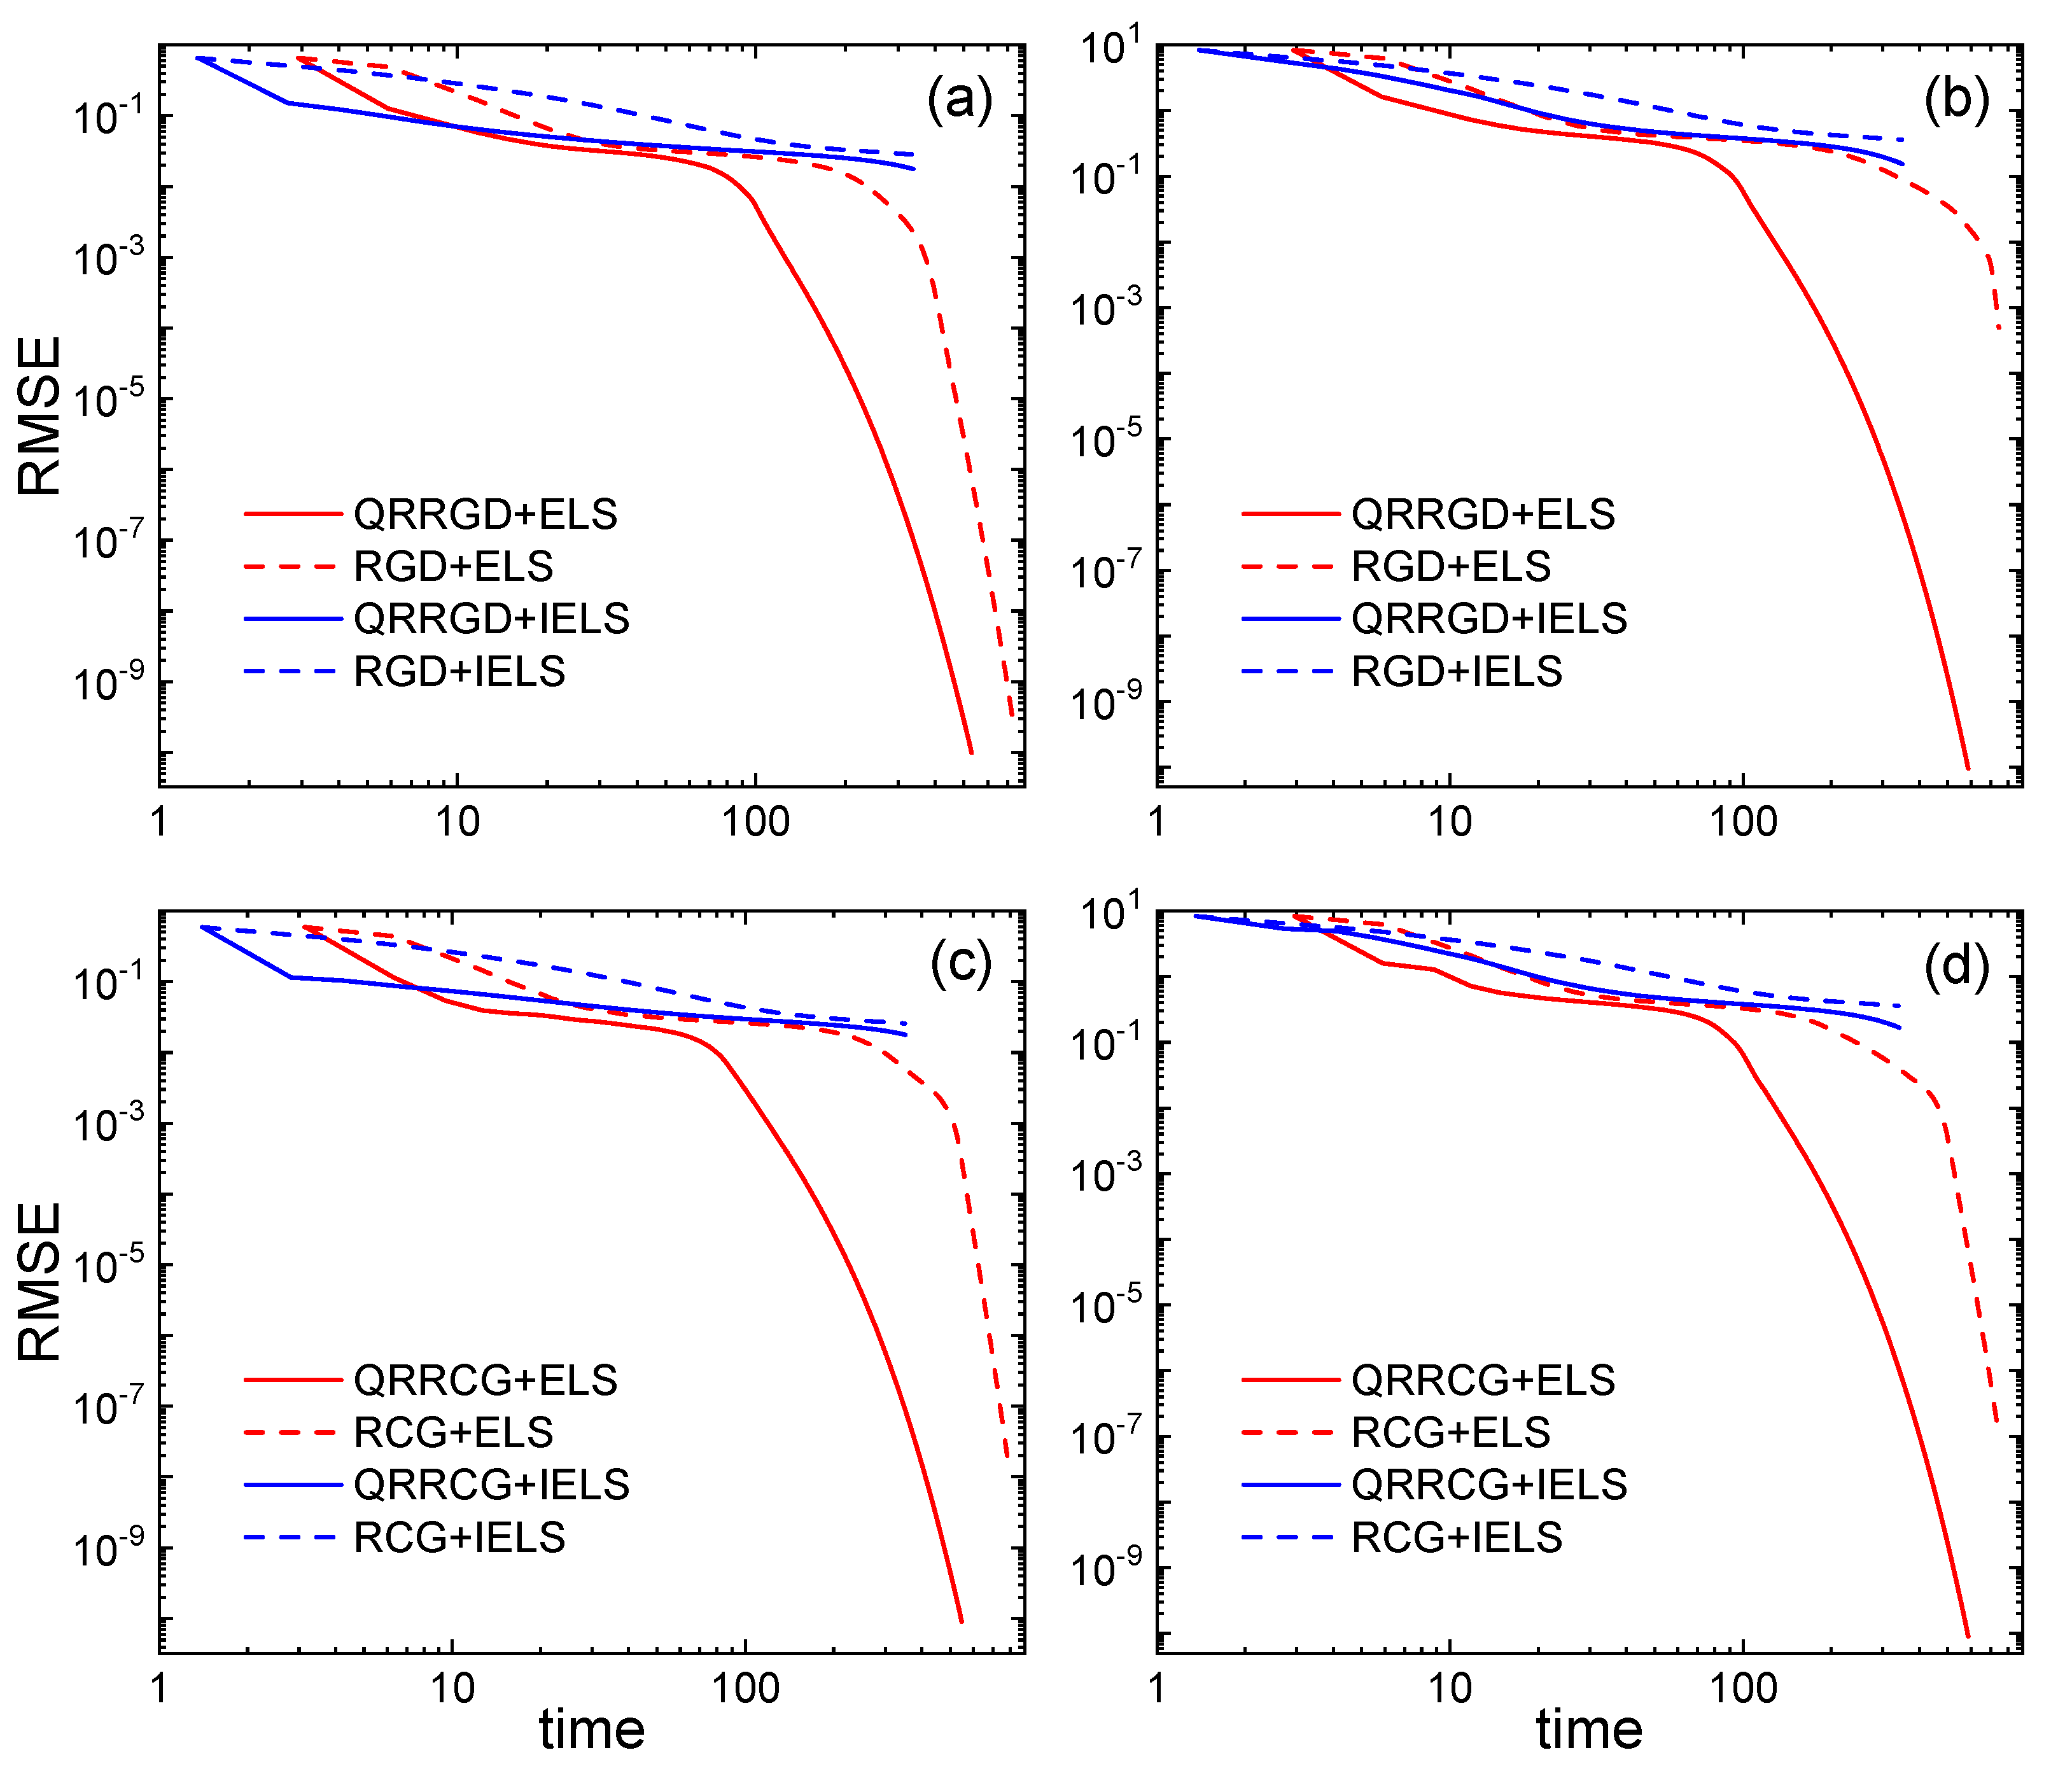
Figure 5.
Performance comparison of RCG with and without QR factorization. Simulations were carried out on square matrices . We applied ELS. The parameter values are , 4000, 6000, 8000, , , then , 24, 27, 29.
Figure 5.
Performance comparison of RCG with and without QR factorization. Simulations were carried out on square matrices . We applied ELS. The parameter values are , 4000, 6000, 8000, , , then , 24, 27, 29.
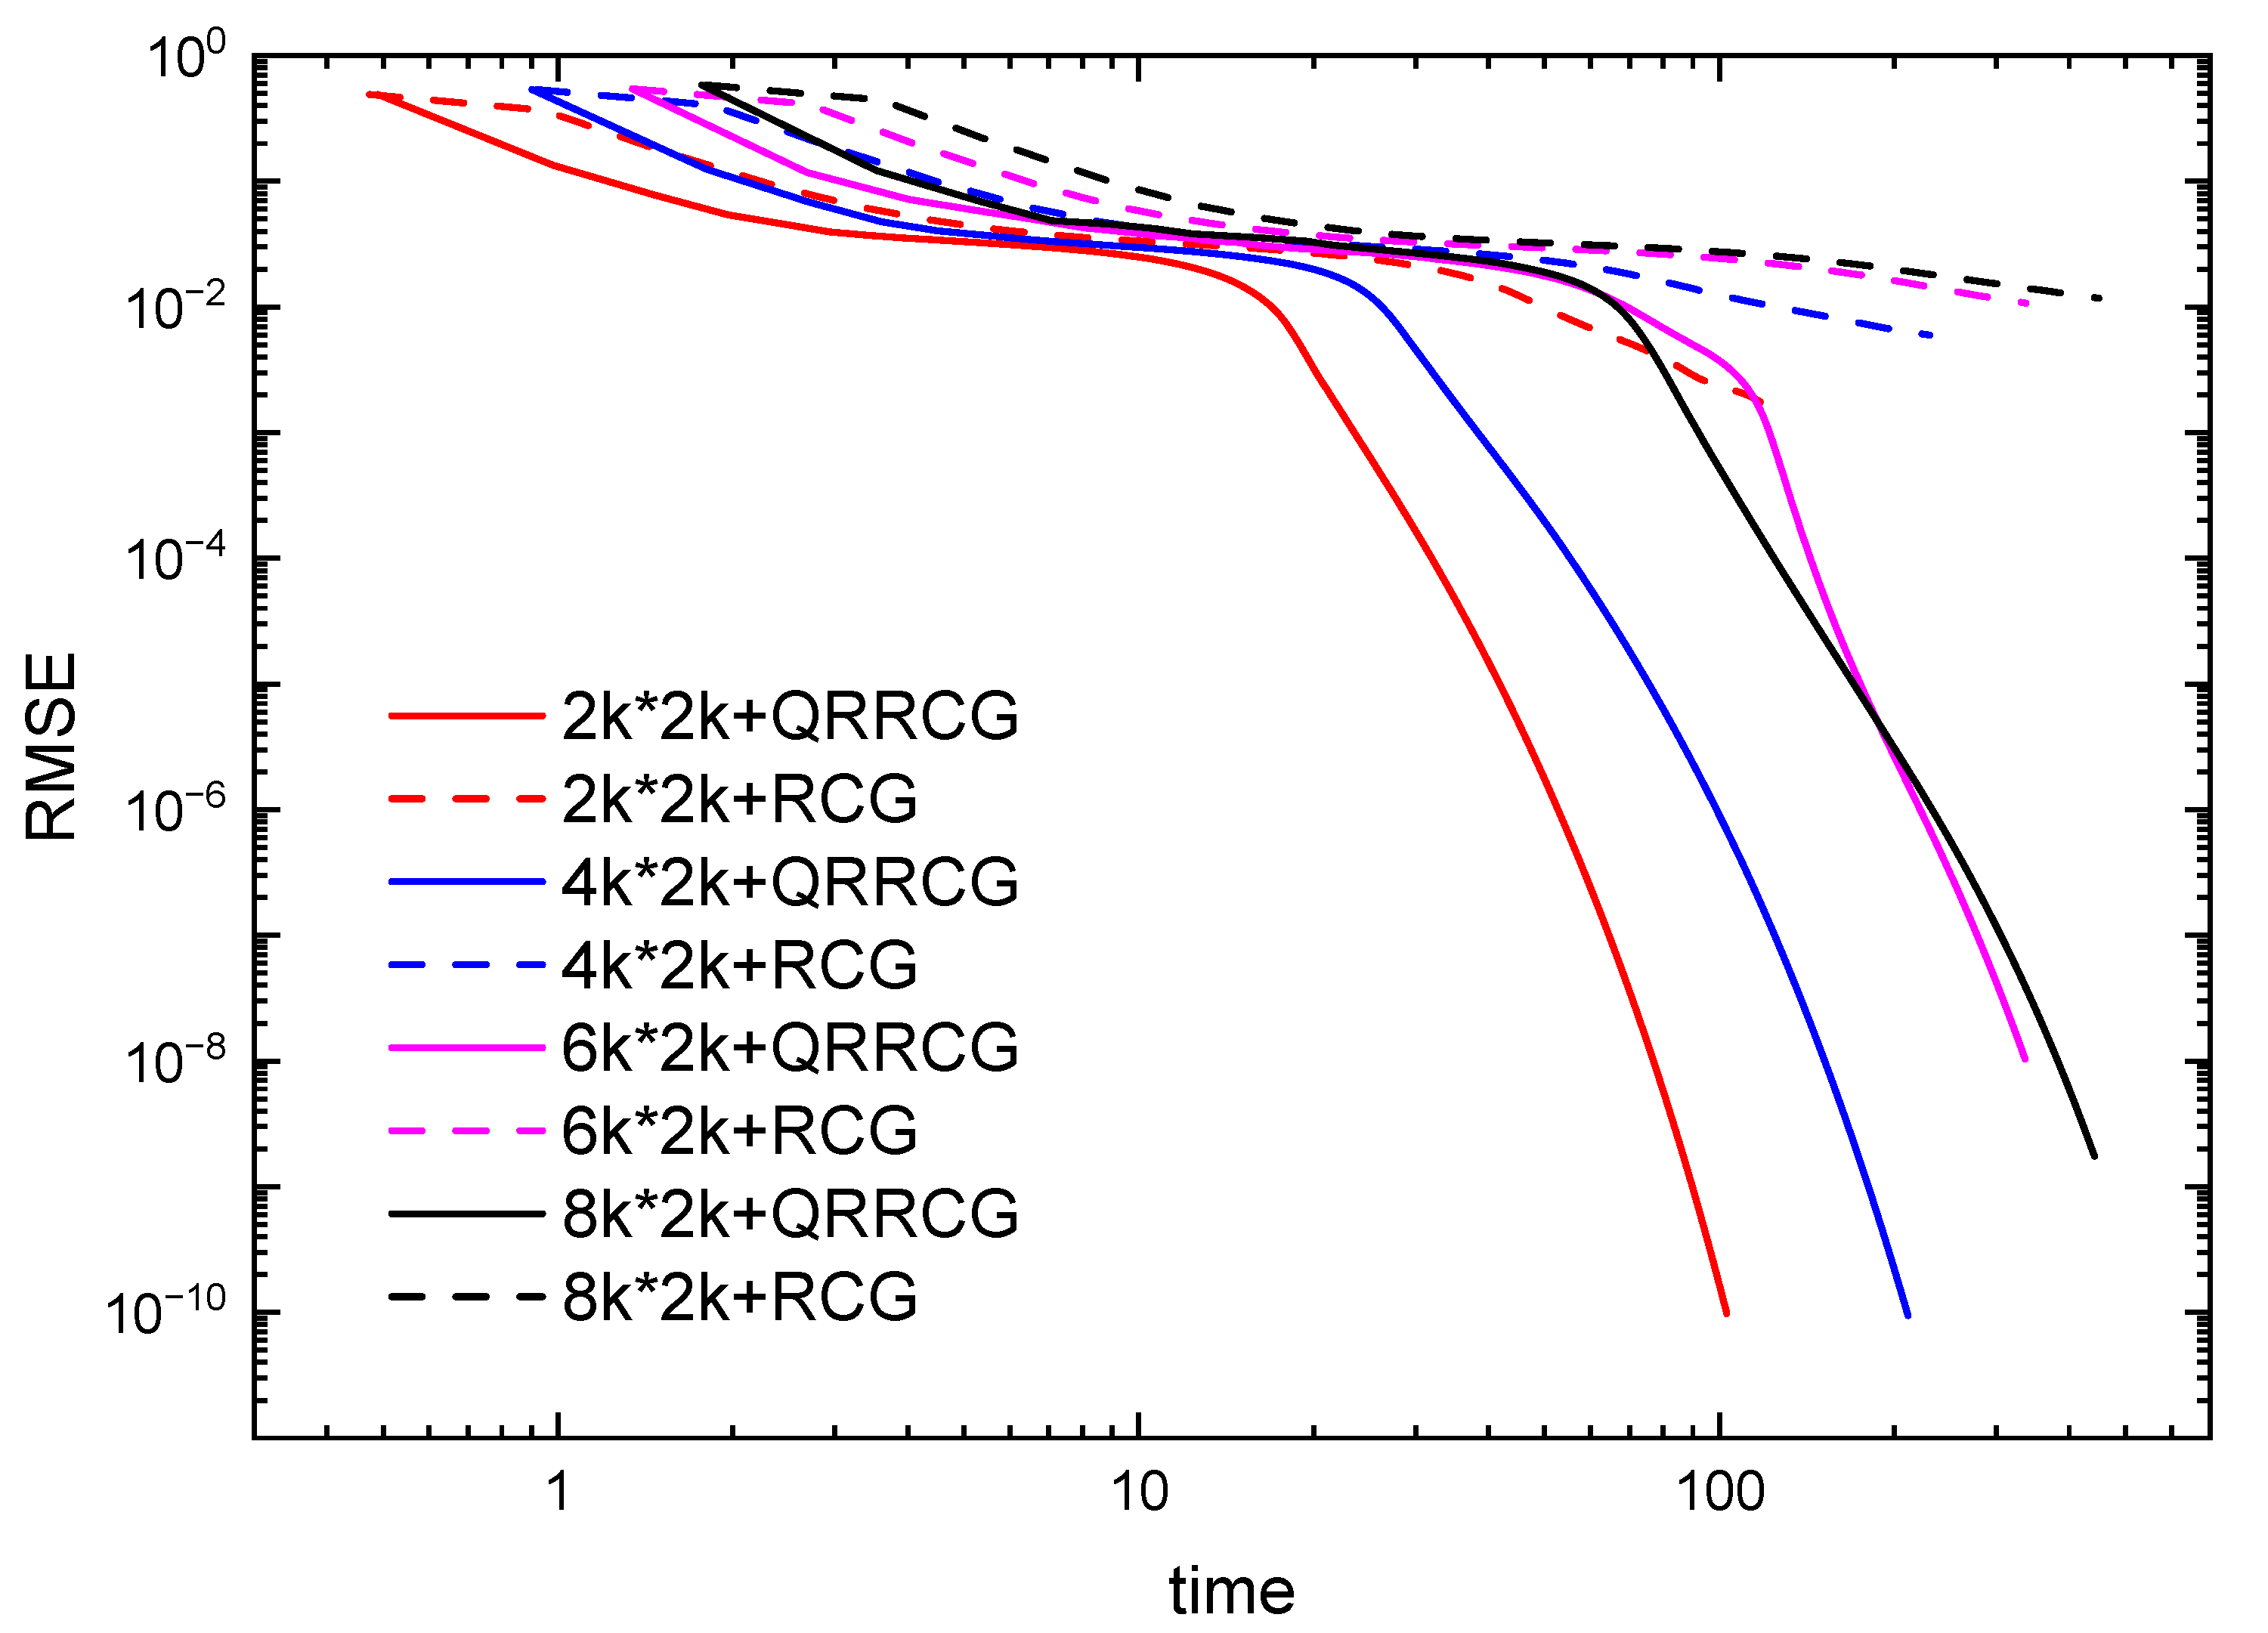
Figure 6.
Performance comparison of RGD (a,b) and RCG (c,d) with and without QR factorization. Simulations were carried out on the same matrices M built by PeMS Traffic. We applied ELS and IELS to find the step size. The parameter values are , , , , and .
Figure 6.
Performance comparison of RGD (a,b) and RCG (c,d) with and without QR factorization. Simulations were carried out on the same matrices M built by PeMS Traffic. We applied ELS and IELS to find the step size. The parameter values are , , , , and .

Table 1.
Computational costs of the gradients of the objective function.
| Computation | Cost |
|---|---|
Table 2.
Computation costs of the metric.
| Computation | Cost |
|---|---|
Table 3.
Computational results for Figure 3 with matrices size of . The time is rounded to three decimal places and RMSE is rounded to five decimal places.
Table 3.
Computational results for Figure 3 with matrices size of . The time is rounded to three decimal places and RMSE is rounded to five decimal places.
| Subfigure | Method | Time | RMSE | Iteration |
|---|---|---|---|---|
| (a) | QRRGD+ELS | 108.282 | 223 | |
| RGD+ELS | 120.644 | 250 | ||
| QRRGD+IELS | 58.763 | 250 | ||
| RGD+IELS | 57.905 | 250 | ||
| (b) | QRRGD+ELS | 113.655 | 237 | |
| RGD+ELS | 122.815 | 250 | ||
| QRRGD+IELS | 59.640 | 250 | ||
| RGD+IELS | 59.400 | 250 | ||
| (c) | QRRCG+ELS | 109.363 | 227 | |
| RCG+ELS | 118.726 | 250 | ||
| QRRCG+IELS | 58.677 | 250 | ||
| RCG+IELS | 59.849 | 250 | ||
| (d) | QRRCG+ELS | 121.740 | 250 | |
| RCG+ELS | 119.905 | 250 | ||
| QRRCG+IELS | 59.449 | 250 | ||
| RCG+IELS | 58.432 | 250 |
Table 4.
Computational results for Figure 4 with matrices size of . The time is rounded to three decimal places and RMSE is rounded to five decimal places.
Table 4.
Computational results for Figure 4 with matrices size of . The time is rounded to three decimal places and RMSE is rounded to five decimal places.
| Subfigure | Method | Time | RMSE | Iteration |
|---|---|---|---|---|
| (a) | QRRGD+ELS | 529.851 | 181 | |
| RGD+ELS | 733.993 | 250 | ||
| QRRGD+IELS | 337.730 | 250 | ||
| RGD+IELS | 335.950 | 250 | ||
| (b) | QRRGD+ELS | 586.522 | 201 | |
| RGD+ELS | 745.970 | 250 | ||
| QRRGD+IELS | 349.708 | 250 | ||
| RGD+IELS | 348.213 | 250 | ||
| (c) | QRRCG+ELS | 547.370 | 173 | |
| RCG+ELS | 782.545 | 250 | ||
| QRRCG+IELS | 351.655 | 250 | ||
| RCG+IELS | 350.344 | 250 | ||
| (d) | QRRCG+ELS | 586.297 | 199 | |
| RCG+ELS | 738.357 | 250 | ||
| QRRCG+IELS | 341.237 | 250 | ||
| RCG+IELS | 338.835 | 250 |
Table 5.
Computational results for Figure 5 with matrices size ranging from to . The time is rounded to three decimal places and RMSE is rounded to five decimal places.
Table 5.
Computational results for Figure 5 with matrices size ranging from to . The time is rounded to three decimal places and RMSE is rounded to five decimal places.
| r,OSF | Size | Method | Time | RMSE | Iteration |
|---|---|---|---|---|---|
| 18,2.79 | QRRCG | 102.939 | 210 | ||
| RCG | 118.397 | 250 | |||
| 24,2.79 | QRRCG | 211.122 | 234 | ||
| RCG | 230.015 | 250 | |||
| 27,2.79 | QRRCG | 335.745 | 250 | ||
| RCG | 336.917 | 250 | |||
| 29,2.77 | QRRCG | 442.133 | 250 | ||
| RCG | 449.752 | 250 |
Table 6.
Computational results for Figure 6 on PeMS Traffic. The time is rounded to three decimal places and RMSE is rounded to five decimal places.
Table 6.
Computational results for Figure 6 on PeMS Traffic. The time is rounded to three decimal places and RMSE is rounded to five decimal places.
| Subfigure | Method | Time | RMSE | Iteration |
|---|---|---|---|---|
| (a) | QRG+ELS | 189.945 | 250 | |
| RGD+ELS | 192.104 | 250 | ||
| QRRGD+IELS | 116.213 | 250 | ||
| RGD+IELS | 116.576 | 250 | ||
| (b) | QRRGD+ELS | 198.433 | 250 | |
| RGD+ELS | 196.615 | 250 | ||
| QRRGD+IELS | 115.070 | 250 | ||
| RGD+IELS | 113.418 | 250 | ||
| (c) | QRRCG+ELS | 196.291 | 250 | |
| RCG+ELS | 194.373 | 250 | ||
| QRRCG+IELS | 112.798 | 250 | ||
| RCG+IELS | 122.820 | 250 | ||
| (d) | QRRCG+ELS | 201.373 | 250 | |
| RCG+ELS | 196.029 | 250 | ||
| QRRCG+IELS | 112.663 | 250 | ||
| RCG+IELS | 112.358 | 250 |
Disclaimer/Publisher’s Note: The statements, opinions and data contained in all publications are solely those of the individual author(s) and contributor(s) and not of MDPI and/or the editor(s). MDPI and/or the editor(s) disclaim responsibility for any injury to people or property resulting from any ideas, methods, instructions or products referred to in the content. |
© 2023 by the authors. Licensee MDPI, Basel, Switzerland. This article is an open access article distributed under the terms and conditions of the Creative Commons Attribution (CC BY) license (https://creativecommons.org/licenses/by/4.0/).
Share and Cite
MDPI and ACS Style
Wang, K.; Chen, Z.; Ying, S.; Xu, X. Low-Rank Matrix Completion via QR-Based Retraction on Manifolds. Mathematics 2023, 11, 1155. https://doi.org/10.3390/math11051155
AMA Style
Wang K, Chen Z, Ying S, Xu X. Low-Rank Matrix Completion via QR-Based Retraction on Manifolds. Mathematics. 2023; 11(5):1155. https://doi.org/10.3390/math11051155
Chicago/Turabian StyleWang, Ke, Zhuo Chen, Shihui Ying, and Xinjian Xu. 2023. "Low-Rank Matrix Completion via QR-Based Retraction on Manifolds" Mathematics 11, no. 5: 1155. https://doi.org/10.3390/math11051155
Note that from the first issue of 2016, this journal uses article numbers instead of page numbers. See further details here.