
A Comprehensive Evaluation of Resilience in Abandoned Open-Pit Mine Slopes Based on a Two-Dimensional Cloud Model with Combination Weighting


Abstract
:1. Introduction
2. Construction of Resilience Evaluation Indicator System for Abandoned Open-Pit Mine Slopes
2.1. Basis for Indicator Selection
2.2. Indicator Grading Criteria
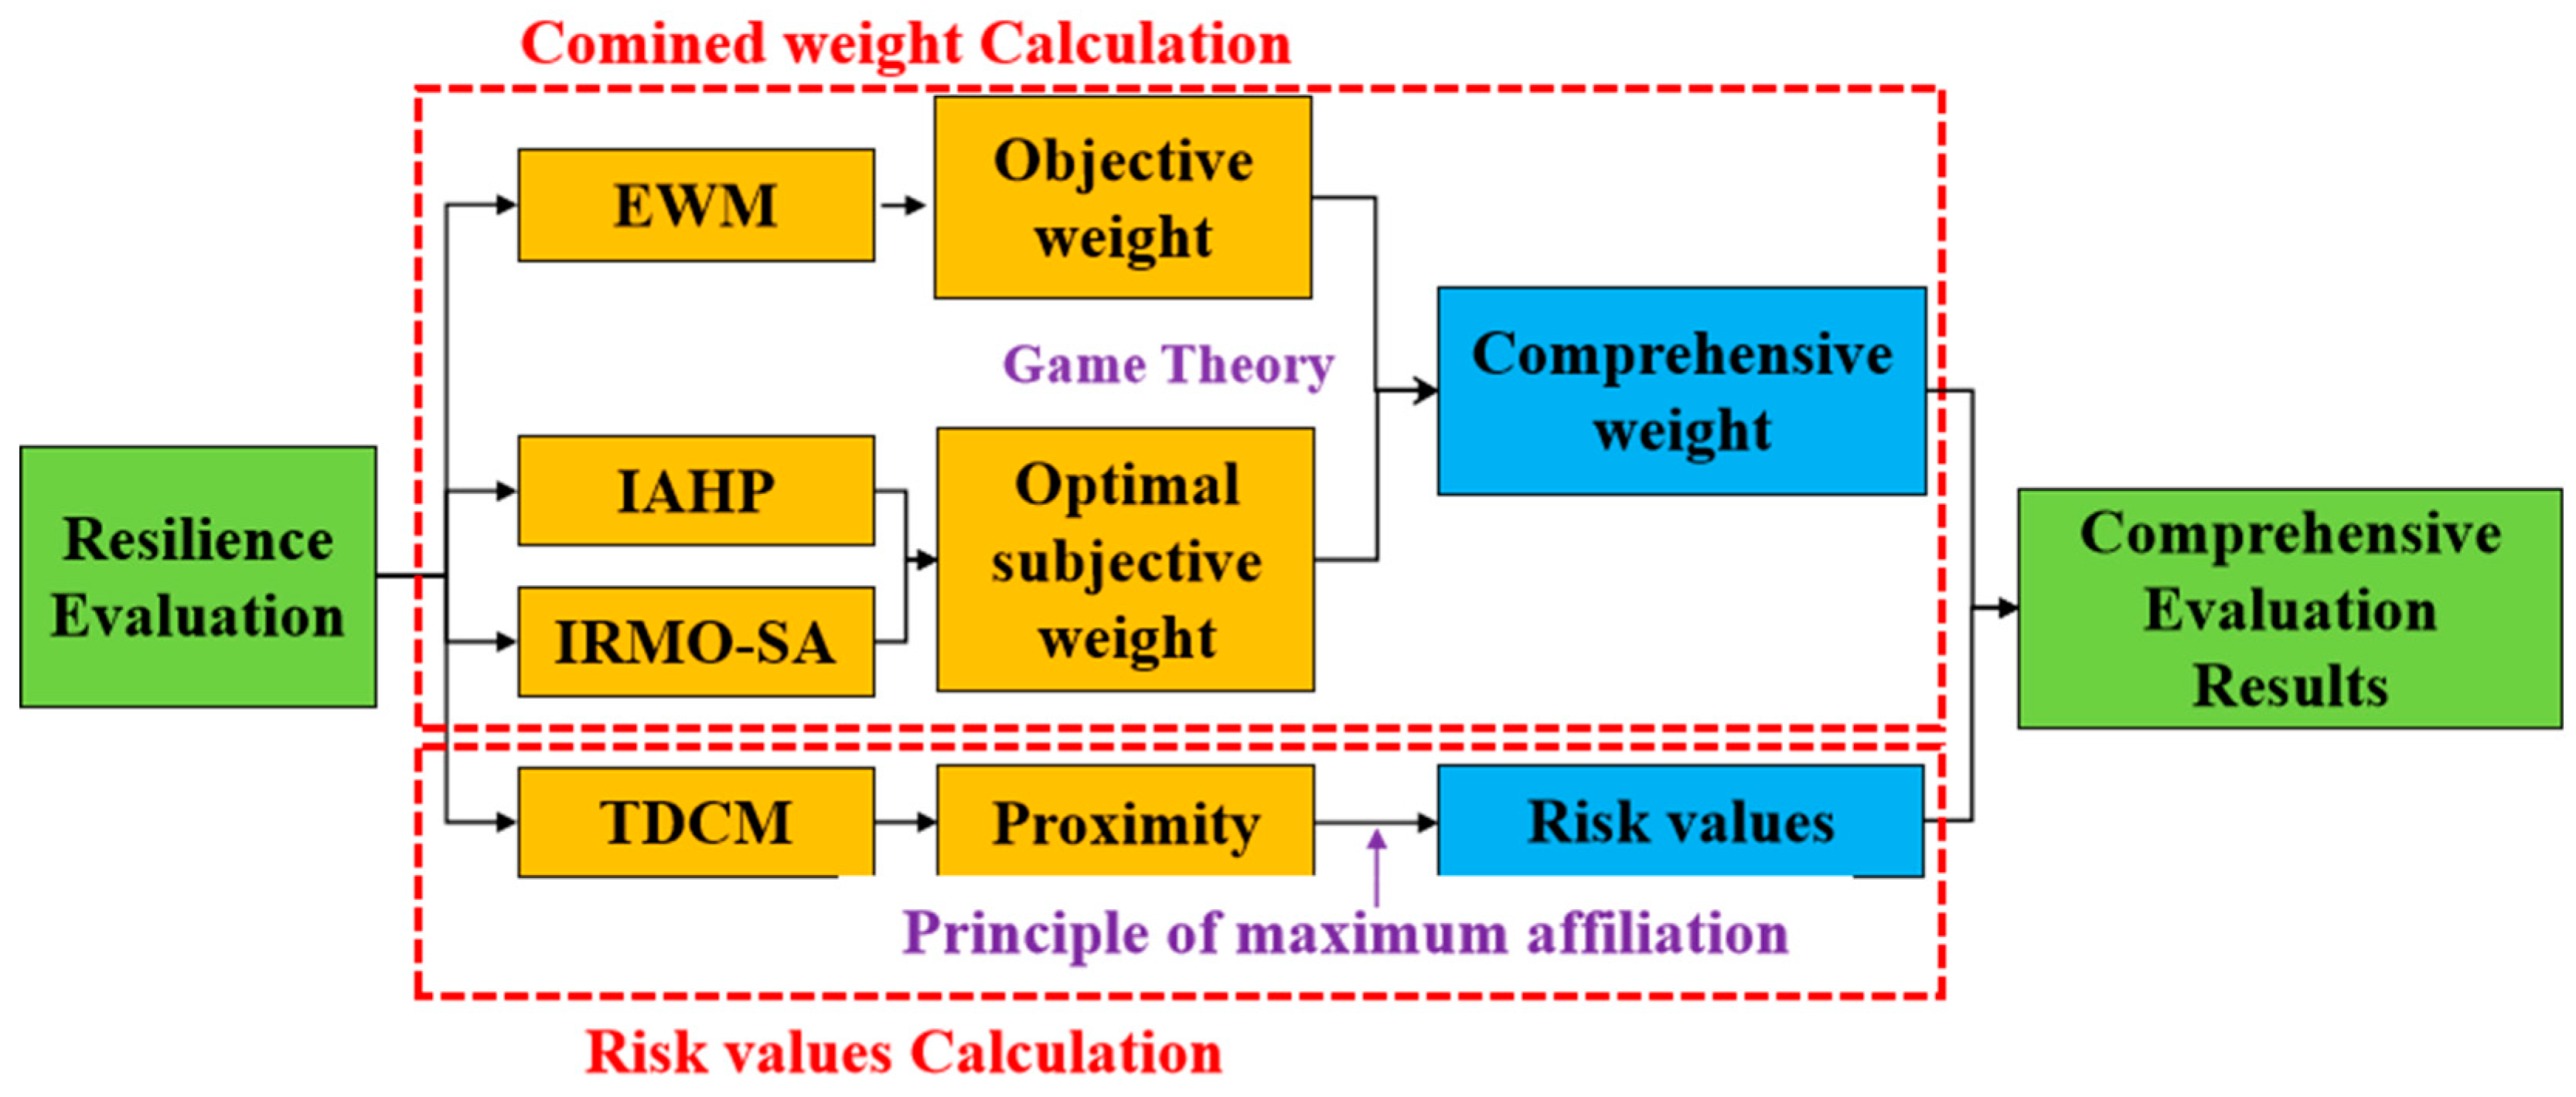
3. Comprehensive Evaluation Model of Resilience Based on Combination Weighting and TDCM
3.1. Combination Weighting Method
3.1.1. IAHP-IRMO-SA Method for Solving Optimal Subjective Weights
- IAHP method
- (1)
- Construct a judgment matrix of intervals.
- (2)
- Build an objective optimization model.
- b.
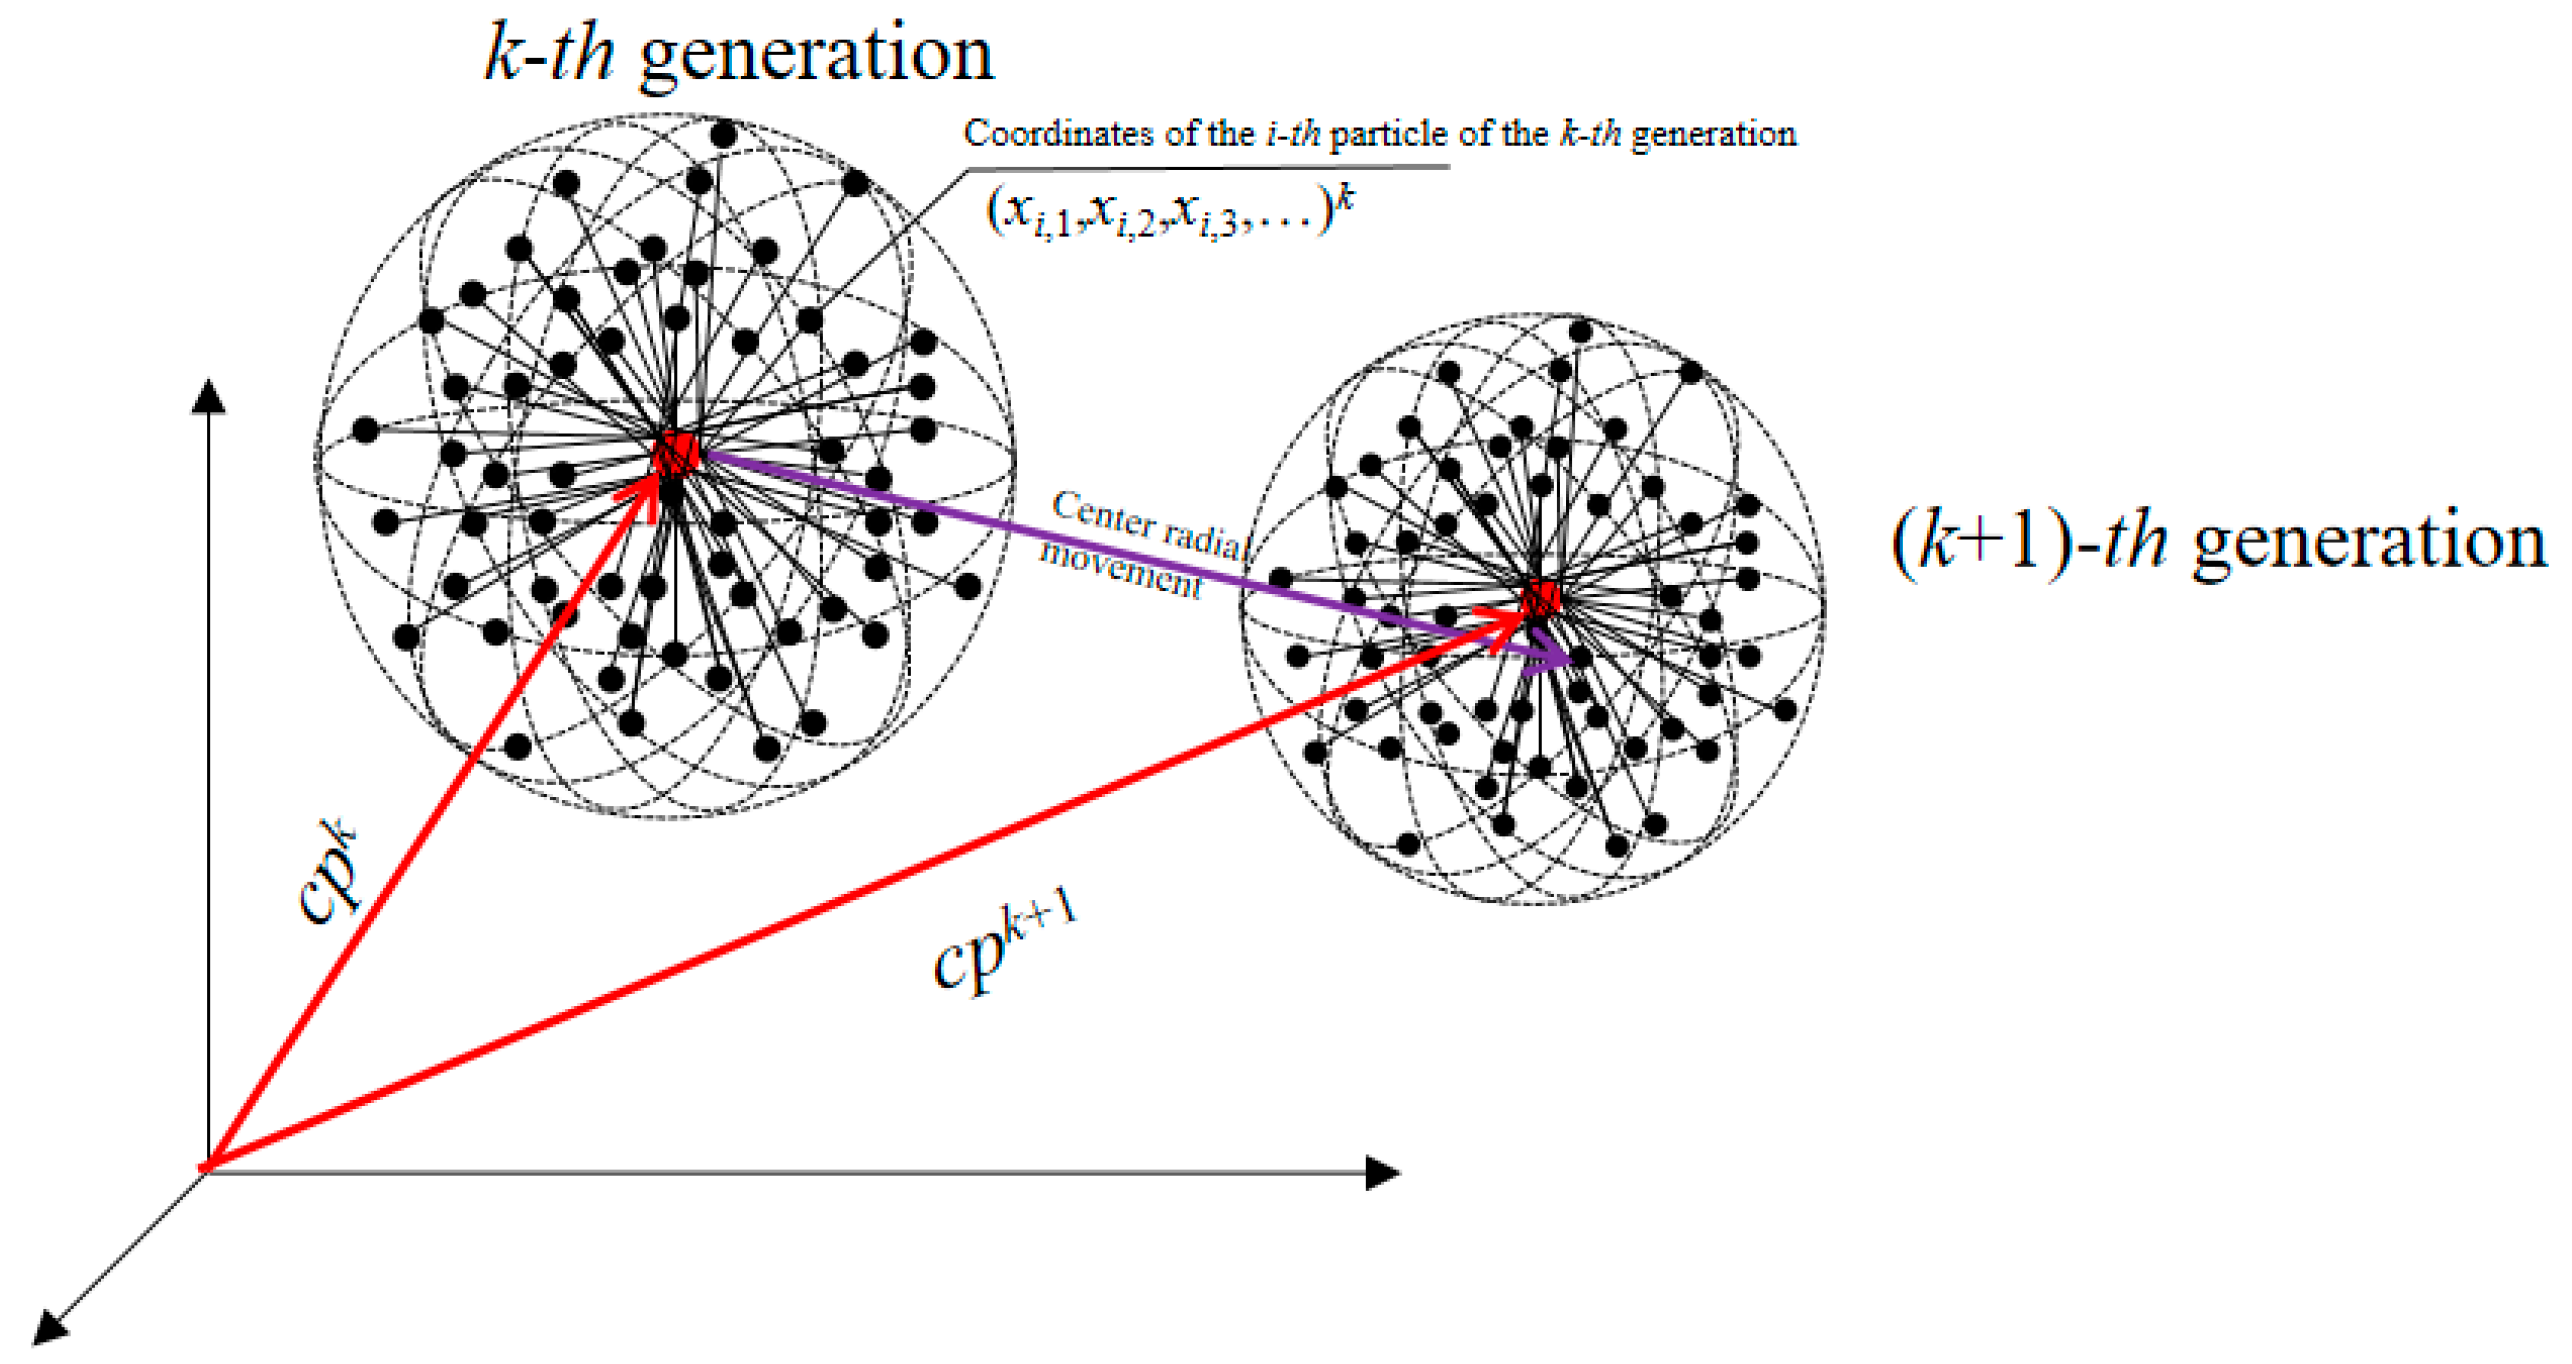
- IRMO algorithm
- c.
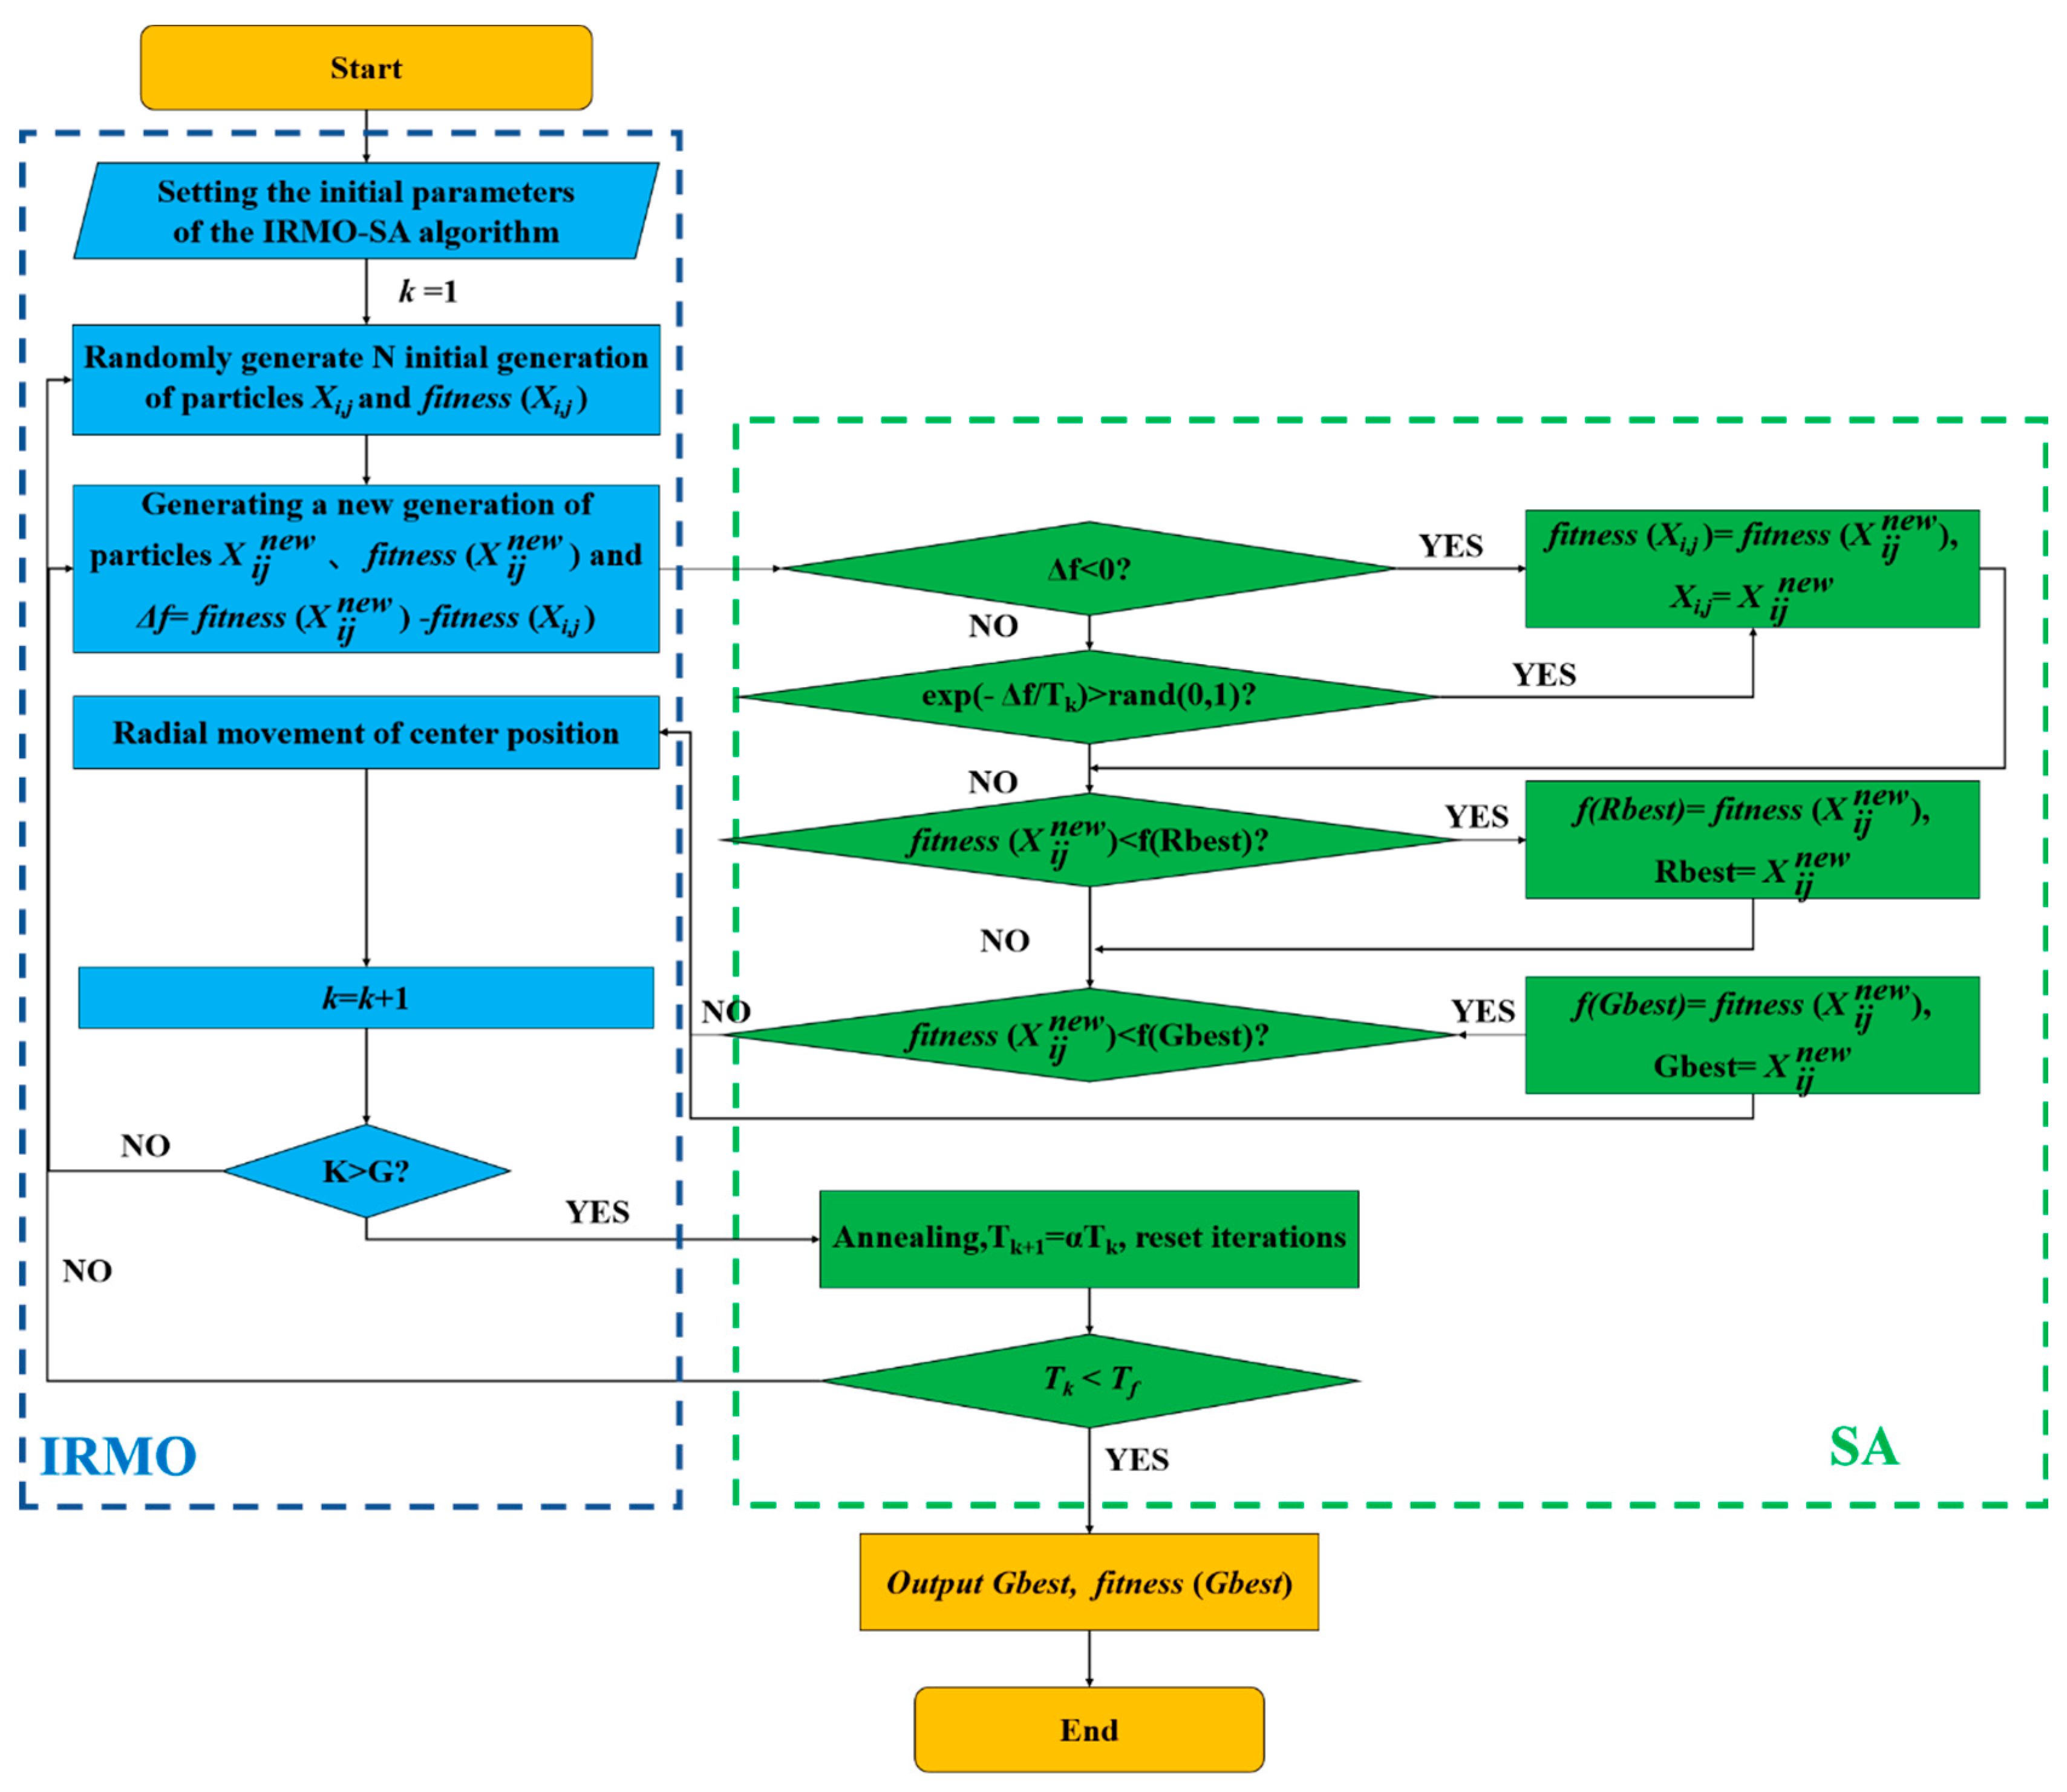
- IRMO-SA
- (1)
- Construct the objective function of the IRMO-SA algorithm.
- (2)
- Obtain the optimal weight solution of the interval number judgment matrix based on IAHP-IRMO-SA.
3.1.2. The Entropy Weighting Method Used to Solve the Objective Weights
- (1)
- Standardize the data.
- (2)
- Normalize the data to obtain the normalization matrix .
- (3)
- Calculate the information entropy value for the j-th indicator.
- (4)
- Calculate the objective weight for the j-th indicator.
3.1.3. Combination Weighting Method Based on Game Theory
- (1)
- Construct the set of basis weight vectors .
- (2)
- Construct a linear combination of weight vectors .
- (3)
- Optimally solve the linear combination of weight coefficients .
- (4)
- Normalize to obtain the optimal linear combination weight coefficients .
- (5)
- Calculate the combined weight .
3.2. TDCM
3.2.1. Basic Concepts
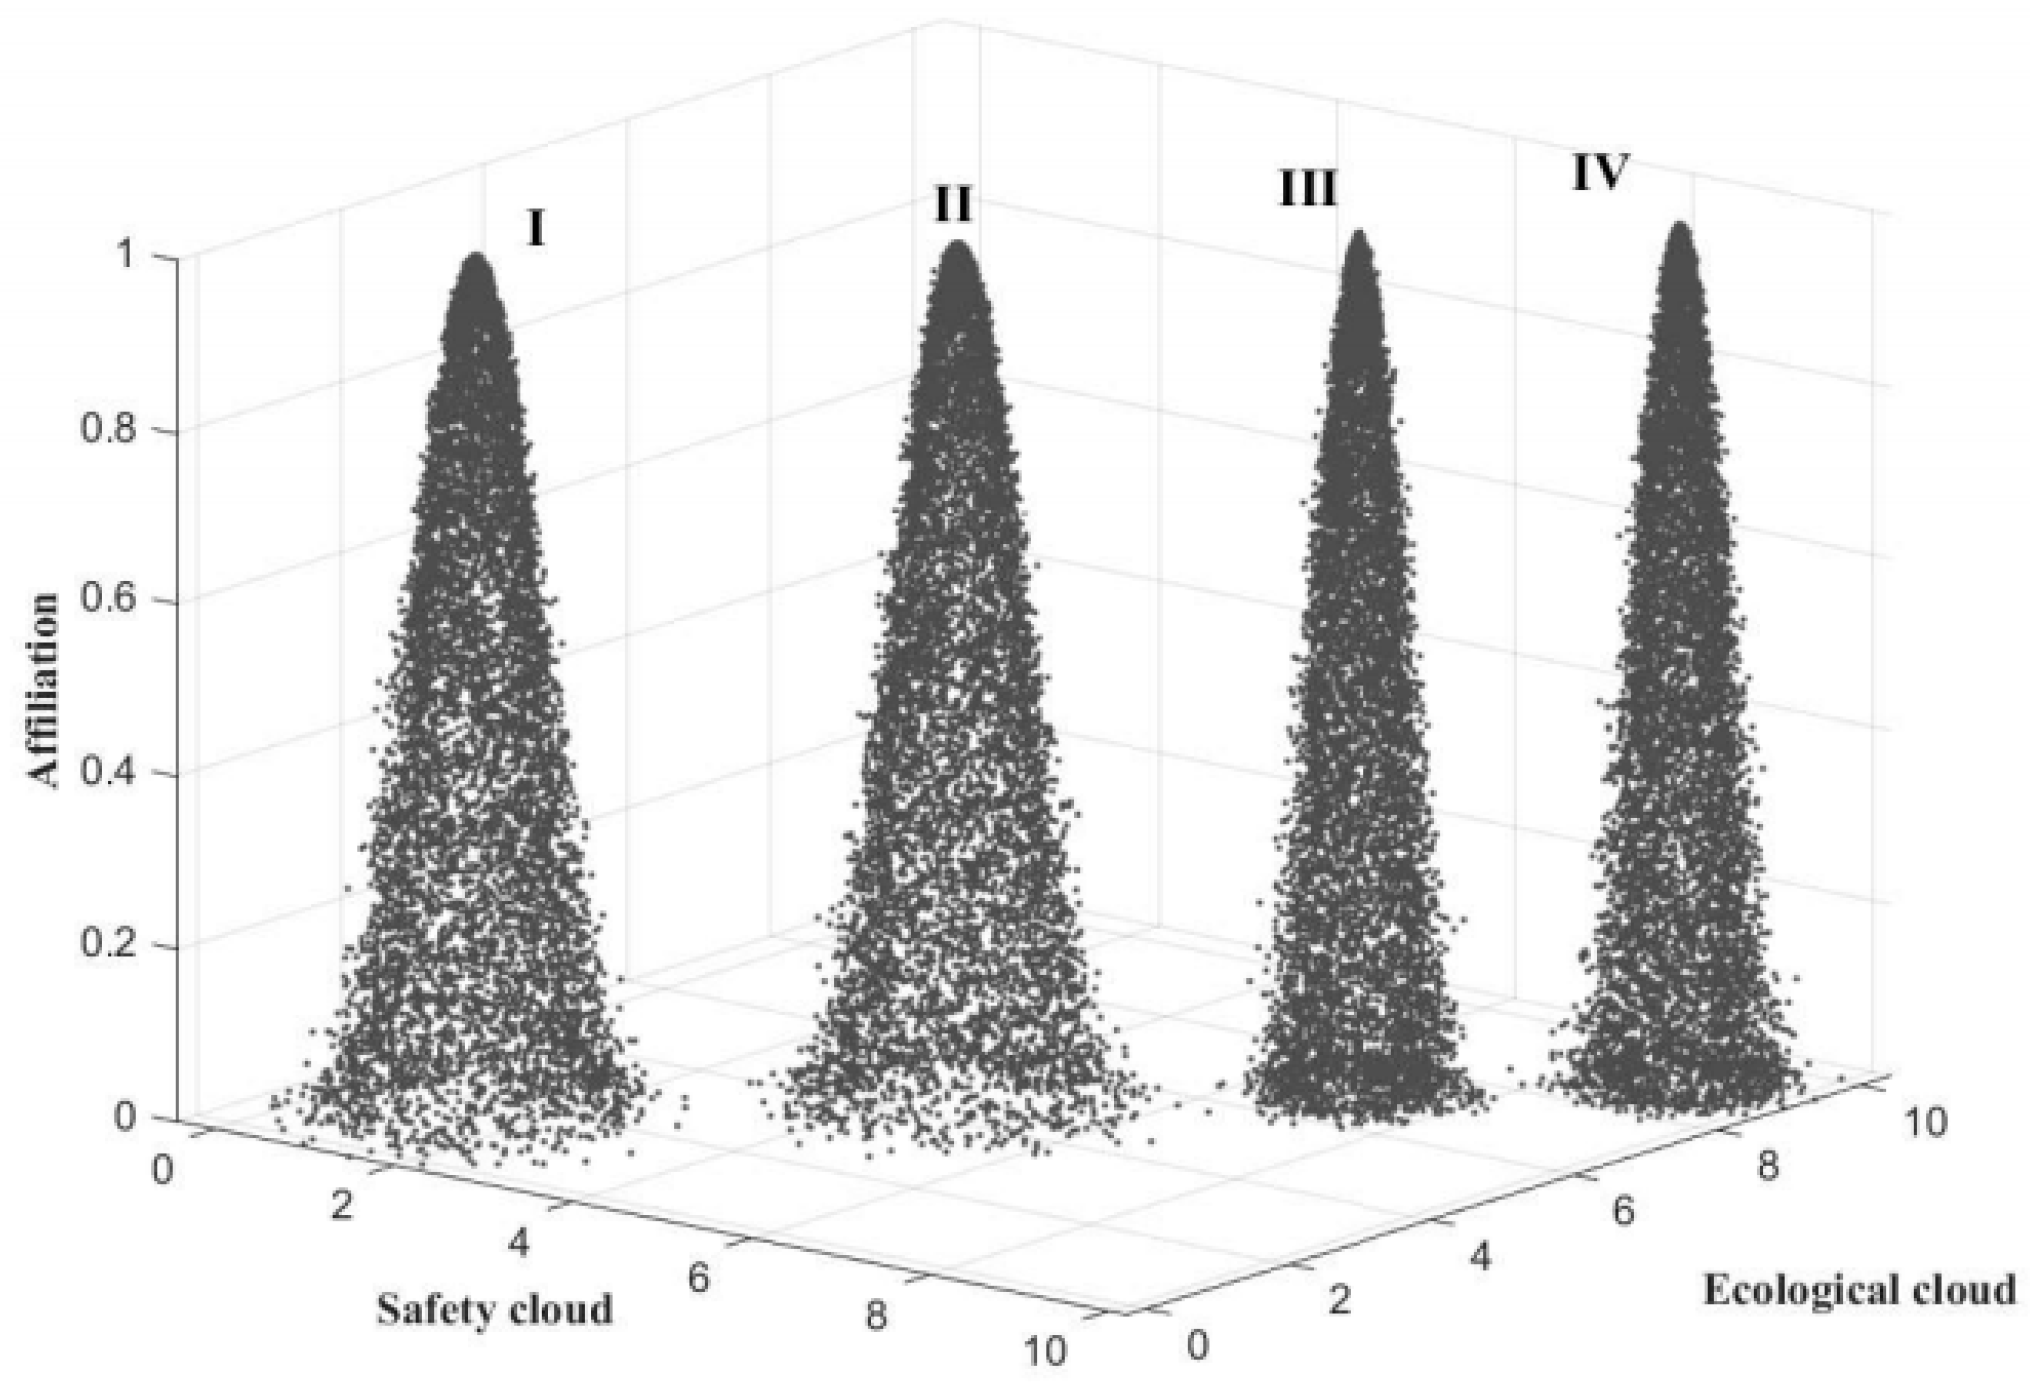
3.2.2. Two-Dimensional Cloud Modeling
- (1)
- Standard cloud
- (2)
- Comprehensive evaluation cloud
- (3)
- Proximity
3.3. Comparative Analysis
3.3.1. Accuracy Analysis of IRMO-SA
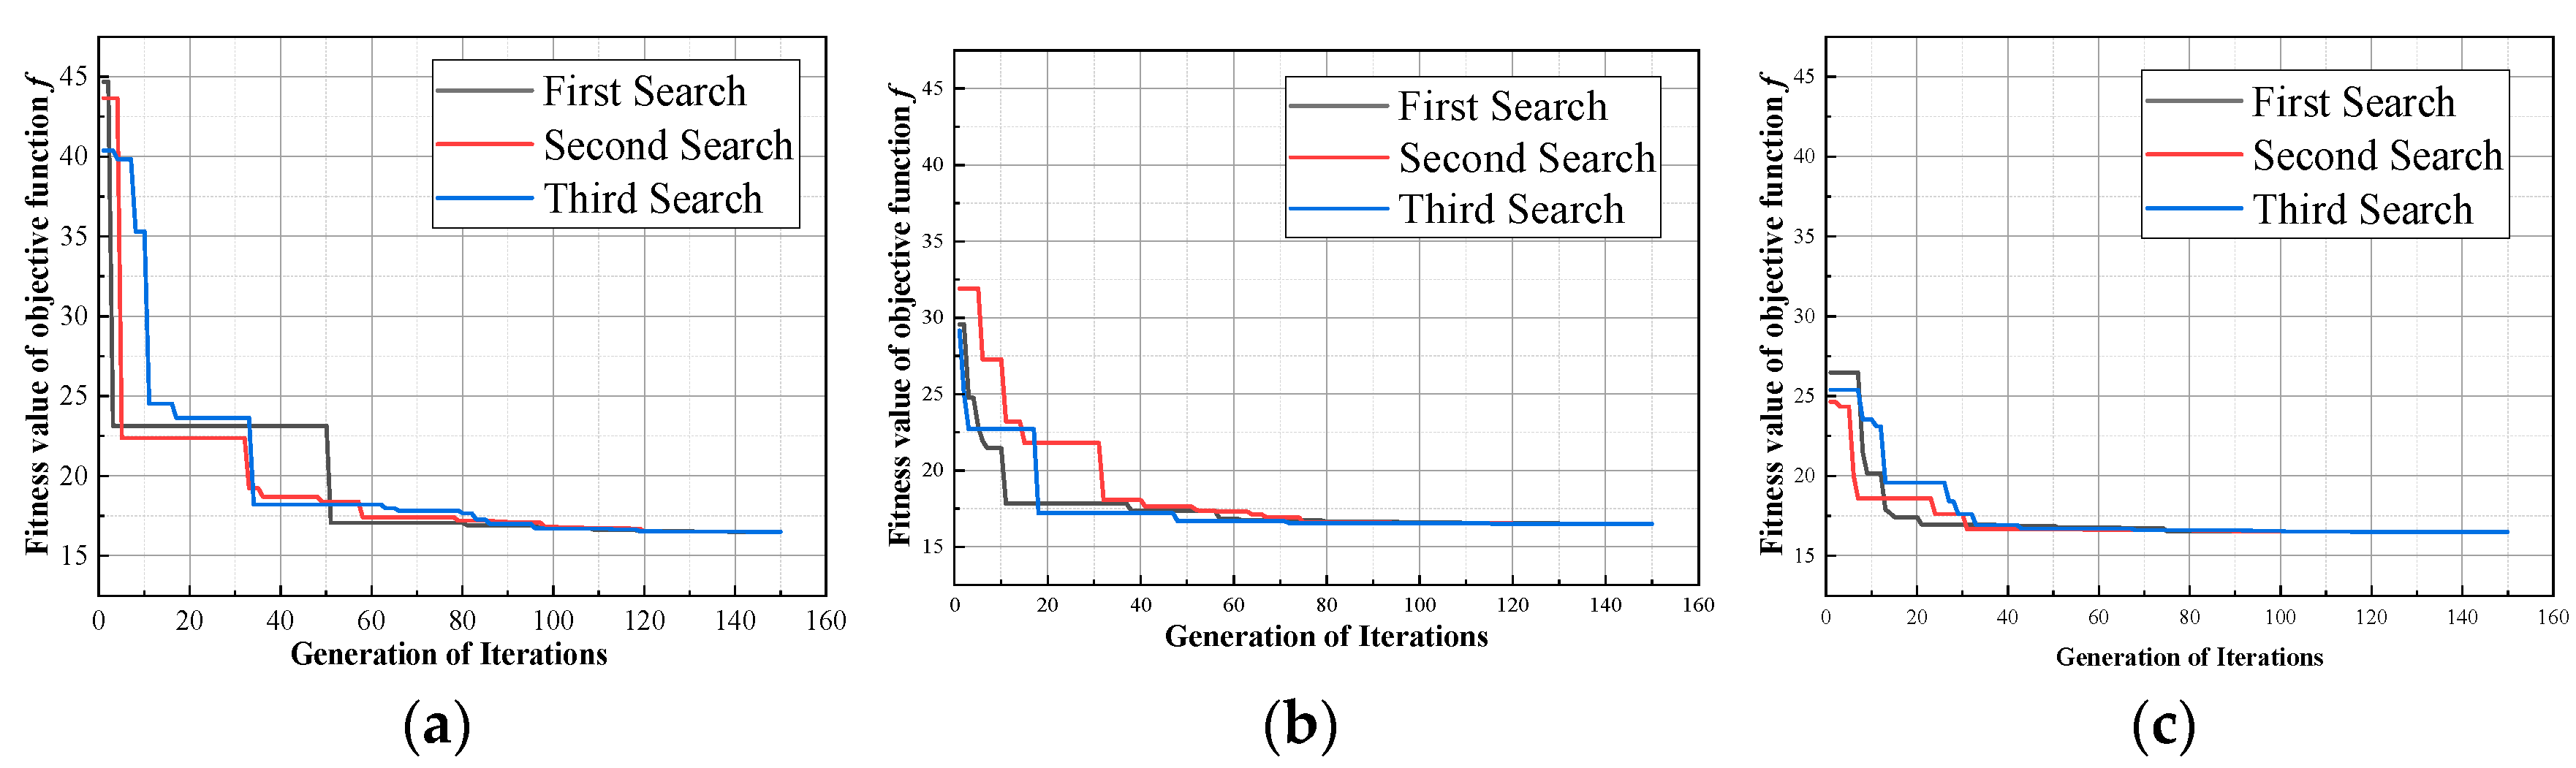
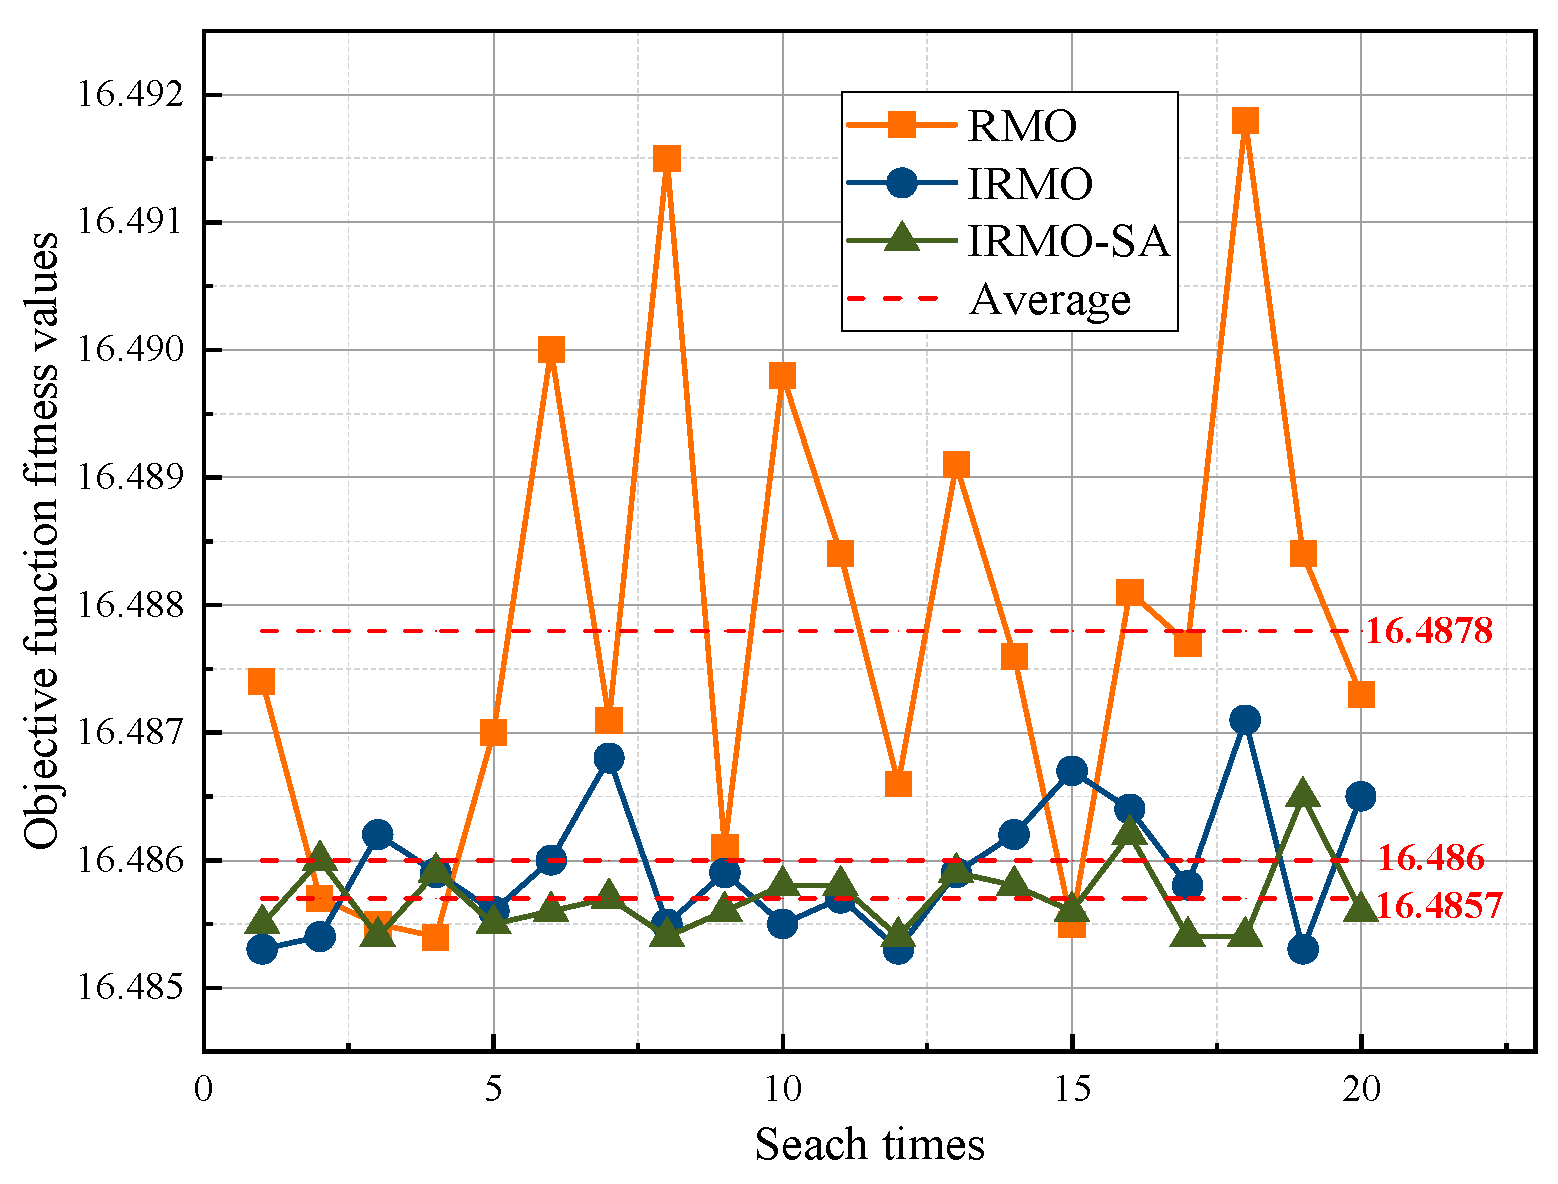
3.3.2. Stability and Efficiency Verification of IRMO-SA Method
4. Case Study
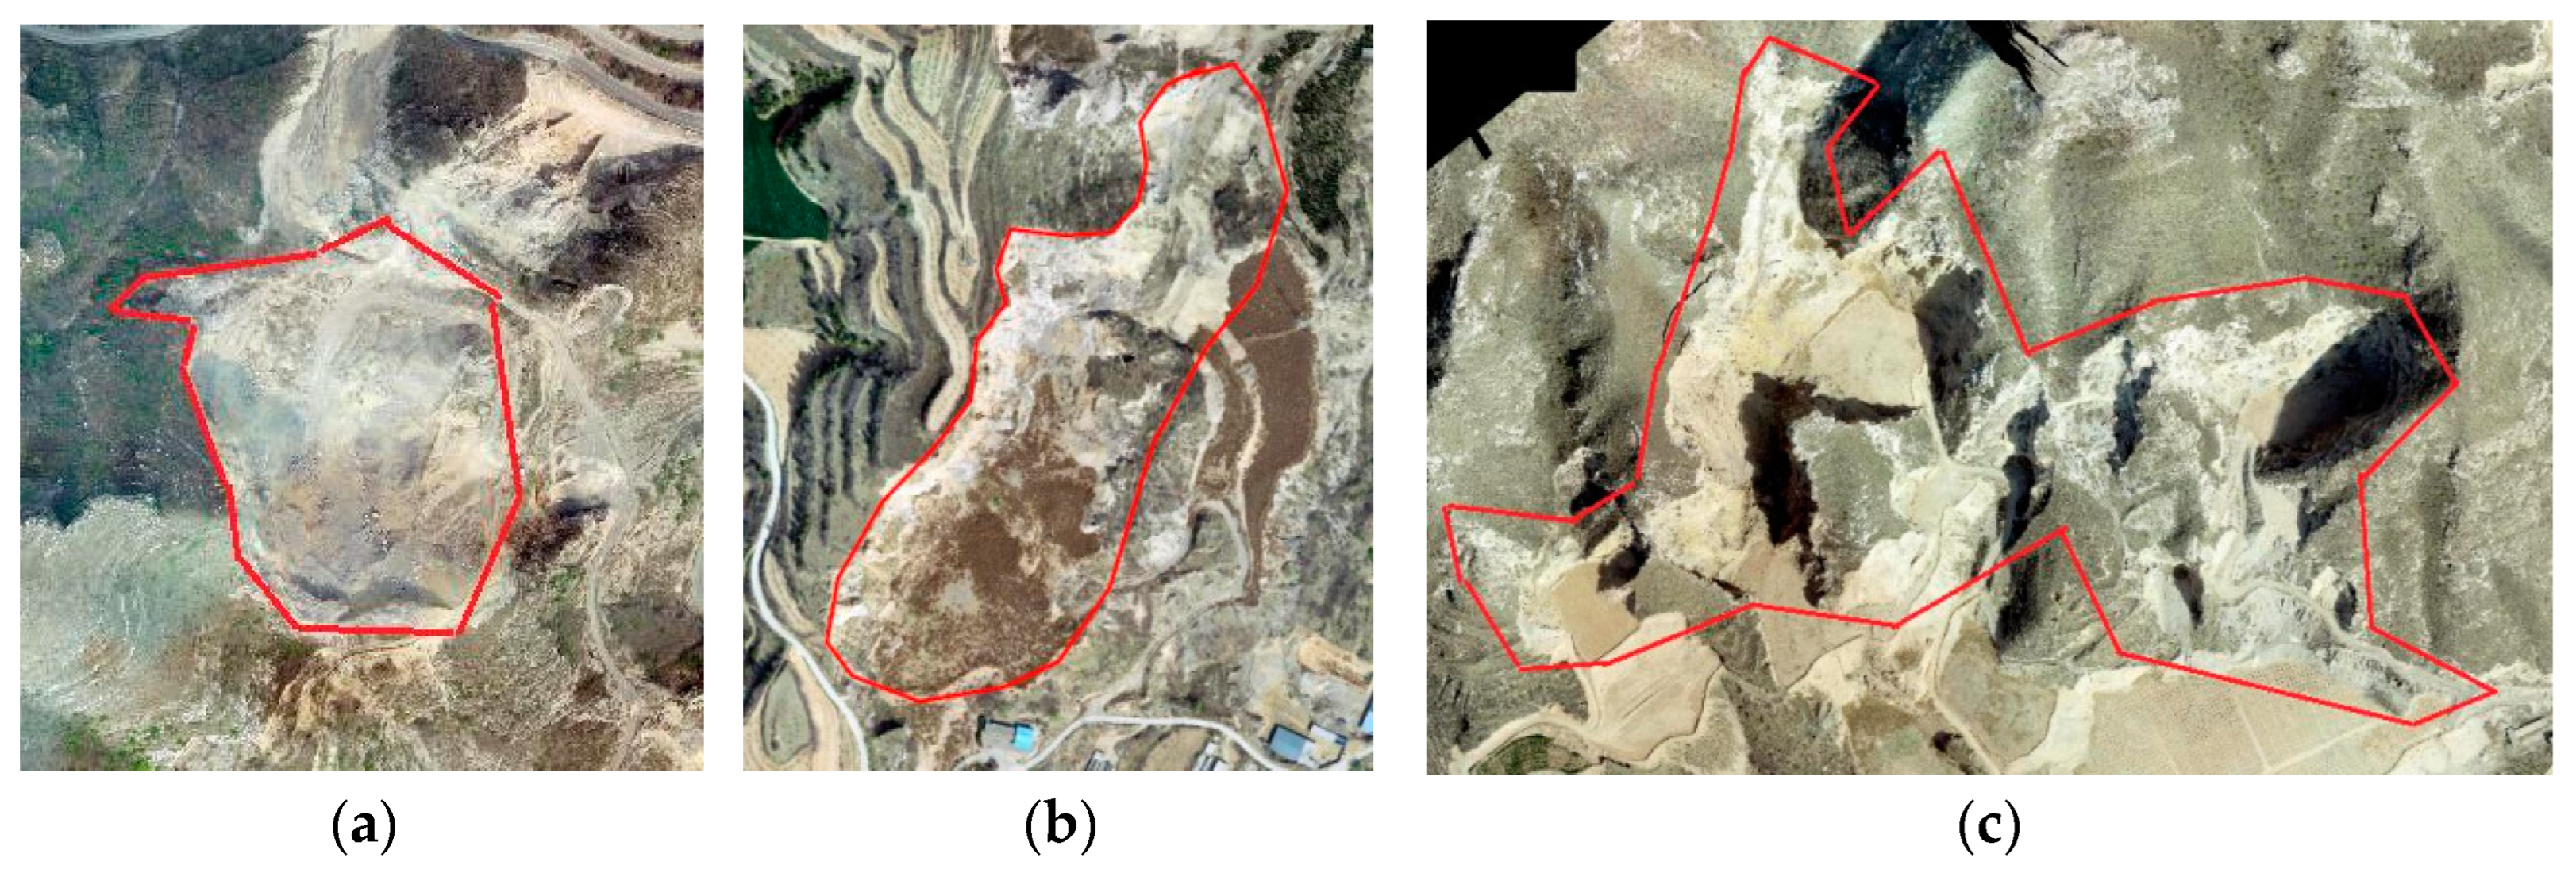
4.1. Overview
- (1)
- Basic situation
- (2)
- Meteorological and Hydrological Conditions
4.2. Determination of Indicator Weights
4.2.1. Determination of Optimal Subjective Weights using SA-RMO-IAHP
4.2.2. Determination of Objective Weights Using EWM
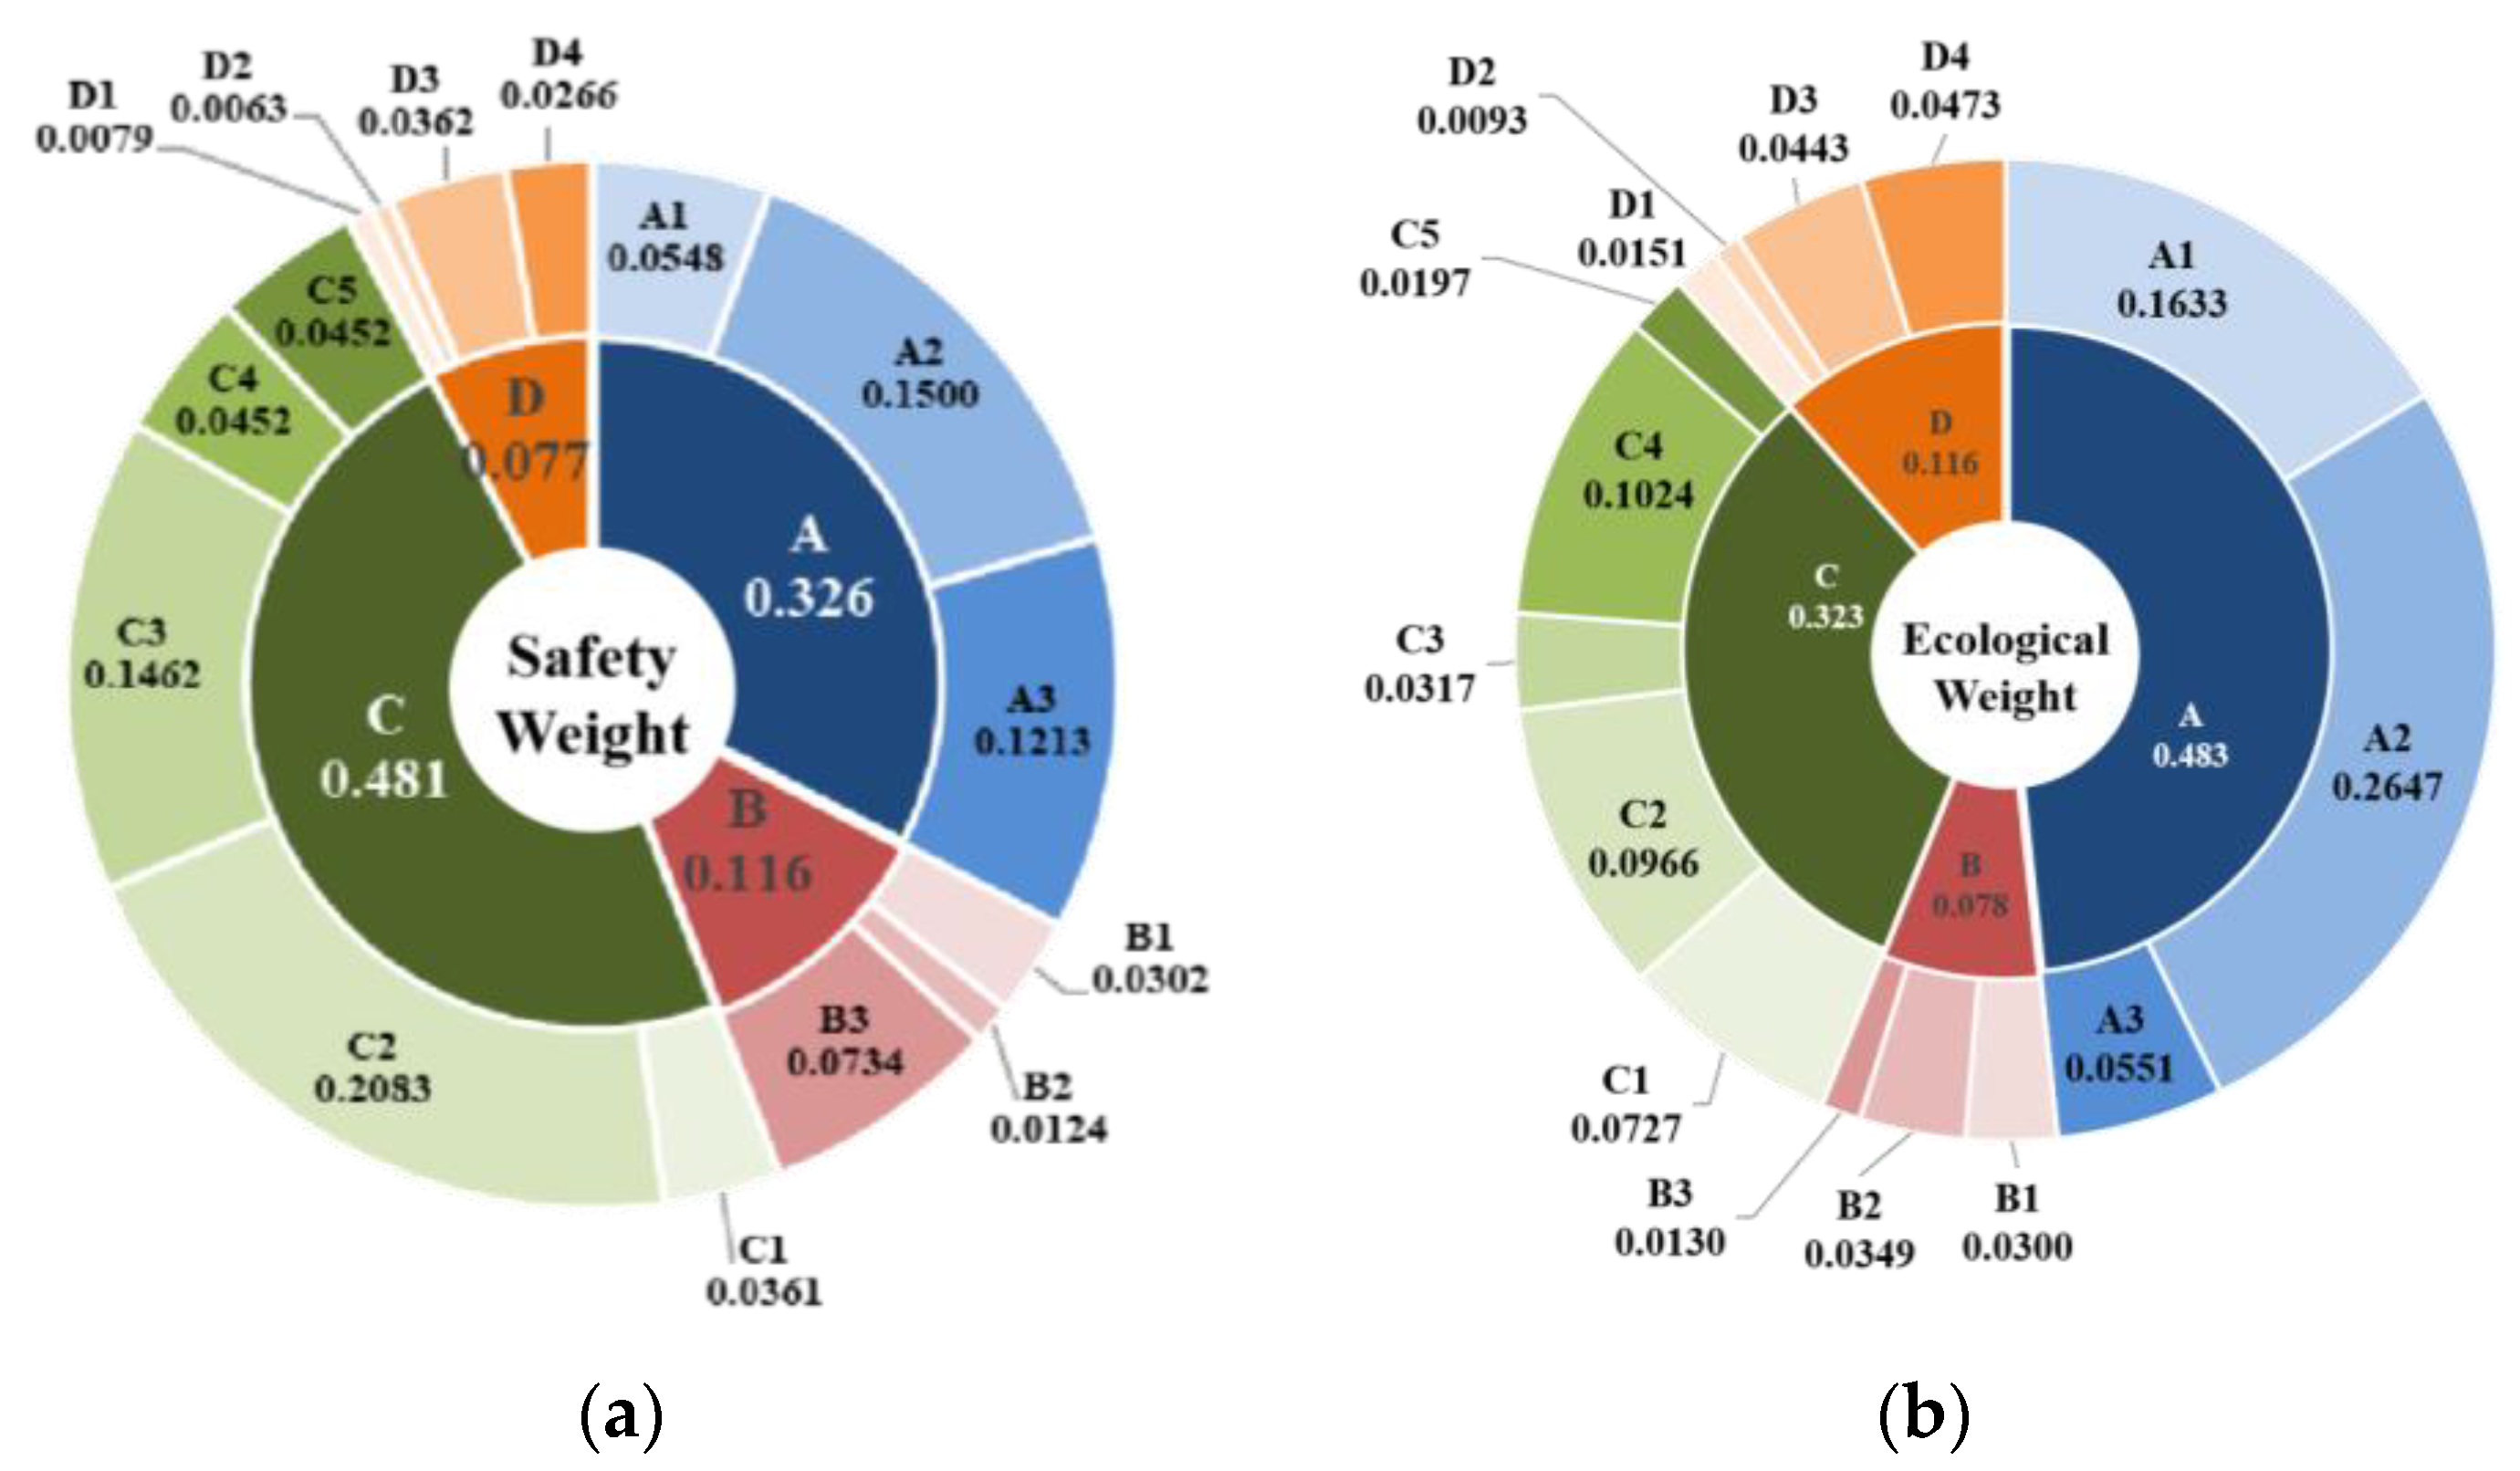
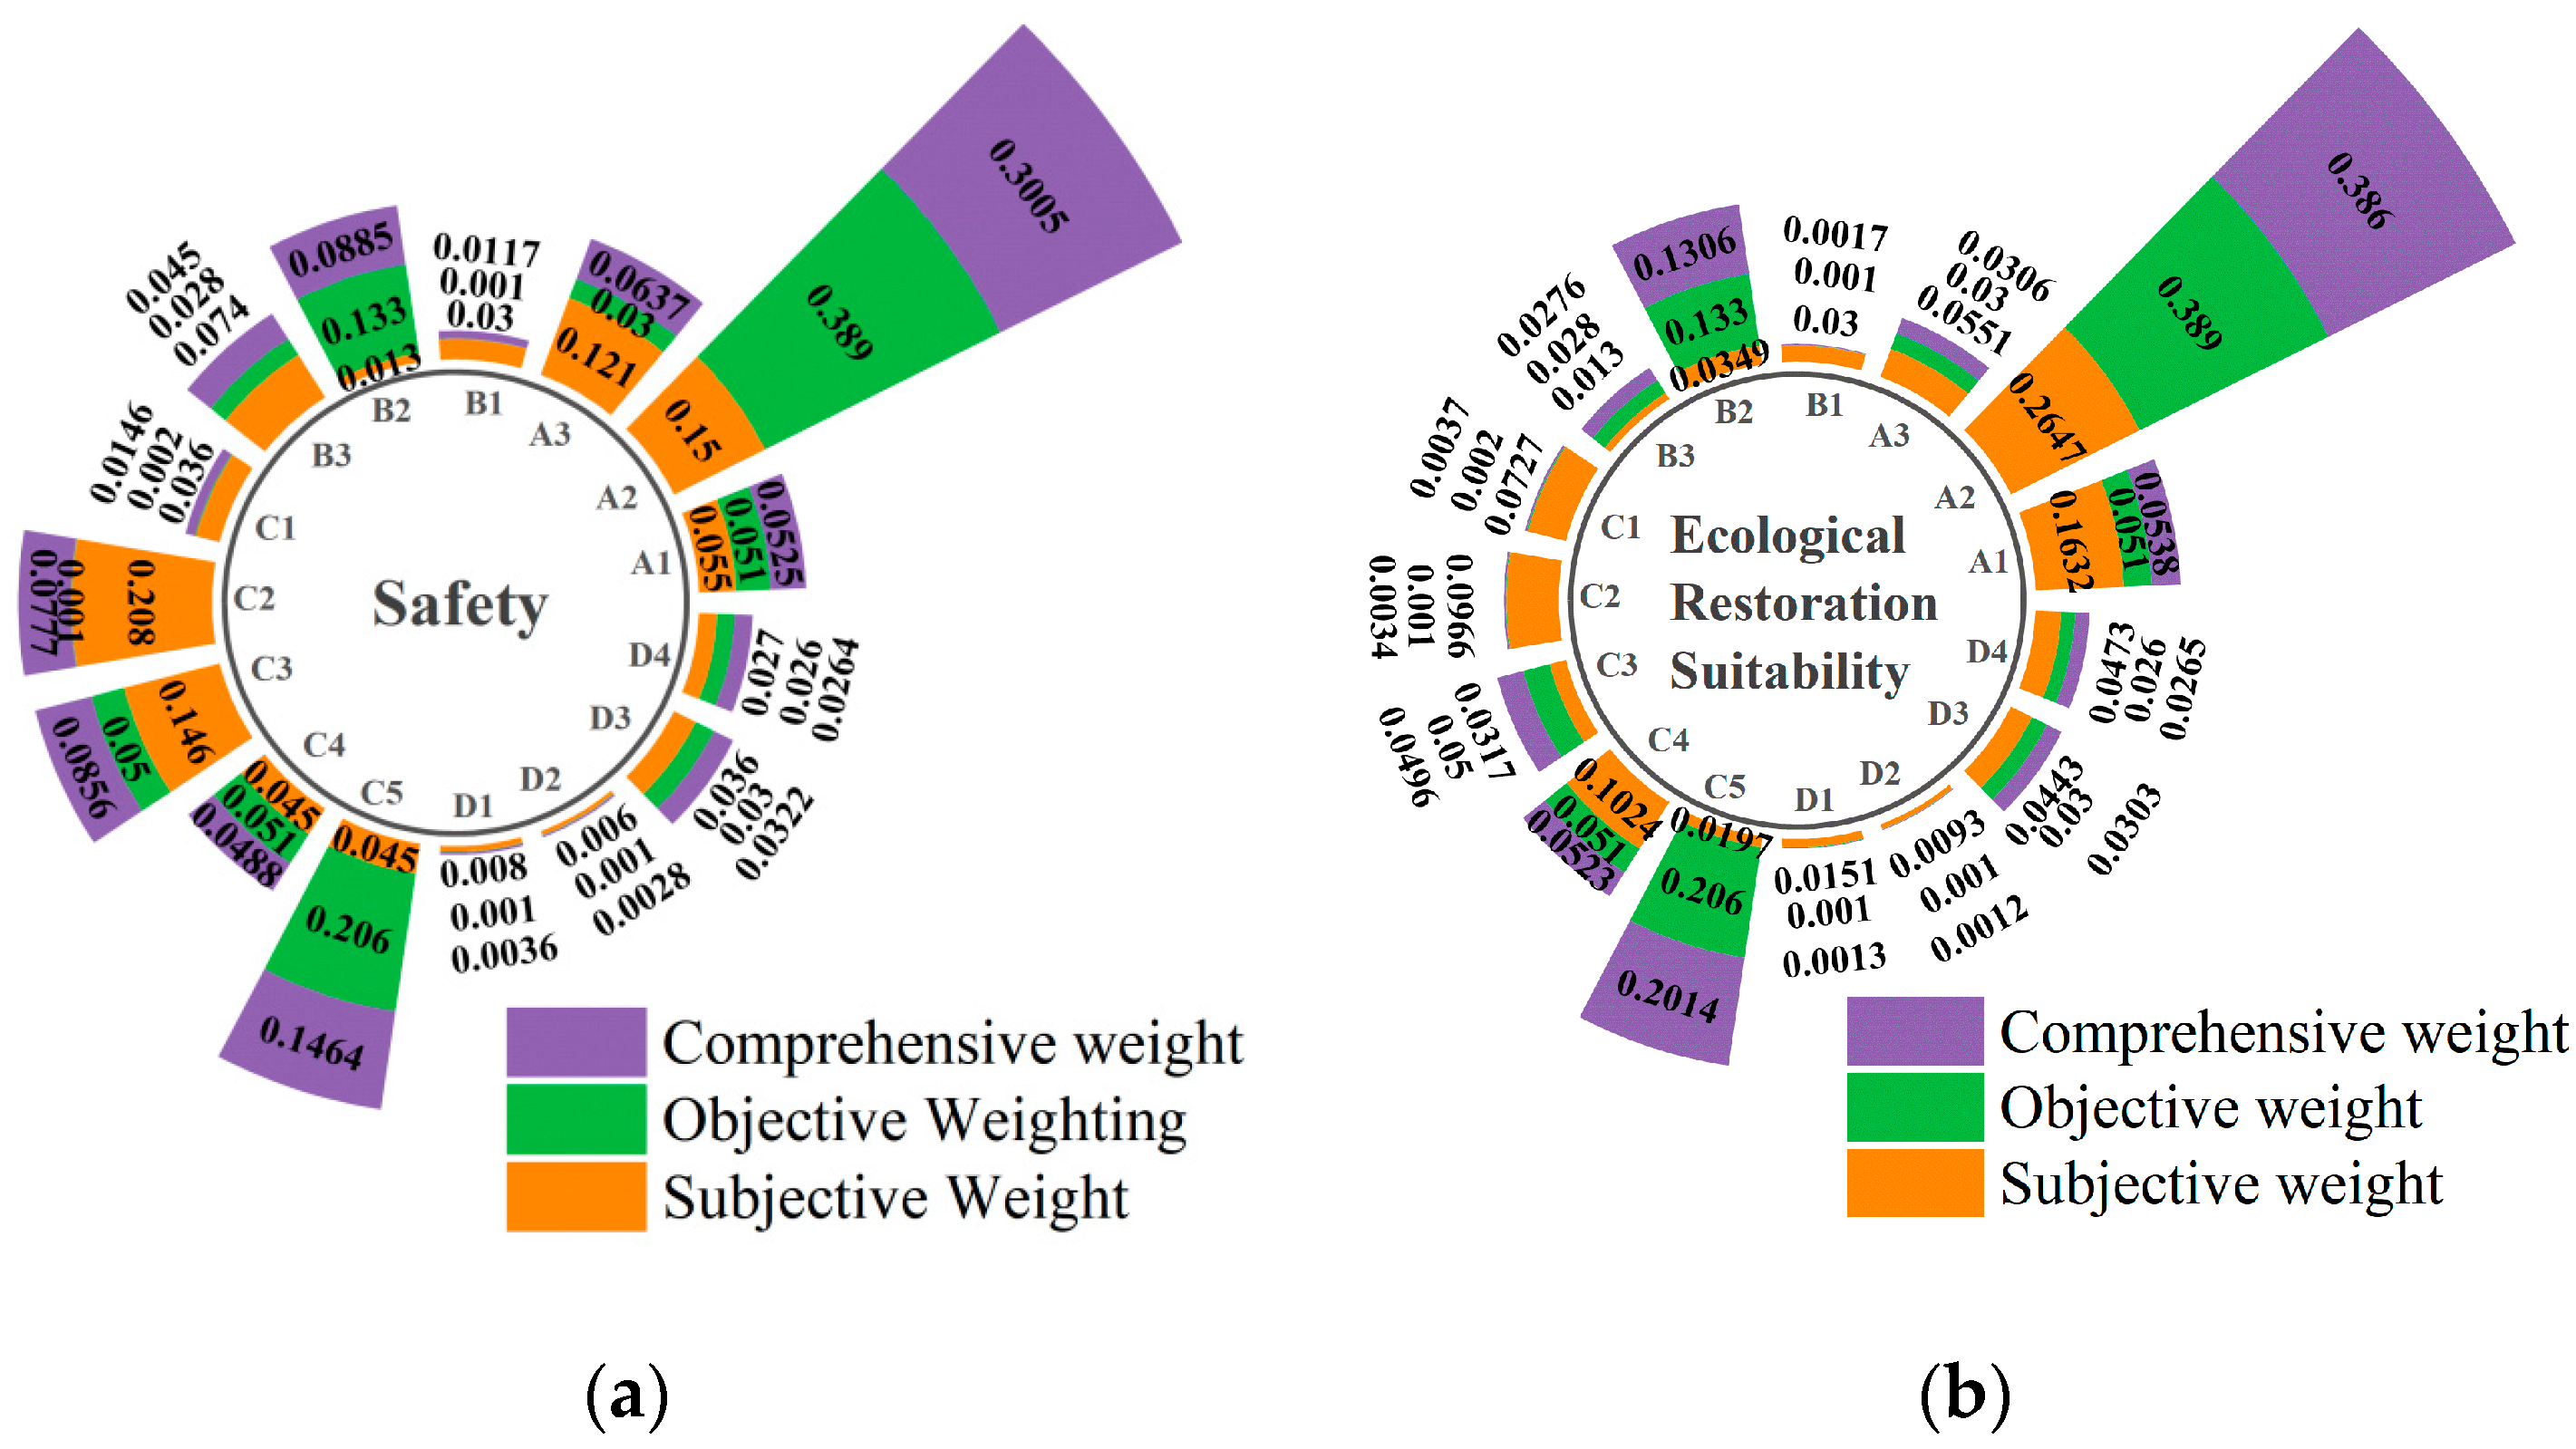
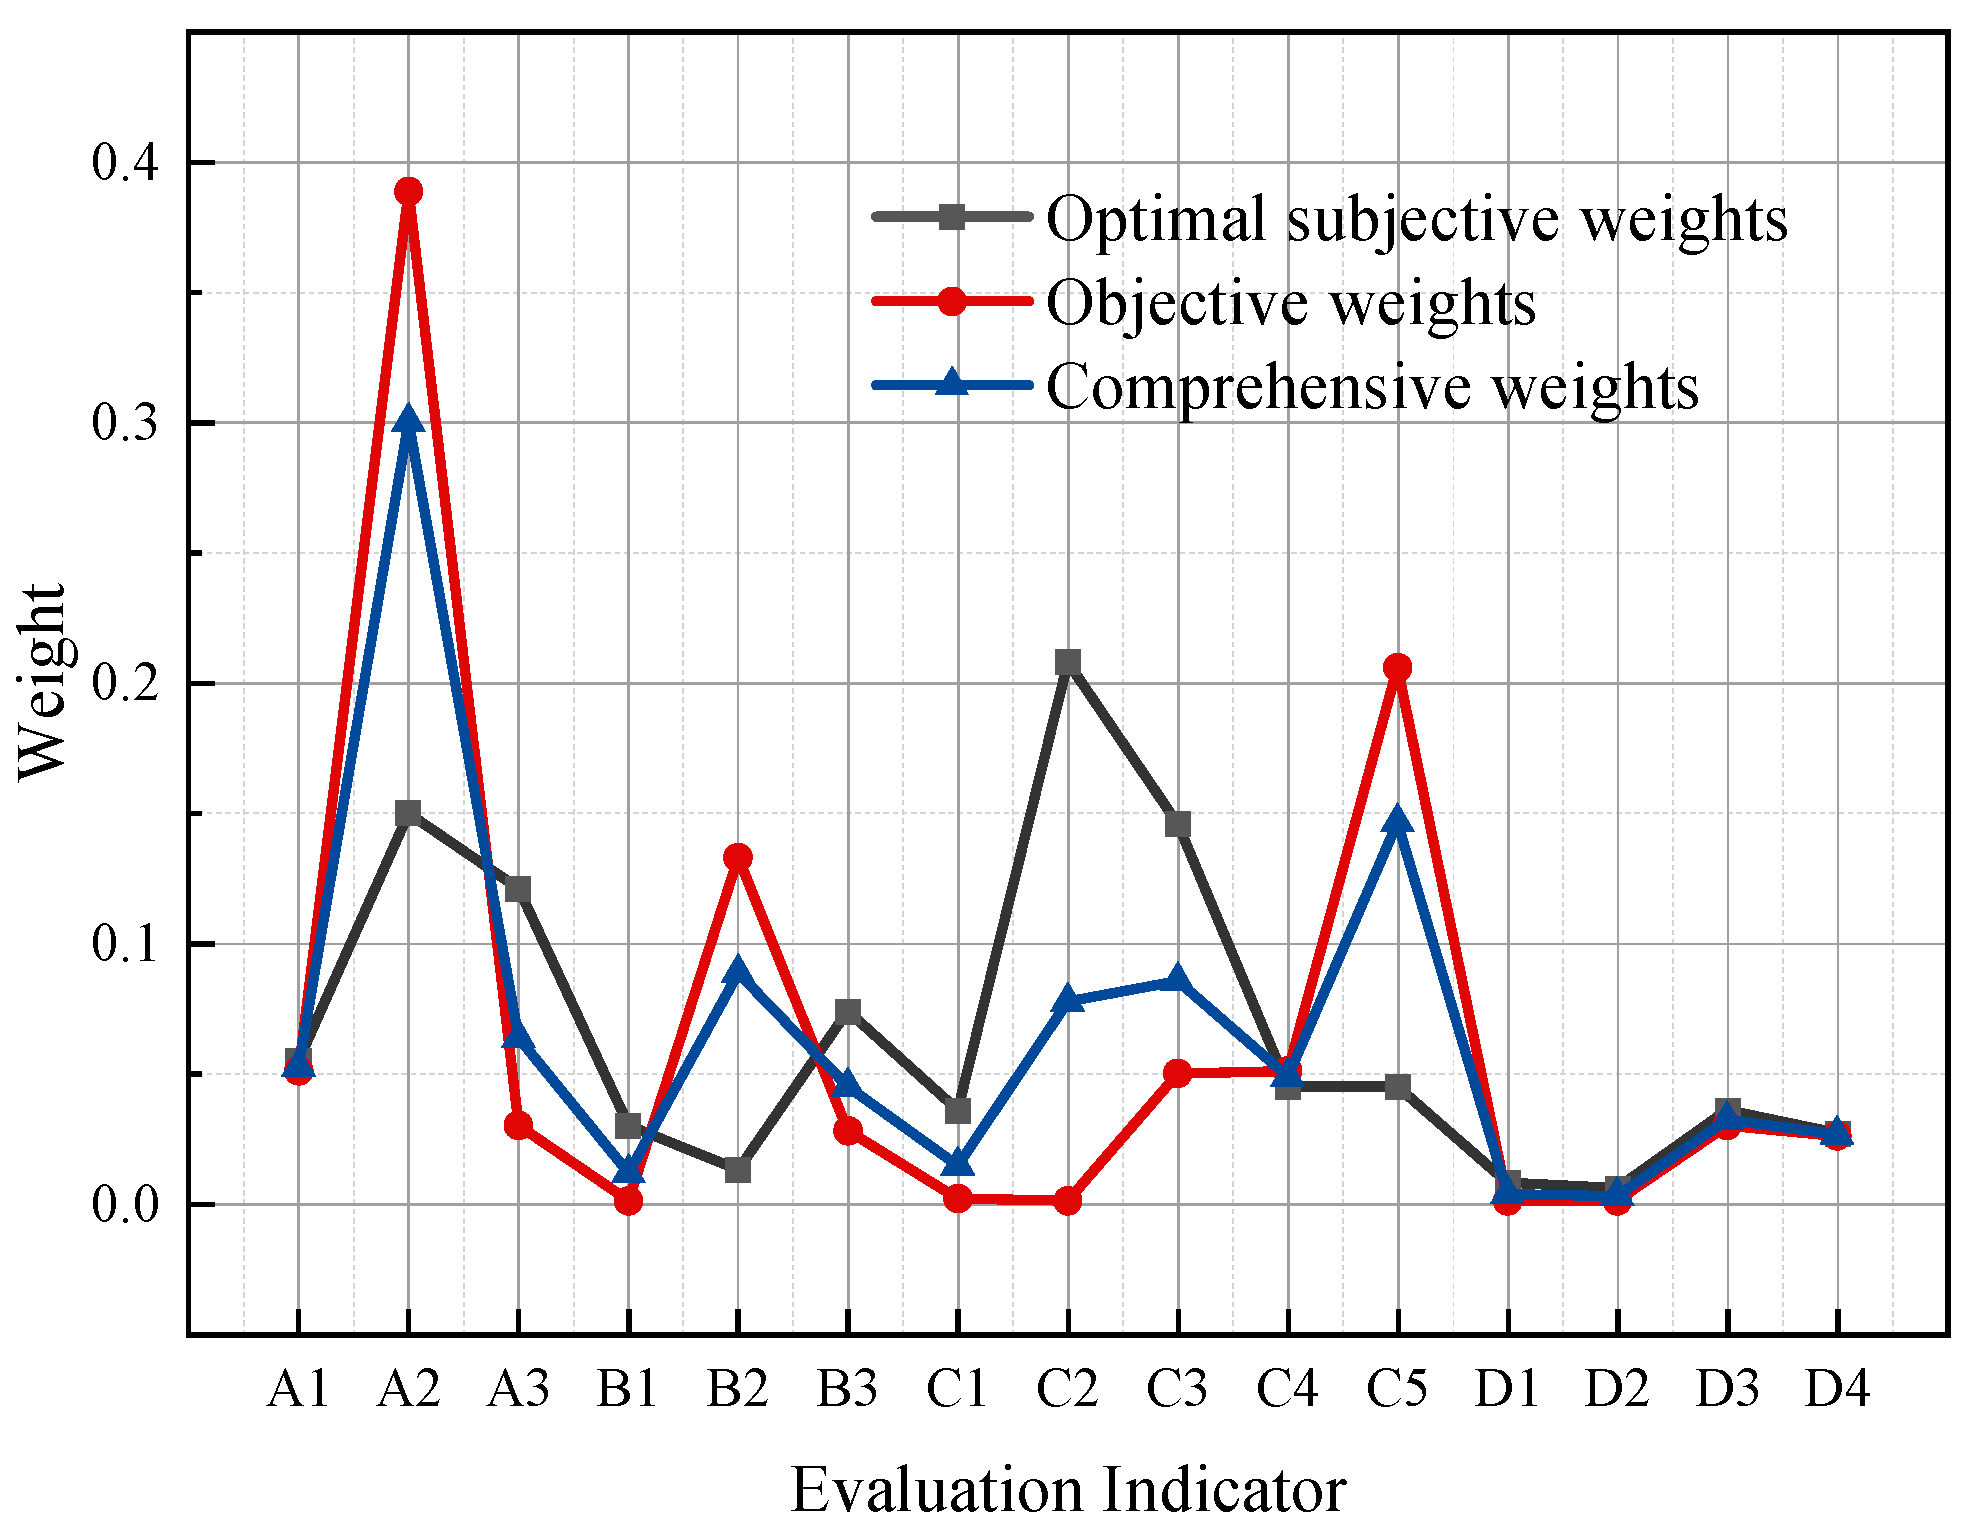
4.2.3. Determination of Comprehensive Weights
4.3. Comprehensive Evaluation and Verification
5. Discussion
- (1)
- As indicated in Table 12, the safety ranking is as follows: Zhubei Quarry #1 > Yanhua Quarry > Torch Quarry. The ecological restoration suitability ranking is as follows: Zhubei Quarry #1 > Yanhua Quarry > Torch Quarry. By comparing the actual conditions of the mines and the data in Table 10, the safety evaluation results are generally consistent with the actual situation. The total investment in ecological restoration in Table 9 is ranked as follows: Zhubei Quarry #1 > Yanhua Quarry > Torch Quarry. This sequence indirectly reflects the ecological restoration suitability of the respective quarry slopes, aligning with the ecological assessment results obtained using the evaluation methodology employed in this study.
- (2)
- During the management process in mining areas, researchers often integrate concepts such as the comprehensive utilization of waste rock resources, the elimination of geological safety hazards, slope stability, and ecological restoration. This is achieved through practices such as slope reduction, the lowering of step slope ratios, height control, platform installation, and the creation of tiered slopes to ensure overall slope stability. The reduction in slope load and slope ratio through slope cutting can eliminate geological safety hazards and maintain slope stability. The determination of the amount of rock cutting considers the ecological restoration suitability and slope safety of the mining area, reflecting the resilience level of abandoned open-pit mine steep slopes. Based on the data in Table 9, the quantity of cutting stone ranking is as follows: Zhubei Quarry #1 > Yanhua Quarry > Torch Quarry. The evaluation results align closely with the on-site situation, validating the applicability and feasibility of the method proposed in this paper.
- (3)
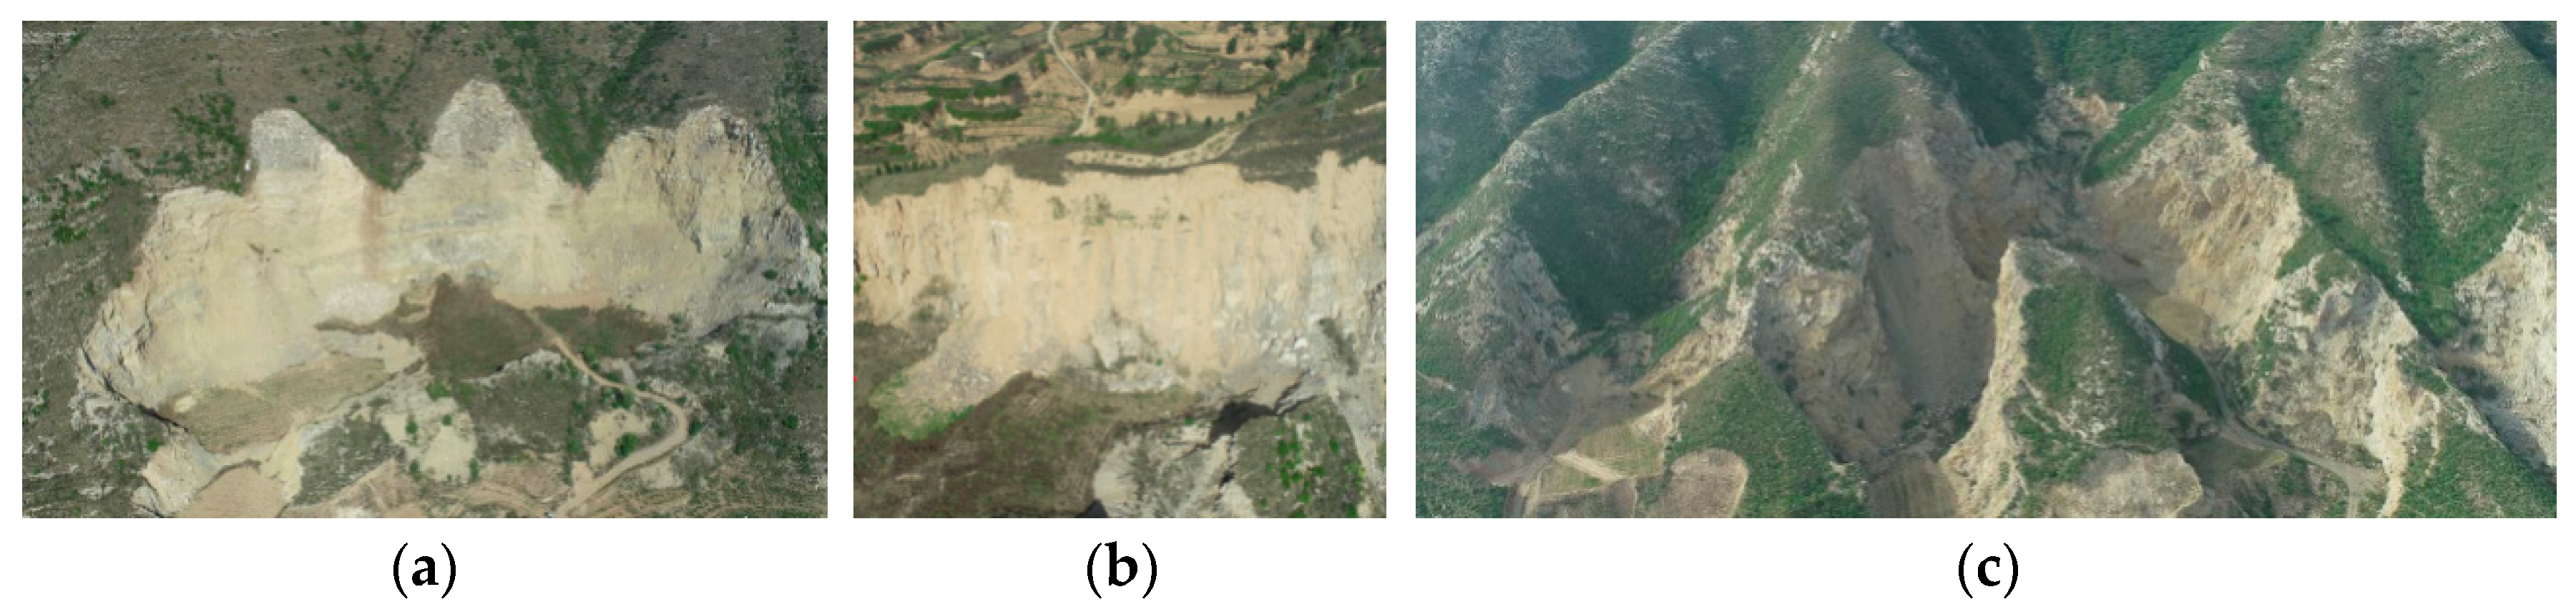
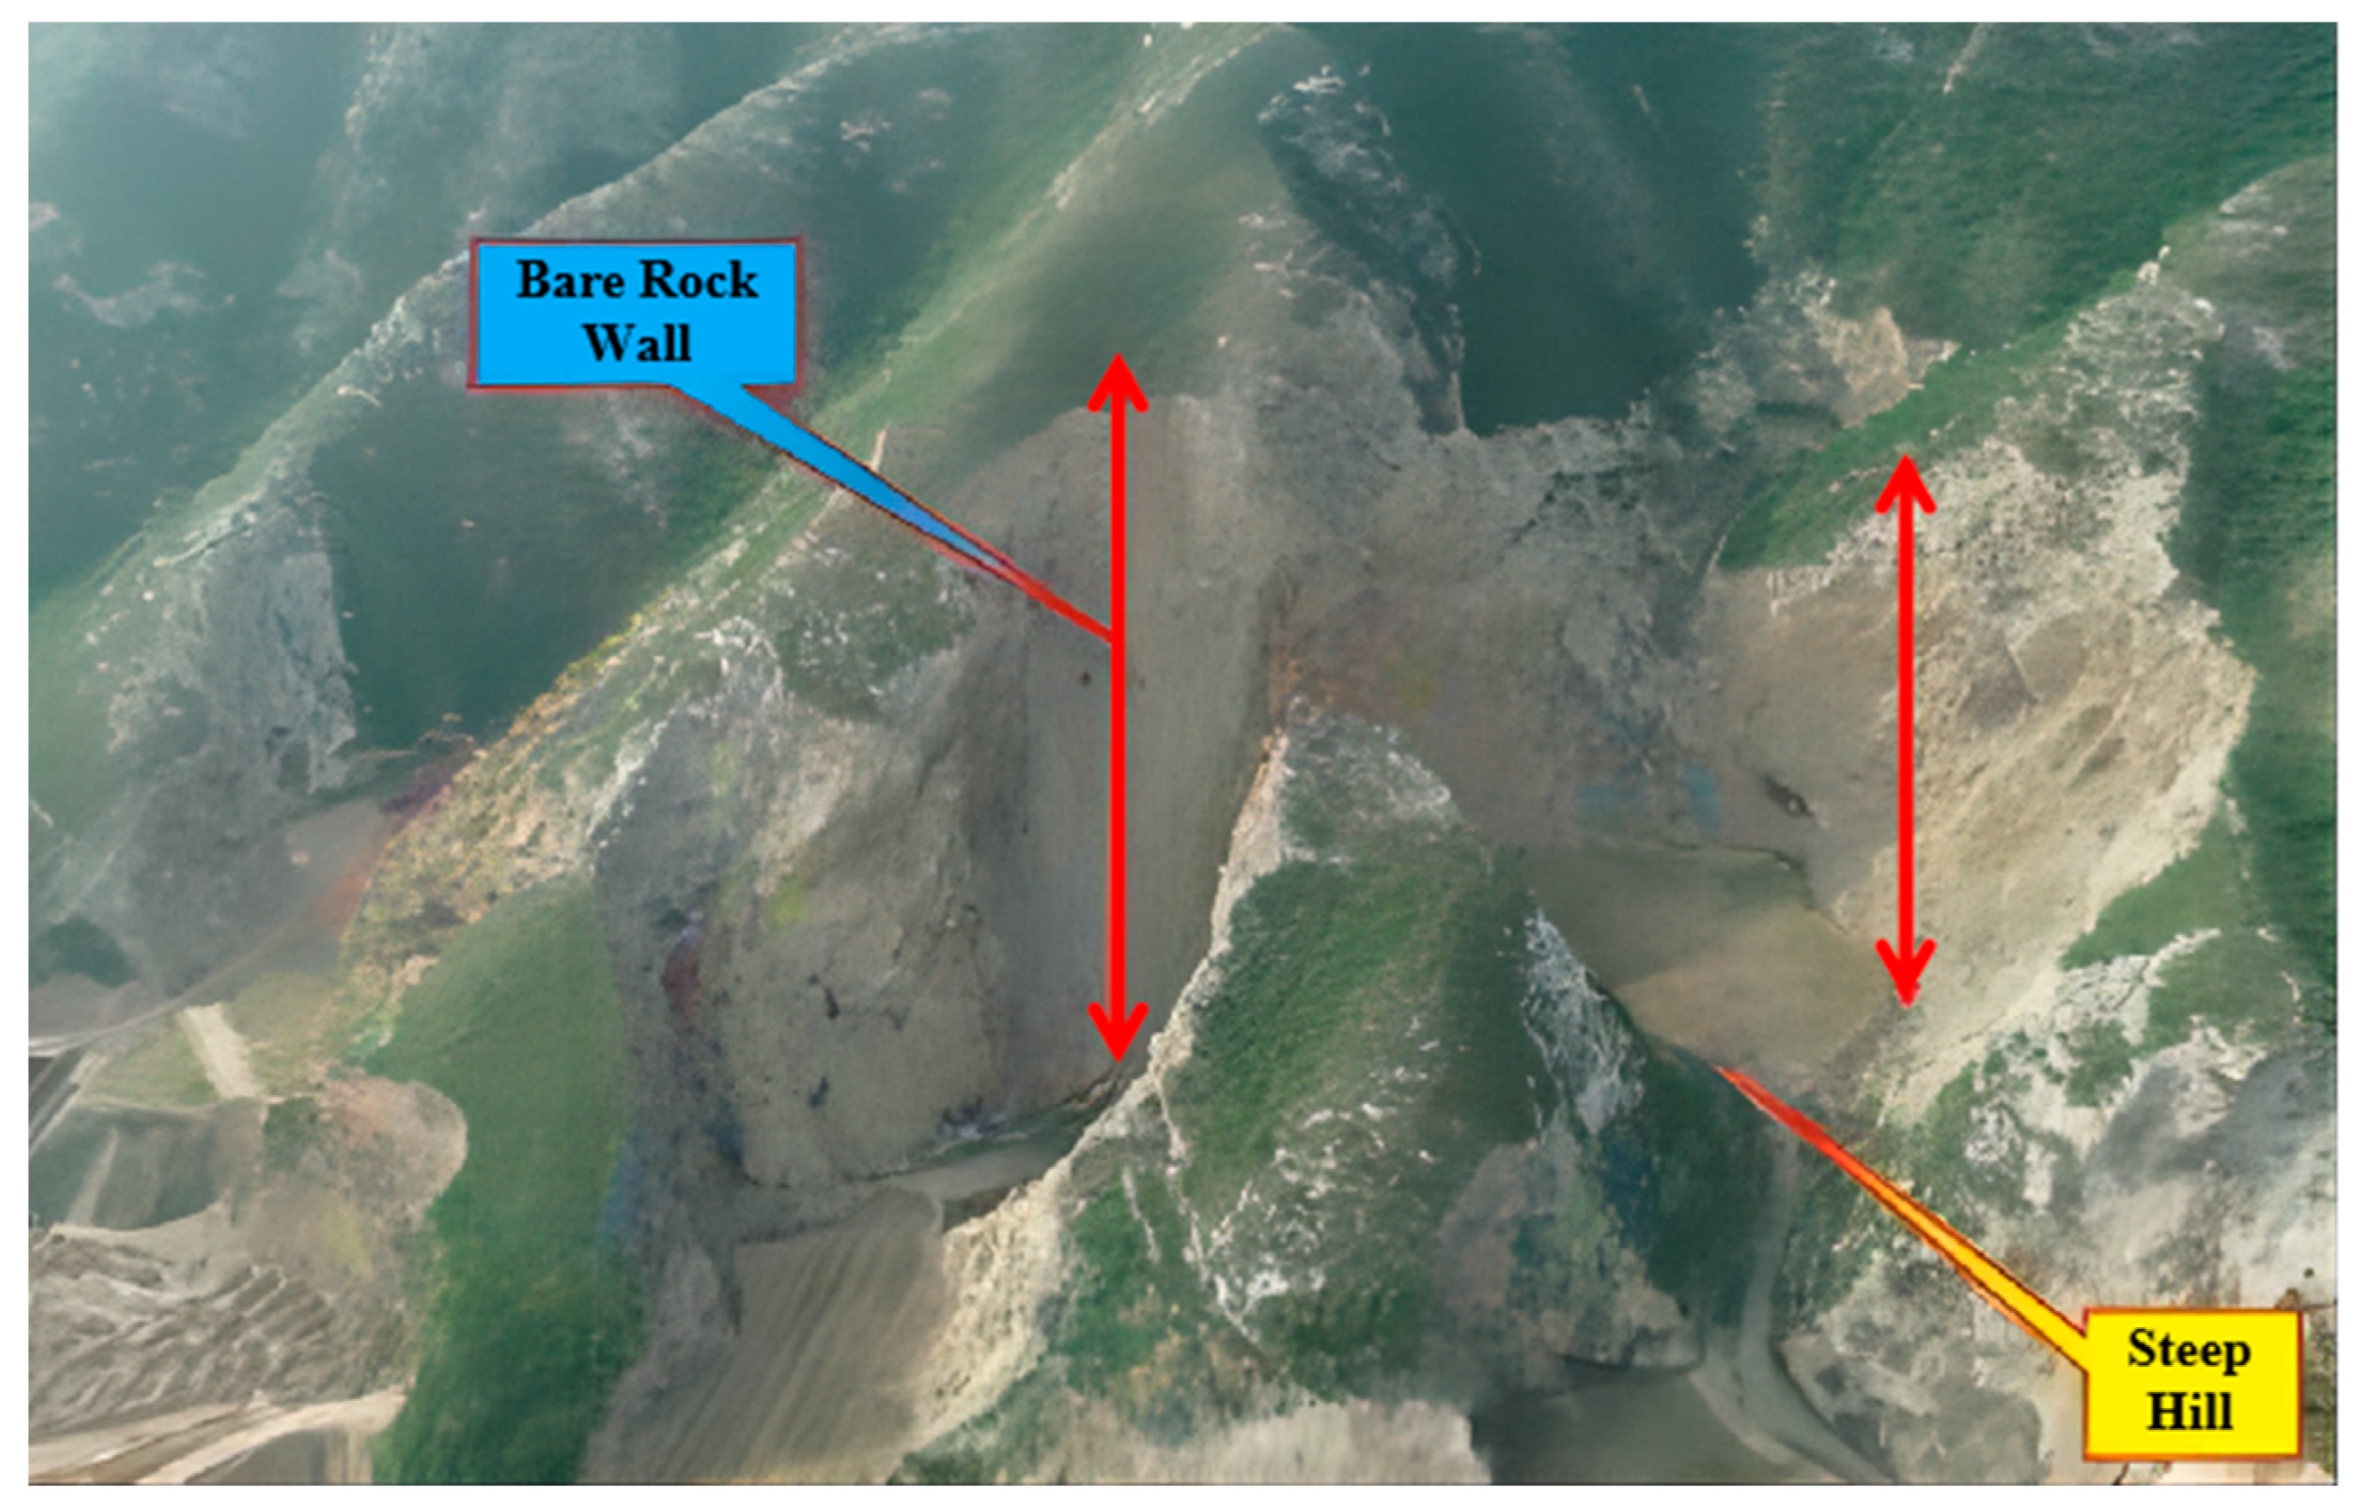
- Zhubei Quarry #1 is categorized as Level III and requires intensified ecological restoration and safety management efforts. Zhubei Quarry #1 has a large area of exposed rock walls, with a significant presence of residual hills, posing challenges for ecological restoration, as illustrated in Figure 14. It is situated in a high-risk geological disaster area with severe vegetation damage. Mining activities have profoundly impacted its topography and landscape, resulting in significant soil erosion. It needs to undergo slope-cutting construction, and vegetation needs to be planted for slope surface recovery.
6. Conclusions
- (1)
- By integrating the resilience theory, this paper analyzed the safety and ecological restoration suitability of abandoned open-pit mine slopes. A comprehensive evaluation model was proposed to evaluate the safety and suitability for ecological restoration of abandoned open-pit mine slopes.
- (2)
- By integrating the IAHP, EWM, and the enhanced IRMO-SA algorithm, a combined weighting method was established. The results indicate that the proposed method can improve the objectivity and rationality of the evaluation and increase the calculation stability compared to traditional evaluation approaches.
- (3)
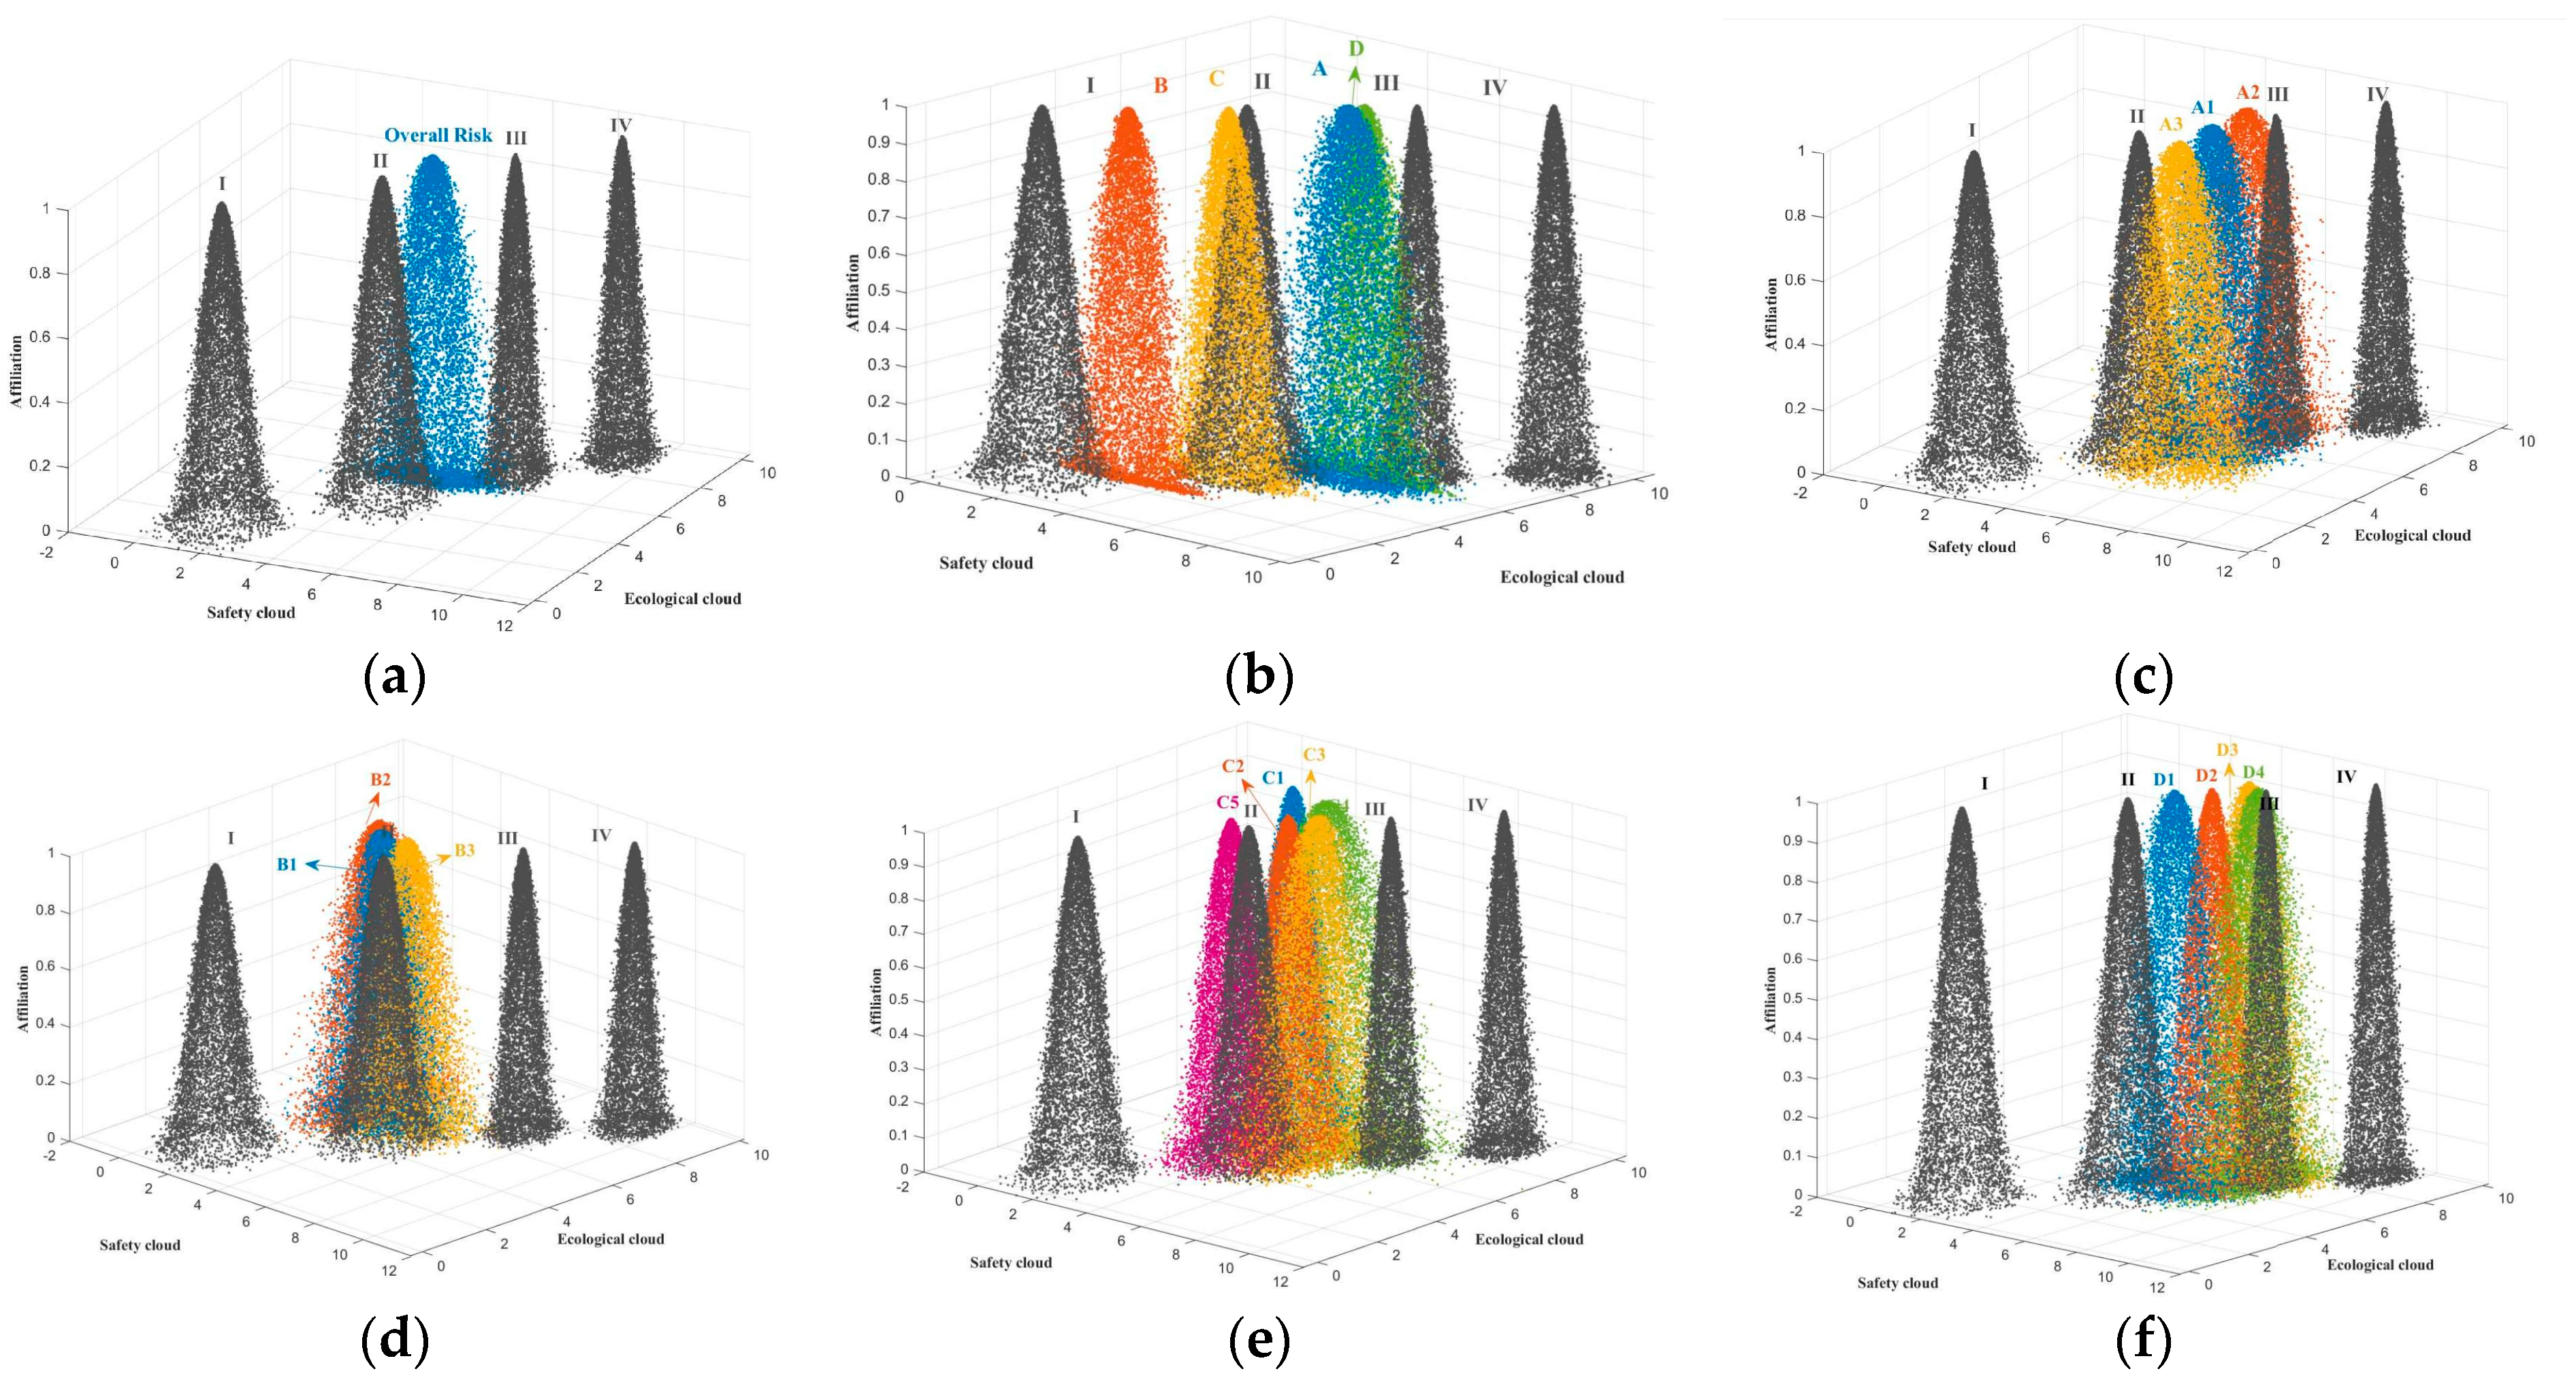
- The resilience of mine slopes was categorized into risk and ecological dimensions, and the TDCM was introduced. The cloud model was utilized to quantify fuzziness and uncertainty, obtain the resilience level of the mine slopes, and visualize the evaluation results.
- (4)
- The developed resilience assessment model was applied to evaluate steep slopes in three areas: the Yanhua Quarry, Torch Quarry, and Zhubei Quarry #1. The results are consistent with the actual engineering situations, demonstrating the model’s applicability and feasibility.
- (5)
- This paper proposed a novel method for assessing slope resilience in abandoned open-pit mines. This method offers theoretical support for the safety management and ecological restoration of mine slopes. It assists construction personnel in taking targeted actions based on evaluation results to ensure the structural safety of abandoned mine slopes and protect their ecological environment. It also provides valuable guidance for reinforcement and ecological management projects on such slopes.
Author Contributions
Funding
Data Availability Statement
Conflicts of Interest
Appendix A

| U | A | B | C | D |
|---|---|---|---|---|
| A | [1, 1] | [3, 4] | [1/4, 1/3] | [4, 5] |
| B | [1/4, 1/3] | [1, 1] | [1/5, 1/4] | [3, 4] |
| C | [3, 4] | [4, 5] | [1, 1] | [5, 6] |
| D | [1/5, 1/4] | [1/4, 1/3] | [1/6, 1/5] | [1, 1] |
| A | A1 | A2 | A3 |
|---|---|---|---|
| A1 | [1, 1] | [1/3, 1/2] | [1/3, 1/2] |
| A2 | [2, 3] | [1, 1] | [1, 2] |
| A3 | [2, 3] | [1/3, 1/2] | [1, 1] |
| B | B1 | B2 | B3 |
|---|---|---|---|
| B1 | [1, 1] | [3, 4] | [1/4, 1/3] |
| B2 | [1/4, 1/3] | [1, 1] | [1/6, 1/5] |
| B3 | [3, 4] | [5, 6] | [1, 1] |
| C | C1 | C2 | C3 | C4 | C5 |
|---|---|---|---|---|---|
| C1 | [1, 1] | [1/6, 1/5] | [1/5, 1/4] | [1, 1] | [1/2, 1] |
| C2 | [5, 6] | [1, 1] | [3, 4] | [4, 5] | [4, 5] |
| C3 | [4, 5] | [1/4, 1/3] | [1, 1] | [3, 4] | [3, 4] |
| C4 | [1, 1] | [1/5, 1/4] | [1/4, 1/3] | [1, 1] | [1, 1] |
| C5 | [1, 2] | [1/5, 1/4] | [1/4, 1/3] | [1, 1] | [1, 1] |
| D | D1 | D2 | D3 | D4 |
|---|---|---|---|---|
| D1 | [1, 1] | [1, 2] | [1/5, 1/4] | [1/4, 1/3] |
| D2 | [1/2, 1] | [1, 1] | [1/6, 1/5] | [1/5, 1/4] |
| D3 | [4, 5] | [5, 6] | [1, 1] | [2, 3] |
| D4 | [3, 4] | [4, 5] | [1/3, 1/2] | [1, 1] |
| U | A | B | C | D |
|---|---|---|---|---|
| A | [1, 1] | [5, 6] | [3, 4] | [4, 5] |
| B | [1/6, 1/5] | [1, 1] | [1/5, 1/4] | [1/4, 1/3] |
| C | [1/4, 1/3] | [4, 5] | [1, 1] | [3, 4] |
| D | [1/5, 1/4] | [3, 4] | [1/4, 1/3] | [1, 1] |
| A | A1 | A2 | A3 |
|---|---|---|---|
| A1 | [1, 1] | [1/3, 1/2] | [3, 4] |
| A2 | [2, 3] | [1, 1] | [4, 5] |
| A3 | [1/4, 1/3] | [1/5, 1/4] | [1, 1] |
| B | B1 | B2 | B3 |
|---|---|---|---|
| B1 | [1, 1] | [1/2, 1] | [2, 3] |
| B2 | [1, 2] | [1, 1] | [2, 3] |
| B3 | [1/3, 1/2] | [1/3, 1/2] | [1, 1] |
| C | C1 | C2 | C3 | C4 | C5 |
|---|---|---|---|---|---|
| C1 | [1, 1] | [1/3, 1/2] | [2, 3] | [1/3, 1/2] | [4, 5] |
| C2 | [2, 3] | [1, 1] | [3, 4] | [1/2, 1] | [4, 5] |
| C3 | [1/3, 1/2] | [1/4, 1/3] | [1, 1] | [1/4, 1/3] | [3, 4] |
| C4 | [2, 3] | [1, 2] | [3, 4] | [1, 1] | [4, 5] |
| C5 | [1/5, 1/4] | [1/5, 1/4] | [1/4, 1/3] | [1/5, 1/4] | [1, 1] |
| D | D1 | D2 | D3 | D4 |
|---|---|---|---|---|
| D1 | [1, 1] | [1, 2] | [1/3, 1/2] | [1/4, 1/3] |
| D2 | [1/2, 1] | [1, 1] | [1/6, 1/5] | [1/5, 1/4] |
| D3 | [2, 3] | [5, 6] | [1, 1] | [1/3, 1/2] |
| D4 | [3, 4] | [4, 5] | [2, 3] | [1, 1] |
References
- Whittall, J.R.; McDougall, S.; Eberhardt, E. A risk-based methodology for establishing landslide exclusion zones in operating open pit mines. Int. J. Rock Mech. Min. Sci. 2017, 100, 100–107. [Google Scholar] [CrossRef]
- Zhang, J.X.; Li, B.; Liu, Y.W.; Li, P.; Fu, J.W.; Chen, L.; Ding, P.C. Dynamic multifield coupling model of gas drainage and a new remedy method for borehole leakage. Acta Geotech. 2022, 17, 4699–4715. [Google Scholar] [CrossRef]
- Li, B.; Zhang, J.X.; Liu, Y.W.; Qu, L.A.; Liu, Q.; Sun, Y.X.; Xu, G. Interfacial porosity model and modification mechanism of broken coal grouting: A theoretical and experimental study. Surf. Interfaces 2022, 33, 11. [Google Scholar] [CrossRef]
- Hamza, O.; De Vargas, T.; Boff, F.E.; Hussain, Y.; Sian Davies-Vollum, K. Geohazard Assessment of Landslides in South Brazil: Case Study. Geotech. Geol. Eng. 2019, 38, 971–984. [Google Scholar] [CrossRef]
- Igwe, O.; Ayogu, C.N.; Maduka, R.I.; Ayogu, N.O.; Ugwoke, T.A.S. Slope failures and safety index assessment of waste rock dumps in Nigeria’s major mines. Nat. Hazards 2023, 115, 1331–1370. [Google Scholar] [CrossRef]
- Du, S.G.; Saroglou, C.; Chen, Y.F.; Lin, H.; Yong, R. A new approach for evaluation of slope stability in large open-pit mines: A case study at the Dexing Copper Mine, China. Environ. Earth Sci. 2022, 81, 21. [Google Scholar] [CrossRef]
- Xu, Q.W.; Xu, K.L. Mine safety assessment using gray relational analysis and bow tie model. PLoS ONE 2018, 13, 14. [Google Scholar] [CrossRef]
- Wang, Z.L.; Hu, M.X.; Zhang, P.; Li, X.M.; Yin, S. Dynamic Risk Assessment of High Slope in Open-Pit Coalmines Based on Interval Trapezoidal Fuzzy Soft Set Method: A Case Study. Processes 2022, 10, 2168. [Google Scholar] [CrossRef]
- Su, H.Z.; Yang, M.; Wen, Z.P. An approach using multi-factor combination to evaluate high rocky slope safety. Nat. Hazards Earth Syst. Sci. 2016, 16, 1449–1463. [Google Scholar] [CrossRef]
- Panchal, S.; Shrivastava, A.K. Landslide hazard assessment using analytic hierarchy process (AHP): A case study of National Highway 5 in India. Ain Shams Eng. J. 2022, 13, 101626. [Google Scholar] [CrossRef]
- Chen, H.K.; Guo, Q.B.; Wang, L.; Meng, X.R. Evaluation of Slope Stability within the Influence of Mining Based on Combined Weighting and Finite Cloud Model. Energy Explor. Exploit. 2023, 41, 636–655. [Google Scholar] [CrossRef]
- Li, Z.; Sun, L.; Liu, L.; Guan, C. Research on safety evaluation method of high-fill slope considering heterogeneity and anisotropy. Bull. Eng. Geol. Environ. 2022, 81, 275. [Google Scholar] [CrossRef]
- Zhang, Q.; Gao, Q.S.; Geng, J.H. New approach to multiple attribute decision making with interval numbers. J. Syst. Eng. Electron. 2008, 19, 304–310. [Google Scholar]
- Qin, F.Y.; Liu, T.X.; Yang, F.L.; Ge, Q.Y. Stability of side slopes in mining area and the evaluation of eco-environment health. J. Environ. Prot. Ecol. 2022, 23, 1407–1416. [Google Scholar]
- Jiao, L.D.; Wang, L.; Lu, H.; Fan, Y.W.; Zhang, Y.; Wu, Y. An assessment model for urban resilience based on the pressure-state-response framework and BP-GA neural network. Urban Climb 2023, 49, 20. [Google Scholar] [CrossRef]
- Wang, Y.; Hulse, D.; Von Meding, J.; Brown, M.; Dedenbach, L. Conceiving resilience: Lexical shifts and proximal meanings in the human-centered natural and built environment literature from 1990 to 2018. Dev. Built Environ. 2020, 1, 19. [Google Scholar] [CrossRef]
- Li, Y.; Du, Q.; Zhang, J.S.; Jiang, Y.; Zhou, J.J.; Ye, Z.N. Visualizing the intellectual landscape and evolution of transportation system resilience: A bibliometric analysis in CiteSpace. Dev. Built Environ. 2023, 14, 12. [Google Scholar] [CrossRef]
- Holling, C.S. Resilience and stability of ecological systems. Annu. Rev. Ecol. Syst. 1973, 4, 1–23. [Google Scholar] [CrossRef]
- Shen, L.; Xue, Z.J.; Tang, L.Y.; Ge, H.Y. Research on Resilience Evaluation and Enhancement of Deep Foundation Pit Construction Safety System. Buildings 2022, 12, 1922. [Google Scholar] [CrossRef]
- Roostaie, S.; Nawari, N. The DEMATEL approach for integrating resilience indicators into building sustainability assessment frameworks. Build. Environ. 2022, 207, 108113. [Google Scholar] [CrossRef]
- Mottahedi, A.; Sereshki, F.; Ataei, M.; Qarahasanlou, A.N.; Barabadi, A. Resilience estimation of critical infrastructure systems: Application of expert judgment. Reliab. Eng. Syst. Saf. 2021, 215, 16. [Google Scholar] [CrossRef]
- Pei, J.J.; Liu, W.; Han, L. Research on Evaluation Index System of Chinese City Safety Resilience Based on Delphi Method and Cloud Model. Int. J. Environ. Res. Public Health 2019, 16, 3802. [Google Scholar] [CrossRef]
- Zhang, J. Study on Seismic Resilience Evaluation of Urban System Based on Two-Dimensional Cloud Model. Master’s Thesis, Lanzhou Jiaotong University, Lanzhou, China, 2023. [Google Scholar]
- Liu, Y.; Xiang, C. A Comprehensive Framework for Evaluating Bridge Resilience: Safety, Social, Environmental, and Economic Perspectives. Sustainability 2024, 16, 1135. [Google Scholar] [CrossRef]
- Li, D.Y.; Liu, C.; Liu, L. Study on the Universality of the Normal Cloud Model. Eng. Sci. 2005, 3, 18–24. [Google Scholar] [CrossRef]
- Bai, M.H.; Liu, Q. Evaluating Urban Fire Risk Based on Entropy-Cloud Model Method Considering Urban Safety Resilience. Fire 2023, 6, 62. [Google Scholar] [CrossRef]
- Liu, H.C.; Wang, L.E.; Li, Z.W.; Hu, Y.P. Improving Risk Evaluation in FMEA With Cloud Model and Hierarchical TOPSIS Method. IEEE Trans. Fuzzy Syst. 2019, 27, 84–95. [Google Scholar] [CrossRef]
- Sang, L.S.; Wang, J.C.; Sui, J.Y.; Dziedzic, M. A New Approach for Dam Safety Assessment Using the Extended Cloud Model. Water Resour. Manag. 2022, 36, 5785–5798. [Google Scholar] [CrossRef]
- Wu, J.; Zhou, Z.F. Risk assessment of seepage failure in deep excavations based on fuzzy analytic hierarchy process and cloud model. Acta Geotech. 2023, 18, 5635–5658. [Google Scholar] [CrossRef]
- Zhang, C.; Tian, G.D.; Fathollahi-Fard, A.M.; Wang, W.J.; Wu, P.; Li, Z.W. Interval-Valued Intuitionistic Uncertain Linguistic Cloud Petri Net and Its Application to Risk Assessment for Subway Fire Accident. IEEE Trans. Autom. Sci. Eng. 2022, 19, 163–177. [Google Scholar] [CrossRef]
- Huang, Z.; Zhang, W.; Sun, H.Y.; Pan, Q.J.; Zhang, J.B.; Li, Y.F. Risk uncertainty analysis in shield tunnel projects. Tunn. Undergr. Space Technol. 2023, 132, 25. [Google Scholar] [CrossRef]
- Meng, G.W.; Ye, Y.C.; Wu, B.; Luo, G.J.; Zhang, X.; Zhou, Z.Q.; Sun, W.T. Risk Assessment of Shield Tunnel Construction in Karst Strata Based on Fuzzy Analytic Hierarchy Process and Cloud Model. Shock Vib. 2021, 2021, 16. [Google Scholar] [CrossRef]
- Guangyue, W.; Jiong, L.; Feifan, Y.; Guorui, S. Fuzzy comprehensive assessment stability of vegetated slope with 3D geomat protection using cloud model. Open Civ. Eng. J. 2017, 11, 70–81. [Google Scholar] [CrossRef]
- Qiu, D.; Liu, Y.; Xue, Y.; Su, M.; Zhao, Y.; Cui, J.; Li, Z. Prediction of the surrounding rock deformation grade for a high-speed railway tunnel based on rough set theory and a cloud model. Iran. J. Sci. Technol. Trans. Civ. Eng. 2021, 45, 303–314. [Google Scholar] [CrossRef]
- Gao, Y.H.; Han, B.; Miao, J.J.; Jin, S.; Liu, H.W. Research on Suitability Evaluation of Urban Engineering Construction Based on Entropy Weight Hierarchy-Cloud Model: A Case Study in Xiongan New Area, China. Appl. Sci. 2023, 13, 10655. [Google Scholar] [CrossRef]
- Huang, J.L.; Zeng, X.Y.; Fu, J.; Han, Y.; Chen, H.H. Safety Risk Assessment Using a BP Neural Network of High Cutting Slope Construction in High-Speed Railway. Buildings 2022, 12, 598. [Google Scholar] [CrossRef]
- Xu, W.X.; Wang, J.M.; Zhang, M.; Li, S.J. Construction of landscape ecological network based on landscape ecological risk assessment in a large-scale opencast coal mine area. J. Clean. Prod. 2021, 286, 11. [Google Scholar] [CrossRef]
- Tu, M.; Ke, B.; Lu, S.; Zhou, H.; Zhang, D.; Pan, R. Study on Division and Ecological Restoration Suitability of Rock Slope inTongshankou Copper Mine. Min. Res. Dev. 2021, 41, 5. [Google Scholar] [CrossRef]
- Feng, S.; Deng, W.; Sun, S. Analysis of Waste Dump Slope Resilience Evaluation Method Based on Fuzzy Analytic Hierarchy Process. J. Beijing Polytech. Coll. 2022, 21, 6. [Google Scholar]
- Xu, X.; Wang, X.; Ye, L.; Zhao, M.; Lei, G. Study on Slope Stability of the Open-pit Mine Based on GA-AHP and Cloud Matter-element Model. Met. Mine 2021, 10, 168–172. [Google Scholar] [CrossRef]
- Du, Y.; Bai, Y.; Zhang, X.; Xie, M.; Ma, G. Risk Assessment of Coal Gangue Slope Considering Multiple Risk Factors. Eng. Mech. 2022, 39, 8. [Google Scholar] [CrossRef]
- Xia, P.; Hu, X.L.; Wu, S.S.; Ying, C.Y.; Liu, C. Slope Stability Analysis Based on Group Decision Theory and Fuzzy Comprehensive Evaluation. J. Earth Sci. 2020, 31, 1121–1132. [Google Scholar] [CrossRef]
- Association, C.C.C. Code for Investigation of Geotechnicalengineering in the Coal Mine Goaf; China Planning Press: Beijing, China, 2014. [Google Scholar]
- Ministry of Commerce, People’s Republic of China. Technical Code for Building Slope Engineering; China Architecture & Building Press: Beijing, China, 2014. [Google Scholar]
- Zedek, L.; Šembera, J.; Kurka, J. Inclusion of Nature-Based Solution in the Evaluation of Slope Stability in Large Areas. Land 2024, 13, 372. [Google Scholar] [CrossRef]
- Li, Z.; Xu, T.; Liu, Y.; Zhao, L.; Xu, Y.; Yang, T.; Zheng, X. Open-pit mine slopes stability analysis based on analytic hierarchy process-fuzzy comprehensive evaluation model. Chin. J. Geol. Hazard Control 2024, 35, 116–123. [Google Scholar] [CrossRef]
- Li, J.L.; Deng, C.C.C.; Xu, J.Y.; Ma, Z.J.; Shuai, P.; Zhang, L.B. Safety Risk Assessment and Management of Panzhihua Open Pit (OP)-Underground (UG) Iron Mine Based on AHP-FCE, Sichuan Province, China. Sustainability 2023, 15, 4497. [Google Scholar] [CrossRef]
- Guo, J.; Wang, J.; Liu, S. Application of an Improved Cloud Model and Distance Discrimination to Evaluate Slope Stability. Math. Probl. Eng. 2019, 2019, 8315894. [Google Scholar] [CrossRef]
- Wei, G.; Liu, J.; Zhao, T.; Yang, J.; Li, R.; Kui, G.; Ai, X.; Xiao, F. Evaluate the Reclamation Suitability of Dumps of Open-pit Coal Mines based on Niche Fitness in the Eastern Arid Desert Area in Northwest China. J. Resour. Ecol. 2023, 14, 805–815. [Google Scholar] [CrossRef]
- Li, Y.H. Suitability evaluation of land reclamation as arable land in coal mining area based on catastrophe theory. SN Appl. Sci. 2023, 5, 146. [Google Scholar] [CrossRef]
- Jiang, J.; Sun, J.; Wang, D.; Wang, L.; Cao, L.; Cai, M. An evaluation method of open-pit slope stability based on Poset theory. Geomech. Geophys. Geo-Energy Geo-Resour. 2024, 10, 11. [Google Scholar] [CrossRef]
- XU, R.; Zhang, W.; Sui, G.; Wang, G.; Li, X.; Yang, W. Mine geological environment evaluation based on IFS-TOPSIS. J. Saf. Environ. 2023, 23, 230–239. [Google Scholar] [CrossRef]
- China, Ministry of Transport of the People’s Republic of China. Guidelines for Safety Risk Assessment of Highway Graben High Slope Construction Works; China Communications Press: Beijing, China, 2015. [Google Scholar]
- Xie, Z. Lutian Kuangshan Bianpo he Paituchangzaihai Yujing Ji Kongzhi Jishu; Metallurgical Industry Press: Beijing, China, 2015. [Google Scholar]
- McQuillan, A.; Canbulat, I.; Payne, D.; Oh, J. New risk assessment methodology for coal mine excavated slopes. Int. J. Min. Sci. Technol. 2018, 28, 583–592. [Google Scholar] [CrossRef]
- Jin, L.X.; Qin, T.; Liu, P.T. Upper Bound Solution Analysis of the Ultimate Bearing Capacity of Two-Layered Strip Foundation Based on Improved Radial Movement Optimization. Appl. Sci. 2023, 13, 7299. [Google Scholar] [CrossRef]
- He, F.; Ye, Q. A Bearing Fault Diagnosis Method Based on Wavelet Packet Transform and Convolutional Neural Network Optimized by Simulated Annealing Algorithm. Sensors 2022, 22, 1410. [Google Scholar] [CrossRef]
- Zhou, J.; Lin, H.F.; Li, S.G.; Jin, H.W.; Zhao, B.; Liu, S.H. Leakage diagnosis and localization of the gas extraction pipeline based on SA-PSO BP neural network. Reliab. Eng. Syst. Saf. 2023, 232, 11. [Google Scholar] [CrossRef]
- Wang, S.X.; Ge, L.J.; Cai, S.X.; Wu, L. Hybrid interval AHP-entropy method for electricity user evaluation in smart electricity utilization. J. Mod. Power Syst. Clean Energy 2018, 6, 701–711. [Google Scholar] [CrossRef]
- Ma, Z.Z.; Zhang, S.T. Risk-Based Multi-Attribute Decision-Making for Normal Cloud Model Considering Pre-Evaluation Information. IEEE Access 2020, 8, 153891–153904. [Google Scholar] [CrossRef]
- Guo, M.; Zhao, J.W.; Pan, D.; Sun, M.X.; Zhou, Y.Q.; Yan, B.N. Normal cloud model theory-based comprehensive fuzzy assessment of wooden pagoda safety. J. Cult. Herit. 2022, 55, 1–10. [Google Scholar] [CrossRef]
- Lyu, H.M.; Shen, S.L.; Zhou, A.N.; Zhou, W.H. Data in flood risk assessment of metro systems in a subsiding environment using the interval FAHP-FCA approach. Data Brief 2019, 26, 7. [Google Scholar] [CrossRef]
- Wang, X.T.; Li, S.C.; Xu, Z.H.; Lin, P.; Hu, J.; Wang, W.Y. Analysis of Factors Influencing Floor Water Inrush in Coal Mines: A Nonlinear Fuzzy Interval Assessment Method. Mine Water Environ. 2019, 38, 81–92. [Google Scholar] [CrossRef]
- Wang, Y. Analysis of the Factors Influencing the Career Development of University Librarians Based on Interval AnalyticHierarchy Process(1-AHP)-Taking Seven Universities in Kunming as Examples. Master’s Thesis, Yunnan University, Kunming, China, 2023. [Google Scholar]
- Xu, G.; Xie, X. Identifying and Improving Method for Consistency of Interval Reciprocal Judgment Matrices. J. Guilin Univ. Technol. 2013, 33, 6. [Google Scholar] [CrossRef]
- Ali, S.I.; Lalji, S.M.; Hashmi, S.; Awan, Z.; Iqbal, A.; Al-Ammar, E.A.; Gull, A. Risk quantification and ranking of oil fields and wells facing asphaltene deposition problem using fuzzy TOPSIS coupled with AHP. Ain Shams Eng. J. 2024, 15, 102289. [Google Scholar] [CrossRef]


| Target Layer | Criterion Layer (Primary Indicators) | Index Layer (Secondary Indicators) | References | |||
|---|---|---|---|---|---|---|
| U | The comprehensive evaluation of resilience | A | Geological structural features | A1 | Rock weathering degree | [42,43,47] |
| A2 | Mine damage area | [52] | ||||
| A3 | Degree of development of slope joints and fissures | [51] | ||||
| B | Slope geometric characteristics | B1 | Slope angle | [36,37,38,39,40,41,42,43,44,45,46,48,49,50,51] | ||
| B2 | Slope length | [36,42,43,44,45,51,52] | ||||
| B3 | Slope height | [36,38,39,40,41,42,43,44,45,46,48,51,52] | ||||
| C | Slope rock mass features | C1 | Slope rock hardness | [38,42,43,44,46,48,51] | ||
| C2 | The basic quality grade of the rock mass | [42,43,44,46,48,51] | ||||
| C3 | Self-stabilizing capacity of vertical slopes | [43,44,45,46,47,51] | ||||
| C4 | Classification of slope rock integrity | [38,40,42,43,44,46,48] | ||||
| C5 | Geotechnical cohesion | [39,40,41,43,44,45,48,51] | ||||
| D | External factors | D1 | Average annual precipitation | [36,38,40,41,42,46,47,48,51] | ||
| D2 | Earthquake intensity | [40,43,48] | ||||
| D3 | Degree of geological hazard risk | [36,42,47,49,52] | ||||
| D4 | Degree of ecological environment vulnerability | [49,52] | ||||
| Evaluation Indicators | Type | Criteria for the Quantification of Indicators | |||
|---|---|---|---|---|---|
| 1 | 2 | 3 | 4 | ||
| A1 | QL | Slightly weathered | Moderately weathered | Strongly–moderately weathered | Strongly weathered |
| A2/hm2 | QN | [0, 3) | [3, 10) | [10, 15) | [15, +∞) |
| A3 | QL | Slightly developed | Moderately developed | Strongly–moderately developed | Strongly developed |
| B1/(°) | QN | [0, 15) | [15, 30) | [30, 42) | [42, 90] |
| B2/m | QN | [0, 100) | [100, 200) | [200, 300) | [300, +∞) |
| B3/m | QN | [0, 100) | [100, 200) | [200, 500) | [500, +∞) |
| C1 | QL | Hard rock | Relatively hard rock | Relatively soft rock | Soft rock |
| C2 | QL | Level I | Level II | Level III | Level IV |
| C3 | QL | Stable | Relatively stable | Relatively unstable | Unstable |
| C4 | QL | Complete | Relatively complete | Relatively crushed | Crushed |
| C5/kPa | QN | [40, 80] | [16, 40) | [8, 16) | [0, 8) |
| D1/mm | QN | [0, 500) | [500, 1000) | [1000, 1500) | [1500, +∞) |
| D2 | QN | [1, 4) | [4, 7) | [7, 10) | [10, 12] |
| D3 | QL | Low | Relatively low | Relatively high | High |
| D4 | QL | Low | Relatively low | Relatively high | High |
| Levels | Risk Description | Ecological Restoration Suitability Description | Resilience Description |
|---|---|---|---|
| I | Low risk | High suitability | High resilience |
| II | Relatively low risk | Relatively high suitability | Relatively high resilience |
| III | Relatively high risk | Relatively low suitability | Relatively low resilience |
| IV | High risk | Low suitability | Low resilience |
| Level | Resilience Description | Evaluation Interval | Standard Cloud Numerical Characteristics |
|---|---|---|---|
| I | High resilience | [0, 3) | (1.5, 0.5, 0.1) |
| II | Relatively high resilience | [3, 6) | (4.5, 0.5, 0.1) |
| III | Relatively low resilience | [6, 8) | (7, 0.33, 0.1) |
| IV | Low resilience | [8, 10) | (9, 0.33, 0.1) |
| IAHP-IRMO-SA | IEM | Reference [62] | |
|---|---|---|---|
| 1 | 0.5212 | [0.5026, 0.5575] | [0.5041, 0.5565] |
| 2 | 0.1631 | [0.1502, 0.1724] | [0.1301, 0.1623] |
| 3 | 0.3157 | [0.2730, 0.3406] | [0.2956, 0.3403] |
| IAHP-IRMO-SA | IEM | Reference [63] | |
|---|---|---|---|
| 1 | 0.5427 | [0.4371, 0.6539] | [0.429, 0.618] |
| 2 | 0.1384 | [0.1160, 0.1256] | [0.117, 0.120] |
| 3 | 0.2036 | [0.2194, 0.2485] | [0.200, 0.266] |
| 4 | 0.1152 | [0.0853, 0.0934] | [0.109, 0.142] |
| IAHP-IRMO-SA | IEM | Reference [64] | |
|---|---|---|---|
| 1 | 0.2621 | [0.2070, 0.3057] | [0.206, 0.302] |
| 2 | 0.1878 | [0.1587, 0.2195] | [0.159, 0.222] |
| 3 | 0.3184 | [0.2635, 0.3607] | [0.263, 0.358] |
| 4 | 0.1091 | [0.0929, 0.1261] | [0.093, 0.127] |
| 5 | 0.1225 | [0.1073, 0.1554] | [0.108, 0.158] |
| Algorithm | Maximum | Minimum | Average | Standard Deviation |
|---|---|---|---|---|
| RMO | 16.4918 | 16.4854 | 16.4878 | 0.0018 |
| IRMO | 16.4871 | 16.4853 | 16.4860 | 0.00052 |
| IRMO-SA | 16.4865 | 16.4854 | 16.4857 | 0.00028 |
| Quarry Name | Yanhua Quarry | Torch Quarry | Zhubei Quarry #1 |
|---|---|---|---|
| Elevation Range | 573–651 m | 560–600 m | 485–614 m |
| North–South Width | 450 m | 350 m | 560 m |
| East–West Length | 260 m | 230 m | 410 m |
| Exposed Rock Wall Area | 47,000 m2 | 18,300 m2 | 74,000 m2 |
| Broken Area | 34,416 m2 | 29,730 m2 | 87,628 m2 |
| Degree of Joint and Fissure Development | Upper: Well Developed Lower: Developed; | Upper: Well developed Lower: Developed | Extremely developed |
| Rock Integrity | Upper: Broken Lower: Better | Upper: Broken Lower: Better | Broken |
| Rock Quality Grade | Class III | Class III | Class III |
| Slope Rock Body Type | Classes III and IV | Classes III and IV | Classes III and IV |
| Geological Disaster Situation | Three collapses; moderately disaster-prone area | Three small collapses and one small landslide; not a disaster-prone area | Eleven small collapses and two potential debris flows; highly disaster-prone area |
| Quantity of Cutting Stone | 1,963,443 m3 | 260,759 m3 | 2,268,209 m3 |
| Total Investment in Ecological Restoration | CNY 55,859,200,000 | CNY 20,977,900,000 | CNY 70,640,700,000 |
| Quarry Name | Vegetation | Topography and Landscape | Aquifer | Water and Soil Environmental Pollution | Water and Soil Erosion |
|---|---|---|---|---|---|
| Yanhua Quarry | Serious | Serious | Moderately Slight | Moderately Slight | Serious |
| Torch Quarry | Moderately Serious | Serious | Moderately Slight | Moderately Slight | Serious |
| Zhubei Quarry #1 | Serious | Serious | Moderately Slight | Moderately Slight | Serious |
| Indicators | Zhubei Quarry #1 | Torch Quarry | Yanhua Quarry | Objective Weights |
|---|---|---|---|---|
| A1 | 3 | 2 | 3 | 0.051 |
| A2 | 8.7628 | 2.9730 | 3.4416 | 0.389 |
| A3 | 4 | 3 | 3 | 0.030 |
| B1 | 64.5 | 67.5 | 64.5 | 0.001 |
| B2 | 590 | 280 | 480 | 0.133 |
| B3 | 110 | 80 | 105 | 0.028 |
| C1 | 2 | 2 | 2 | 0.002 |
| C2 | 3 | 3 | 3 | 0.001 |
| C3 | 3 | 2 | 3 | 0.050 |
| C4 | 3 | 3 | 2 | 0.051 |
| C5 | 37 | 18.1 | 17.4 | 0.206 |
| D1 | 1100 | 1100 | 1100 | 0.001 |
| D2 | 6.5 | 6.5 | 6.5 | 0.001 |
| D3 | 4 | 3 | 3 | 0.030 |
| D4 | 4 | 3 | 4 | 0.026 |
| Quarry Name | Indicator | Risk Cloud Digital Characteristic Parameters | Ecological Cloud Digital Characteristic Parameters | ||||
|---|---|---|---|---|---|---|---|
| Ex | En | He | Ex | En | He | ||
| Yanhua Quarry | A | 3.9750 | 0.5921 | 0.2019 | 4.4425 | 0.5570 | 0.1518 |
| B | 2.8271 | 0.5570 | 0.1518 | 5.6091 | 1.0120 | 0.2758 | |
| C | 3.7386 | 0.5935 | 0.2038 | 4.2258 | 0.6015 | 0.2154 | |
| D | 5.0287 | 0.8235 | 0.5323 | 4.339 | 0.5570 | 0.1518 | |
| U | 3.7886 | 0.6026 | 0.2168 | 4.5556 | 0.6436 | 0.1914 | |
| Torch Quarry | A | 3.5247 | 0.7579 | 0.4386 | 2.9731 | 0.8037 | 0.5040 |
| B | 2.241 | 0.6433 | 0.2751 | 3.0894 | 0.7875 | 0.4808 | |
| C | 3.4656 | 0.6663 | 0.3078 | 3.6422 | 0.6015 | 0.2154 | |
| D | 5.0585 | 1.1878 | 0.4424 | 2.9556 | 0.6815 | 0.3295 | |
| U | 3.4159 | 0.7350 | 0.3663 | 3.1983 | 0.7311 | 0.4003 | |
| Zhubei Quarry #1 | A | 6.0510 | 6.6740 | 0.8781 | 0.7856 | 0.5119 | 0.4781 |
| B | 4.3795 | 5.9389 | 0.7107 | 0.7845 | 0.3134 | 0.4766 | |
| C | 4.8003 | 5.3156 | 0.6299 | 0.6485 | 0.1717 | 0.2824 | |
| D | 6.8318 | 7.1276 | 0.8235 | 0.6815 | 0.5323 | 0.3295 | |
| U | 5.3924 | 6.1617 | 0.7576 | 0.7367 | 0.3575 | 0.4083 | |
| Quarry Name | Safety Evaluation | Ecological Evaluation | ||||||
|---|---|---|---|---|---|---|---|---|
| D+ | D− | Relative Proximity | Sort Results | D+ | D− | Relative Proximity | Sort Results | |
| Yanhua Quarry | 2.027 | 0.581 | 0.223 | 2 | 1.946 | 1.597 | 0.451 | 2 |
| Torch Quarry | 2.384 | 0.165 | 0.065 | 3 | 3.171 | 0.229 | 0.067 | 3 |
| Zhubei Quarry #1 | 0.027 | 2.401 | 0.989 | 1 | 0.014 | 3.185 | 0.996 | 1 |
| Quarry Name | Indicator | I | II | III | IV | Resilience Level |
|---|---|---|---|---|---|---|
| Yanhua Quarry | A | 0.2601 | 1.8936 | 0.2524 | 0.1474 | II |
| B | 0.2316 | 0.4982 | 0.2273 | 0.1420 | II | |
| C | 0.2835 | 1.2357 | 0.2336 | 0.1408 | II | |
| D | 0.2208 | 1.8093 | 0.302 | 0.1633 | II | |
| U | 0.2619 | 1.4015 | 0.2478 | 0.1460 | II | |
| Torch Quarry | A | 0.3994 | 0.5519 | 0.1880 | 0.1228 | II |
| B | 0.5702 | 0.3755 | 0.1623 | 0.1114 | I | |
| C | 0.3440 | 0.7441 | 0.2051 | 0.1298 | II | |
| D | 0.2601 | 0.6089 | 0.2229 | 0.1386 | II | |
| U | 0.3906 | 0.5903 | 0.1914 | 0.1242 | II | |
| Zhubei Quarry #1 | A | 0.1451 | 0.3745 | 0.9965 | 0.2662 | III |
| B | 0.1890 | 0.6925 | 0.3537 | 0.1804 | II | |
| C | 0.1982 | 1.1506 | 0.3609 | 0.1790 | II | |
| D | 0.1290 | 0.2847 | 4.7365 | 0.3491 | III | |
| U | 0.1647 | 0.5302 | 0.5516 | 0.2179 | III |
Disclaimer/Publisher’s Note: The statements, opinions and data contained in all publications are solely those of the individual author(s) and contributor(s) and not of MDPI and/or the editor(s). MDPI and/or the editor(s) disclaim responsibility for any injury to people or property resulting from any ideas, methods, instructions or products referred to in the content. |
© 2024 by the authors. Licensee MDPI, Basel, Switzerland. This article is an open access article distributed under the terms and conditions of the Creative Commons Attribution (CC BY) license (https://creativecommons.org/licenses/by/4.0/).
Share and Cite
Jin, L.; Liu, P.; Yao, W.; Wei, J. A Comprehensive Evaluation of Resilience in Abandoned Open-Pit Mine Slopes Based on a Two-Dimensional Cloud Model with Combination Weighting. Mathematics 2024, 12, 1213. https://doi.org/10.3390/math12081213
Jin L, Liu P, Yao W, Wei J. A Comprehensive Evaluation of Resilience in Abandoned Open-Pit Mine Slopes Based on a Two-Dimensional Cloud Model with Combination Weighting. Mathematics. 2024; 12(8):1213. https://doi.org/10.3390/math12081213
Chicago/Turabian StyleJin, Liangxing, Pingting Liu, Wenbing Yao, and Junjie Wei. 2024. "A Comprehensive Evaluation of Resilience in Abandoned Open-Pit Mine Slopes Based on a Two-Dimensional Cloud Model with Combination Weighting" Mathematics 12, no. 8: 1213. https://doi.org/10.3390/math12081213