
A Novel Method for Boosting Knowledge Representation Learning in Entity Alignment through Triple Confidence

School of Information Science and Engineering, Hebei University of Science and Technology, Shijiazhuang 050013, China
*
Author to whom correspondence should be addressed.
Mathematics 2024, 12(8), 1214; https://doi.org/10.3390/math12081214
Submission received: 18 March 2024
/
Revised: 13 April 2024
/
Accepted: 16 April 2024
/
Published: 18 April 2024
(This article belongs to the Special Issue Artificial Intelligence and Data Science)
Abstract
:Entity alignment is an important task in knowledge fusion, which aims to link entities that have the same real-world identity in two knowledge graphs. However, in the process of constructing a knowledge graph, some noise may inevitably be introduced, which must affect the results of the entity alignment tasks. The triple confidence calculation can quantify the correctness of the triples to reduce the impact of the noise on entity alignment. Therefore, we designed a method to calculate the confidence of the triples and applied it to the knowledge representation learning phase of entity alignment. The method calculates the triple confidence based on the pairing rates of the three angles between the entities and relations. Specifically, the method uses the pairing rates of the three angles as features, which are then fed into a feedforward neural network for training to obtain the triple confidence. Moreover, we introduced the triple confidence into the knowledge representation learning methods to improve their performance in entity alignment. For the graph neural network-based method GCN, we considered entity confidence when calculating the adjacency matrix, and for the translation-based method TransE, we proposed a strategy to dynamically adjust the margin value in the loss function based on confidence. These two methods were then applied to the entity alignment, and the experimental results demonstrate that compared with the knowledge representation learning methods without integrating confidence, the confidence-based knowledge representation learning methods achieved excellent performance in the entity alignment task.
Keywords:
entity alignment; triple confidence; confidence-enhanced; knowledge representation learning; knowledge graphMSC:
68T301. Introduction
The popularity of the internet and the rise of big data have provided unprecedented opportunities for the development of artificial intelligence. The knowledge graph (KG), as an important part of the field of artificial intelligence, has gradually become a research hotspot, which enables machines to better understand and use knowledge through structured data. The applications supported by the knowledge graph are increasingly diverse and have been successfully applied to tasks such as intelligent question answering [1,2,3], personalized recommendations [4,5,6], and interpretable tools [7,8,9]. With the increase in the application of the knowledge graph, people have built large-scale non-domain knowledge graphs, such as DBpedia [10] and Freebase [11], and also built various knowledge graphs around domain application [12,13,14]. The contents of these knowledge graphs are complementary or duplicate. We can obtain more complete information through knowledge graph fusion, and the key technology required for knowledge fusion is entity alignment [15,16,17]. The goal of entity alignment is to find equivalent entities in two KGs that point to the same object. Entity alignment can find the same entity in two domain knowledge graphs, and after entity alignment, additional attribute information can be linked to obtain more complete entity information, thereby obtaining a more complete and accurate knowledge graph.
Nevertheless, since the knowledge graph is mainly built automatically using programming, it is inevitable that some deviation or even wrong information will be added in the process of knowledge graph construction. Heindorf et al. [18] found that there are errors in Wikidata, and such erroneous information is called noise, which reduces the quality of knowledge in the knowledge graph. In Table 1, we present some noisy triples from DB15K that negatively affect the accuracy and efficiency of the entity alignment task. The current knowledge representation learning methods often treat all information in knowledge graphs equally without adequately considering the impact of noisy data, which inevitably reduces the feature extraction capability of knowledge representation learning methods within entity alignment. The triple confidence calculation task can quantify the correct probability values of triples, and then emphasize the triples with a higher visual confidence when performing knowledge representation learning and entity alignment tasks, reducing the focus on low confidence. This can to some extent reduce the impact of noise and improve the effectiveness of the method.
In this paper, we added triple confidence to the commonly used knowledge representation learning methods to enhance its feature extraction capabilities. Our aim was to improve the effectiveness of entity alignment by optimizing knowledge representation learning methods. Specifically, we calculated the confidence for all triples in the knowledge graph and considered this confidence during the knowledge representation learning process. Finally, we verified the effect of triple confidence on the entity alignment task. The contributions of this paper are as follows:
- We propose a method to calculate the triple confidence by utilizing the pairing rates of the entities and relations. This method employs a finer-grained method by using the pairwise pairing rates between the head entity, the relation, and the tail entity as the feature vectors of the triple in order to learn its confidence.
- Two general strategies are designed to incorporate confidence into the knowledge representation learning methods to enhance their feature extraction capabilities. For methods such as GCN that utilize neighbor information, we propose a dynamic adjacency matrix strategy where the confidence of the triples is treated as the reliability of the neighbors, enabling the method to aggregate the adjacent nodes with a higher confidence. For TransE, which employs a Hinge Loss function, we introduce a dynamic margin strategy that dynamically adjusts the margin values, allowing the model to prioritize the triples with a higher confidence and mitigate the impact of the triples with a lower confidence.
- We apply the two proposed knowledge representation learning methods to the entity alignment tasks and prove the feasibility of using confidence in these tasks using experiments.
2. Related Work
In this section, we consider two related aspects of work: triple confidence calculation and entity alignment.
2.1. Triple Confidence Calculation
Confidence is one of the indicators of knowledge graph quality evaluation, which defines the probability of the information being accepted as correct. This indicator is used for error detection and quality evaluation of the knowledge graph [19]. In recent years, with the development of TransE [20] and other knowledge representation learning technologies, more knowledge representation learning methods have been used in confidence assessment, such as TransH [21], TransR [22], and TransD [23].
In order to more comprehensively utilize confidence measures to evaluate the quality of knowledge graphs, many studies have adopted a combined confidence evaluation strategy to comprehensively evaluate from multiple perspectives. Xie et al. [24] proposed the CKRL method, which aggregated the internal information on the triples and the external path information on the triples to calculate confidence. Jia et al. [25] proposed a knowledge graph triple confidence measurement model KGTtm, based on cross-neural networks, which comprehensively utilized the semantic information of the triples and path resource information to measure the reliability probability of the triples.
For the task of the uncertain knowledge graph, Chen et al. proposed UKGE [26], which obtained the correlation between the head and tail entities with the help of relations, and inferred triples using logical soft rules. Yang et al. [27] proposed UKGsE, which used the entity and relation feature vectors obtained by Word2Vec, and then fed these feature vectors to a LSTM [28] neural network to learn the confidence of all triples.
Inspired by the resource flow in KGTtm [25], we propose a method that uses the entity and relation pairing rate in a triple to calculate the confidence of the triple.
2.2. Entity Alignment
The task of entity alignment is a significant research direction in the field of knowledge graphs, aiming to discover and link the entities in two knowledge graphs that are named differently or described from varying perspectives but refer to the same object in the real world. By merging these equivalent entities, a more comprehensive knowledge graph can be constructed. In recent years, embedding-based methods have been widely used for entity alignment. The entity alignment methods can be divided into two main categories: translation-based methods and graph neural network-based methods. The translation-based methods utilize translation techniques to convert text into knowledge representations, while the convolutional neural network-based methods utilize the structure of convolutional neural networks to learn language features and represent knowledge.
TransE is the most commonly used translation-based method. This method sets the triple (h, r, t) to satisfy h + r ≈ t, where h, r and t, respectively, represent the head entity, the relation, and the tail entity. MtransE [29] employs this method to learn the embeddings of the entities and relations and introduces multiple formulas to compute the loss function. The graph neural network-based methods model the information of the graph using graph convolutional networks. GCN-Align [30] employs two two-layer GCNs [31] to model the structural and attribute information of the entities, integrating the structural and attribute embeddings to obtain more accurate entity alignment results. In addition to using GCN to extract the entity relations and attribute information, HMAN [31] also utilizes BERT to extract the textual description information about the entities for entity information modeling. MHNA [32] improves the alignment performance by designing a variable attention mechanism based on heterogeneous graphs. To better utilize the entity attribute information, GRGCN [33] employs a combination of graph convolutional neural networks and graph attention networks for entity alignment. EMGCN [34] is an unsupervised KG entity alignment approach that utilizes a late fusion mechanism to integrate the rich relational triples. DvGNet [35] alleviates the structural heterogeneity of KG from the perspective of entity interaction and relational interaction. Furthermore, a growing number of methods combine multiple embedding methods to accomplish multimodal entity alignment tasks. For example, EVA [36] creates initial alignment seeds by leveraging the entity image information, providing a completely unsupervised solution. HMEA [37] maps the multimodal information of the entities to the hyperbolic space for entity alignment. The MMEA [38] and MultiJAF [39] methods train feature vectors for the multimodal information of the entities and then align more entities based on the alignment seeds. Unlike MMEA, MultiJAF designs a numerical processing module that directly computes the similarity between the two entities based on numerical values. MEAformer [40] introduced the Transformer model, which enables finer solid-level modal fusion and alignment by dynamically predicting the inter-modal correlation coefficients.
As shown in Table 2, most of the methods are predominantly based on GCN or TransE and add other methods to perform entity alignment. We note that the noise in the knowledge graph can be avoided using confidence, but we can see that the existing methods do not use confidence. Considering that existing knowledge representation learning methods treat each triple equally, we propose a confidence-based knowledge representation learning method to solve this problem. By adding triple confidence to TransE and GCN, we achieved unequal treatment of triples, allowing the knowledge representation learning methods to adjust the importance of the triples according to their confidence. We calculated the confidence of all the triples, and then tested our proposed confidence-based knowledge representation learning method in GCN-Align and MMEA.
3. Method Overview
Our aim was to develop a method to enhance the feature extraction ability of knowledge representation learning by distinguishing the importance of high confidence and low confidence in the training process, thereby improving the effect of entity alignment. We combined confidence with two commonly used knowledge representation learning methods and proposed two knowledge representation learning methods based on confidence. We also used these two methods in the entity alignment methods to test the effectiveness of the knowledge representation learning methods based on confidence. Specifically, the method steps were as follows:
Step 1: We calculated the confidence scores for both the source knowledge graph and the target knowledge graph. After the calculation, each triple in the two knowledge graphs was assigned a corresponding confidence value.
Step 2: The feature vectors of the entities were learned using the proposed confidence-based knowledge representation learning (KRL) method.
Step 3: For the entities in the two knowledge graphs, we calculated their similarity to find the aligned entities.
This method aimed to reduce the impact of noise in knowledge graphs and enhance the quality of entity alignment. The method process is shown in Figure 1.
4. Method
The symbols used in this paper are defined as follows: a triple (h, r, t) in a triple set T includes the head entity h, the tail entity t, and the relation r connecting the head and the tail entities. We had h, t ∈ E, and r ∈ R, where E and R represent the sets of entities and relations, respectively.
4.1. Triple Confidence Calculation
We proposed a method to calculate the triple confidence using the pairing rate of the entities and relations, named Paired Triple Confidence (PTC). The pairing rate was the probability that two objects form a relationship. The first step of the method constructed a pairing rate table for all the entities and relations, which included three parts: the head entity and relation pairing rate table Phr, the relation and tail entity pairing rate table Prt, and the head entity and tail entity pairing rate table Pht. These three pairing rate tables represented the probabilities of the entities and relations being paired with each other. For example, Phr recorded the probability of all the head entities in a triple being paired with all the relations. To avoid the impact of data incompleteness, we assumed that the minimum probability of each entity and relation being paired was 0.5. It can be considered that the more times that h and r, as well as r and t, and h and t appear, the greater the corresponding pairing rates. Then we used Formulas (1)–(3) to quantify the pairing rates.
where Num(a, b) represents the number of times “a” and “b” appear in pairs.
The pairing rates reflected the probability of a triple being correct from multiple angles. We used Phr, Prt, and Pht as features to calculate the confidence level of the triple and concatenated the three pairing rates as the feature vector N of the triple, as shown in Formula (4). Then, a feedforward neural network was designed to calculate the confidence level of the triple. The feature vector N was fed into the neural network, and through the hidden layer, the final output was the confidence level of the triple.
In Formula (5), b is the bias term, W is the parameter, and the network will automatically adjust b and W through backpropagation. σ represents the sigmoid activation function, and CP(h, r, t) represents the confidence of (h, r, t). Figure 2 shows the framework of PTC.
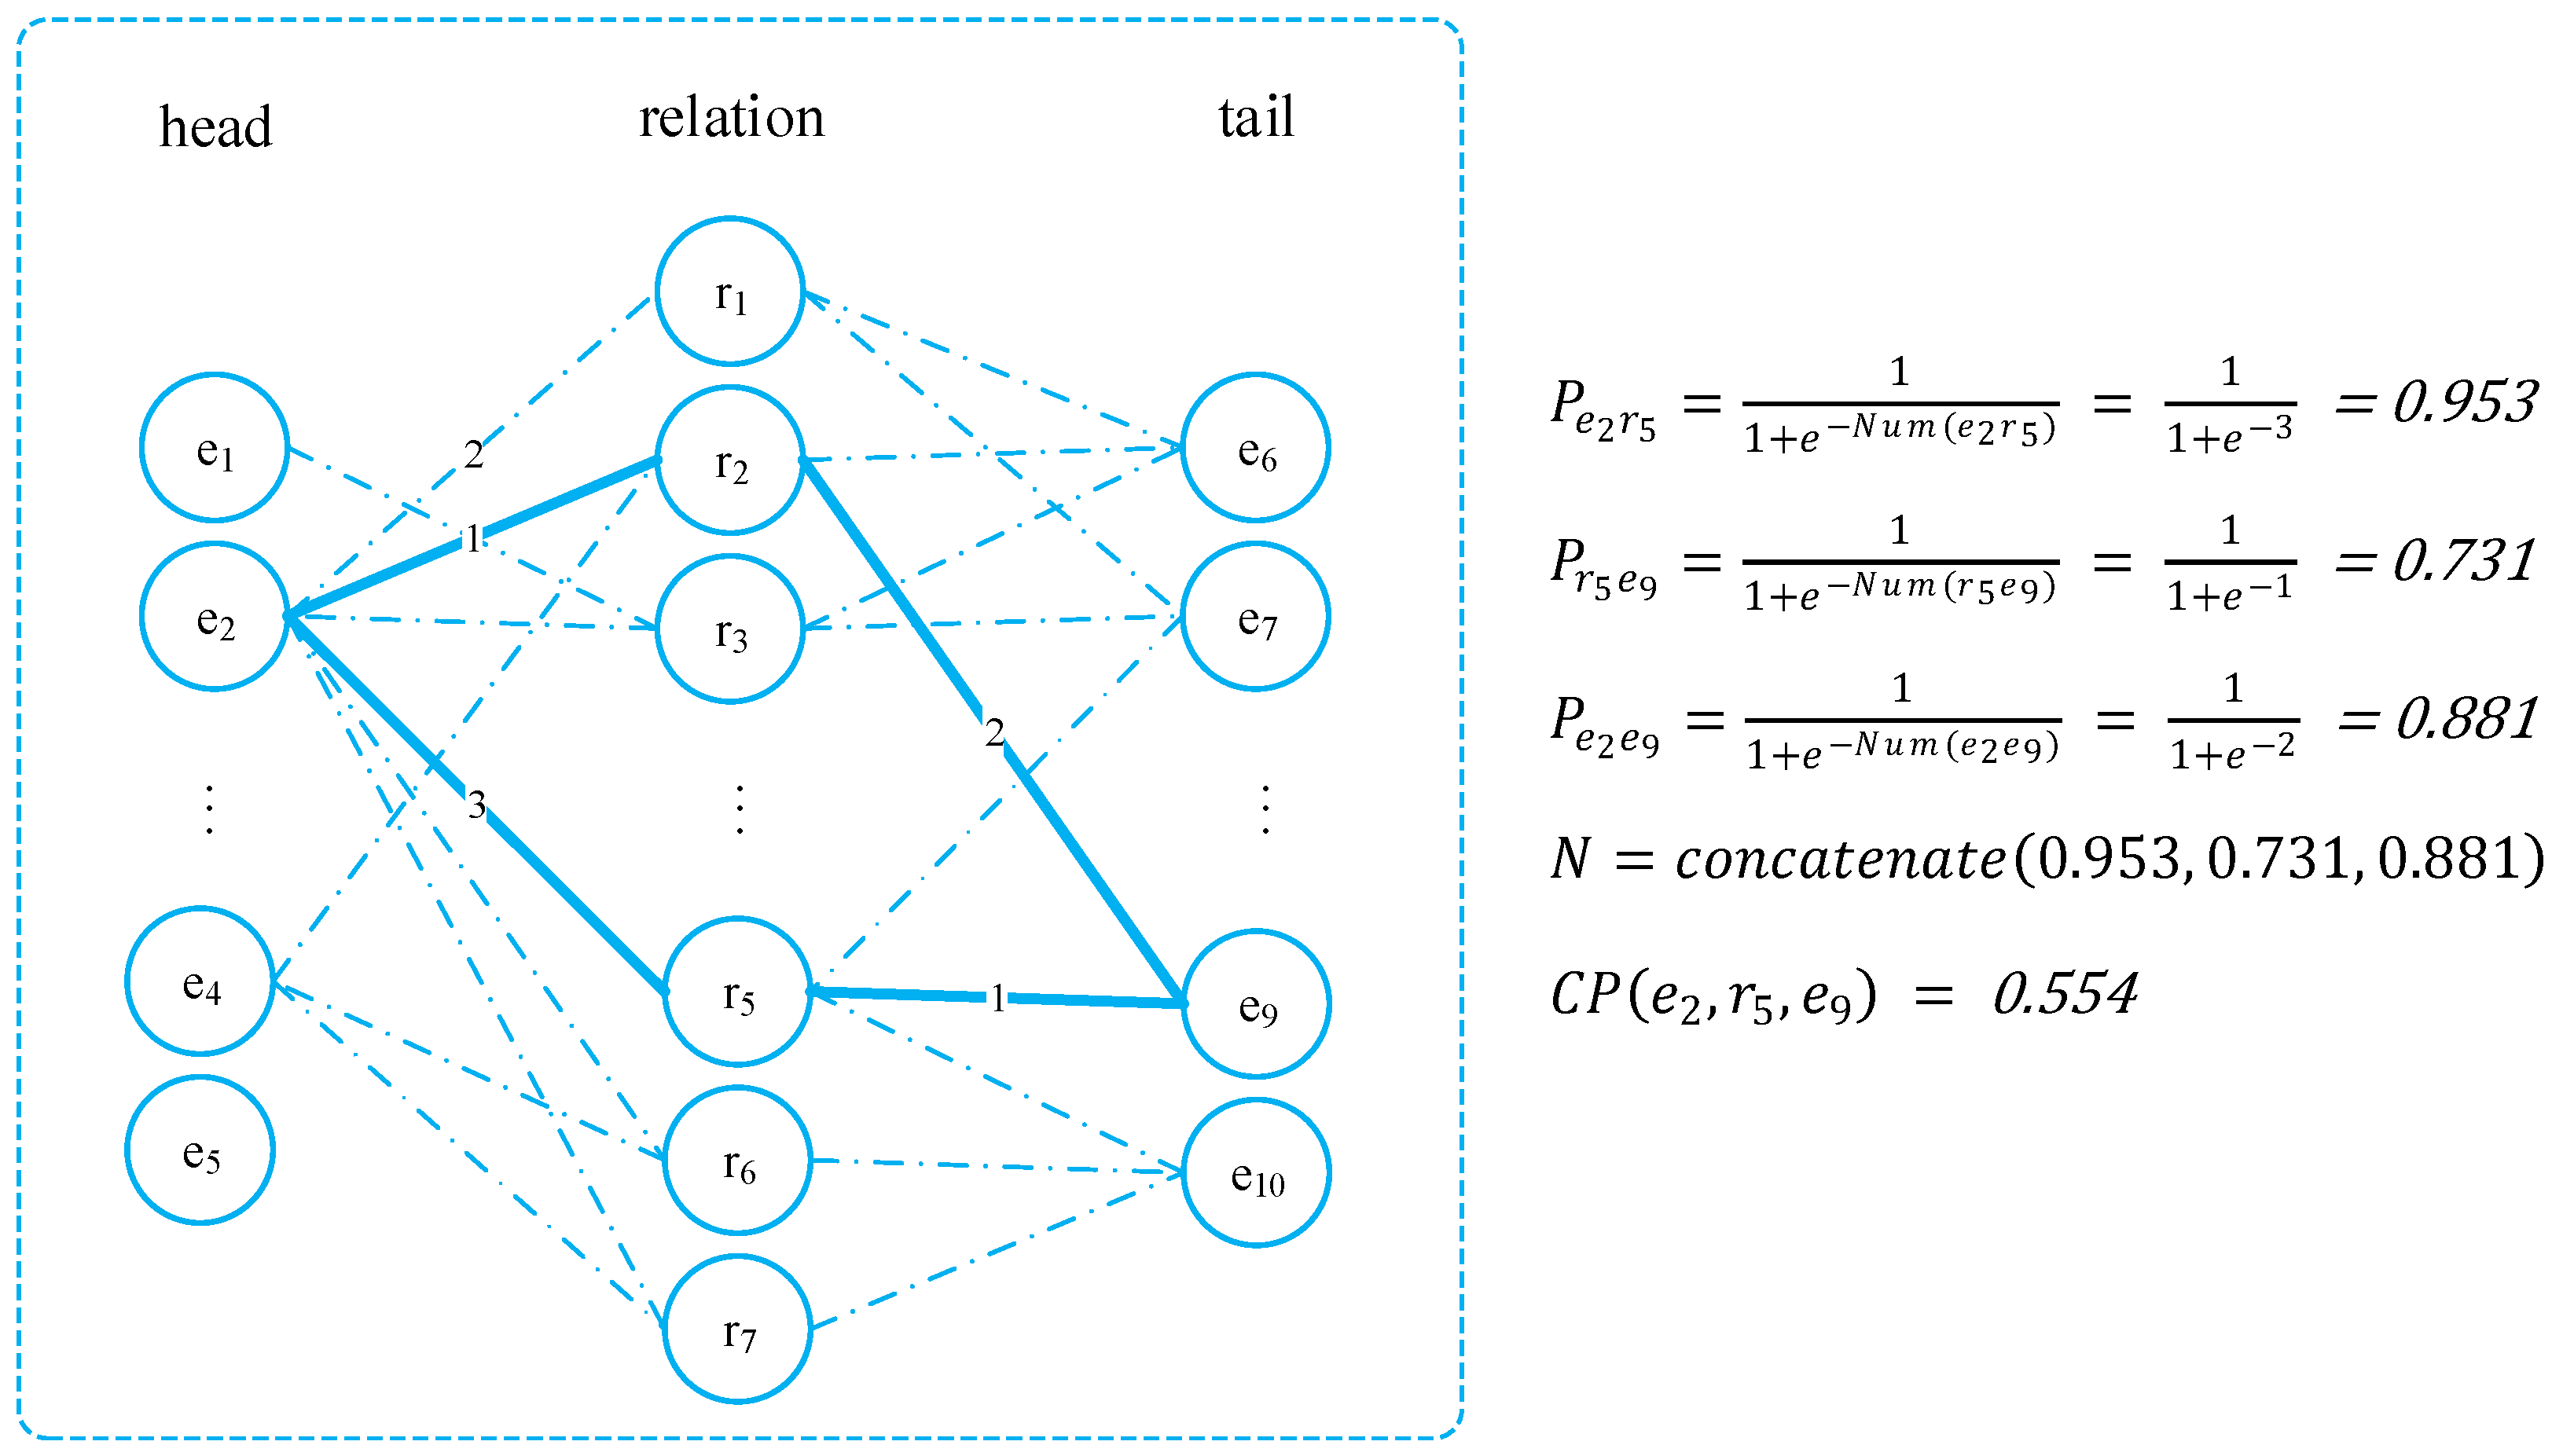
As shown in Figure 3, we took triple (e2, r5, e9) as an example. To demonstrate the numerical relationship more intuitively, we only focused on the bolded part, without distinguishing the other connecting relationships. Among them, Num(e2, r5) = 3, Num(r5, e9) = 1, and Num(e2, e9) = 2. Therefore, we obtained the values of Pe2 r5, Pr5 e9, and Pe2 e9 by querying the pairing rate table.
In Figure 3, the reason for the higher Pe2r5 value was that e2 appeared more frequently as a head entity with r5 as the relationship, while in comparison, the occurrence of both the relationship r5 and the tail entity e9 was relatively low. As a result, the corresponding pairing rates after the transformation function were also low. The embedding vector of the triple (e2, r5, e9) was obtained by concatenating the pairing rates of its three components. This embedding vector was then fed through a feed-forward neural network to obtain the final confidence score CP(e2, r5, e9).
4.2. Confidence-Based KRL
The existing knowledge representation learning approaches treat triples equally during training, which are affected by the noise in the knowledge graph. Therefore, we attempted to combine confidence with the knowledge representation learning methods to reduce the impact of noise on knowledge representation learning and achieve better learning performance. However, in practice, leveraging confidence to enhance knowledge representation learning posed a challenge due to the varying methodologies of knowledge representation learning. In this study, we explored two approaches. Considering that the current entity alignment methods based on knowledge representation learning can be divided into graph neural network-based methods and translation-based methods, we conducted experiments using the GCN and TransE methods, using confidence to enhance GCN and TransE, respectively.
4.2.1. Confidence-Enhanced GCN
GCN is a feature extractor for the graph data, and the propagation between its layers is shown in Formulas (8) and (9). It should be noted that the GCN method does not take into account the existence of noise in the knowledge graph when calculating the adjacency matrix and treating all connections equally. Therefore, we designed a confidence-based GCN (Confidence-GCN) to reduce the impact of noise, which differs from GCN in that we used a confidence adjacency matrix.
The confidence adjacency matrix takes into account the confidence between the entities, which is based on the confidence of the corresponding triples. To elaborate, let us assume that there are N nodes in the knowledge graph. The relations between these nodes form an N × N matrix, denoted as C, which is the confidence adjacency matrix. Its elements are represented as a(i, j), and their calculation is outlined in Formula (6). When there exists a relationship between entities i and j, the value of the confidence adjacency matrix is defined as the maximum of CP(i, , j) and CP(j, , i). We chose the maximum value because the adjacency matrix describes the level of connection between the two entities. When the two entities have multiple connection relations, the connection level between them should be higher. Additionally, we only focused on whether or not there was a relationship between the entities instead of on the specific nature of the relationship.
Similar to GCN, when using a confidence adjacency matrix, the node features were solely derived from the features of their neighbors, disregarding the features of the node itself. Therefore, we added the identity matrix I to C. The resulting adjacency matrix was denoted as , and the computation of was as shown in Formula (7). This approach ensured that the features of the node itself were not lost during the calculation.
where X is the feature matrix of entities, is the diagonal node degree matrix of , φ is the activation function Relu(·) = Max(0, ·), W(l) denotes the weight matrix for the l-th layer, H is the output of the first layer of the model, and O is the final output of the model.
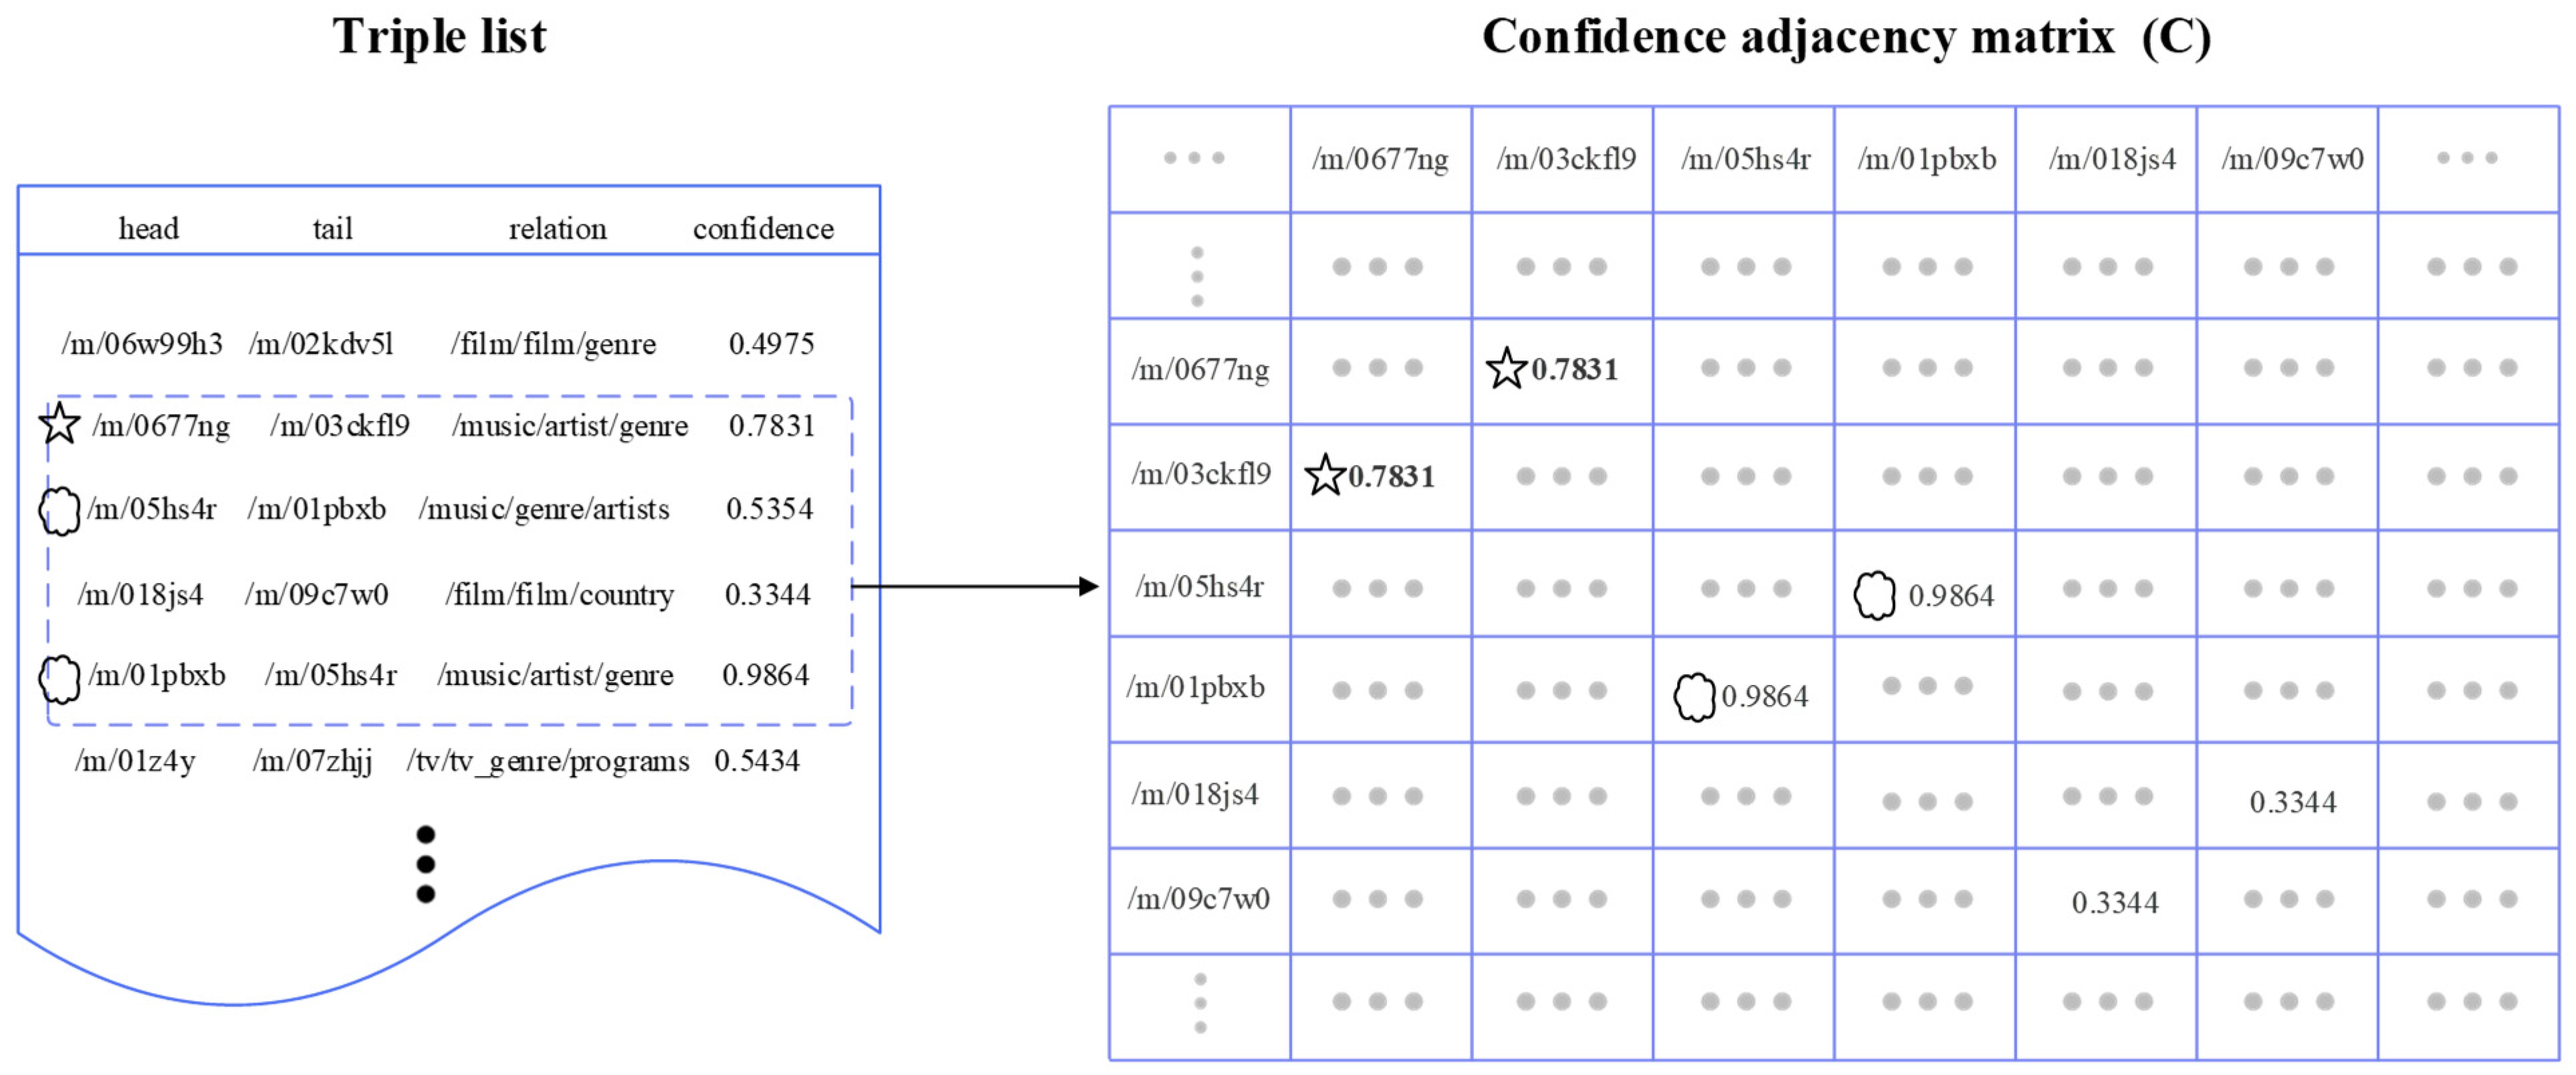
The adjacency matrix is illustrated in Figure 4. Taking the triple (/m/0677ng, /music/artist/genre, /m/03ckfl9) as an example, with a confidence level of 0.7831. Consequently, in the adjacency matrix, a(/m/0677ng, /m/03ckfl9) = a(/m/03ckfl9,/m/0677ng) = 0.7831 (values are highlighted in bold in the figure). For the triple (/m/05hs4r, /music/genre/artists, /m/01pbxb) with a confidence score of 0.5354, and the triple (/m/01pbxb, /music/artist/genre, /m/05hs4r) with a confidence score of 0.9864, wherein both triples involved the same entities, the maximum confidence value was chosen within the adjacency matrix. Therefore, the values at the corresponding positions for /m/05hs4r and /m/01pbxb in the adjacency matrix were set to 0.9864.
The details of the proposed Confidence-GCN are presented in the Algorithm 1. First of all, the confidence adjacency matrix was initialized, the maximum confidence between the entity pairs was initialized as the value of the corresponding position in the adjacency matrix. Secondly, to prevent the node’s own features from being ignored during computation, an identity matrix I was added to to generate , then the degree matrix and the initialized weight matrix were calculated. Finally, the confidence was obtained using training.
The crux of the algorithm lay within lines 2 to 10, where the focus was on processing the confidence adjacency matrix. Specifically, lines 3–6 determined if entities h and t did not exist in the adjacency matrix and , a(h, t) was assigned the value of CP(h, r, t); yet if they existed, a comparison between a(h, t) and CP(h, r, t) took place, with a(h, t) being set to the greater value. Similarly, lines 7–10 determined if the entities t and h did not exist in the adjacency matrix and , a(t, h) was established as CP(h, r, t); should they exist, a comparison was made between a(t, h) and CP(h, r, t), and subsequently, a(t, h) was assigned the greater value.
| Algorithm 1 Confidence-GCN. |
| Input: T, X, CP // T = {(h, r, t)} is a set of triple id forms in the training set, X is the entity feature matrix, CP is the confidence set of the triple obtained through the confidence calculation. Output: O // O is embedded representation set of triple T learned from the knowledge representation and confidence. Initialize adjacency matrix 2. for (h, r, t) ∈T do 3. if (a(h, t) not in C) then 4. a(h, t) = CP(h, r, t) 5. else 6. a(h, t) = max(a(h, t), CP(h, r, t)) 7. if (a(t, h) not in C) then 8. a(t, h) = CP(h, r, t) 9. else 10. a(t, h) = max(a(t, h), CP(h,r,t)) ← + I ← 13. W ← Normal distribution randomly generates parameter matrix 14. for epoch in range(epochs) do 15. H ← The first Confidence-GCN layer 16. O ← The second Confidence-GCN layer 17. Calculate Loss 18. Update parameters using GradientDescentOptimizer |
4.2.2. Confidence-Enhanced TransE
TransE-based models learn embeddings by calculating the distance between the embeddings of h, r and t in a triple, and hope to achieve h + r ≈ t. Its energy function [20] is shown in Formula (10).
In Formula (11), M is a fixed value, representing the threshold for penalizing triples. We considered that due to the different confidence levels of the different triples, the current loss function learned triples indiscriminately during learning, which may have led to the inability of the method to focus on triples with a higher confidence. Therefore, this study proposed a confidence-based TransE method called Confidence-TransE. Confidence-TransE mainly changes the loss function of TransE. The global fixed M value cannot fully leverage the influence of the different triples, and the threshold M should vary according to the confidence values of the different triples. Confidence-TransE expects to distinguish the different triples more by the confidence of the triples and pays more attention to the triples with a higher confidence. We proposed a dynamic margin (Dynamic Margin, DM) strategy, where the dynamic margin was calculated as shown in Formula (12). The loss function definition using dynamic margin is shown in Formula (13).
where CP(h, r, t) represents the confidence of the triple (h, r, t), and gamma is a hyperparameter. In Table 3, we illustrate how Confidence-TransE dynamically adjusted the margin value for the triples of different confidence levels.
Table 3 demonstrates, through examples, how Confidence-TransE dynamically adjusted the margin value for the triples with different confidences. Specifically, for each triple (head entity, relationship, tail entity), a corresponding margin value was set based on its confidence. The triples with a high confidence were assigned a smaller margin value, allowing the model to precisely fit each high-confidence triple in the training data. On the other hand, the triples with low confidence were assigned a larger margin value, which required the model to have a greater discrimination between correct and incorrect classifications. This adjustment helped the model to better learn the knowledge representations for the different levels of confidence.
4.3. Entity Alignment Based on Confidence KRL
We applied the confidence-based knowledge representation learning method to the entity alignment task using the method proposed in Section 4.2.
4.3.1. Entity Alignment Based on Confidence-Enhanced GCN
We proposed Confidence-GCN to learn more accurate triplet embeddings in the KG. To validate this idea, we applied the confidence-based representation learning method Confidence-GCN proposed in Section 4.2 to GCN-Align [30].
GCN-Align is an entity alignment method based on GCN. It uses two two-layer GCNs to learn the structure information and attribute information of the entities, and combines the results of the structure embedding and attribute embedding to obtain accurate aligned entities.
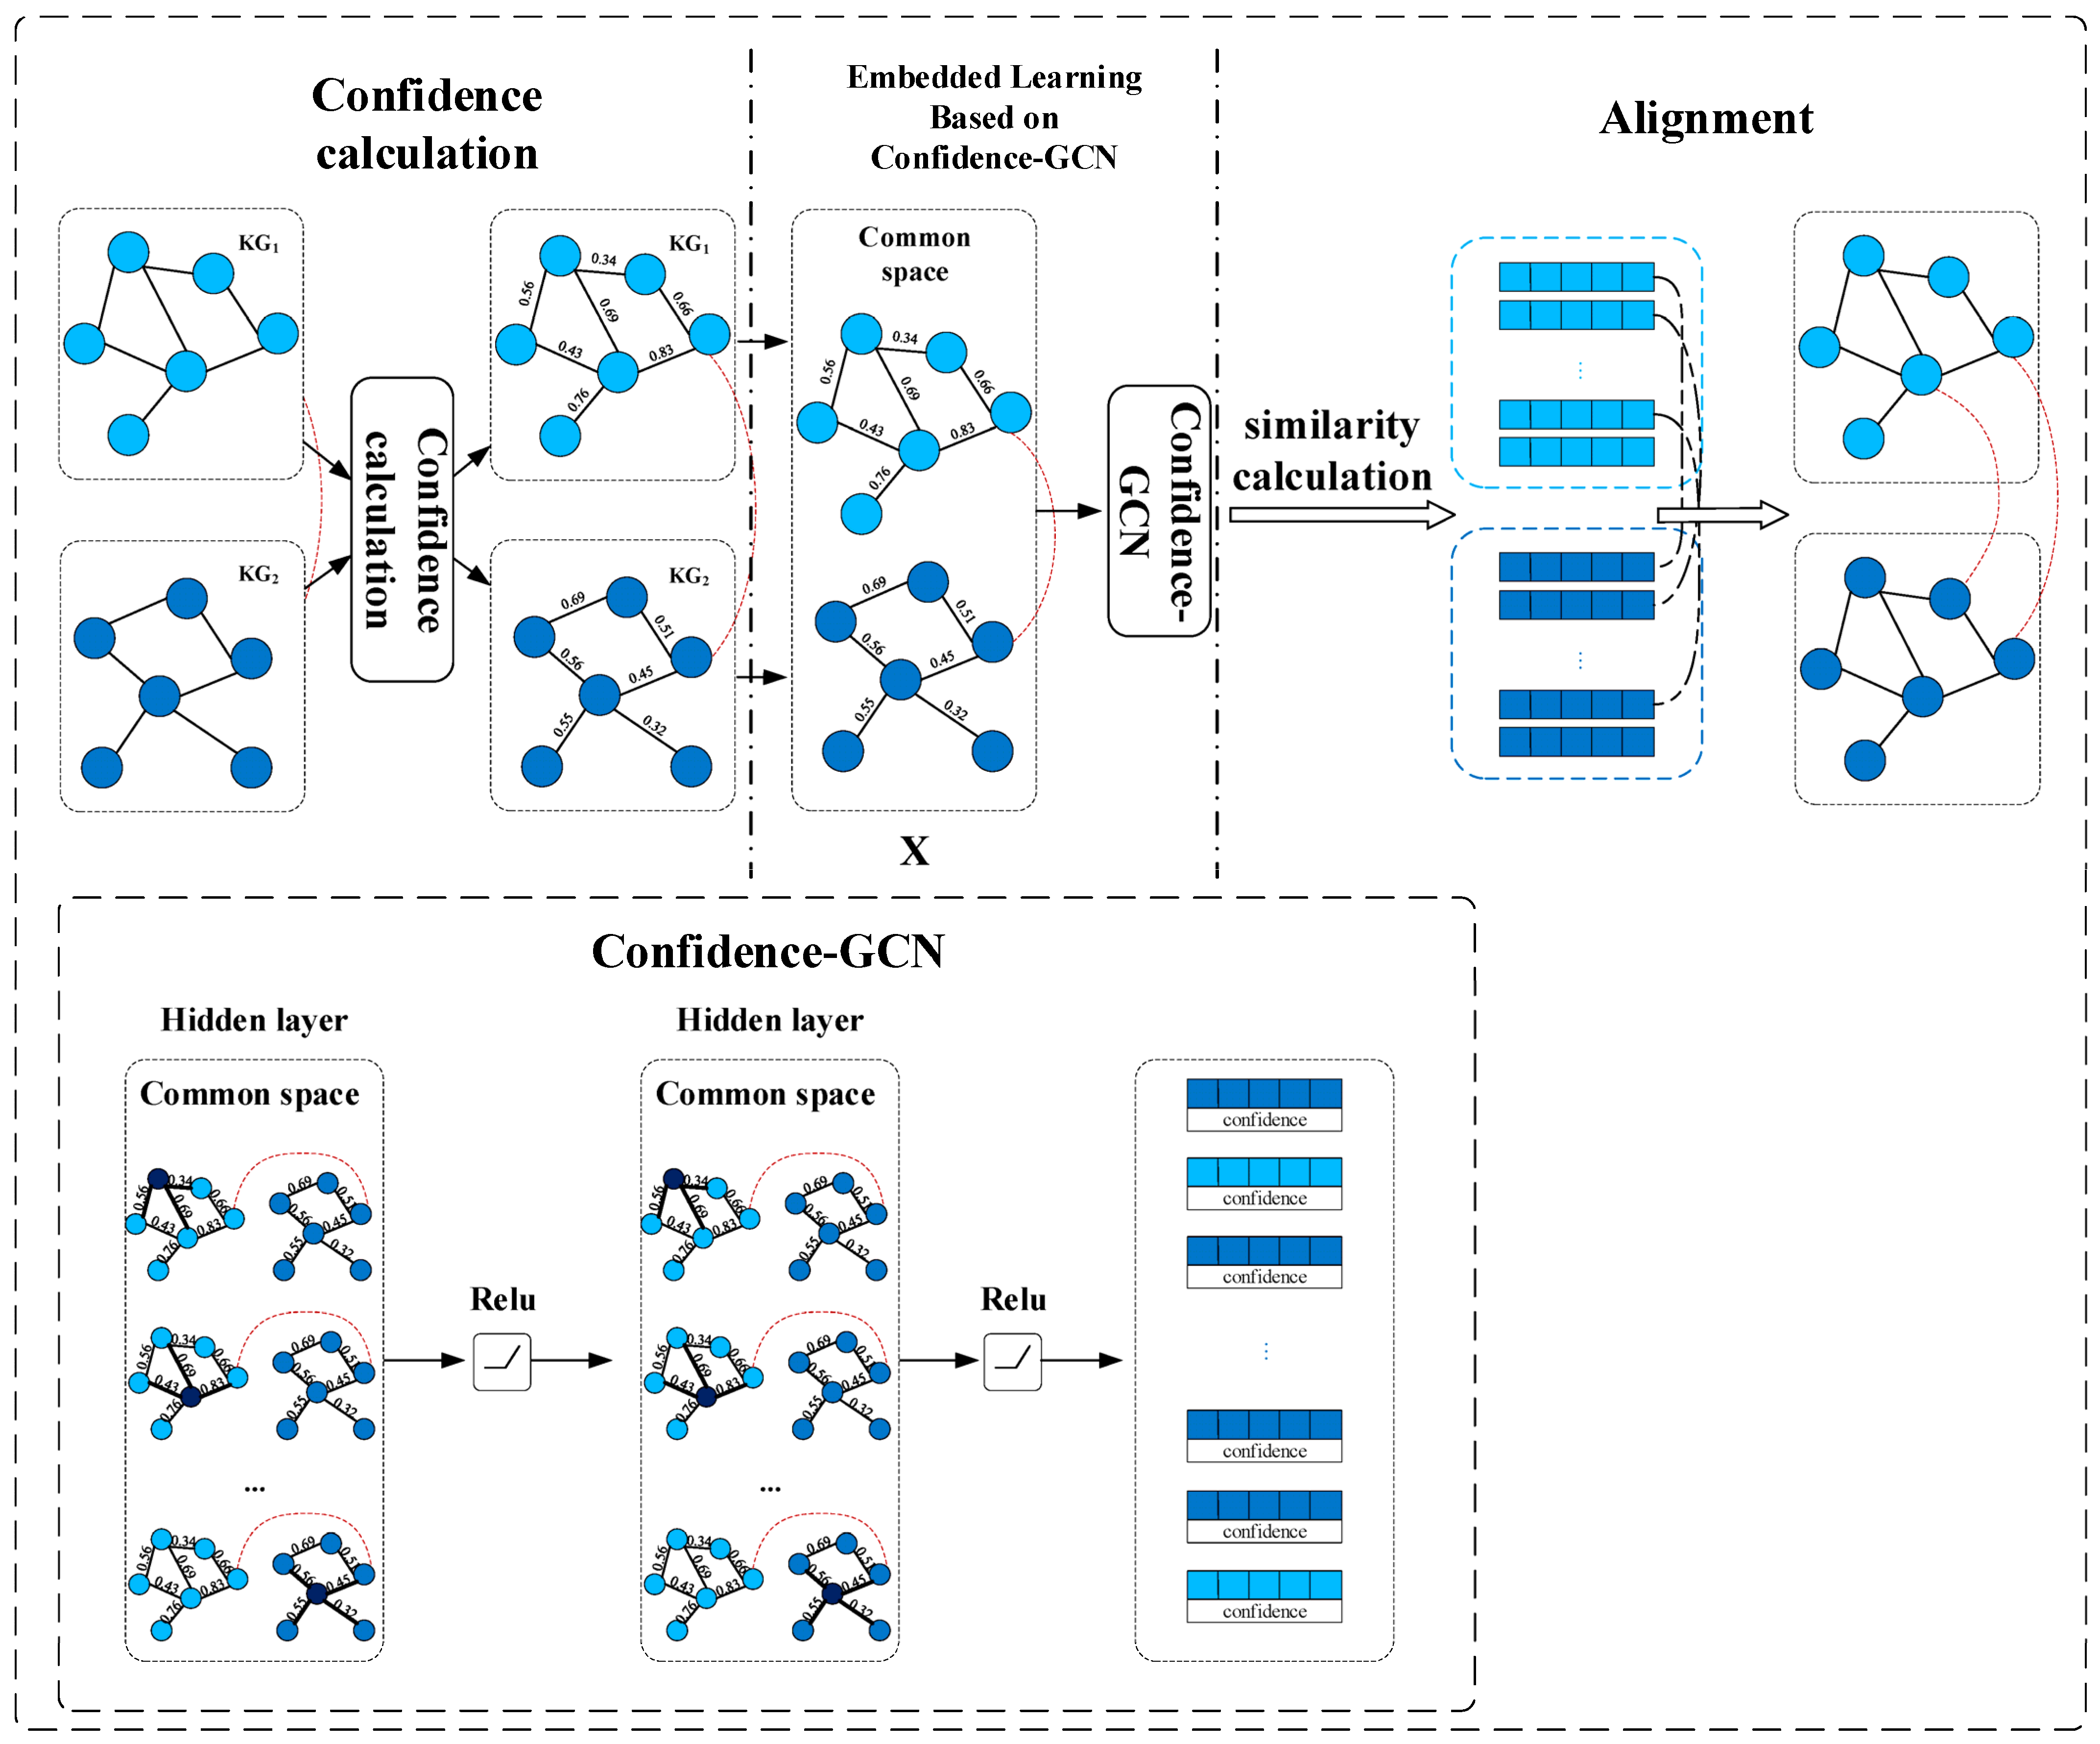
The Confidence-GCN-Align proposed in this paper differs from the GCN-Align in the calculation of the adjacency matrix. GCN-Align employs a specific approach to compute the adjacency matrix C of the KG. The elements a(i, j)∈C represent the degree of alignment information from the i-th entity to the j-th entity, which is computed using a function (fun) and an inverse function (ifun). In this paper, we improved on this method by incorporating the Confidence-GCN proposed in Section 4.2.1. Firstly, both knowledge graphs were input into the confidence calculation module to compute the confidence for all the triples in the knowledge graphs. Then, these confidences were used to construct the adjacency matrix for the entities. Finally, the entities were trained using two two-layer GCNs. The loss function and embedding dimension of the method were consistent with GCN-Align. The Confidence-GCN-Align method framework diagram is shown in Figure 5.
4.3.2. Entity Alignment Based on Confidence-Enhanced TransE
The method proposed was also applied to the multi-modal entity alignment task. In order to validate the effectiveness of Confidence-TransE in enhancing multi-modal entity alignment, we evaluated the Confidence-TransE method within the framework of MMEA [38]. Specifically, we used Confidence-TransE to learn the relational triple embedding representations.
The MMEA consists of two parts: the Multimodal Knowledge Embedding module and the Multimodal Knowledge Fusion module. In order to compare the effect of confidence enhancement, we proposed a confidence-based entity alignment method, Confidence-MMEA, which took the knowledge embedding module as its core and extracted the relational features using Confidence-TransE instead of TransE. Furthermore, due to the incorporation of a swapping strategy within MMEA to supplement positive samples (the swapping strategy refers to the process in which, if an entity h is already aligned with h* in another knowledge graph, the triple (h*, r, t) will be expanded into the set of positive samples. Similarly, in the case of a tail entity t aligned with t* in a different knowledge graph, the swapping strategy also generates the triple (h, r, t*) and includes it within the positive samples), the Confidence-MMEA method specifies that if the confidence of the triple (e1, r1, e2) in the knowledge graph is α, and there are alignment seeds (e3, e1) and (e4, e2) in the knowledge graph, the positive samples (e3, r1, e2) and (e1, r1, e4) will be generated, with their confidence scores set to α. An example of a confidence swapping strategy is shown in Figure 6. The specific rules of the swapping strategy are as follows:
where h, r, and t represent the head entity, relation, and tail entity of a triple, respectively. represents the positive triples, is the added positive sample, and (x, x*) denotes the alignment seeds. We defined the confidence of the triples generated according to the swapping strategy, (h*, r, t) or (h, r, t*) as follows:
Similar to MMEA, the TransE is used for the feature extraction of relationship triples. The scoring function is . Different from the MMEA model, our method utilized the Confidence-TransE proposed in Section 4.2.2. Specifically, this method aims to differentiate between the different triples based on their confidence. If the confidence of a triple is higher, it should be given more importance and its impact should be amplified, whereas if the confidence is lower, its impact should be reduced.
5. Experiments
Our experimental goal was to validate the performance of the knowledge confidence calculation using a triple classification task, and to verify the performance of our proposed confidence-based knowledge representation learning method using entity alignment.
Triple classification was designed to determine whether the triple in the test data was correct, and evaluate the performance using precision, accuracy, and the F1 score as the evaluation metrics. The performance of the knowledge representation learning method based on confidence was evaluated by performing the entity alignment task. In the entity alignment task, we used the same strategy as the corresponding method to calculate the similarity between the entities in the two knowledge graphs and used the same evaluation index as the original method to evaluate.
5.1. Datasets
The confidence calculation was verified using the triple classification task using FB15k, we used the false triples provided in the paper [25] as negative examples. The classification labels were assigned as 1 for the correct triples and 0 for the incorrect triples.
In addition, the triples in the uncertain knowledge graph CN15K extracted from ConceptNet [41] all had confidence scores, so we could calculate the difference between the predicted confidence and the actual confidence, and used the mean square error (MSE) and mean absolute error (MAE) as evaluation indicators. The smaller the mean square error and the mean absolute error, the better the performance of the method.
In the entity alignment experiments, we used the same datasets as GCN-Align and MMEA, namely DBP15KZH-EN, DBP15KJA-EN, and DBP15KFR-EN for Confidence-GCN-Align. For Confidence-MMEA, we employed the multimodal datasets FB15K-DB15K and FB15K-YAGO15K from MMKG [42].
5.2. Triple Confidence Calculation
Experimental setup: We used all 592,213 triples from FB15K to construct the pairing rate table. We implemented the feedforward network structure of PTC using the Keras library. The batch size was set to 1024. The input dimension of the feedforward neural network was set to 3. The hidden layer was designed with 16 units, and a dropout rate of 0.5 was applied. We set the max epoch to 200 and employed an early stopping strategy to train for the additional epochs based on the performance of the validation set in order to obtain more accurate results. The optimization algorithm used was SGD, and the loss function used was binary cross-entropy.
The output of the method used the sigmoid function to obtain the final result; if the result was greater than 0.5, it was classified as a positive triple, otherwise it was classified as an error triple. We evaluated the efficiency of the model through the triple classification task, and the experimental results are shown in the Table 4.
The experimental results showed that this method achieved the best performance compared with the baseline model, which proved that our method can perform the triple classification task better. Moreover, we used less time and memory. Building the PTC pairing rate table only required a single pass to establish the pairing rates, saving time compared with constructing a resource graph. The time complexity of building the PTC pairing rate table was “O(Z)”, where “Z” represented the number of relationships. Additionally, this method quantified the confidence of the triples and obtained their confidence values, which can be used for subsequent entity alignment tasks. However, due to the PTC method’s reliance on pairing rates to calculate the triple confidence, it required a large amount of data to build a pairing rate dictionary, similar to how a resource graph is constructed in the KGTtm method. When the dataset was small, the effectiveness was weaker.
We also apply this proposed method to the uncertain knowledge graph CN15K to calculate MSE and MAE to evaluate the ability of predicting the confidence scores. Furthermore, we considered triples with confidence greater than 0.5 as correct triples and those less than or equal to 0.5 as incorrect triples in the two graphs, and the results are shown in Table 5.
The results showed that the MSE and MAE of PTC are lower, which indicated that the prediction values of this proposed method were closer to the truth confidence values. In addition, the Pre, Acc, and F1 metrics in the table evaluated the ability of the triple classification tasks, and we did not have the data of URGE, UKGE, and UKGsE. The triple classification results also showed that PTC achieved a good performance. Table 6 shows the comparison between the PTC model prediction and the true confidence. In summary, the proposed method effectively predicted the triple confidence scores and achieved competitive triple classification results.
5.3. Entity Alignment
In order to effectively compare the entity alignment model with the confidence and the original entity alignment model, the parameter settings in the proposed entity alignment method were the same as those in the original model.
5.3.1. Confidence-GCN-Align
In order to better demonstrate the effect of confidence-enhanced entity alignment, the dataset division and parameter settings in Confidence-GCN-Align were the same as those in GCN-Align, and we employed two embedding modes:
- (1)
- Structural embedding (SE).
- (2)
- Combination of structural embedding and attribute embedding (SE + AE).
We evaluated the performance of the models on three datasets, and the experimental results are presented in Table 7, Table 8 and Table 9. In all the datasets, confidence-GCN-Align performed better than GCN-Align without the confidence. This improvement can be attributed to the utilization of the confidence-based GCN in confidence-GCN-Align. When aggregating the neighbor information, the information from the highly confident connected neighbors was better aggregated, while the information from the low-confidence connected neighbors had less impact. This showed that confidence-GCN, a knowledge representation learning method based on confidence, achieved better results in knowledge representation.
In addition, in the three cross-lingual datasets, focusing on the results for Hits@1, Hits@10, and Hits@50, the results of GCN-Align with SE + AE improved by 4.163, 3.388, and 1.872, respectively, compared with the average results of the single SE embeddings. Similarly, Confidence-GCN-Align also outperformed the single SE embeddings by 4.575, 4.058, and 2.345, respectively, in the three data sets. This demonstrated that incorporating the confidence measures enhanced the overall embedding performance.
5.3.2. Confidence-TransE-Align
We used MMEA to validate the proposed Confidence-TransE. The primary objective of the experiments was to assess the performance differences between the proposed Confidence-MMEA and the MMEA in the multimodal knowledge graph entity alignment task. gamma was set to 1.5 and all the other parameters were set the same as MMEA.
As for Formula (12), the choice of our proposed DM strategy as gamma − CP(h, r, t) was motivated by the following reasons: we conducted the experiments using various methods, and took 20% of the data on the FB15K-DB15K dataset for training, systematically varying the gamma parameter within the range of 1 to 2, in order to achieve the best possible results. The results of these experiments can be found in Table 10.
In Table 10, it is evident that the DM strategy yielded the best results when set as gamma − CP(h, r, t). To further determine the optimal value for gamma, we conducted experiments, the findings of which are illustrated in Figure 7, indicating that the most favorable performance was achieved when gamma was set to 1.5.
Table 11 and Table 12 show the results of the model on the FB15K-DB15K and FB15K-YAGO15K datasets, respectively. The data in the table are all derived from the experimental runs, and the bolded results show that the results were better. The percentages in the table represent using 20%, 50%, and 80% of the data as the training set, with the remaining data used as the test set.
The experimental results showed that the Confidence-MMEA method outperformed MMEA in all cases on both the FB15K-DB15K and FB15K-YAGO15K datasets. Specifically:
- (1)
- In terms of the Hits@1, Hits@5, and Hits@10 metrics, Confidence-MMEA performed better than MMEA. It was particularly noteworthy that our method demonstrated a nearly 9% improvement when trained with 50% of the data. This indicated that Confidence-TransE possessed a stronger capability for knowledge representation learning compared with TransE without confidence. This suggested that Confidence-MMEA was more effective at correctly aligning the entities within the top-ranked predictions.
- (2)
- The MRR metric for Confidence-MMEA was significantly better than MMEA. This showed that Confidence-MMEA was more likely to find the correct triple relations among the top-ranking positions.
- (3)
- The MR value for Confidence-MMEA was higher than that of MMEA. This could be attributed to the fact that, after incorporating the confidence scores, the algorithm tended to focus more on the entities with a higher confidence. However, there may have been some errors in the current confidence score calculations, leading to higher MR values for certain cases.
In general, our method demonstrated better performance across metrics such as Hits@1, Hits@5, Hits@10, and MRR, with the exception of the MR metric. MRR primarily focused on the best rankings, while MR was influenced by the rankings of each triple. This showed that after adding confidence, the increase in the number of high-ranking triples made MRR’s performance better, but a small number of triples with low-rankings led to an increase in MR. With the expansion of the training data, the MR index of our proposed method is gradually improving.
The Confidence-MMEA method outperformed the traditional MMEA methods in the knowledge graph entity alignment task, exhibiting significant improvements across the various evaluation metrics. The superior performance of Confidence-MMEA was attributed to the utilization of Confidence-TransE during relationship extraction, suggesting that Confidence-TransE is a more promising and practical method.
Summary: The two proposed confidence-based knowledge representation learning methods in this paper achieved better results in the entity alignment experiments compared with the methods without the confidence calculation. This suggests that Confidence-GCN and Confidence-TransE, incorporating confidence, are more effective than GCN and TransE in knowledge representation learning.
6. Conclusions
In this paper, we proposed a confidence calculation method named PTC, which calculates the confidence of triples using the pairing rate of the three angles between the entities and relations. The experimental results showed that this method has a good effect. In this paper, confidence calculation was used as a tool for entity alignment, and future experiments will be designed to verify the influence of the confidence strategy on entity alignment. To assess the influence of confidence on knowledge representation learning in entity alignment tasks, experiments were conducted on GCN and TransE. We introduced two knowledge representation learning methods, Confidence-GCN and Confidence-TransE, which incorporated confidence scores. The experimental results confirmed that Confidence-GCN and Confidence-TransE were more effective in knowledge representation learning compared with GCN and TransE.
We applied the knowledge representation learning methods based on confidence to entity alignment, which can reduce the impact of noise and effectively improve the performance of the entity alignment tasks. In principle, with the correct strategy, we can use the confidence of triples to enhance the effectiveness of knowledge representation learning. However, there are still some limitations in these confidence-based knowledge representation learning methods. They rely on the strategies that use confidence. Additionally, the improvement effect is weaker when the training data are limited. In the future, adopting better strategies will enhance the effectiveness of knowledge representation learning. Furthermore, our future work will focus on developing advanced models and techniques for handling the multimodal knowledge graphs and improving alignment performance. Currently, our method does not introduce the confidence scores for image modality. In the future, we plan to introduce image confidence scores and combine them with Confidence-GCN or Confidence-TransE to enhance the model. Ultimately, we aim to combine this model with other advanced models to propose a multimodal entity alignment framework.
Author Contributions
Conceptualization, X.Z., T.C. and H.W.; methodology, X.Z. and T.C.; validation, X.Z., T.C. and H.W.; formal analysis, T.C.; investigation, T.C.; writing—original draft preparation, T.C.; writing—review and editing, X.Z. and H.W.; funding acquisition, X.Z. All authors have read and agreed to the published version of the manuscript.
Funding
This research was funded by the Hebei Natural Science Foundation, grant number F2022208002, and the Science and Technology Project of the Hebei Education Department (Key Program), grant number ZD2021048.
Data Availability Statement
All data used in this paper are publicly available.
Conflicts of Interest
The authors declare no conflicts of interest.
References
- Cui, H.; Peng, T.; Xiao, F.; Han, J.; Han, R.; Liu, L. Incorporating anticipation embedding into reinforcement learning framework for multi-hop knowledge graph question answering. Inf. Sci. 2023, 619, 745–761. [Google Scholar] [CrossRef]
- Liu, C.; Ji, X.; Dong, Y.; He, M.; Yang, M.; Wang, Y. Chinese mineral question and answering system based on knowledge graph. Expert Syst. Appl. 2023, 231, 120841. [Google Scholar] [CrossRef]
- Shen, J.; Pan, T.; Xu, M.; Gan, D.; An, B. A novel DL-based algorithm integrating medical knowledge graph and doctor modeling for Q&A pair matching in OHP. Inf. Process. Manag. 2023, 60, 103322. [Google Scholar] [CrossRef]
- Bertram, N.; Dunkel, J.; Hermoso, R. I am all EARS: Using open data and knowledge graph embeddings for music recommendations. Expert Syst. Appl. 2023, 229, 120347. [Google Scholar] [CrossRef]
- Dai, Q.; Wu, X.-M.; Fan, L.; Li, Q.; Liu, H.; Zhang, X.; Wang, D.; Lin, G.; Yang, K. Personalized knowledge-aware recommendation with collaborative and attentive graph convolutional networks. Pattern Recognit. 2022, 128, 108628. [Google Scholar] [CrossRef]
- Wang, H.; Wang, Z.; Hu, S.; Xu, X.; Chen, S.; Tu, Z. DUSKG: A fine-grained knowledge graph for effective personalized service recommendation. Future Gener. Comput. Syst. 2019, 100, 600–617. [Google Scholar] [CrossRef]
- Tiddi, I.; Schlobach, S. Knowledge graphs as tools for explainable machine learning: A survey. Artif. Intell. 2022, 302, 103627. [Google Scholar] [CrossRef]
- Chang, C.; Zhou, J.; Weng, Y.; Zeng, X.; Wu, Z.; Wang, C.-D.; Tang, Y. KGTN: Knowledge Graph Transformer Network for explainable multi-category item recommendation. Knowl.-Based Syst. 2023, 278, 110854. [Google Scholar] [CrossRef]
- Li, Y.; Liu, L.; Wang, G.; Du, Y.; Chen, P. EGNN: Constructing explainable graph neural networks via knowledge distillation. Knowl.-Based Syst. 2022, 241, 108345. [Google Scholar] [CrossRef]
- Lehmann, J.; Isele, R.; Jakob, M.; Jentzsch, A.; Kontokostas, D.; Mendes, P.N.; Hellmann, S.; Morsey, M.; van Kleef, P.; Auer, S.; et al. DBpedia—A large-scale, multilingual knowledge base extracted from Wikipedia. Semant. Web 2015, 6, 167–195. [Google Scholar] [CrossRef]
- Bollacker, K.; Evans, C.; Paritosh, P.; Sturge, T.; Taylor, J. Freebase: A collaboratively created graph database for structuring human knowledge. In Proceedings of the 2008 ACM SIGMOD International Conference on Management of Data, Vancouver, BC, Canada, 9–12 June 2008; pp. 1247–1250. [Google Scholar]
- Zeng, K.; Li, C.; Hou, L.; Li, J.; Feng, L. A comprehensive survey of entity alignment for knowledge graphs. AI Open 2021, 2, 1–13. [Google Scholar] [CrossRef]
- Murali, L.; Gopakumar, G.; Viswanathan, D.M.; Nedungadi, P. Towards electronic health record-based medical knowledge graph construction, completion, and applications: A literature study. J. Biomed. Inform. 2023, 143, 104403. [Google Scholar] [CrossRef] [PubMed]
- Bharadwaj, A.G.; Starly, B. Knowledge graph construction for product designs from large CAD model repositories. Adv. Eng. Inform. 2022, 53, 101680. [Google Scholar] [CrossRef]
- Li, J.; Song, D.; Wang, H.; Wu, Z.; Zhou, C.; Zhou, Y. Entity alignment for temporal knowledge graphs via adaptive graph networks. Knowl.-Based Syst. 2023, 274, 110631. [Google Scholar] [CrossRef]
- Wang, C.; Huang, Z.; Wan, Y.; Wei, J.; Zhao, J.; Wang, P. FuAlign: Cross-lingual entity alignment via multi-view representation learning of fused knowledge graphs. Inf. Fusion 2023, 89, 41–52. [Google Scholar] [CrossRef]
- Qian, Y.; Pan, L. Variety-aware GAN and online learning augmented self-training model for knowledge graph entity alignment. Inf. Process. Manag. 2023, 60, 103472. [Google Scholar] [CrossRef]
- Heindorf, S.; Potthast, M.; Stein, B.; Engels, G. Vandalism Detection in Wikidata. In Proceedings of the 25th ACM International on Conference on Information and Knowledge Management, Indianapolis, IN, USA, 24–28 October 2016; pp. 327–336. [Google Scholar]
- Wang, X.; Chen, L.; Ban, T.; Usman, M.; Guan, Y.; Liu, S.; Wu, T.; Chen, H. Knowledge graph quality control: A survey. Fundam. Res. 2021, 1, 607–626. [Google Scholar] [CrossRef]
- Bordes, A.; Usunier, N.; Garcia-Duran, A.; Weston, J.; Yakhnenko, O. Translating Embeddings for Modeling Multi-relational Data. In Proceedings of the 26th International Conference on Neural Information Processing Systems, Lake Tahoe, NV, USA, 5–10 December 2013; pp. 2787–2795. [Google Scholar]
- Wang, Z.; Zhang, J.; Feng, J.; Chen, Z. Knowledge graph embedding by translating on hyperplanes. In Proceedings of the AAAI Conference on Artificial Intelligence, Québec City, QC, Canada, 27–31 July 2014; pp. 1112–1119. [Google Scholar]
- Lin, Y.; Liu, Z.; Sun, M.; Liu, Y.; Zhu, X. Learning Entity and Relation Embeddings for Knowledge Graph Completion. In Proceedings of the AAAI Conference on Artificial Intelligence, Austin, TX, USA, 25–30 January 2015; pp. 2181–2187. [Google Scholar]
- Ji, G.; He, S.; Xu, L.; Liu, K.; Zhao, J. Knowledge Graph Embedding via Dynamic Mapping Matrix. In Proceedings of the Annual Meeting of the Association for Computational Linguistics, Beijing, China, 26–31 July 2015; pp. 687–696. [Google Scholar]
- Xie, R.; Liu, Z.; Lin, F.; Lin, L. Does William Shakespeare REALLY Write Hamlet? Knowledge Representation Learning With Confidence. In Proceedings of the AAAI Conference on Artificial Intelligence, New Orleans, LO, USA, 2–7 February 2018; pp. 4954–4961. [Google Scholar]
- Jia, S.; Xiang, Y.; Chen, X.; Wang, K. Triple Trustworthiness Measurement for Knowledge Graph. In Proceedings of the World Wide Web Conference, San Francisco, CA, USA, 13–17 May 2019; pp. 2865–2871. [Google Scholar]
- Chen, X.; Chen, M.; Shi, W.; Sun, Y.; Zaniolo, C. Embedding uncertain knowledge graphs. In Proceedings of the AAAI Conference on Artificial Intelligence, Honolulu, HI, USA, 27 January–1 February 2019; pp. 3363–3370. [Google Scholar]
- Yang, S.; Zhang, W.; Tang, R.; Zhang, M.; Huang, Z. Approximate inferring with confidence predicting based on uncertain knowledge graph embedding. Inf. Sci. 2022, 609, 679–690. [Google Scholar] [CrossRef]
- Hochreiter, S.; Schmidhuber, J.J.N.C. Long Short-Term Memory. Neural Comput. 1997, 9, 1735–1780. [Google Scholar] [CrossRef]
- Chen, M.; Tian, Y.; Yang, M.; Zaniolo, C. Multilingual knowledge graph embeddings for cross-lingual knowledge alignment. In Proceedings of the 26th International Joint Conference on Artificial Intelligence, Melbourne, Australia, 19–25 August 2017; pp. 1511–1517. [Google Scholar]
- Wang, Z.; Lv, Q.; Lan, X.; Zhang, Y. Cross-lingual Knowledge Graph Alignment via Graph Convolutional Networks. In Proceedings of the 2018 Conference on Empirical Methods in Natural Language Processing, Brussels, Belgium, 31 October–4 November 2018; pp. 349–357. [Google Scholar]
- Yang, H.-W.; Zou, Y.; Shi, P.; Lu, W.; Lin, J.; Sun, X. Aligning Cross-Lingual Entities with Multi-Aspect Information. In Proceedings of the 2019 Conference on Empirical Methods in Natural Language Processing and the 9th International Joint Conference on Natural Language Processing (EMNLP-IJCNLP), Hong Kong, China, 3–7 November 2019; pp. 4431–4441. [Google Scholar]
- Cai, W.; Wang, Y.; Mao, S.; Zhan, J.; Jiang, Y. Multi-heterogeneous neighborhood-aware for Knowledge Graphs alignment. Inf. Process. Manag. 2022, 59, 102790. [Google Scholar] [CrossRef]
- Zhao, Z.; Lin, S. A cross-linguistic entity alignment method based on graph convolutional neural network and graph attention network. Computing 2023, 105, 2293–2310. [Google Scholar] [CrossRef]
- Tam, N.T.; Trung, H.T.; Yin, H.; Van Vinh, T.; Sakong, D.; Zheng, B.; Hung, N.Q.V. Entity alignment for knowledge graphs with multi-order convolutional networks. IEEE Trans. Knowl. Data Eng. 2020, 34, 4201–4214. [Google Scholar] [CrossRef]
- Li, L.; Dong, J.; Qin, X. Dual-view graph neural network with gating mechanism for entity alignment. Appl. Intell. 2023, 53, 18189–18204. [Google Scholar] [CrossRef]
- Liu, F.; Chen, M.; Roth, D.; Collier, N. Visual pivoting for (unsupervised) entity alignment. In Proceedings of the AAAI Conference on Artificial Intelligence, Vitrtual, 2–9 February 2021; pp. 4257–4266. [Google Scholar]
- Guo, H.; Tang, J.; Zeng, W.; Zhao, X.; Liu, L. Multi-modal entity alignment in hyperbolic space. Neurocomputing 2021, 461, 598–607. [Google Scholar] [CrossRef]
- Chen, L.; Li, Z.; Wang, Y.; Xu, T.; Wang, Z.; Chen, E. MMEA: Entity alignment for multi-modal knowledge graph. In Proceedings of the Knowledge Science, Engineering and Management: 13th International Conference, KSEM 2020, Hangzhou, China, 28–30 August 2020; pp. 134–147. [Google Scholar]
- Cheng, B.; Zhu, J.; Guo, M. MultiJAF: Multi-modal joint entity alignment framework for multi-modal knowledge graph. Neurocomputing 2022, 500, 581–591. [Google Scholar] [CrossRef]
- Chen, Z.; Chen, J.; Zhang, W.; Guo, L.; Fang, Y.; Huang, Y.; Zhang, Y.; Geng, Y.; Pan, J.Z.; Song, W.; et al. MEAformer: Multi-modal Entity Alignment Transformer for Meta Modality Hybrid. In Proceedings of the 31st ACM International Conference on Multimedia, Ottawa, ON, Canada, 29 October–3 November 2023; pp. 3317–3327. [Google Scholar]
- Speer, R.; Chin, J.; Havasi, C. Conceptnet 5.5: An open multilingual graph of general knowledge. In Proceedings of the AAAI Conference on Artificial Intelligence, San Francisco, CA, USA, 4–9 February 2017; pp. 4444–4451. [Google Scholar]
- Liu, Y.; Li, H.; Garcia-Duran, A.; Niepert, M.; Onoro-Rubio, D.; Rosenblum, D.S. MMKG: Multi-Modal Knowledge Graphs. In Proceedings of the European Semantic Web Conference, Portorož, Slovenia, 2–6 June 2019; pp. 459–474. [Google Scholar]
- Hu, J.; Cheng, R.; Huang, Z.; Fang, Y.; Luo, S. On Embedding Uncertain Graphs. In Proceedings of the CIKM 2017, Singapore, 6–10 November 2017; pp. 157–166. [Google Scholar]
Figure 1.
Method overview. The dashed lines connect the equivalent entities in the two KGs.

Figure 2.
Framework of PTC.

Figure 3.
Example of the pairing rate.

Figure 4.
Example of the confidence adjacency matrix.

Figure 5.
Framework of Confidence-GCN-Align.

Figure 6.
An example of a confidence swapping strategy.

Figure 7.
The effect of gamma on Hits@k. (a–c) describe the effects of the gamma value on Hits 1, Hits 10, and Hits 50, respectively.
Figure 7.
The effect of gamma on Hits@k. (a–c) describe the effects of the gamma value on Hits 1, Hits 10, and Hits 50, respectively.


Table 1.
Examples of noise triples in DB15K. According to the information we have reviewed, it indicates that Alfred Hitchcock was born in the United Kingdom, not in Turkey, suggesting that the first triple may be incorrect. The errors in the remaining triples in the table are due to a mismatch between the relations and the tail entities.
| Head Entity | Relation | Tail Entity |
|---|---|---|
| Alfred_Hitchcock | birthPlace | Turkey |
| Agatha_Christie | birthPlace | Devonians |
| Anguilla | currency | Parliamentary_system |
| Anguilla | officialLanguage | Kingdom_of_England |
| Anguilla | language | Kingdom_of_England |
The triple prefix is ignored, leaving only the entity and the relation names.
Table 2.
Entity Alignment Methods.
| Methods | GCN | TransE | Confidence 1 |
|---|---|---|---|
| MTransE | - | √ | - |
| GCN-Align | √ | - | - |
| HMAN | √ | - | - |
| MHNA | √ | - | - |
| GRGCN | √ | ||
| EMGCN | √ | ||
| DvGNet | √ | ||
| EVA | √ | - | - |
| HMEA | - | √ | - |
| MMEA | - | √ | - |
| MultiJAF | √ | - | - |
1 Confidence refers to triple confidence. “√” means that the corresponding method is used.
Table 3.
Dynamic margin adjustment example.
| Triple | CP(h, r, t) | DM(h, r, t) |
|---|---|---|
| (/m/0sxg4, /film/film/genre, /m/04xvlr) | 0.8734 | gamma – 0.8734 |
| (/m/028_yv, /film/film/country, /m/03rjj) | 0.4897 | gamma – 0.4897 |
| (/m/01tv3x2, /music/artist/genre, /m/06rqw) | 0.9546 | gamma – 0.9546 |
| (/m/04h68j, /film/writer/film, /m/01g3gq) | 0.4947 | gamma – 0.4947 |
| (/m/02_1sj, /film/film/language, /m/02h40lc) | 0.8892 | gamma – 0.8892 |
Table 4.
Results on dataset FB15K.
| Model | Pre | Acc | F1 |
|---|---|---|---|
| MLP * | - | 0.833 | 0.861 |
| Bilinear * | - | 0.861 | 0.869 |
| TransE + | 0.835 | 0.868 | 0.874 |
| TransH + | 0.904 | 0.912 | 0.913 |
| TransD + | 0.904 | 0.913 | 0.914 |
| TransR + | 0.883 | 0.902 | 0.904 |
| PTransE + | 0.934 | 0.941 | 0.941 |
| KGTtm(TransE) * | - | 0.977 | 0.975 |
| KGTtm(PTransH) * | - | 0.978 | 0.979 |
| KGTtm(TransH) * | - | 0.981 | 0.982 |
| PTC | 0.989 | 0.994 | 0.994 |
Bold values indicate optimal quantities. “*” marks the results obtained from paper, while “+” marks the results of our re-experimentation.
Table 5.
Results on dataset CN15K.
| Model | MSE | MAE | Pre | Acc | F1 |
|---|---|---|---|---|---|
| URGE * [43] | 0.1032 | 0.2272 | - | - | - |
| UKGErect * | 0.0861 | 0.01990 | - | - | - |
| UKGElogi * | 0.0986 | 0.2074 | - | - | - |
| UKGsE * | 0.0771 | 0.2134 | - | - | - |
| PTC | 0.0479 | 0.1771 | 0.960 | 0.968 | 0.980 |
Bold values indicate optimal quantities. “*” marks the results obtained from paper.
Table 6.
Predicted triple confidence results in CN15K.
| Triple | True Value | Predicted Value |
|---|---|---|
| (925, 9, 963) | 0.8927087856574166 | 0.854725 |
| (9935, 3, 5404) | 0.8927087856574166 | 0.85451275 |
| (815, 3, 3843) | 0.8927087856574166 | 0.91402173 |
| (405, 0, 14502) | 0.24503988222454764 | 0.38096955 |
| (8334, 11, 3256) | 0.8832813822224633 | 0.9209904 |
| (2081, 0, 147) | 0.39421161184926345 | 0.38398254 |
| (6854, 0, 5606) | 0.26278592891031644 | 0.38352108 |
Table 7.
Results on dataset DBP15KZH-EN.
| Model | ZH-EN | EN-ZH | |||||
|---|---|---|---|---|---|---|---|
| Hits@1 | Hits@10 | Hits@50 | Hits@1 | Hits@10 | Hits@50 | ||
| GCN-Align * | SE | 38.42 | 70.34 | 81.24 | 34.43 | 65.68 | 77.03 |
| SE + AE | 41.25 | 74.38 | 86.23 | 36.49 | 69.94 | 82.45 | |
| GCN-Align + | SE | 38.97 | 69.98 | 79.98 | 36.93 | 67.34 | 77.72 |
| SE + AE | 42.27 | 74.5 | 85.06 | 39.63 | 71.48 | 82.96 | |
| Confidence-GCN-Align | SE | 41.66 | 73.23 | 83.21 | 38.14 | 69.36 | 80.00 |
| SE + AE | 45.51 | 78.00 | 88.66 | 41.42 | 74.09 | 85.37 | |
Bold values indicate optimal quantities. “*” marks the results obtained from paper [30], while “+” marks the results of our re-experimentation.
Table 8.
Results on dataset DBP15KJA-EN.
| Model | JA-EN | EN-JA | |||||
|---|---|---|---|---|---|---|---|
| Hits@1 | Hits@10 | Hits@50 | Hits@1 | Hits@10 | Hits@50 | ||
| GCN-Align * | SE | 38.21 | 72.49 | 82.69 | 36.90 | 68.50 | 79.52 |
| SE + AE | 39.91 | 74.46 | 86.10 | 38.42 | 71.81 | 83.72 | |
| GCN-Align + | SE | 40.12 | 73.16 | 82.5 | 37.99 | 68.95 | 78.95 |
| SE + AE | 42.46 | 76.08 | 86.81 | 39.96 | 72.63 | 84.06 | |
| Confidence-GCN-Align | SE | 41.90 | 75.4 | 84.77 | 39.67 | 71.73 | 81.80 |
| SE + AE | 44.80 | 79.17 | 89.39 | 42.60 | 76.13 | 87.53 | |
Bold values indicate optimal quantities. “*” marks the results obtained from paper [30], while “+” marks the results of our re-experimentation.
Table 9.
Results on dataset DBP15KFR-EN.
| Model | FR-EN | EN-FR | |||||
|---|---|---|---|---|---|---|---|
| Hits@1 | Hits@10 | Hits@50 | Hits@1 | Hits@10 | Hits@50 | ||
| GCN-Align * | SE | 36.51 | 73.42 | 85.93 | 36.08 | 72.37 | 85.44 |
| SE + AE | 37.29 | 74.49 | 86.73 | 36.77 | 73.06 | 86.39 | |
| GCN-Align + | SE | 40.04 | 75.73 | 86.03 | 38.54 | 72.99 | 84.37 |
| SE + AE | 41.34 | 77.72 | 88.16 | 39.78 | 75.07 | 86.95 | |
| Confidence-GCN-Align | SE | 42.04 | 78.25 | 88.78 | 40.89 | 77.01 | 88.05 |
| SE + AE | 44.25 | 80.79 | 91.19 | 42.98 | 79.32 | 90.56 | |
Bold values indicate optimal quantities. “*” marks the results obtained from paper [30], while “+” marks the results of our re-experimentation.
Table 10.
DM strategy.
| Margin | Hits@1 | Hits@10 | Hits@50 | MR | MRR |
|---|---|---|---|---|---|
| 18.183 | 31.317 | 37.811 | 627.437 | 0.247957 | |
| 0.133 | 0.4 | 0.667 | 3364.582 | 0.004295 | |
| 23.332 | 42.794 | 51.624 | 153.007 | 0.328348 | |
| 27.68 | 45.307 | 53.57 | 298.893 | 0.363127 | |
| 28.058 | 46.575 | 55.194 | 237.045 | 0.371267 |
Bold values indicate optimal quantities.
Table 11.
Results of MMEA and Confidence-MMEA on FB15K-DB15K.
| FB15K-DB15K | Train | Hits@1 | Hits@5 | Hits@10 | MR | MRR |
|---|---|---|---|---|---|---|
| MMEA | 20% | 26.042 | 44.946 | 53.175 | 143.465 | 0.353472 |
| 50% | 40.697 | 60.101 | 67.711 | 60.654 | 0.500465 | |
| 80% | 60. | 79.611 | 85.603 | 13.658 | 0.688278 | |
| Confidence-MMEA | 20% | 28.081 | 47.831 | 56.383 | 191.551 | 0.376452 |
| 50% | 49.805 | 69.599 | 76.372 | 67.723 | 0.589590 | |
| 80% | 68.716 | 85.37 | 89.494 | 15.492 | 0.764087 |
Bold values indicate optimal quantities.
Table 12.
Results of MMEA and Confidence-MMEA on FB15K-YAGO15K.
| FB15K-YAGO15K | Train | Hits@1 | Hits@5 | Hits@10 | MR | MRR |
|---|---|---|---|---|---|---|
| MMEA | 20% | 23.906 | 40.362 | 49.024 | 145.942 | 0.322338 |
| 50% | 39.942 | 57.178 | 65.461 | 61.571 | 0.483185 | |
| 80% | 57.557 | 76.994 | 83.914 | 11.790 | 0.665495 | |
| Confidence-MMEA | 20% | 26.075 | 42.289 | 50.325 | 217.411 | 0.342644 |
| 50% | 48.538 | 67.292 | 73.833 | 69.307 | 0.572726 | |
| 80% | 67.203 | 82.574 | 87.131 | 13.954 | 0.745418 |
Bold values indicate optimal quantities.
Disclaimer/Publisher’s Note: The statements, opinions and data contained in all publications are solely those of the individual author(s) and contributor(s) and not of MDPI and/or the editor(s). MDPI and/or the editor(s) disclaim responsibility for any injury to people or property resulting from any ideas, methods, instructions or products referred to in the content. |
© 2024 by the authors. Licensee MDPI, Basel, Switzerland. This article is an open access article distributed under the terms and conditions of the Creative Commons Attribution (CC BY) license (https://creativecommons.org/licenses/by/4.0/).
Share and Cite
MDPI and ACS Style
Zhang, X.; Chen, T.; Wang, H. A Novel Method for Boosting Knowledge Representation Learning in Entity Alignment through Triple Confidence. Mathematics 2024, 12, 1214. https://doi.org/10.3390/math12081214
AMA Style
Zhang X, Chen T, Wang H. A Novel Method for Boosting Knowledge Representation Learning in Entity Alignment through Triple Confidence. Mathematics. 2024; 12(8):1214. https://doi.org/10.3390/math12081214
Chicago/Turabian StyleZhang, Xiaoming, Tongqing Chen, and Huiyong Wang. 2024. "A Novel Method for Boosting Knowledge Representation Learning in Entity Alignment through Triple Confidence" Mathematics 12, no. 8: 1214. https://doi.org/10.3390/math12081214
Note that from the first issue of 2016, this journal uses article numbers instead of page numbers. See further details here.