
Enhancing Surveillance Vision with Multi-Layer Deep Learning Representation

School of Electronic and Electrical Engineering, Kyungpook National University, 80 Daehak-ro, Buk-gu, Daegu 41566, Republic of Korea
*
Author to whom correspondence should be addressed.
Mathematics 2024, 12(9), 1313; https://doi.org/10.3390/math12091313
Submission received: 5 April 2024
/
Revised: 17 April 2024
/
Accepted: 24 April 2024
/
Published: 25 April 2024
(This article belongs to the Special Issue New Advances and Applications in Image Processing and Computer Vision)
Abstract
:This paper aimed to develop a method for generating sand–dust removal and dehazed images utilizing CycleGAN, facilitating object identification on roads under adverse weather conditions such as heavy dust or haze, which severely impair visibility. Initially, the study addressed the scarcity of paired image sets for training by employing unpaired CycleGAN training. The CycleGAN training module incorporates hierarchical single-scale Retinex (SSR) images with varying sigma sizes, facilitating multiple-scaled trainings. Refining the training data into detailed hierarchical layers for virtual paired training enhances the performance of CycleGAN training. Conventional sand–dust removal or dehazing algorithms, alongside deep learning methods, encounter challenges in simultaneously addressing sand–dust removal and dehazing with a singular algorithm. Such algorithms often necessitate resetting hyperparameters to process images from both scenarios. To overcome this limitation, we proposed a unified approach for removing sand–dust and haze phenomena using a single model, leveraging images processed hierarchically with SSR. The image quality and image sharpness metrics of the proposed method were BRIQUE, PIQE, CEIQ, MCMA, LPC-SI, and S3. In sand–dust environments, the proposed method achieved the highest scores, with an average of 21.52 in BRISQUE, 0.724 in MCMA, and 0.968 in LPC-SI compared to conventional methods. For haze images, the proposed method outperformed conventional methods with an average of 3.458 in CEIQ, 0.967 in LPC-SI, and 0.243 in S3. The images generated via this proposed method demonstrated superior performance in image quality and sharpness evaluation compared to conventional algorithms. The outcomes of this study hold particular relevance for camera images utilized in automobiles, especially in the context of self-driving cars or CCTV surveillance systems.
1. Introduction
This study aimed to develop technology leveraging onboard cameras to offer drivers an intuitive view and to detect objects through image processing, particularly in scenarios with limited visibility due to adverse weather conditions. Numerous conventional algorithms and deep learning methods have been developed to transform adverse weather images, such as those from sandstorms or haze, into clearer versions. While previous research primarily focused on eliminating the yellowish tint associated with sandstorm phenomena, this method addresses haze removal, constituting the primary background information, and enhances object details to improve visibility. This study aimed to develop deep learning modules to restore images affected by fog or sandstorms to their original state. These proposed modules are also designed to operate effectively in sandstorms and foggy conditions.
The goal of both conventional and the proposed methods is to improve the quality of images by eliminating background elements, such as water droplets, fog, or dust, which hinder object recognition. For instance, in one raindrop-removal image translation algorithm, a U-Net-based deep learning module with a target mask was employed [1]. The U-Net architecture forms the foundation of this algorithm, incorporating two attention modules. The first attention module is the target mask module, while the other is the residual convolution block module. These two attention modules were tasked with identifying the positions of water droplets and restoring them to the original shapes of objects. However, while this module effectively eliminates primary background information, such as water droplets, it encounters difficulty in removing fine particles like haze, leading to inadequate removal of sand in sand–dust images.
In the rank-one prior real-time scene recovery (ROP) research, an algorithmic image restoration method was proposed to restore images to their original state under underwater, sand, or haze environments [2,3]. The primary concept behind ROP is to specify environmental conditions by analyzing the scattering map and considering the intensity projection strategy. A key advantage of this research lies in its universal applicability, diversity, and adaptability, enabling effective image restoration across various conditions, including underwater, sand, and haze environments. ROP theory asserts the capability of real-time recovery algorithms to facilitate real-time operation in surveillance cameras or autonomous vehicles. To achieve this objective, ROP addresses diverse conditions of degraded image quality. However, the internal implementation of ROP requires the application of different hyperparameters for each environment, resulting in the inconvenience of adjusting hyperparameters whenever the environment changes, potentially necessitating image generation.
The contrast-limited adaptive histogram equalization (CLAHE) method based on normalized gamma transformation [4] comprises the following two components: contrast enhancement and image color correction. In the contrast enhancement phase, CLAHE enhances the contrast of uneven images using the L channel of the image with proposed gamma correction and histogram equalization. In the color correction phase, color compensation is applied to the a and b color channels using the gray-world-based color correction method. This approach enables the enhancement of object details and natural color representation, resulting in an appearance resembling the removal of sand–dust phenomena. While the characteristic yellowish tint of sand–dust is partially mitigated, challenges with color constancy of objects emerge. Additionally, dehazing effectiveness is relatively limited compared to other algorithms, leading to difficulties in effectively revealing object details.
Another study on sand–dust removal algorithms presents a chromatic variance consistency and gamma correction-based dehazing (chromatic-gamma model) for sand–dust image enhancement [5]. This algorithm proposes an effective color correction method that preserves the consistency of chromatic variations and maintains the alignment of chromatic means. Next, to enhance the color-corrected sand–dust images, this method estimates a transmission map for haze removal using gamma correction. Finally, to reduce red artifacts in the enhanced images, a cross-correlation-based chromatic histogram shift algorithm is proposed. This method is good at removing dust and haze, but the local contrast is still worse. Therefore, it is hard to recognize the object on the road in the resulting images.
DehazeNet is a CNN-based deep learning algorithm method designed for dehazing as a trainable end-to-end system, mainly focusing on medium transmission estimation [6]. The core idea of DehazeNet revolves around estimating the medium transmission map from haze images. To improve the accuracy of this estimation, it employs the bilateral rectified linear unit (BReLU) as an activation function within the deep learning network, claiming that it enhances the restoration and quality of haze-free images. While this approach effectively removes haze from images, it encounters challenges in scenarios with dense fog, where the dehazing effect is minimal. Additionally, the dehazed images and the enhancement of object detail information were insufficient, leading to difficulties in object identification.
Grid-dehazeNet is a deep learning model that designs haze removal modules through proposed preprocessing, a backbone network, and postprocessing [7]. Specifically, the backbone network employs a grid network with multi-scale estimation to mitigate the bottleneck phenomenon inherent in multiple-scale approaches. The images produced by Grid-dehazeNet demonstrate superior fog removal capabilities compared to DehazeNet. However, the outcomes of Grid-dehazeNet are characterized by low contrast, resulting in a scenario where objects such as car license plates, signs, and other roadside objects are not distinctly visible.
The multi-scale boosted dehazing network with dense feature fusion (MSBDN-DFF) is based on the U-Net architecture and incorporates dense feature fusion [8]. MSBDN-DFF is formulated on the strengthen-operate-subtract boosting strategy and error feedback. The strengthen-operate-subtract boosting strategy was devised to restore haze-free images in the decoder part effectively. A dense feature fusion module was designed using a back-projection feed scheme to address the challenge of preserving spatial domain information in the U-Net architecture. However, similar to previous deep learning-based dehazing models, this method also suffers from the limitation of not substantially enhancing local contrast, posing challenges in object identification.
The color attenuation prior is an algorithm-based dehazing method that introduces a color attenuation prior [9]. By leveraging the depth map of the haze image, it is possible to derive an atmospheric scattering model and restore radiance accordingly. This facilitates effective haze removal from a single image. Although the results of color attenuation prior demonstrate the advantage of effectively restoring object colors, it still faces challenges related to low local contrast, as noted in previous dehazing research.
The single-image haze removal using dark channels prior proposes utilizing the dark channel prior technique for haze removal [10]. The dark channel prior approach adopts a statistical approach to haze-free images, identifying pixels with low intensities in at least one color channel within local patches and leveraging these statistics in the dehazing process. It is claimed that this model enables the measurement of haze thickness and the restoration of haze-free images. However, drawbacks of the resulting images from the dark channel prior algorithm include issues with objects’ color consistency, halo artifacts’ occurrence, and persistently low local contrast.
Another algorithm-based dehazing method is the feature fusion attention network (FFA-Net) [11]. When considering the significant variance in weighting information among different channel-wise features and the uneven distribution of haze across image pixels, a novel feature attention (FA) module was introduced, which integrates channel attention and pixel attention mechanisms. Additionally, it utilizes multiple local residual connections to bypass less important information such as thin haze regions or low-frequency components. Finally, an attention-based feature fusion (FFA) structure was proposed, wherein feature weights are dynamically learned from the feature attention (FA) module, assigning greater weight to crucial features. However, the resulting images have halo problems and low local contrast.
In the proposed method, CycleGAN-based training used Retinex-based images as training data to effectively identify objects on the road under haze or sand–dust conditions. Conventional approaches in previous studies have predominantly focused on dehazing or sand–dust removal, facilitating the elimination of background components. However, while these methods effectively eliminate background elements such as haze or sand–dust, they do not enhance object details in the image as they remain obscured by the background components. In this study, single-scale Retinex (SSR) images processed hierarchically using the Retinex algorithm were generated and utilized as training data. The detailed information of Retinex images corresponding to each layer’s sigma value was appropriately extracted and utilized to enhance local contrast and detail components. Furthermore, the Retinex algorithm is commonly used to separate illumination and reflection components, enhancing color constancy and correcting colors [12]. Therefore, while lighting background components such as sand–dust and haze are removed to a certain level, object color distortion is minimized and preserved. An image-to-image translation deep learning model is adopted to transform sand–dust or fog images into clean images. Representative image-to-image translation deep learning models include generative adversarial network (GAN)-based algorithms such as Pix2pix and CycleGAN. Pix2pix trains on paired datasets and aims to generate images similar to the target originals by minimizing the pixel differences between the generated and real images [13]. CycleGAN improves upon the limitations of paired datasets required by Pix2pix by training on unpaired datasets and adding cycle consistency loss. This addresses the mode collapse issue encountered in Pix2pix or traditional GAN image translation modules to some extent [14]. Additionally, identity loss is employed to encourage the generated images to mimic the colors of the real images more accurately, ensuring that the generated images closely resemble those of the real images. The proposed approach utilized the CycleGAN-based image-to-image translation deep learning algorithm to train the transformation of sand–dust or haze images into clean images. CycleGAN aims to generate clean images using the trained result module. By employing unpaired CycleGAN, synthetic sand–dust images were generated. These synthetic sand–dust images, in combination with real clean images, underwent hierarchical processing using SSR to construct the training dataset. The constructed training dataset was organized into pairs, and pair-mode CycleGAN training ensued. Consequently, sharper and cleaner images were produced compared to the original unpaired CycleGAN. Thus, the proposed method facilitates the generation of images that enable improved identification of hard-to-discern objects such as traffic lights, signs, cars, or pedestrians in hazy or foggy conditions. In contrast to conventional methods, this proposed research demonstrates enhancements in object detail components while showcasing the efficacy of sand–dust and haze removal.
The summarized contributions of the proposed method are as follows:
- ₋
- The proposed method addressed the inadequacy of unpaired dataset learning in CycleGAN by training on paired datasets of sand–dust and clean images.
- ₋
- To enhance the representation of object details during image transformation, the SSR algorithm was adopted. Four-scale hierarchical SSR processing was applied to construct each pair dataset.
- ₋
- The results from each module were separated into base and detail components. The smaller sigma-scale module captured overall image information, while the remaining three modules with larger sigma scales acquired image detail information. The base and detail components were then combined. Color information from the sigma 1 scale was utilized to generate the final clean image transformation.
2. Materials and Methods
2.1. Single-Scale Retinex Processing for Preparing Train Dataset
During the sand–dust and dehaze removal training process, preprocessing the training data was a necessary initial step. The Retinex algorithm operates on the fundamental principle that light brightness results from multiplying the illumination and reflection components. Its primary objective was to separate these components to mitigate the impact of ambient illumination on image brightness while retaining the original color information. The illumination component signifies the portion of an image influenced by ambient or primary light sources, while the reflection component embodies overall brightness and contrast influenced by external illumination. Estimating the illumination component, also termed the background component, is accomplished through filters of varying sizes within the Retinex algorithm. Meanwhile, the reflection component, derived from the image’s color information and contrast, holds critical significance in portraying object characteristics. The principal aim was to diminish the influence of the illumination component while enhancing the reflection component to compress the image’s dynamic range and bolster contrast. The equation representing the Retinex algorithm typically takes the form shown in Equation (1).
where represents the SSR output image denoting the reflection component, represents the input image, and signifies a Gaussian filter utilized for estimating the illumination component. Hence, denotes the blurred illumination component image processed through a Gaussian low-pass filter. Drawing from Weber’s law, which asserts a logarithmic relationship between perceived brightness and image intensity, the image undergoes a logarithmic scale transformation before separating the reflection and illumination components.
In this investigation, SSR underwent processing within the frequency domain, employing Gaussian filters with sigma sizes of 0.1, 1, 10, and 40. Unlike the impact of sigma values in the spatial domain, smaller sigma values in the frequency domain led to increased blurring. The SSR processing algorithm is depicted in Figure 1. Within Figure 1, the SSR images, depicted as reflection components, showcase the elimination of the orange component attributable to sand–dust, resembling images where sand–dust has been removed.
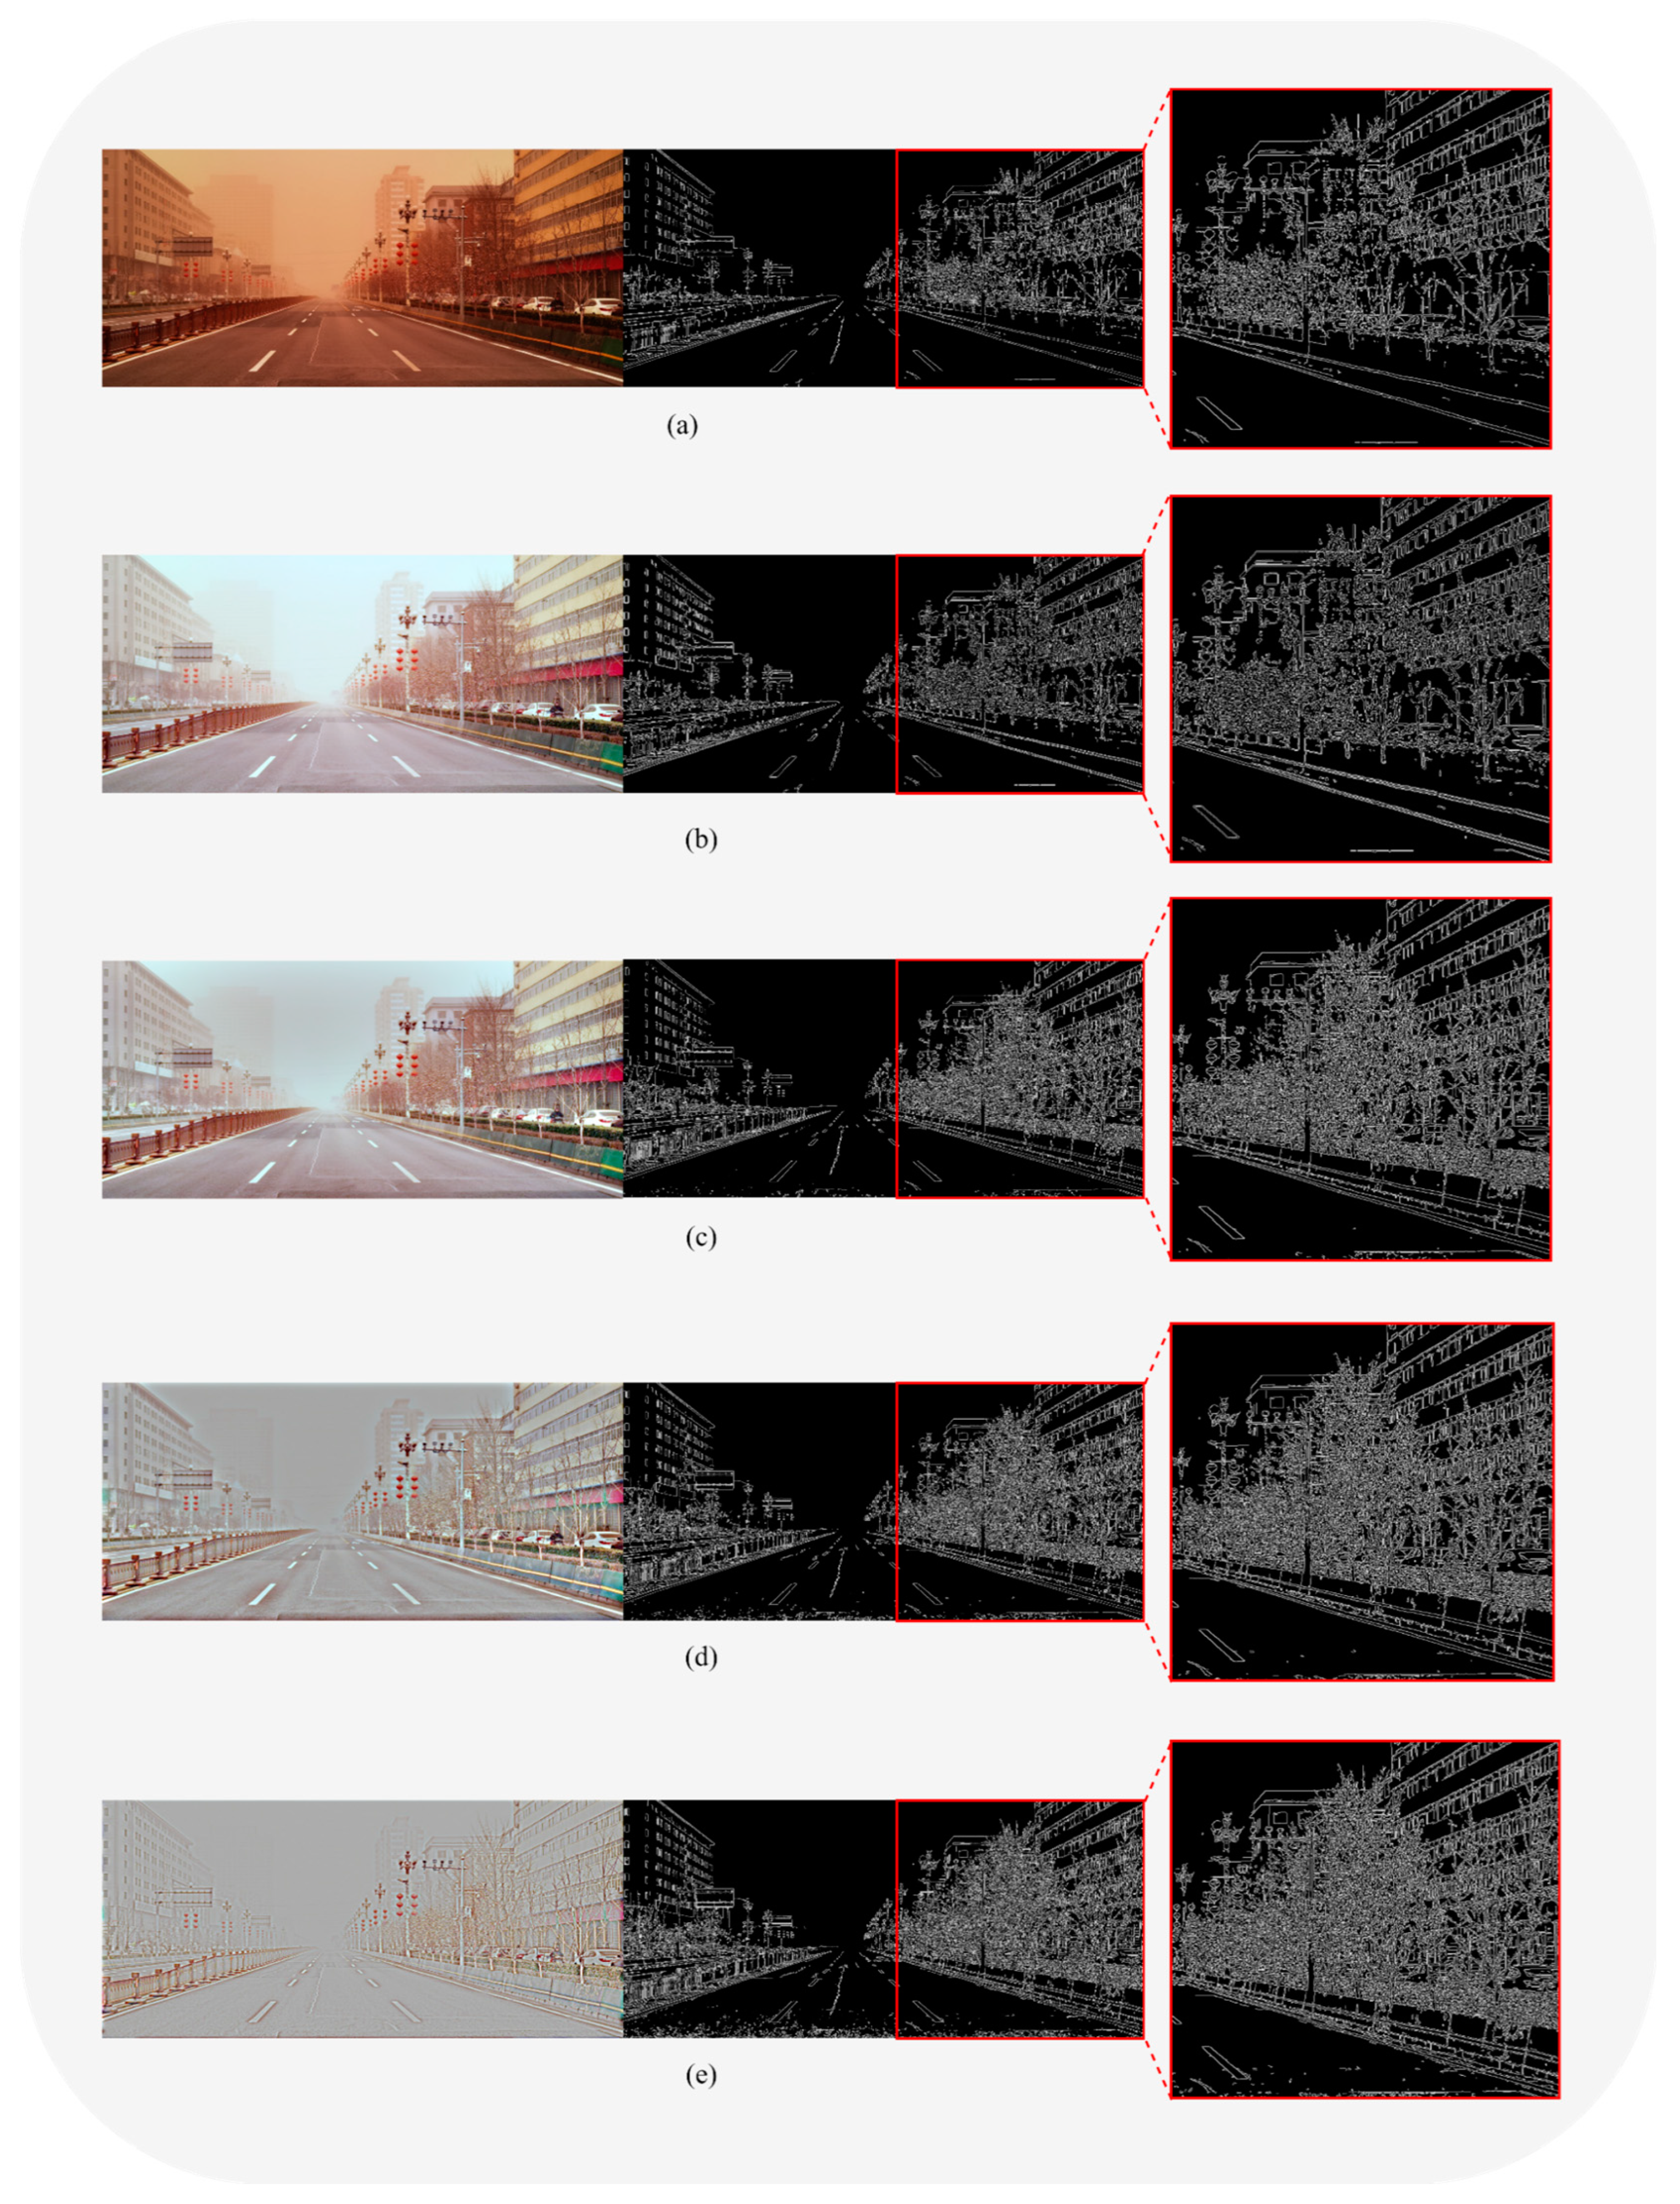
This study employed SSR preprocessing on the training data images to eliminate sand–dust and haze. The rationale behind creating training data for each sigma size lay in the variation of characteristics among sigma images depending on the sigma value. Each sigma image was utilized to retain its specific characteristics during training, aiming to enhance the quality of the resultant images. Figure 2 compares the original image, and the SSR multi-layer processed images, revealing that larger sigma values led to an augmentation in detail components. Conversely, larger sigma values tended to desaturate the image’s overall color, imparting a more grayscale appearance. Hence, the proposed method utilized SSR layered training data to leverage these image characteristics dictated by sigma values. This approach maximized the effects of dehazing and color restoration while enhancing the details of objects in sand–dust and haze images.
2.2. Paired Dataset Training Using CycleGAN
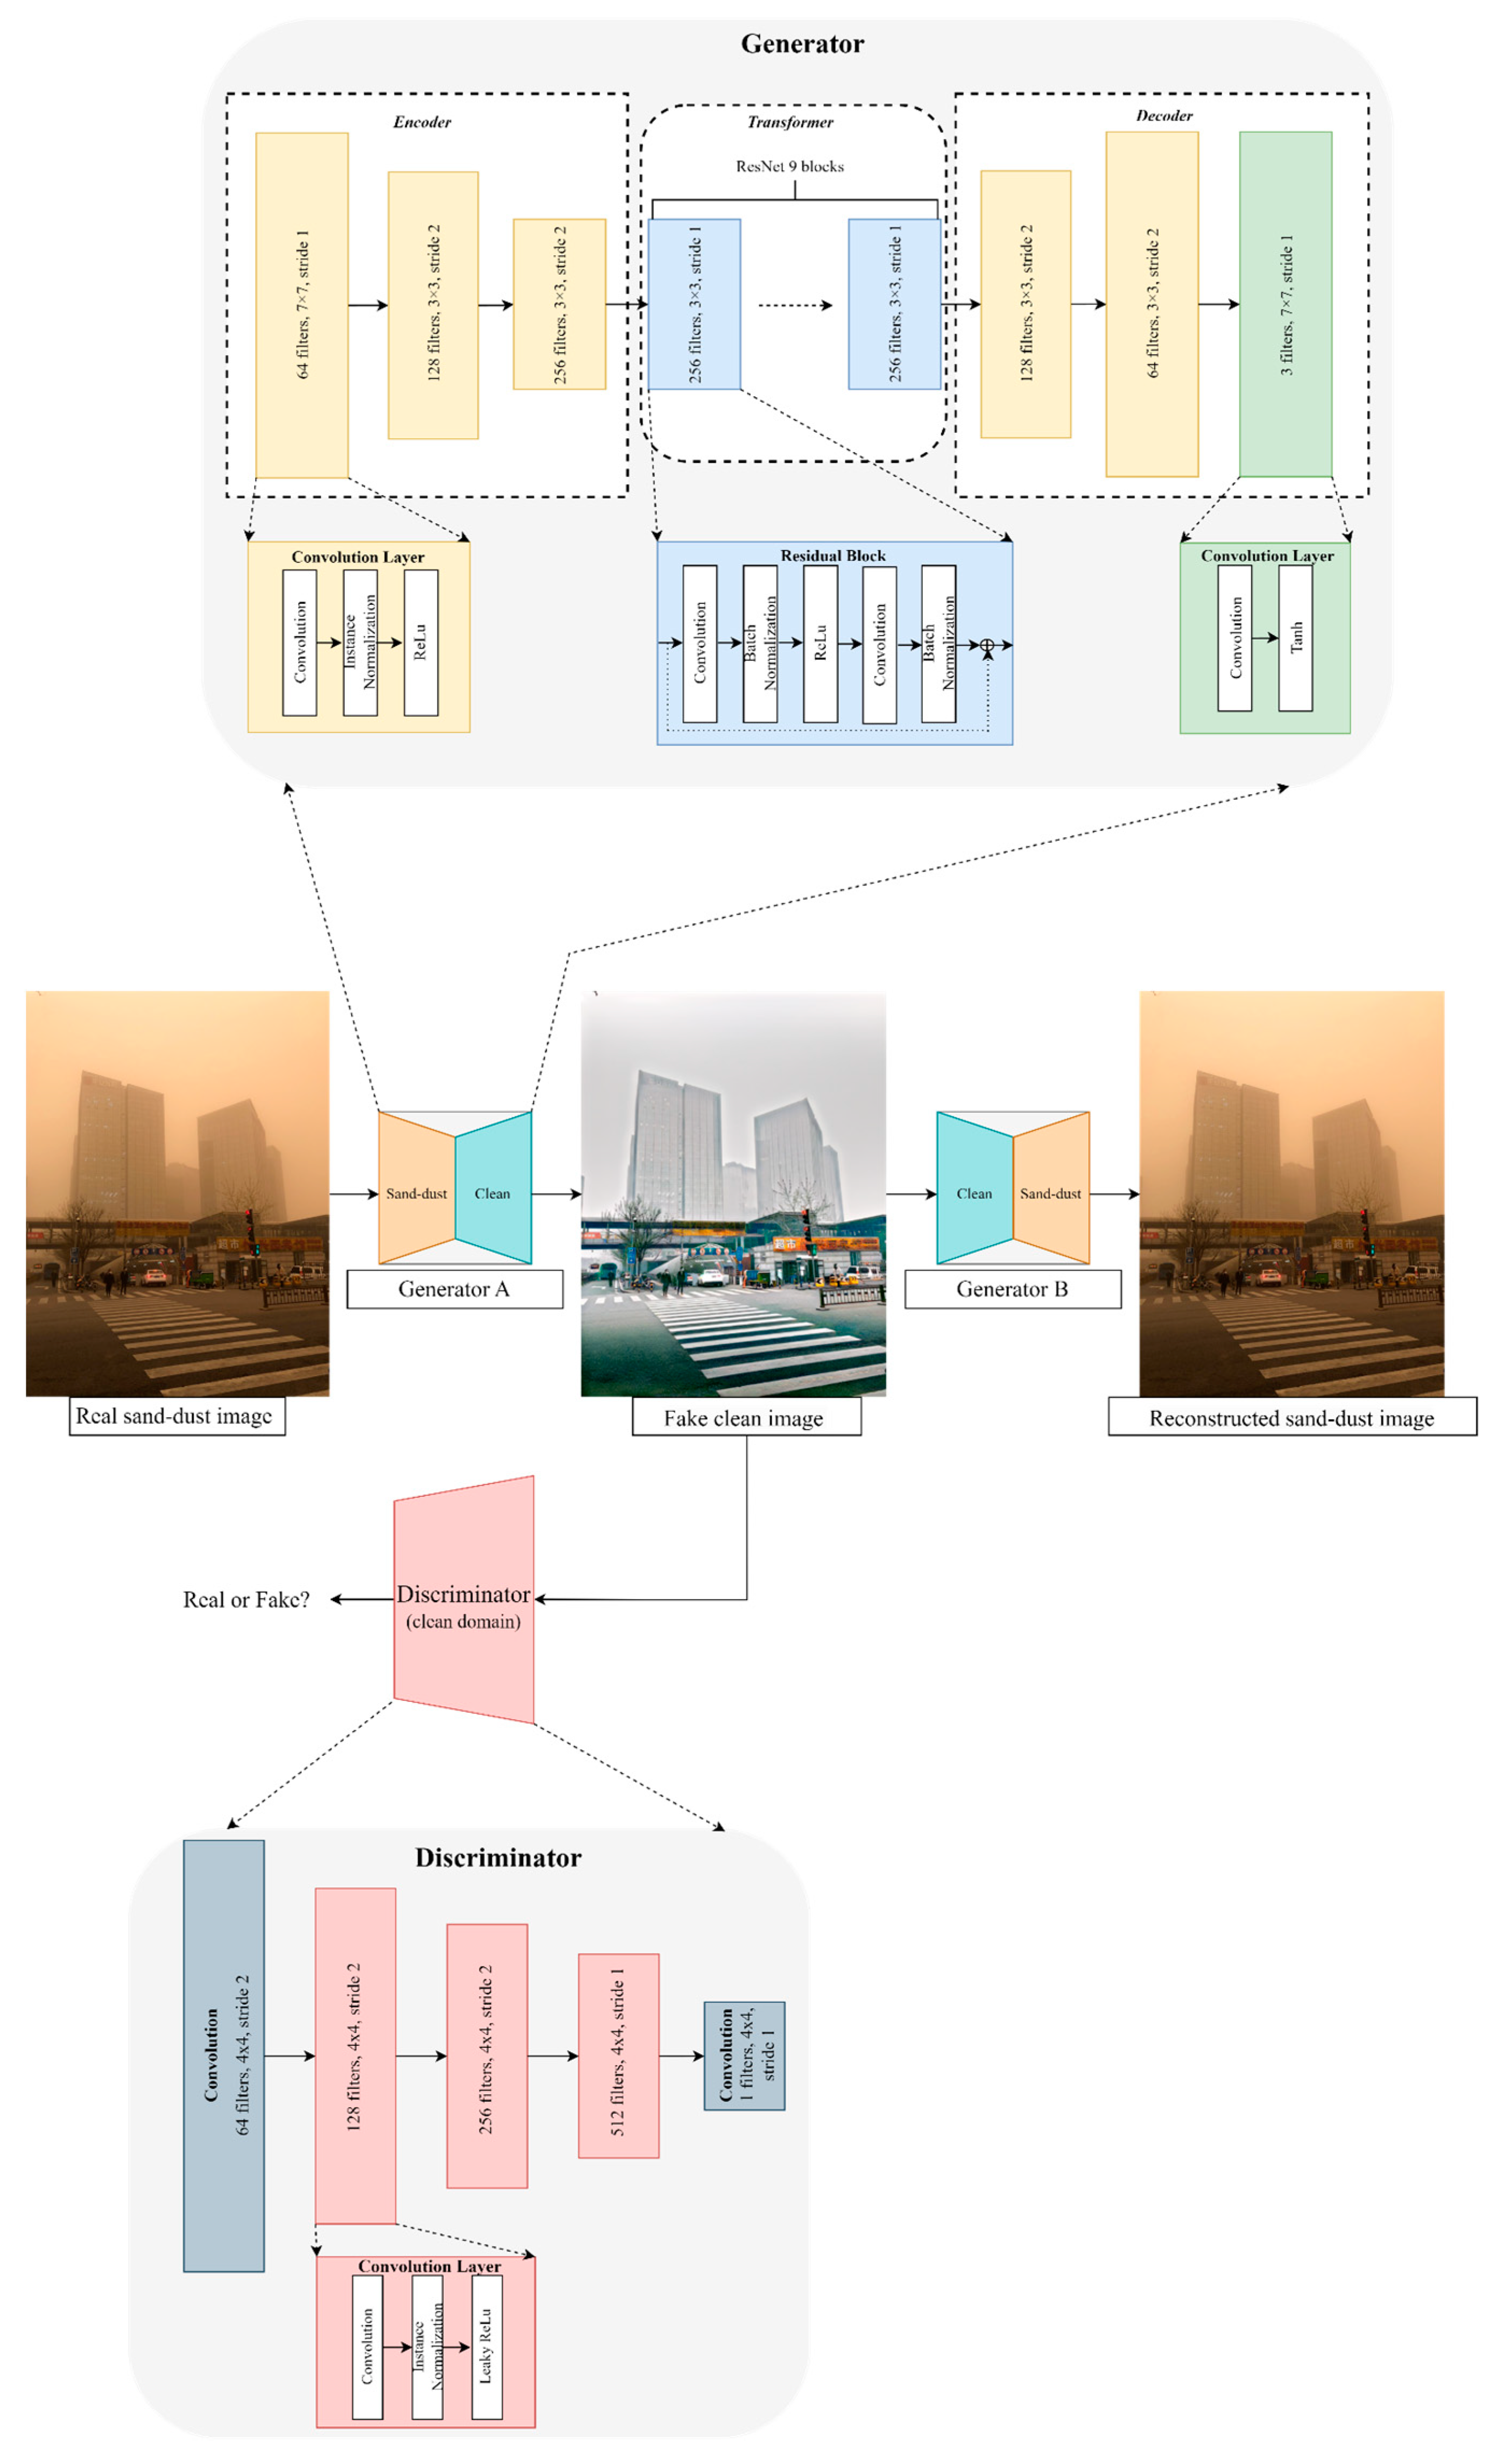
The CycleGAN for the purpose of image enhancement can be broadly categorized into three main points. First, CycleGAN excels in robustness to domain shifts, making it suitable for image transformations where significant variations in style or luminance may occur. Therefore, any sand–dust or haze images can be translated to clean images. Second, CycleGAN tends to preserve the content style during image transformations, which is useful for tasks where meaningful content needs to be retained while altering the appearance. In this study, maintaining the situation on the road while removing sand–dust or haze required preserving the meaningful content of objects, making CycleGAN advantageous. Last, CycleGAN provides flexibility and adaptability for various image transformation tasks. Therefore, the sand–dust removal method was developed using the SSR processing method within the CycleGAN framework. And it was observed that sand–dust and haze removal can be simultaneously achieved within the same module. Thus, CycleGAN, a notable image-to-image translation method, was employed to convert sand–dust or dehaze images into clean images in this study. This CycleGAN network architecture is shown in Figure 3. It comprises two generators and two discriminators, forming a network that trains while transitioning between two domains. The generator produces transformed images (synthetic images), while the discriminator distinguishes between generated and real images.
The generator of CycleGAN consists of the following three components: encoder, transformer (comprising residual blocks), and decoder. The generator employed in CycleGAN utilizes a ResNet architecture, characterized by its deep network depth and the incorporation of skip connections. This design enables the generator to better preserve detailed features in data images. The encoder compresses the input image into a low-dimensional feature space, extracting features using convolution, instance normalization, and ReLU activation function. The transformer component integrates nine residual blocks inspired by ResNet architecture, contributing to the model’s ability to effectively learn and transform image representations. The transformer is a crucial structure that helps preserve the features of the input image while performing transformations. To address the difficulty of optimization with deep learning, it employs a residual block structure, resolving the gradient vanishing problem and aiding in learning. The residual block consists of convolution, batch normalization, ReLU activation function, convolution, and batch normalization, adding the initial features to the final structure that passes through. The decoder takes the features from the transformer and generates the transformed image. Its structure includes transposed convolution, instance normalization, and ReLU activation function, producing the final output. The detailed structure is illustrated in Figure 3.
On the other hand, the discriminator of CycleGAN employs PatchGAN, with the final output being the averaging of all values of the final feature map passed through the network. Typically, the patch size in CycleGAN is approximately 70 70 to enable the application of the path-level discriminator structure to produce images of various sizes with fewer parameters. The discriminator is designed to discern each patch of the input image. Instead of classifying the entire image at once, it independently classifies small portions of the image for more accurate discrimination. The discriminator consists of convolution, instance normalization, and leaky ReLU. It is designed to perform binary classification (real or fake) for each patch of the image. This discriminator distinguishes between real and synthetic images based on the values of this feature map. The detailed structure of the discriminator is shown in Figure 3.
Finally, the least squares generative adversarial networks (LSGAN) loss utilizes the least squares loss for both the generator and discriminator, encouraging the generator to produce more accurate and realistic outputs [15]. In conventional GANs, the generator minimizes a binary cross-entropy loss, which can result in problems such as mode collapse during training. Therefore, in CycleGAN, it adopts the LSGAN loss to mitigate these issues by defining the loss to minimize the discrepancy between real and fake images, rather than evaluating the distance between the generator and discriminator. This approach aims to minimize the difference between the generated outputs and real data, thereby enhancing the quality of generated images and improving stability.
A distinctive feature of CycleGAN compared to other GANs is incorporating cycle consistency loss. Cycle consistency loss is a difference between the real image and the reconstructed image. Cycle consistency loss aims to minimize the disparity between the original image and the image obtained after conducting forward and backward transformations between two domains, as depicted in Equation (2).
where represents the cycle consistency loss, and denotes the expectation over the samples drawn from the data distribution , i.e., the expectation over the original images in domain . represents the norm between the image and the image obtained by transforming into domain using generator , a, then back to domain using generator . signifies the expected value of the original image in domain from the data distribution . represents the norm between the inverse transformation in domain and the actual image, unlike in domain . In this manner, minimizing the difference between the transformed images and the original images ensured consistent results. One of the features of CycleGAN is that some parts of the original image should be preserved even after transformation. Therefore, to maintain certain portions of the input image in the generated synthetic image, an identity loss function was defined for the generator. This loss function is represented as Equation (3).
where represents the identity loss, denotes the expected value of the original image in domain , and is the expected value of the original image in domain . Here, signifies the generator, responsible for transforming from domain to domain , as explained earlier, and is the generator for transforming from domain to domain . Therefore, represents how much the generated image in domain differs from the original image when fed into the generator responsible for generating in domain , and denotes how much the generated image in domain differs from the original image when fed into the generator responsible for generating in domain . For example, if there is a generator responsible for transforming the sand–dust image into the clean image, represents the transformed clean synthetic image when a clean image is inputted, and it calculates how much this transformed clean synthetic image differs from the actual clean image . Due to this characteristic of identity loss, images generated by CycleGAN can produce outputs with colors more similar to real images.
However, a limitation of CycleGAN is its susceptibility to improperly generate images if the distribution of the training dataset is unstable. For instance, during image translation training with CycleGAN to convert horses into zebras, if an input image depicts a person riding on a horse, the training module may generate a zebra and spot the person exhibiting undesired behavior. The occurrence of image translation in unintended areas, such as generating spots on the person riding the horse, stems from insufficient training data on people riding on horses. Consequently, utilizing unpaired CycleGAN in its conventional form may lead to unintended transformations. Hence, this study employed the virtual paired training method using CycleGAN. The proposed method employed unpaired CycleGAN to construct paired training datasets to generate synthetic sand–dust images, which were then paired with clean real images to form the dataset. Training paired CycleGAN was anticipated to yield a more stable training data distribution than unpaired CycleGAN. Figure 4 compares the results of transforming dust storm images into clean images using the conventional unpaired CycleGAN approach and the proposed method of paired CycleGAN. This comparison highlights the advantages of the proposed approach.
In Figure 4, the outcome of the unpaired CycleGAN in (b) failed to adequately restore the shape of buildings from the original image (a). Conversely, the outcome in (c) from the paired CycleGAN nearly restored the shapes of objects from the original image, albeit with a remaining phenomenon where the haze was not entirely removed. Consequently, the proposed method employed SSR hierarchical learning to enhance the details of objects and improve local contrast while removing dust and haze from the images.
2.3. Proposed Method
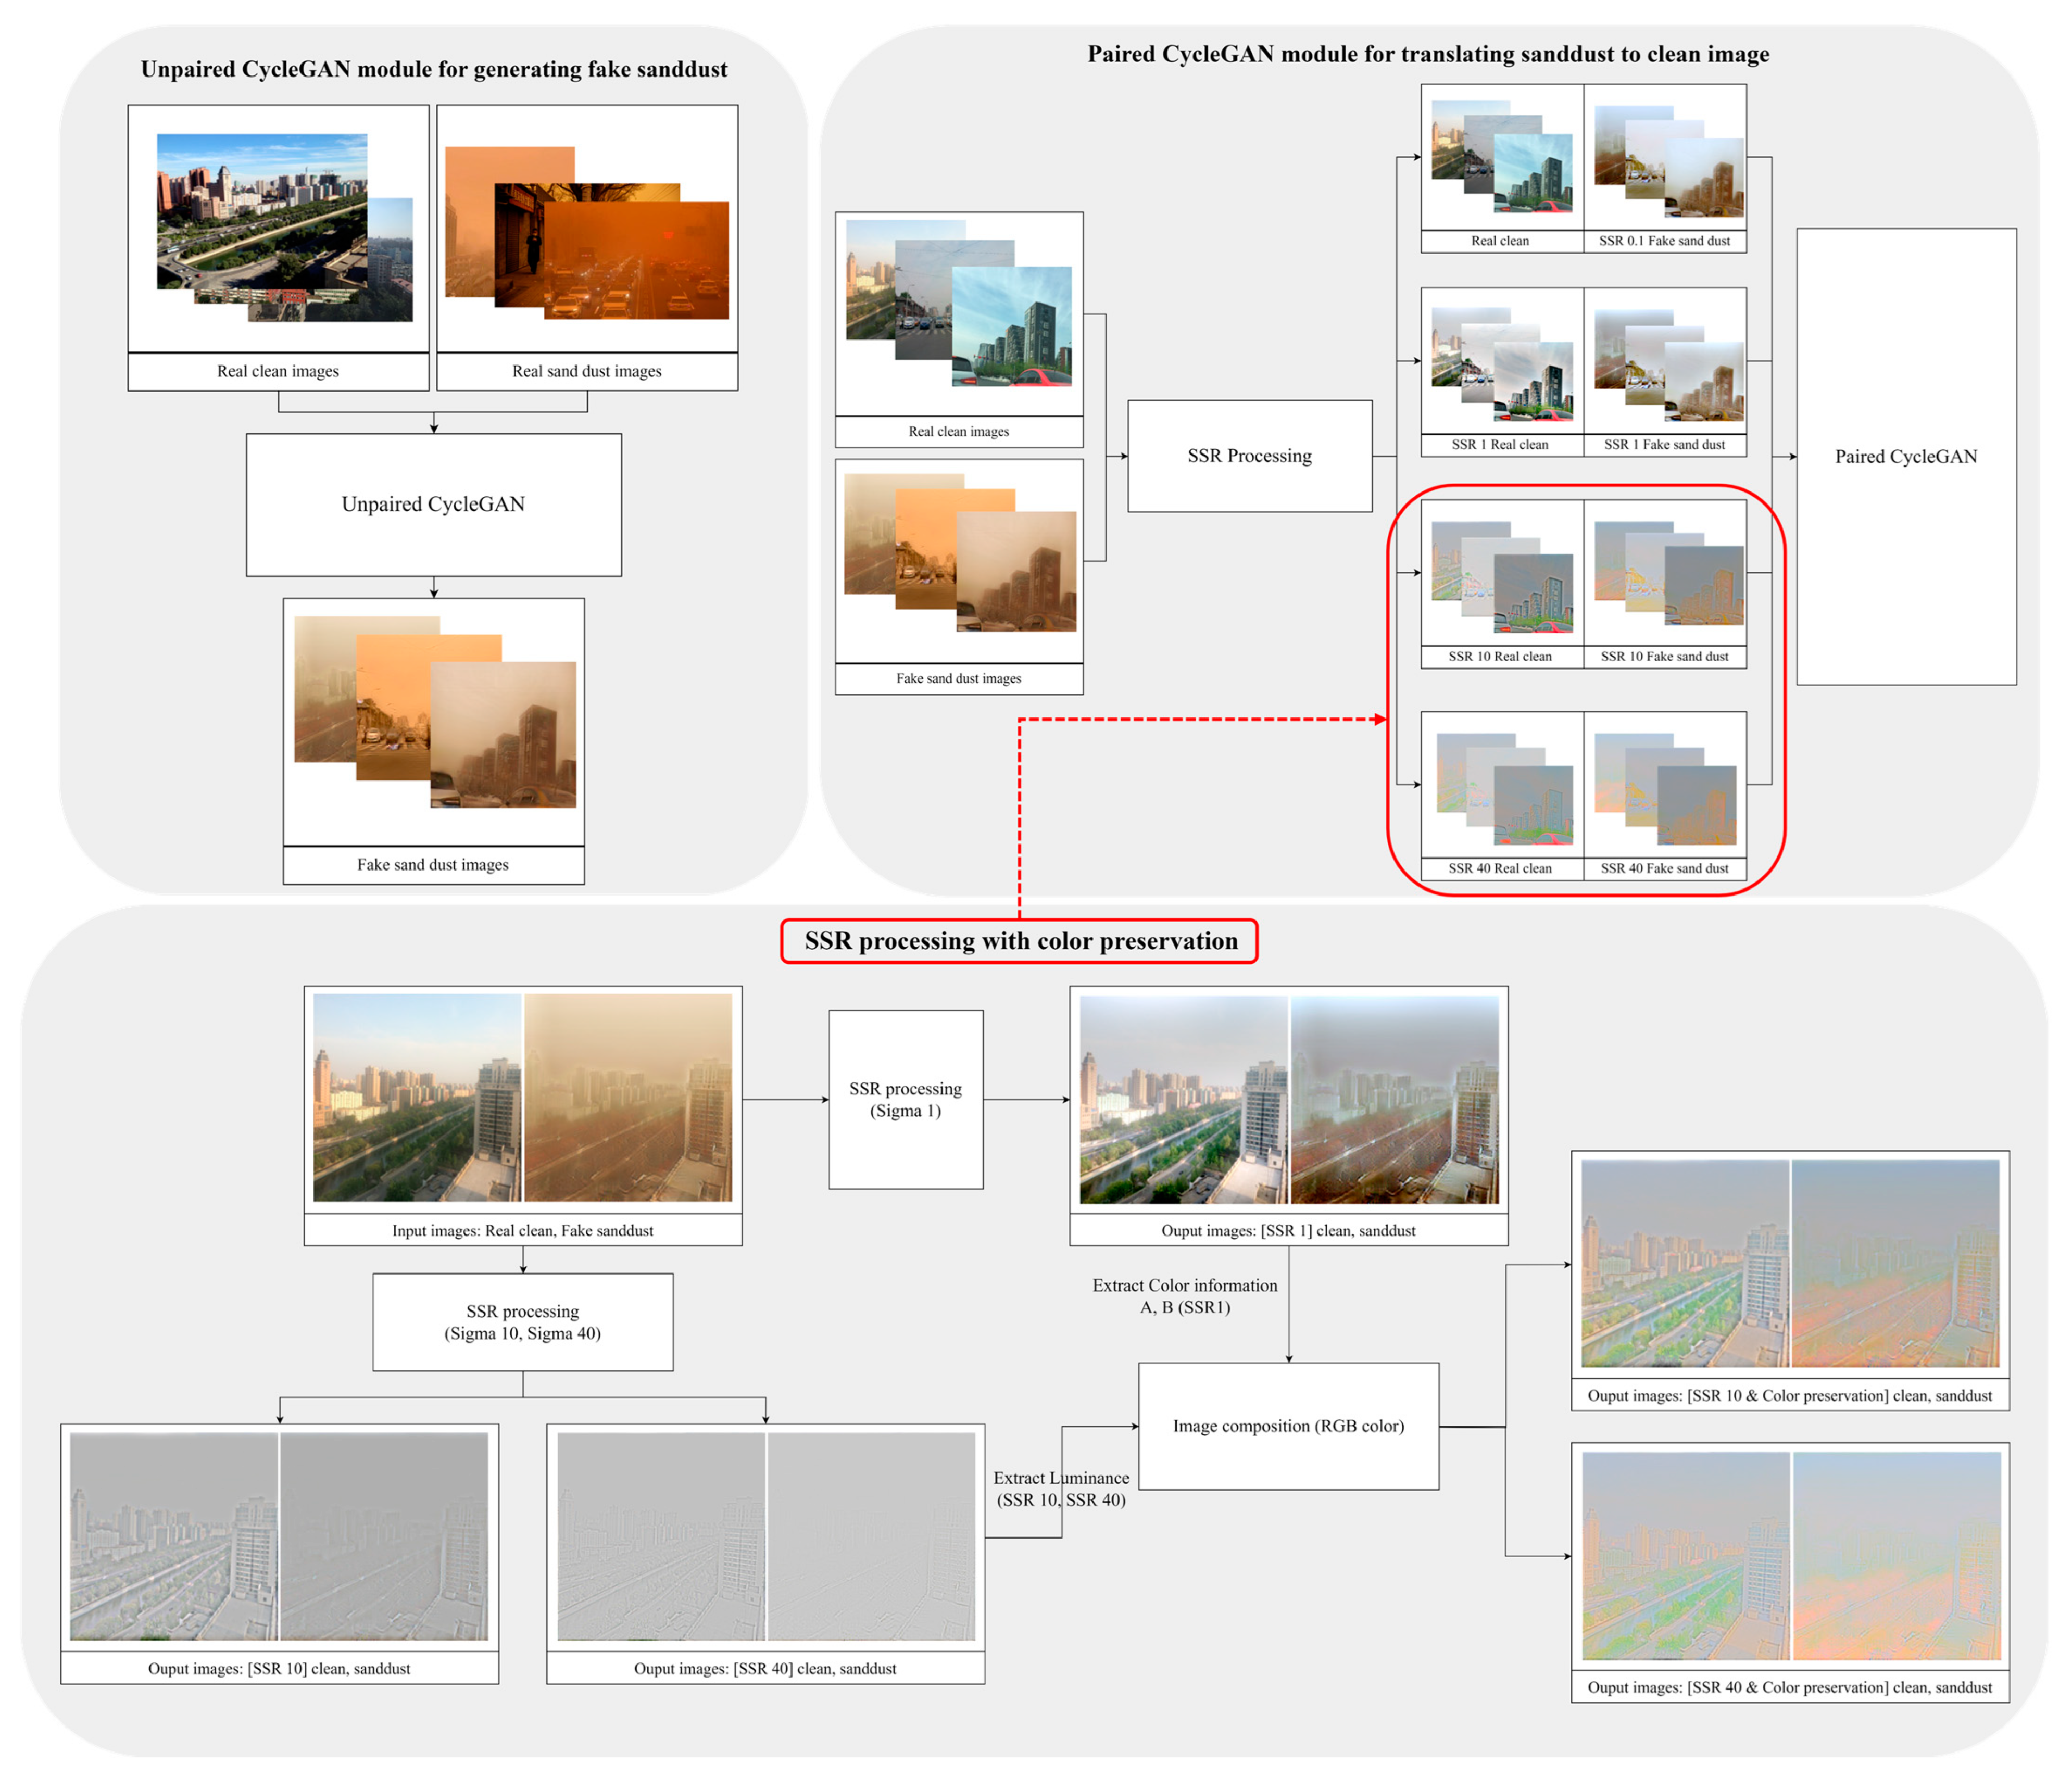
The proposed method uses CycleGAN and the Retinex algorithm to convert sand–dust and haze images into clean ones. Figure 5 illustrates the proposed training method block diagram for sand–dust-to-clean image translation.
First, unpaired training was conducted using 2000 clean images and 250 sand–dust images to create the pair dataset. This process involved generating 2000 synthetic sand–dust images and constructing a paired dataset with 2000 clean images. The SSR algorithm was employed to improve the generation of clean images, and a pair dataset training module was established by applying the SSR algorithm with four different sigma scale values. The rationale for employing four different sigma scales in the training direction was that each module had a different training objective based on the sigma value of the image. As the sigma value increased in the frequency domain, the emphasis on detail components of the image became more pronounced, while decreasing sigma values provided more information about the base components of the image. Consequently, a layered SSR training module was developed for each module according to the sigma value, facilitating focused training of base and detailed information for each module.
In the sigma 0.1 module, pair datasets were created using real clean images and sand–dust images processed with SSR sigma 0.1 as the training dataset. At the smallest sigma scale, real clean images and SSR 0.1 sand–dust images were utilized to construct the training dataset, aiming to enhance the training of color and base information of the real clean images without SSR processing. Subsequently, in the sigma 1 module, clean images processed with SSR sigma 1 and sand–dust images processed with SSR sigma 1 were paired to form the training dataset and used for training. The small-scale sigma 0.1 and 1 training direction prioritized learning the base information while preserving the original color information of clean images as much as possible.
In the proposed training method, SSR sigma 0.1 and SSR sigma 1 resulted in images that remove haze while substantially preserving object and color information, allowing for retention of the original color information of the images. However, for SSR sigma 10 and SSR sigma 40, there was a tendency for the images to appear desaturated, markedly degrading the original color information. To prevent loss of color information in images with large sigma scales during training, the proposed method constructed the training dataset by replacing the color information of the SSR images processed at sigma 1 with the color information of SSR sigma 10 and SSR sigma 40 images. The choice of obtaining the color information from SSR sigma 1 was due to the enhancement of local contrast in resulting images, improving overall enhancement without distorting the original color information. Consequently, in the proposed method, the training direction for SSR sigma 10 and SSR sigma 40 involved transferring the color information from the SSR sigma 1 image, ensuring the preservation of color information, and maximizing the training of object detail information. This proposed training approach generated four paired CycleGAN modules, which were then used to produce the final clean images.
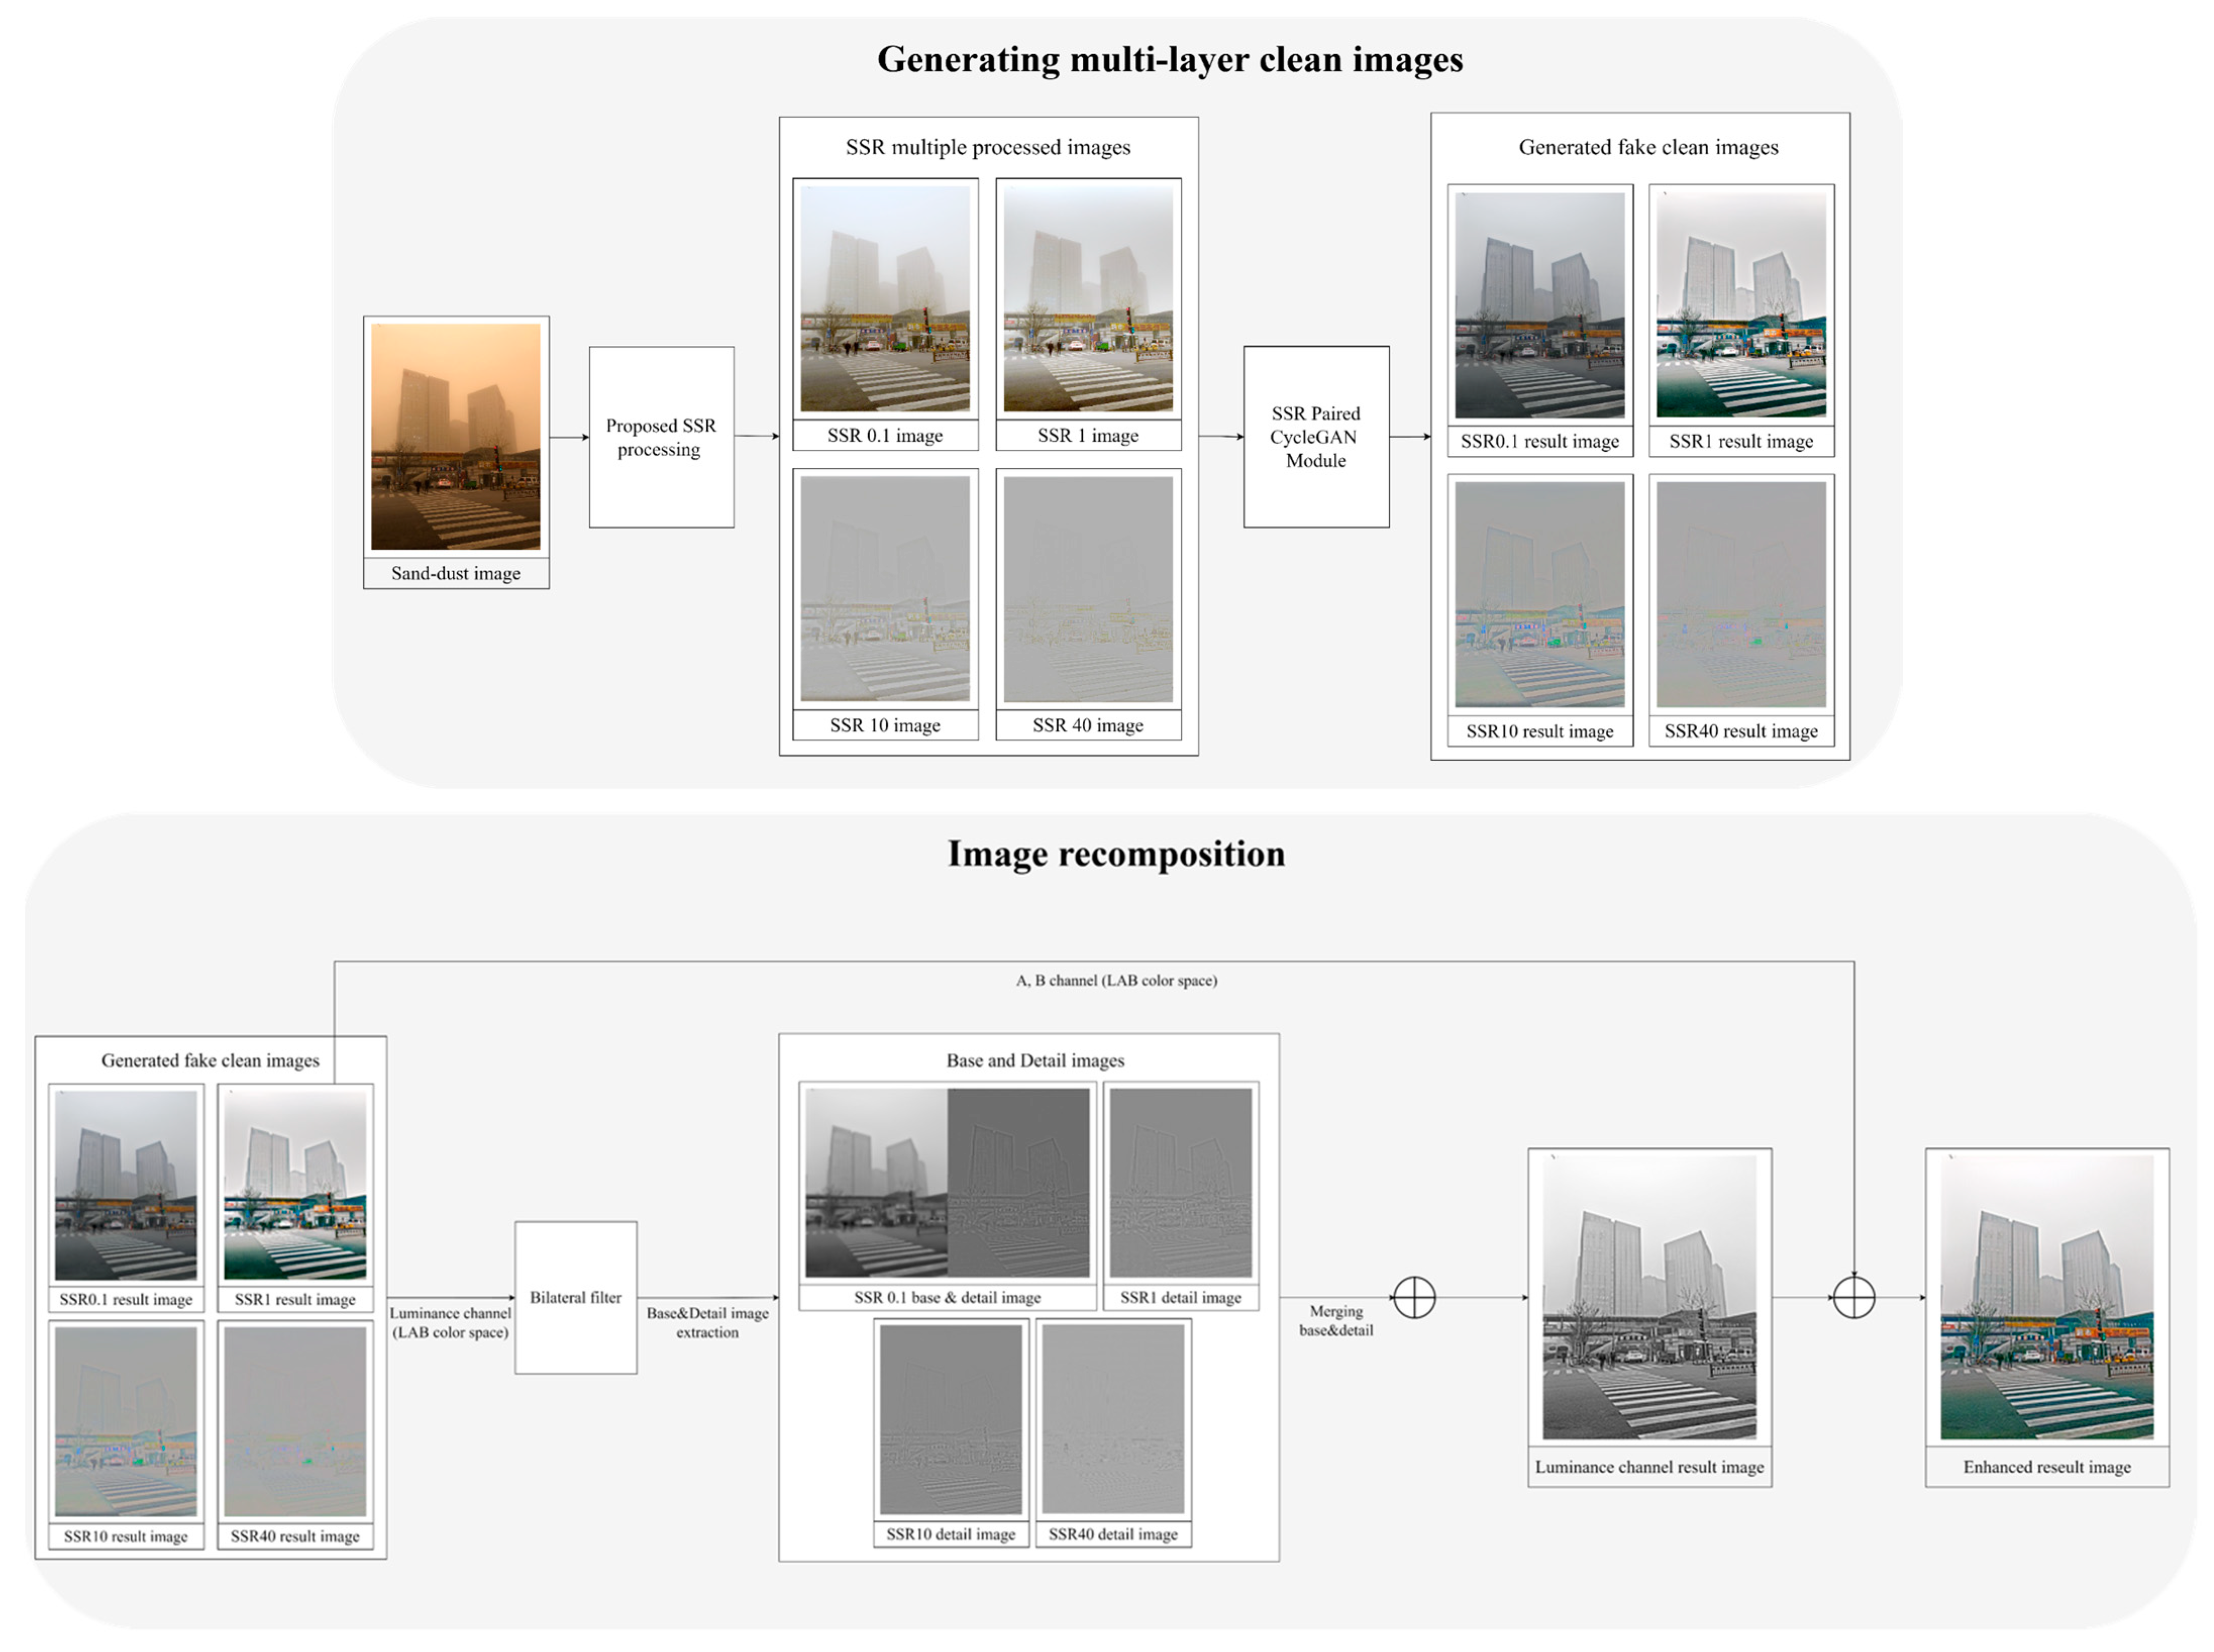
Subsequently, the testing process for generating clean images followed the procedure outlined in Figure 6, and the test results were generated accordingly.
First, testing used the same approach as in the training phase. The input test sand–dust images underwent processing using the proposed SSR processing method to generate SSR-layered images. Subsequently, the SSR-processed images were inputted into the four trained paired CycleGAN modules. Images with smaller sigma scales preserved the base information of the images while enhancing local contrast, whereas as the scale increased, the detail information in the images improved. To capture the characteristics of the resulting images from the four modules, bilateral filtering was applied to separate the base and detail components of each module’s output image, as depicted in Equation (4).
where represents each sigma scale, including 0.1, 1, 10, and 40. denotes the base image processed by bilateral filtering. represents the bilateral filter, and denotes the image processed by the proposed SSR algorithm.
When separating the base and detail images, the proposed method conducted the separation from the luminance channel images of the result images from each module, as depicted in Equation (5).
where represents each sigma scale, namely 0.1, 1, 10, and 40. represents the detail images separated by the bilateral filter, represents the images processed by the proposed SSR algorithm, and represents the base images processed by the bilateral filter.
Equation (6) represents the formula for the final result image, as depicted below.
where represents the final clean result image, is the base image from the sigma 0.1 module, and denotes the detail image separated by the bilateral filter.
The base image of the final result consisted of the base image from the sigma 0.1 module. In the case of high sigma scale modules, noise and halo effects became more prominent, while low sigma scale modules like sigma 0.1 exhibited minimal to no such effects. Therefore, a higher proportion of low-level modules was used to construct the base image to mitigate these issues. Consequently, the base image from sigma 0.1 contained overall base information preserved from the test sand–dust images, making it suitable as the base information for the final result image. The detailed information from each sigma scale was added to generate the final image of the result. Then, the final image was produced by performing normalization to map the values between 0 and 255. Each module’s detailed information contributed equally to the final result through this normalization process.
3. Simulation Results
3.1. Dataset and Computer Specification
A CycleGAN-based method was employed to translate sand–dust and haze to clean images on a personal computer (PC) equipped with the following specifications: an Intel (USA) i9-10980XE 3.00 GHz processor, 256 GB RAM, and an NVIDIA (USA) Geforce RTX 4090 graphics card. Python 3.8 and Pytorch 1.13.1 were utilized for implementing the Pytorch version of CycleGAN. The parameters of CycleGAN included a batch size of one, Adam optimizer with parameters ranging from 0.5 to 0.999, a learning rate of 0.0002 linearly decreased every 100 epochs, 256 256 crop images without flipping augmentation, and a total of 300 epochs for training. The average training time was 17 h per module.
The sand–dust dataset was acquired from images by Yazhong Si et al. [16] and obtained via a Google image search. Haze images were obtained from O-haze [17] and GridDehazeNet. The unpaired clean-to-sand–dust CycleGAN dataset comprised 2000 clean images and 250 sand–dust images. Conversely, the paired sand–dust-to-clean four SSR modules comprised 2000 clean images and 2000 virtual (synthetic) sand–dust images. The unpaired clean-to-sand–dust CycleGAN module generated the 2000 fake sand–dust images. All clean images were sourced from the realist single image dehaze (RESIDE) dataset [18]. Additionally, 25 test sand–dust images and 15 test haze images were used for evaluation.
3.2. Simulation Results Comparison
The proposed method aimed to train models for both sand–dust removal and dehazing. Image quality metric (IQM) and image sharpness metric (ISM) were employed to evaluate the results and compare them with conventional methods. These metrics facilitated the comparison of outcome images from the proposed method with those from conventional sand–dust removal or dehazing models. IQM assessed image quality quantitatively without distortion, while ISM evaluated the sharpness of the image. BRISQUE, PIQE, CEIQ, and MCMA were utilized as IQM indicators to compare the resultant images, while LPC-SI and S3 were selected as ISM indicators to assess image sharpness.
A blind/referenceless image spatial quality evaluator (BRISQUE) utilizes statistical features of images such as brightness, contrast, and edges to measure image quality [19]. A perception-based image quality evaluator (PIQE) evaluates image quality based on human visual perception, considering local and global features such as brightness, contrast, color, edges, and white noise [20]. The contrast-enhancement-based contrast change image quality (CEIQ) measure evaluates image quality based on contrast distortion, considering global and local changes in contrast in the image [21]. Maximizing contrast with minimum artifact (MCMA) measures contrast enhancement methods considering visual quality improvement and information preservation [22].
For measuring image sharpness, the local phase coherence-sharpness index (LPC-SI) quantifies sharpness by identifying strong local phase coherence (LPC) near distinctive image features measured in the complex wavelet transform domain [23,24]. Spectrum and spatial sharpness (S3) is a block-based algorithm that measures the spectrum slope of frequencies and total spatial variations to generate perceptually adjusted values considering visual perception [25]. These adjusted values produce a perceptual sharpness map, indicating perceptually sharper regions in the image. By quantifying image quality and sharpness, these methods objectively evaluate the enhancement in image quality achieved by the proposed approach.
Eight methods for converting sand–dust images to clean images were compared. The TargetMask and DehazeNet are deep learning methods that remove the most dominant background component, such as raindrops or haze, from the image. They are used to compare how well they remove the dominant sand–dust component from sand–dust images. Rank-one prior (ROP), contrast-limited adaptive histogram equalization (CLAHE), and chromatic variance consistency and gamma correction-based dehazing (chromatic-gamma model) methods are specialized algorithms for sand–dust removal, allowing for direct comparison with the results of the proposed method. The multi-scale Retinex (MSR) algorithm and CycleGAN serve as intermediate steps in the proposed method, enabling comparison with the results of the proposed method to assess how much improvement has been achieved compared to the existing two algorithms.
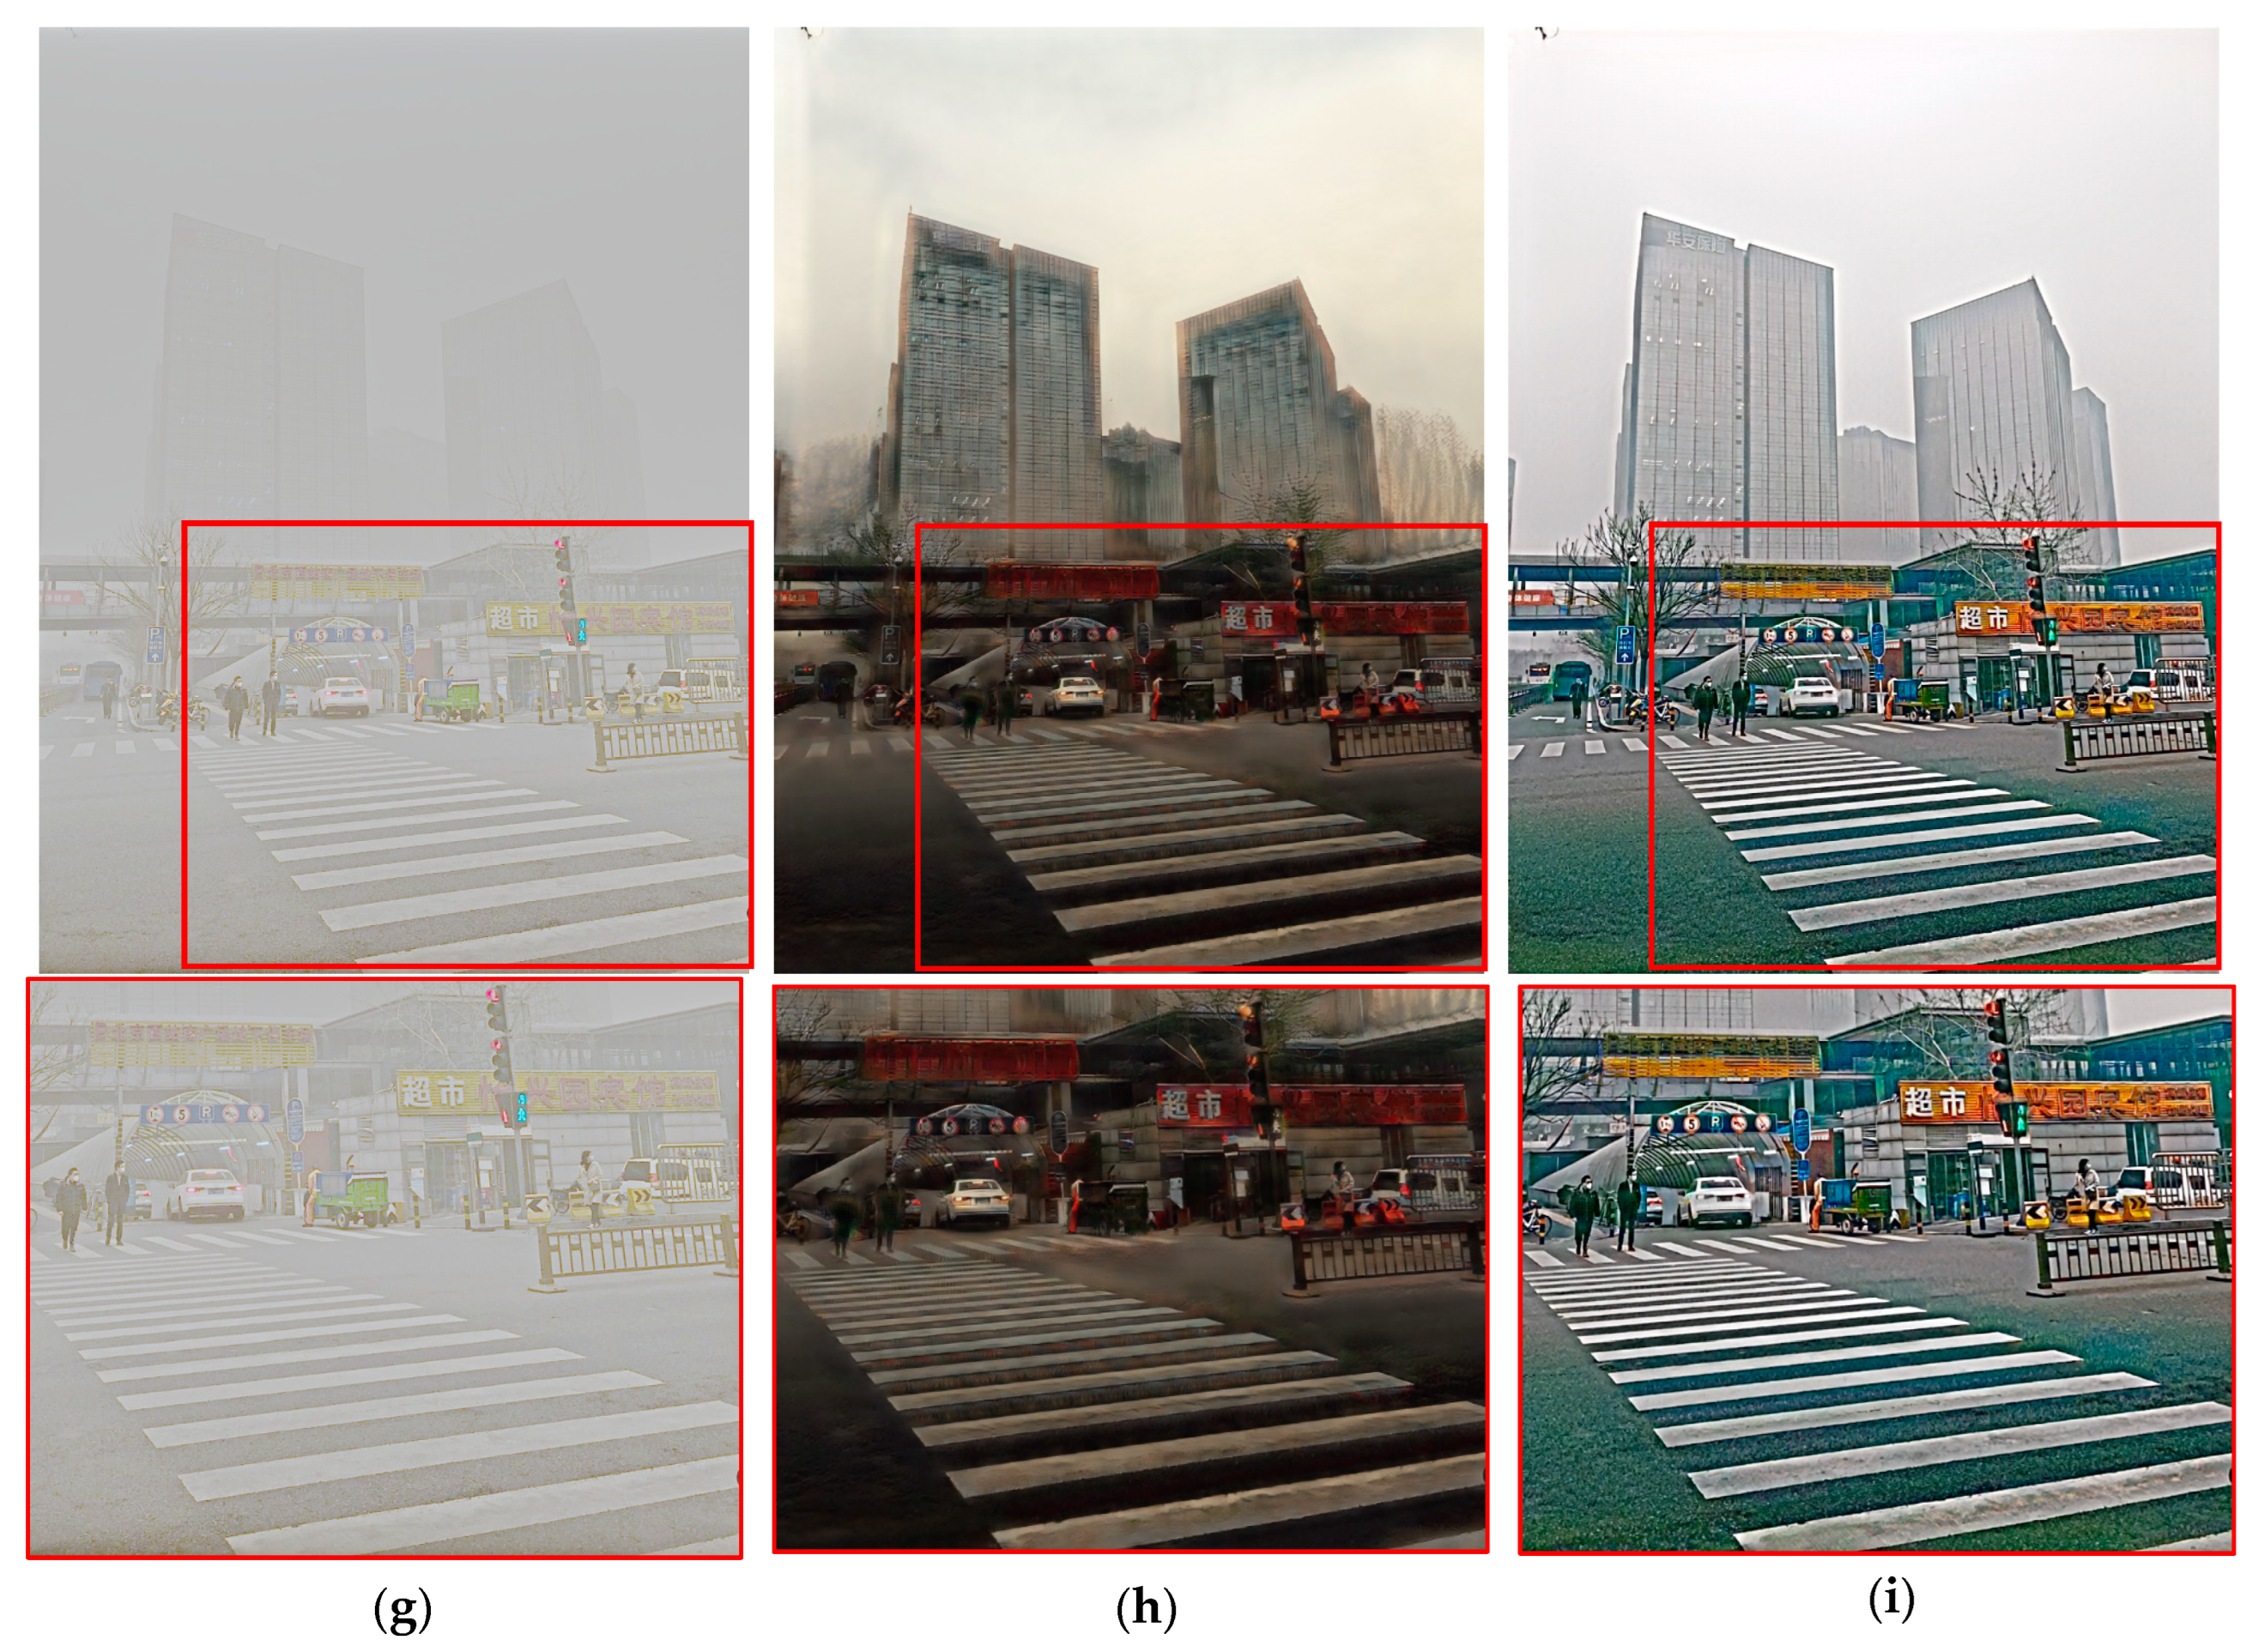
In Figure 7, DehazeNet failed to properly remove the dominant sand–dust component, while the TargetMask result exhibited numerous blotches, substantially distorting the image information. In the MSR image, the sigma scale of the proposed method was retained, but the resulting image was severely desaturated, notably distorting the image information. In the CycleGAN results, the colors of traffic lights were altered, distorting the most critical information on the road. When comparing the results of ROP, CLAHE, and chromatic-gamma with the proposed method, it can be observed that it improved the sharpness of store signs, pedestrian crossings, and object recognition and also enhanced contrast.
In Figure 8, DehazeNet failed to effectively remove the sand–dust component, while TargetMask produced an output heavily affected by spots. The MSR outcome also exhibited substantial grayness, indicating considerable information loss. CycleGAN yielded blurry and blotchy results. Compared to ROP, CLAHE, and chromatic-gamma, the proposed method demonstrated a sharper representation of signage and human figures, establishing it as the most identifiable option.
In Figure 9, the sand–dust in the input image was not as dense, so TargetMask eliminated the blotchy artifacts observed in the results of other figures. However, there was a general decrease in contrast throughout the image. Although CycleGAN, CLAHE, and chromatic-gamma successfully transformed the overall color to that of the clean image, they did not improve sharpness. On the other hand, ROP enhanced sharpness, which was especially noticeable in distant buildings, compared to the results of the proposed method. However, the proposed method exhibited sharper details of nearby objects and road shapes compared to the other methods, indicating a slight advantage in line with the direction of this study.
In Figure 10, dense sand–dust notably introduced blotchy artifacts in the TargetMask results. Conversely, CycleGAN, ROP, CLAHE, chromatic-gamma, and the proposed method effectively mitigated the effects of sand–dust, resulting in cleaner images. Notably, ROP exhibited the most substantial improvement in sharpness, particularly in distant objects. However, a slight yellowish tint persisted in its overall image, indicating incomplete color information transformation of the sand–dust. In contrast, the proposed method successfully eliminated the yellowish tint and the haze itself, enhancing the sharpness of road features, cyclists, and the red car without distorting color information. Consequently, the transformation results from sand–dust-to-clean images underscored the superiority of the proposed method in delineating road features, signal light colors, signboards, and other critical information amidst a sand–dust environment.
In Table 1, the metrics for the images transformed from sand–dust to clean were averaged and are presented. The proposed method yielded superior numerical results compared to conventional methods. However, the PIQE metric evaluated image quality considering the noise level, which might lead to sensitivity to noise in specific situations. Therefore, considering the excellent sharpness indicated by metrics such as LPC-SI and S3 in the results of the proposed method, it was speculated that areas of sharpness might be interpreted as noise by PIQE, potentially lowering the score of the proposed method.
Subsequently, Figure 11, Figure 12, Figure 13 and Figure 14 compare conventional dehazing methods using only haze images as input. The proposed method compared six existing modules, including Grid-dehazeNet, MSBDN-DFF, DehazeNet, and FFA-Net consisting of deep learning-based dehazing modules and algorithm-based dehazing modules such as color attenuation prior and dark channel prior. The resulting images were evaluated using the same metrics as those used for the clean sand–dust result images, providing an objective comparison of numerical values.
When scrutinizing the proposed method alongside conventional methods, the most notable discrepancy emerged in the sharpness of the vehicle license plates. Conventional methods encountered challenges in accurately identifying vehicle license plates and exhibited diminished contrast compared to the input images. Conversely, the proposed method enhanced contrast, refining the sharpness of vehicle license plates and objects, rendering it the most suitable approach for the study’s objectives. Nevertheless, compared to specific conventional methods like DehazeNet and FFA-Net, the proposed method still retained faint traces of haze in the central regions of the images, slightly falling short of achieving an utterly pristine image.
When the input image was heavily obscured by haze, the resulting images from each module, except for the proposed method, struggled to remove the haze effectively. Thus, in Figure 12, the proposed method demonstrated superior sharpness in the building. However, it is noteworthy that even in the proposed method, a slight halo effect was noticeable, which appeared to be a limitation of images processed with the Retinex algorithm. As the Retinex algorithm was utilized as part of the training data in the proposed modules, such halo effects may arise.
In Figure 13, the efficacy of dehaze modules was evaluated using foggy road driving scenes as input images. DehazeNet output failed to eliminate the haze adequately. At the same time, the dark channel prior and the FFA-Net method diminished contrast, resulting in a darker overall image that compromised the visibility of road signs and conditions. Conversely, the other modules effectively removed the haze and adeptly enhanced the image to facilitate the identification of road signs and vehicles. Notably, the proposed method demonstrated superior sharpness in road signs and substantially improved the clarity of road conditions and vehicle shapes.
In Figure 14, the outcomes of each module for foggy road scenes are juxtaposed. The outcomes from the algorithm-based dehaze modules typically reduced overall contrast, rendering object identification challenging. Conversely, the results from the deep learning modules effectively eliminated haze and enhanced clarity, enabling easy identification of objects on the road. However, the output from the proposed method notably improved the overall sharpness of the road, allowing for the identification of cracks and lane markings, thereby providing clearer information about the road situation to the driver.
In Table 2, the image quality metrics for the transformed images from haze to clean scenes were averaged and are presented. Regarding the proposed method, as illustrated in Figure 11, specific result images revealed inadequate removal of haze in the central part, resulting in lower scores in BRISQUE, which evaluated image quality-related metrics. Similarly, akin to the sand–dust-to-clean transformation metrics, the proposed method’s result images exhibited a notable enhancement in sharpness compared to other modules. Consequently, the scores of image sharpness measurement metrics such as LPC-SI and S3 were the highest. However, the scores were notably lower for noise-sensitive IQM metrics like PIQE. Conversely, for metrics like CEIQ and MCMA, which pertain to contrast enhancement, the proposed method attained higher scores compared to other metrics.
Finally, the processing time was calculated for the transformation into clean images based on the 1280 × 720 (HD) criterion. The generation time for SSR-processed test images was 5.88 s per image, totaling 23.52 s for hierarchical SSR processing across four scales. The image translation using CycleGAN took approximately 1.77 s per image, totaling 7.09 s for four CycleGAN modules. Lastly, the final postprocessing for generating the final result took 1.673 s per image. The total processing time was 32.283 s per image.
The primary objective of the proposed method was to enhance the contrast of images and improve their quality under sand–dust and haze conditions. Furthermore, it enhanced the sharpness of objects within the images, which is particularly advantageous for object identification, especially in road scenarios. These outcomes were evident through both visual inspection of the images and objective image evaluation metrics.
4. Discussion
The primary focus of this study was to enhance image quality in sand–dust and haze conditions, with a particular emphasis on improving the perception of the road environment for car driving situations in adverse weather road conditions. Initially, the proposed method utilized CycleGAN, an image-to-image translation method, to convert sand–dust and haze images into clean images. During the unpaired training with CycleGAN, a phenomenon occurred where information in the images is lost, and unwanted areas were transformed, leading to a loss of image information. To address this issue, paired training was employed to prevent such losses.
Subsequently, the proposed method compared the outcomes of conventional methods and the proposed approach for converting sand–dust and haze images into clean images. Upon intuitive comparison based solely on the results, a substantial enhancement in the clarity and image quality of road conditions, critical for drivers’ focus, was evident. However, in Figure 8, Figure 9 and Figure 10, the results from the ROP method appeared to enhance the clarity of distant objects more than the proposed approach. Additionally, in Figure 9 and Figure 10, the CycleGAN results portrayed a more natural representation of the sky area. Despite these aspects appearing superior to the proposed method, they were not directly relevant to the driver’s perspective during driving, as the typical field of view does not extend to distant objects or the sky area. Therefore, the results aligned with the proposed direction. Furthermore, in the hazy scenes depicted in Figure 11 and Figure 13, the sharpness of signs and vehicles in the proposed method’s results stood out as superior, providing more information about the road conditions during driving than existing methods. However, the overall color representation in the results of Grid-dehazeNet and MSBDN-DFF may appear more natural compared to the proposed method. This could be attributed to using the SSR image dataset in this study, resulting in a slight overall graying effect in the output images. Nevertheless, as demonstrated in Figure 12, when handling dense foggy scenes, the proposed method effectively removed haze while enhancing sharpness. Additionally, Figure 11, Figure 12, Figure 13 and Figure 14 illustrated that the overall contrast of the proposed method’s result images was improved compared to other studies, and the sharpness of objects was substantially enhanced.
The upcoming study will investigate various deep-learning methods for image-to-image translation to address sand–dust, dehaze functionalities, and other adverse weather conditions. Our goal was also to create a model capable of converting night scenes into daytime scenes, enhancing drivers’ visibility in all weather conditions. Furthermore, future research will concentrate on enhancing the overall color preservation of input images, mitigating halo artifacts, and improving contrast to enhance object sharpness. Also, additional consideration should be given to low-light sand–dust videos and real-time scenarios. Research on tone-up methods to enhance low-light conditions is necessary to train low-light images. The employment of onboard systems to reduce the inference time for image transformation is essential. Therefore, embedding the proposed algorithm into boards such as ASIC boards is necessary for application in surveillance systems or vehicle camera systems, enabling the processing of real-time scenes.
5. Conclusions
This study employed CycleGAN, an image-to-image translation technique, to convert sand–dust and haze images into clean images. To address insufficient data, synthetic sand–dust images were generated using unpaired CycleGAN. Subsequently Retinex, the SSR algorithm was utilized to generate SSR-processed images to construct the paired dataset. During SSR processing, the color information of the large-scale sigma value in the training data was retained by incorporating the color information from the SSR-processed images of the smaller scale, thus preserving color information. Ultimately, four sets of paired SSR-processed datasets were established. The constructed paired dataset was used to train the paired CycleGAN. Each module’s training results exhibited different characteristics. Experimentally, it was observed that the detail was enhanced as the sigma value increased in the frequency domain. Therefore, the characteristics of the four modules were separated into base and detail images using a bilateral filter. The resulting images from the module with the smallest sigma value did not degrade the base information. Additionally, to enhance the image’s overall sharpness, the detail components from the four modules were synthesized using an average weighting. Finally, the base image from the module with the smallest scale sigma and the detail components from all modules were combined using average weighting to generate the final result image. Compared to other conventional methods, the resulting images from the proposed method exhibited improved overall sharpness, thereby enriching the visual information for the focused driver.
Author Contributions
Conceptualization, S.-H.L.; methodology, D.-M.S. and S.-H.L.; software, D.-M.S.; validation, D.-M.S. and S.-H.L.; formal analysis, D.-M.S. and S.-H.L.; investigation, D.-M.S. and S.-H.L.; resources, D.-M.S. and S.-H.L.; data curation, D.-M.S. and S.-H.L.; writing—original draft preparation, D.-M.S.; writing—review and editing, S.-H.L.; visualization, D.-M.S.; supervision, S.-H.L.; project administration, S.-H.L.; funding acquisition, S.-H.L. All authors have read and agreed to the published version of the manuscript.
Funding
This research was supported by the Basic Science Research Program through the National Research Foundation of Korea (NRF), funded by the Ministry of Education, Korea (NRF-2021R1I1A3049604, 50%) and supported by the Innovative Human Resource Development for Local Intellectualization program through the Institute of Information & Communications Technology Planning & Evaluation (IITP) grant funded by the Korea government (MSIT) (IITP-2024-RS-2022-00156389, 50%).
Data Availability Statement
The sand–dust data presented in this study are openly available in references [3,4,16], and the haze dataset is from RESIDE to be freely utilized at https://sites.google.com/view/reside-dehaze-datasets/reside-v0 (accessed on 18 April 2024).
Conflicts of Interest
The authors declare no conflicts of interest regarding the publication of this paper.
References
- Kwon, H.J.; Lee, S.H. Raindrop-Removal Image Translation Using Target-Mask Network with Attention Module. Mathematics 2023, 11, 3318. [Google Scholar] [CrossRef]
- Liu, J.; Liu, R.W.; Sun, J.; Zeng, T. Rank-One Prior: Toward Real-Time Scene Recovery. arXiv 2021, arXiv:2103.17126. [Google Scholar]
- Liu, J.; Liu, R.W.; Sun, J.; Zeng, T. Rank-One Prior: Real-Time Scene Recovery. IEEE Trans. Pattern Anal. Mach. Intell. 2023, 45, 8845–8860. [Google Scholar] [CrossRef] [PubMed]
- Shi, Z.; Feng, Y.; Zhao, M.; Zhang, E.; He, L. Normalised Gamma Transformation-Based Contrast-Limited Adaptive Histogram Equalisation with Colour Correction for Sand-Dust Image Enhancement. IET Image Process. 2020, 14, 747–756. [Google Scholar] [CrossRef]
- Jeon, J.J.; Park, T.H.; Eom, I.K. Sand-Dust Image Enhancement Using Chromatic Variance Consistency and Gamma Correction-Based Dehazing. Sensors 2022, 22, 9048. [Google Scholar] [CrossRef] [PubMed]
- Cai, B.; Xu, X.; Jia, K.; Qing, C.; Tao, D. DehazeNet: An End-to-End System for Single Image Haze Removal. IEEE Trans. Image Process. 2016, 25, 5187–5198. [Google Scholar] [CrossRef]
- Liu, X.; Ma, Y.; Shi, Z.; Chen, J. GridDehazeNet: Attention-Based Multi-Scale Network for Image Dehazing. In Proceedings of the IEEE International Conference on Computer Vision, Seoul, Republic of Korea, 27 October–2 November 2019; Institute of Electrical and Electronics Engineers Inc.: New York, NY, USA, 2019; pp. 7313–7322. [Google Scholar]
- Dong, H.; Pan, J.; Xiang, L.; Hu, Z.; Zhang, X.; Wang, F.; Yang, M.H. Multi-Scale Boosted Dehazing Network with Dense Feature Fusion. In Proceedings of the IEEE Computer Society Conference on Computer Vision and Pattern Recognition, Seattle, WA, USA, 13–19 June 2020; IEEE Computer Society: New York, NY, USA, 2020; pp. 2154–2164. [Google Scholar]
- Zhu, Q.; Mai, J.; Shao, L. A Fast Single Image Haze Removal Algorithm Using Color Attenuation Prior. IEEE Trans. Image Process. 2015, 24, 3522–3533. [Google Scholar] [CrossRef] [PubMed]
- He, K.; Sun, J.; Tang, X. Single Image Haze Removal Using Dark Channel Prior. IEEE Trans. Pattern Anal. Mach. Intell. 2011, 33, 2341–2353. [Google Scholar] [CrossRef] [PubMed]
- Qin, X.; Wang, Z.; Bai, Y.; Xie, X.; Jia, H. FFA-Net: Feature Fusion Attention Network for Single Image Dehazing. Proc. AAAI Conf. Artif. Intell. 2020, 34, 11908–11915. [Google Scholar] [CrossRef]
- Petro, A.B.; Sbert, C.; Morel, J.-M. Multiscale Retinex. Image Process. OnLine 2014, 4, 71–88. [Google Scholar] [CrossRef]
- Isola, P.; Zhu, J.-Y.; Zhou, T.; Efros, A.A. Image-to-Image Translation with Conditional Adversarial Networks. In Proceedings of the 2017 IEEE Conference on Computer Vision and Pattern Recognition (CVPR), Honolulu, HI, USA, 21–26 July 2017. [Google Scholar]
- Zhu, J.-Y.; Park, T.; Isola, P.; Efros, A.A. Unpaired Image-to-Image Translation Using Cycle-Consistent Adversarial Networks. In Proceedings of the 2017 IEEE International Conference on Computer Vision (ICCV), Venice, Italy, 22–29 October 2017. [Google Scholar]
- Mao, X.; Li, Q.; Xie, H.; Lau, R.Y.K.; Wang, Z.; Smolley, S.P. Least Squares Generative Adversarial Networks. arXiv 2016, arXiv:1611.04076. [Google Scholar]
- Si, Y.; Yang, F.; Liu, Z. Sand Dust Image Visibility Enhancement Algorithm via Fusion Strategy. Sci. Rep. 2022, 12, 13226. [Google Scholar] [CrossRef] [PubMed]
- Ancuti, C.O.; Ancuti, C.; Timofte, R.; De Vleeschouwer, C. O-HAZE: A Dehazing Benchmark with Real Hazy and Haze-Free Outdoor Images. In Proceedings of the 2018 IEEE/CVF Conference on Computer Vision and Pattern Recognition Workshops (CVPRW), Salt Lake City, UT, USA, 18–22 June 2018. [Google Scholar]
- Li, B.; Ren, W.; Fu, D.; Tao, D.; Feng, D.; Zeng, W.; Wang, Z. Benchmarking Single Image Dehazing and Beyond. arXiv 2017, arXiv:1712.04143. [Google Scholar] [CrossRef]
- Mittal, A.; Moorthy, A.K.; Bovik, A.C. Blind/Referenceless Image Spatial Quality Evaluator. In Proceedings of the 2011 Conference Record of the Forty Fifth Asilomar Conference on Signals, Systems and Computers (ASILOMAR), Pacific Grove, CA, USA, 6–9 November 2011; IEEE: New York, NY, USA, 2011; pp. 723–727. [Google Scholar]
- Venkatanath, N.; Praneeth, D.; Maruthi Chandrasekhar, B.; Channappayya, S.S.; Medasani, S.S. Blind Image Quality Evaluation Using Perception Based Features. In Proceedings of the 2015 Twenty First National Conference on Communications (NCC), Mumbai, India, 27 February–1 March 2015; IEEE: New York, NY, USA, 2015; pp. 1–6. [Google Scholar]
- Yan, J.; Li, J.; Fu, X. No-Reference Quality Assessment of Contrast-Distorted Images Using Contrast Enhancement. arXiv 2019, arXiv:1904.08879. [Google Scholar]
- Abdoli, M.; Nasiri, F.; Brault, P.; Ghanbari, M. Quality Assessment Tool for Performance Measurement of Image Contrast Enhancement Methods. IET Image Process. 2019, 13, 833–842. [Google Scholar] [CrossRef]
- Hassen, R.; Wang, Z.; Salama, M. No-Reference Image Sharpness Assessment Based on Local Phase Coherence Measurement. In Proceedings of the 2010 IEEE International Conference on Acoustics, Speech and Signal Processing, Dallas, TX, USA, 14–19 March 2010; IEEE: New York, NY, USA, 2010; pp. 2434–2437. [Google Scholar]
- Hassen, R.; Wang, Z.; Salama, M.M.A. Image Sharpness Assessment Based on Local Phase Coherence. IEEE Trans. Image Process. 2013, 22, 2798–2810. [Google Scholar] [CrossRef]
- Vu, C.T.; Phan, T.D.; Chandler, D.M. S-3: A Spectral and Spatial Measure of Local Perceived Sharpness in Natural Images. IEEE Trans. Image Process. 2012, 21, 934–945. [Google Scholar] [CrossRef] [PubMed]
Figure 1.
Single-scale Retinex processing in the frequency domain.

Figure 2.
Comparison of detail information between the original image and SSR images processed in the frequency domain: (a) sand–dust image and edge index, (b) SSR sigma 0.1 scale processed image and edge index, (c) SSR sigma 1 scale processed image and edge index, (d) SSR sigma 10 scale processed image and edge index, (e) SSR sigma 40 scale processed image and edge index.

Figure 3.
The brief structure of the CycleGAN architecture.

Figure 4.
Comparison of the results of sand–dust-to-clean image translation: (a) sand–dust image, (b) generated clean image by the unpaired CycleGAN module, and (c) generated clean image by the paired CycleGAN module.
Figure 4.
Comparison of the results of sand–dust-to-clean image translation: (a) sand–dust image, (b) generated clean image by the unpaired CycleGAN module, and (c) generated clean image by the paired CycleGAN module.

Figure 5.
The proposed method for the training part.

Figure 6.
Proposed method for the test part.

Figure 7.
Comparison of the sand–dust to clean results image: (a) sand–dust, (b) TargetMask, (c) DehazeNet, (d) ROP, (e) CLAHE, (f) chromatic-gamma, (g) MSR, (h) CycleGAN, and (i) proposed method.
Figure 7.
Comparison of the sand–dust to clean results image: (a) sand–dust, (b) TargetMask, (c) DehazeNet, (d) ROP, (e) CLAHE, (f) chromatic-gamma, (g) MSR, (h) CycleGAN, and (i) proposed method.


Figure 8.
Comparison of the sand–dust to clean results image: (a) sand–dust, (b) TargetMask, (c) DehazeNet, (d) ROP, (e) CLAHE, (f) chromatic-gamma, (g) MSR, (h) CycleGAN, and (i) proposed method.
Figure 8.
Comparison of the sand–dust to clean results image: (a) sand–dust, (b) TargetMask, (c) DehazeNet, (d) ROP, (e) CLAHE, (f) chromatic-gamma, (g) MSR, (h) CycleGAN, and (i) proposed method.


Figure 9.
Comparison of the sand–dust to clean results image: (a) sand–dust, (b) TargetMask, (c) DehazeNet, (d) ROP, (e) CLAHE, (f) chromatic-gamma, (g) MSR, (h) CycleGAN, and (i) proposed method.
Figure 9.
Comparison of the sand–dust to clean results image: (a) sand–dust, (b) TargetMask, (c) DehazeNet, (d) ROP, (e) CLAHE, (f) chromatic-gamma, (g) MSR, (h) CycleGAN, and (i) proposed method.


Figure 10.
Comparison of the sand–dust to clean results image: (a) sand–dust, (b) TargetMask, (c) DehazeNet, (d) ROP, (e) CLAHE, (f) chromatic-gamma, (g) MSR, (h) CycleGAN, and (i) proposed method.
Figure 10.
Comparison of the sand–dust to clean results image: (a) sand–dust, (b) TargetMask, (c) DehazeNet, (d) ROP, (e) CLAHE, (f) chromatic-gamma, (g) MSR, (h) CycleGAN, and (i) proposed method.

Figure 11.
Comparison of the haze to clean results image: (a) haze image, (b) Grid-dehazeNet, (c) MSBDN-DFF, (d) DehazeNet, (e) color attenuation prior, (f) dark channel prior, (g) FFA-Net, and (h) proposed method.
Figure 11.
Comparison of the haze to clean results image: (a) haze image, (b) Grid-dehazeNet, (c) MSBDN-DFF, (d) DehazeNet, (e) color attenuation prior, (f) dark channel prior, (g) FFA-Net, and (h) proposed method.


Figure 12.
Comparison of the haze to clean results image: (a) haze image, (b) Grid-dehazeNet, (c) MSBDN-DFF, (d) DehazeNet, (e) color attenuation prior, (f) dark channel prior, (g) FFA-Net, and (h) proposed method.
Figure 12.
Comparison of the haze to clean results image: (a) haze image, (b) Grid-dehazeNet, (c) MSBDN-DFF, (d) DehazeNet, (e) color attenuation prior, (f) dark channel prior, (g) FFA-Net, and (h) proposed method.


Figure 13.
Comparison of the haze to clean results image: (a) haze image, (b) Grid-dehazeNet, (c) MSBDN-DFF, (d) DehazeNet, (e) color attenuation prior, (f) dark channel prior, (g) FFA-Net, and (h) proposed method.
Figure 13.
Comparison of the haze to clean results image: (a) haze image, (b) Grid-dehazeNet, (c) MSBDN-DFF, (d) DehazeNet, (e) color attenuation prior, (f) dark channel prior, (g) FFA-Net, and (h) proposed method.


Figure 14.
Comparison of the haze to clean results image: (a) haze image, (b) Grid-dehazeNet, (c) MSBDN-DFF, (d) DehazeNet, (e) color attenuation prior, (f) dark channel prior, (g) FFA-Net, and (h) proposed method.
Figure 14.
Comparison of the haze to clean results image: (a) haze image, (b) Grid-dehazeNet, (c) MSBDN-DFF, (d) DehazeNet, (e) color attenuation prior, (f) dark channel prior, (g) FFA-Net, and (h) proposed method.


Table 1.
Comparison IQM and ISM scores for sand–dust-to-clean image. The “up arrow” indicates higher scores are preferable, while the “down arrow” signifies lower scores are preferable.
Table 1.
Comparison IQM and ISM scores for sand–dust-to-clean image. The “up arrow” indicates higher scores are preferable, while the “down arrow” signifies lower scores are preferable.
| BRISQUE ↓ | PIQE ↓ | CEIQ ↑ | MCMA ↑ | LPC-SI ↑ | S3 ↑ | |
|---|---|---|---|---|---|---|
| TargetMask | 22.283 | 28.708 | 3.245 | 0.628 | 0.948 | 0.172 |
| DehazeNet | 31.109 | 39.040 | 3.208 | 0.577 | 0.935 | 0.107 |
| ROP | 26.911 | 41.271 | 3.436 | 0.672 | 0.959 | 0.237 |
| CLIE | 22.268 | 43.481 | 3.221 | 0.601 | 0.942 | 0.184 |
| Chromatic-gamma | 29.266 | 40.831 | 3.575 | 0.647 | 0.959 | 0.154 |
| MSR | 35.102 | 36.523 | 2.06 | 0.319 | 0.897 | 0.056 |
| CycleGAN | 22.195 | 28.205 | 3.427 | 0.65 | 0.948 | 0.162 |
| Proposed method | 21.52 | 31.783 | 3.468 | 0.724 | 0.968 | 0.217 |
Table 2.
Comparison of IQM and ISM scores for haze-to-clean (dehaze) images. An “up arrow” indicates higher scores are preferable, while a “down arrow” suggests lower scores are preferable.
Table 2.
Comparison of IQM and ISM scores for haze-to-clean (dehaze) images. An “up arrow” indicates higher scores are preferable, while a “down arrow” suggests lower scores are preferable.
| BRISQUE ↓ | PIQE ↓ | CEIQ ↑ | MCMA ↑ | LPC-SI ↑ | S3 ↑ | |
|---|---|---|---|---|---|---|
| Grid-dehazeNet | 19.109 | 26.959 | 3.3801 | 0.728 | 0.949 | 0.187 |
| MSBDN-DFF | 19.248 | 30.845 | 3.3804 | 0.696 | 0.942 | 0.147 |
| DehazeNet | 21.11 | 34.477 | 3.3732 | 0.663 | 0.939 | 0.141 |
| Color Attenuation Prior | 19.73 | 35.582 | 3.3056 | 0.654 | 0.944 | 0.138 |
| Dark channel prior | 16.654 | 31.774 | 3.2168 | 0.653 | 0.942 | 0.163 |
| FFA-Net | 19.73 | 35.582 | 3.306 | 0.654 | 0.944 | 0.138 |
| Proposed method | 22.77 | 33.081 | 3.4587 | 0.717 | 0.967 | 0.243 |
Disclaimer/Publisher’s Note: The statements, opinions and data contained in all publications are solely those of the individual author(s) and contributor(s) and not of MDPI and/or the editor(s). MDPI and/or the editor(s) disclaim responsibility for any injury to people or property resulting from any ideas, methods, instructions or products referred to in the content. |
© 2024 by the authors. Licensee MDPI, Basel, Switzerland. This article is an open access article distributed under the terms and conditions of the Creative Commons Attribution (CC BY) license (https://creativecommons.org/licenses/by/4.0/).
Share and Cite
MDPI and ACS Style
Son, D.-M.; Lee, S.-H. Enhancing Surveillance Vision with Multi-Layer Deep Learning Representation. Mathematics 2024, 12, 1313. https://doi.org/10.3390/math12091313
AMA Style
Son D-M, Lee S-H. Enhancing Surveillance Vision with Multi-Layer Deep Learning Representation. Mathematics. 2024; 12(9):1313. https://doi.org/10.3390/math12091313
Chicago/Turabian StyleSon, Dong-Min, and Sung-Hak Lee. 2024. "Enhancing Surveillance Vision with Multi-Layer Deep Learning Representation" Mathematics 12, no. 9: 1313. https://doi.org/10.3390/math12091313
Note that from the first issue of 2016, this journal uses article numbers instead of page numbers. See further details here.