
Efficient Large-Scale IoT Botnet Detection through GraphSAINT-Based Subgraph Sampling and Graph Isomorphism Network
Cyberspace Institute of Advanced Technology, Guangzhou University, Guangzhou 510006, China
*
Author to whom correspondence should be addressed.
Mathematics 2024, 12(9), 1315; https://doi.org/10.3390/math12091315
Submission received: 29 March 2024
/
Revised: 20 April 2024
/
Accepted: 23 April 2024
/
Published: 25 April 2024
(This article belongs to the Special Issue Advanced Research on Information System Security and Privacy)
Abstract
:In recent years, with the rapid development of the Internet of Things, large-scale botnet attacks have occurred frequently and have become an important challenge to network security. As artificial intelligence technology continues to evolve, intelligent detection solutions for botnets are constantly emerging. Although graph neural networks are widely used for botnet detection, directly handling large-scale botnet data becomes inefficient and challenging as the number of infected hosts increases and the network scale expands. Especially in the process of node level learning and inference, a large number of nodes and edges need to be processed, leading to a significant increase in computational complexity and posing new challenges to network security. This paper presents a novel approach that can accurately identify diverse intricate botnet architectures in extensive IoT networks based on the aforementioned circumstance. By utilizing GraphSAINT to process large-scale IoT botnet graph data, efficient and unbiased subgraph sampling has been achieved. In addition, a solution with enhanced information representation capability has been developed based on the Graph Isomorphism Network (GIN) for botnet detection. Compared with the five currently popular graph neural network (GNN) models, our approach has been tested on C2, P2P, and Chord datasets, and higher accuracy has been achieved.
1. Introduction
The Internet of Things (IoT) [1] refers to the technology that connects physical devices, sensors, software, and electronic devices through the Internet to enable communication, data exchange, and remote control. Due to the increasing demand for IoT connectivity and the emergence of IoT frameworks for large-scale traffic [2], alongside the growing demand for improving automation and data-driven decision-making, IoT devices have penetrated into various fields of the industry and society [3]. Industry experts predict a significant increase in the global deployment of IoT devices. It is anticipated that the worldwide quantity of IoT devices will achieve approximately 29 billion by the year 2030 [4] (Figure 1).
However, as the demand for IoT devices continues to increase, security issues have become increasingly severe. In 2022, the number of IoT vulnerabilities increased by 57% [5] compared to previous years, and in 2023, this trend continued with a high growth rate. In the first half of the year alone, the number of new vulnerabilities reached 641, with the majority targeting critical areas closely linked to the national economy and people’s livelihoods, such as energy and water conservation [6]. These vulnerabilities render IoT devices susceptible to malicious control by attackers, creating fertile ground for the formation of large-scale botnet [7]. The increasing infection of these devices with malicious applications and manipulation by attackers has led to a rapid spread of botnet nodes. This, in turn, has resulted in a variety of cybersecurity incidents, including DDoS assaults [8], which have caused significant damage to users of IoT devices. Consequently, efficiently identifying large-scale IoT botnet nodes has become a prominent research focus in academia as well as industry [9].
Botnets consist of a substantial quantity of compromised computers and represent a significant peril to IoT security [10]. Attackers use a variety of means to break into these computers as well as convert them into puppet hosts controlled by the attacker’s commands. As depicted in Figure 2, Once the attacker successfully infiltrates networked devices, botnet programs will be load onto these devices. After becoming part of botnet, these infected devices will regularly communicate with command and control servers, reporting device information to the controller and receiving control instructions for scanning the current network environment or updating malicious programs [11]. Ultimately, the attacker issues malicious attack instructions to launch attacks on IoT devices.
With the continuous development of complex and diversified network scenarios, the types of network security threats continue to increase, intensifying the harmfulness further. The means and methods become more covert and innovative, posing new and significant challenges to network information security defense measures [12]. According to a report from the CenturyLink Threat Research Laboratory, in the initial six months of 2019, they observed an average of 1.2 million malicious threats daily, an increase of nearly 200,000 compared to 2017, representing a growth of approximately 500%. Particularly noteworthy were the botnet threats, surpassing 18,000 per day [13]. NSFOCUS released the 2020 BOTNET Trend Report [14], which highlighted that IoT devices are still the primary target of various vulnerability attacks, and attackers exploit a wide range of vulnerabilities involving different types of devices and protocols. Botnets, as the “transmission tools” of viruses, are large attack platforms that have evolved from malicious software such as worms, Trojans, and backdoor tools. Hackers can utilize botnet platforms to control numerous hosts and carry out a series of large-scale attacks, including sensitive information theft, Bitcoin mining, tariff consumption, spam, etc., thereby doubling the harm caused by these attacks. Botnets possess an operational principle that results in their distinct qualities of rapid propagation, extensive infection scale, and formidable attack potency, rendering them a highly significant menace within the realm of network security [15]. Since Mirai [16] caused an eight-hour internet outage on the East Coast of the United States in 2016, subsequent botnet attacks have experienced an explosive growth. For example, in 2017, Reaper [17] infected about 10,000 devices every day; in 2018, BCMUPnPHunter [18] began to establish a proxy network for communication; in 2019, Pinkbot and Mozi infected a large number of devices respectively [19,20]; in 2021, Gafgyt_Tor [21] used the onion network for anonymous communication; in subsequent years, BlackMoon [22] and Dark Frost [23] appeared one after another, adopting more complex technical means. The proliferation of these Internet of Things (IoT) botnets has greatly enhanced the effectiveness of DDOS attacks, presenting a grave menace to the security of worldwide networks. In light of the increasing magnitude of IoT botnets, it is imperative to devise techniques that can promptly and effectively identify them. The majority of current botnet detection technologies depend on machine learning or deep learning techniques. Beigi et al. [24] investigated the efficacy of attributes such as source port, random reconnection, communication time, and protocol in detecting botnets. However, utilizing such attributes necessitates researchers possessing ample domain expertise and select the most efficient ones for trial. Deep learning [25] has advanced rapidly in the past decade. Due to its powerful representation learning ability, deep learning can discover informative features from complex representations and is particularly suitable for feature extraction in the field of botnet detection [26]. Using deep learning technology for botnet detection can free human experts from the tedious task of manually defining botnet characteristics, greatly improving detection accuracy while also saving a significant amount of time and cost [27]. As a form of deep learning, graph neural networks (GNNs) demonstrate strong adaptability in addressing botnet-related problems. In view of the complex relationships between entities that graphs can capture, the graph neural network is especially suited for describing intricate network structures and can effectively extract features and generalize, making it a potent tool for analyzing network behavior [28,29,30]. However, as the quantity of infected hosts within the botnet rises, the magnitude of the botnet will persistently grow, causing the complexity of the botnet topology to increase. Graph neural networks face challenges in handling large-scale graph data, such as high computational complexity and potential resource limitations when processing graphs with billions of nodes simultaneously [31]. Furthermore, the botnet detection methods based on GNNs lack considerations for graph isomorphism issues, failing to effectively capture information from neighboring nodes and analyze the relationships between nodes and their neighborhoods. Consequently, detection of large-scale graph data using graph neural networks still suffers from a relatively high false-positive rate.
In this study, a botnet detection method is proposed by utilizing the highly effective Graph Isomorphism Network. The method specifically focuses on identifying large-scale IoT botnet communities efficiently. To address inefficiencies in training GNN on large-scale graph data, we employ subgraph sampling through GraphSAINT [32] to preprocess the large graph data into easier-to-process subgraphs. To better enhance the model’s ability to generalize by leveraging information from neighboring nodes, the GIN [33] algorithm is employed. The GIN has a superior capability to capture adjacent nodes and express information. It is utilized to train and aggregate subgraphs for the purpose of detecting botnet attacks.
In brief, the paper’s main contributions can be outlined as follows:
- An efficient botnet detection solution is proposed for complex botnet structures in large-scale IoT networks. This scheme only needs to utilize the aggregated connection information of network traffic to achieve detection, which has high availability in actual deployment.
- We applied GraphSAINT to process large-scale IoT botnet graph data, achieving efficient and unbiased data processing. Furthermore, we developed a graph isomorphism network-based solution with enhanced information representation capabilities for botnet detection.
- Developed and tested with C2, P2P, and chord datasets, the prototype showcases exceptional accuracy, reaching 99.97%, surpassing existing graph-based models and botnet detection schemes that have been suggested in recent years.
The structure of this paper is as follows:
Section 2 reviews previous research results. Section 3 introduces relevant background knowledge and methods. Section 4 elaborates on the proposed solution. Section 5 introduces the evaluation metrics used in experiments. Section 6 describes the datasets and parameters used in experiments, and conducts detailed analyses of the experimental results. Finally, the conclusion is presented in Section 7.
2. Related Works
In this section, previous research and related works are discussed, covering research results in botnet detection based on machine learning, deep learning, and graph-based methods.
2.1. Machine Learning-Based Botnet Detection
In early research, the discovery and detection of botnets often relied on machine learning algorithms, including but not limited to k-means [34], support vector machines [35], and random forests [36]. Zeidanloo et al. [37] proposed a botnet detection framework that does not require any prior knowledge of the botnet domain. By using the k-means clustering method, this framework identifies similar communication patterns and behaviors among hosts in the main group of at least one malicious activity, thus detecting botnets. Bullard et al. [38] collected flow-based information, including but not limited to source positive address, destination positive address, source port, destination port, duration, which were subsequently used to detect individuals and host groups exhibiting similar behavior. Karasaridis et al. [39] devised a methodology based on k-means that utilizes a scalable, non-intrusive algorithm to scrutinize substantial volumes of network traffic data. Gu et al. [40] introduced BotHunter, a anomaly-based botnet detection system that is immune to the influence of botnet protocols and topology. BotHunter leverages the fundamental definition and attributes of botnets to identify similar harmful activities and patterns of command and control (C&C) communication. This solution is specifically used for traffic scanning and anomaly detection of load byte distribution, using clustering methods to find clusters with similar communication patterns. Amini et al. [41] employed traffic attributes such as IP, port, packet event time, and number of bytes per packet to scan data, set filtering rules based on network flow data, and use hierarchical clustering to obtain botnets. Azab et al. [42] utilized the Network Information Flow Analysis framework to extract a collection of network traffic attributes for the purpose of C&C channels and patterns in hostile traffic. Presently, botnet detection solutions that leverage machine learning typically necessitate a substantial understanding of the field and the use of expert knowledge for extracting features.
2.2. Deep Learning-Based Botnet Detection
Liu et al. [43] used damping increment statistics to extract the basic traffic characteristics of networked devices, and used the Minimum Component Analysis (MCA) algorithm based on Temporal Adaptive Module (TAM) to map the features onto images. Convolutional neural network (CNN) models were used to learn the dataset. This study mainly focuses on the final stage of botnets. Hence, to efficiently mitigate the harm inflicted by botnets, it is crucial for the detection model to possess a high level of real-time performance. However, this study has a high time cost and has not proven its ability to detect new types of attacks. Meidan et al. [44] introduced a IoT abnormal traffic detection scheme, which extracts statistical features of benign IoT traffic behavior snapshots and uses deep autoencoders to detect abnormal network traffic. This literature mainly focuses on detecting botnets from the perspective of benign traffic. The author deployed two types of IoT botnets in the laboratory: BASHLITE and Mirai, and extracted 23 features from five time windows, totaling 115 features. The extracted features may affect the performance of the model, and whether they are suitable for IoT devices in practical applications remains to be discussed. Javed et al. [45] introduced an artificial intelligence-based approach for identifying and detecting malicious network traffic. The researchers utilized subsets of the N-BaloT dataset to investigate the efficacy of MLP and ANN learning algorithms in accurately identifying the network traffic generated by Mirai and Bashlite botnets that were infected with botnets. The MLP model is susceptible to feature scaling and necessitates the adjustment of several hyperparameters, including the number of hidden layers, neurons, and iterations. This adjustment process can lead to significant processing expenses when dealing with intricate security models. Ge et al. [46] developed a feedforward neural network model that incorporates embedding layers to do multi-class classification, called the mFNN model, and used transfer learning to establish a feedforward neural network model for binary classification, called the bFNN model. The model’s performance was assessed using the BoT-IoT dataset, revealing a significant level of accuracy in classifying both binary and multiple categories. Present techniques for identifying botnet attacks using deep learning involve extracting characteristics of attack vectors, employing autoencoders to cluster the extracted characteristics, and utilizing RNN, BP, and other approaches for botnet identification. Nevertheless, the task of handling extensive data with multiple dimensions is intrinsically intricate and necessitates substantial computational resources and storage space.
2.3. Graph-Based Botnet Detection
Recently, some researchers have endeavored to identify botnets by analyzing their communication topology. Generally speaking, botnet detection methods based on graph analysis can effectively capture the topology, interaction behavior, and communication patterns [47] between hosts, and these methods are often more effective than flow-based methods. The utilization of graph-based technology, particularly GNN models, offers numerous benefits. It has the capability to accurately capture the intricate interaction connections between nodes, enhance the model’s ability to generalize, efficiently extract features, and decrease the need for manual feature engineering. GNNs have shown remarkable adaptability and processing capabilities, particularly when dealing with large-scale botnet attacks. Graph-based features are superior to flow-based features in identifying malicious attacks on botnets due to their ability to reduce the requirement for cross-comparing flows across datasets. Wang et al. [48] offer BotMark, an automated approach, for detecting botnets, which uses a combination of flow-based and graph-based analysis of network traffic characteristics. To overcome multi-architecture challenges and avoid complex control flow graph analysis, Nguyen et al. [49] propose PSI-Graph, a tool for detecting IoT botnets by extracting high-level functional graphs. Chowdhury et al. [50] examined seven graph-based characteristics that could potentially be linked to botnet operations. A self-organizing map (SOM) was utilized to create clusters of nodes using these graph properties, facilitating rapid identification of bot nodes. To model the interdependencies between botnet entities and learn the interaction behavior patterns among bots, Zhao et al. presented Bot-AHGCN [51], which constructs a multi-attribute heterogeneous information network. XG-BoT is a deep graph neural network model introduced by Lo et al. [52] for the purpose of detecting botnet nodes in a way that can be easily understood and explained. The model comprises a botnet detector and an explanation for automated forensics, facilitating the efficient identification of malicious botnet nodes in huge networks. Meng et al. [53] implemented a botnet detection model using GCN to deeply fuse traffic and topology features. Islam, R. et al. [54] proposed anomaly detection for industrial control LANs. Graph scale metrics such as the number of nodes, edges, degrees, and cycles are embedded into vectors. Subsequently, using chi-square testing, the discrepancy between the estimated normal distribution within a secure window and the distribution obtained within a test window is evaluated. If a significant difference is observed between these distributions, it may indicate abnormal network attack behavior. This research enhances the precision of identifying botnet nodes and broadens the utilization of graph neural networks in botnet detection by merging GraphSAINT and the GIN model.
3. Background and Materials
To illustrate our motivation, we first introduce the topology of botnets in this section. Next, a comprehensive explanation of the GraphSAINT and GNN algorithms is presented to facilitate comprehension of the following sections.
3.1. Botnet Architecture and Life Cycle
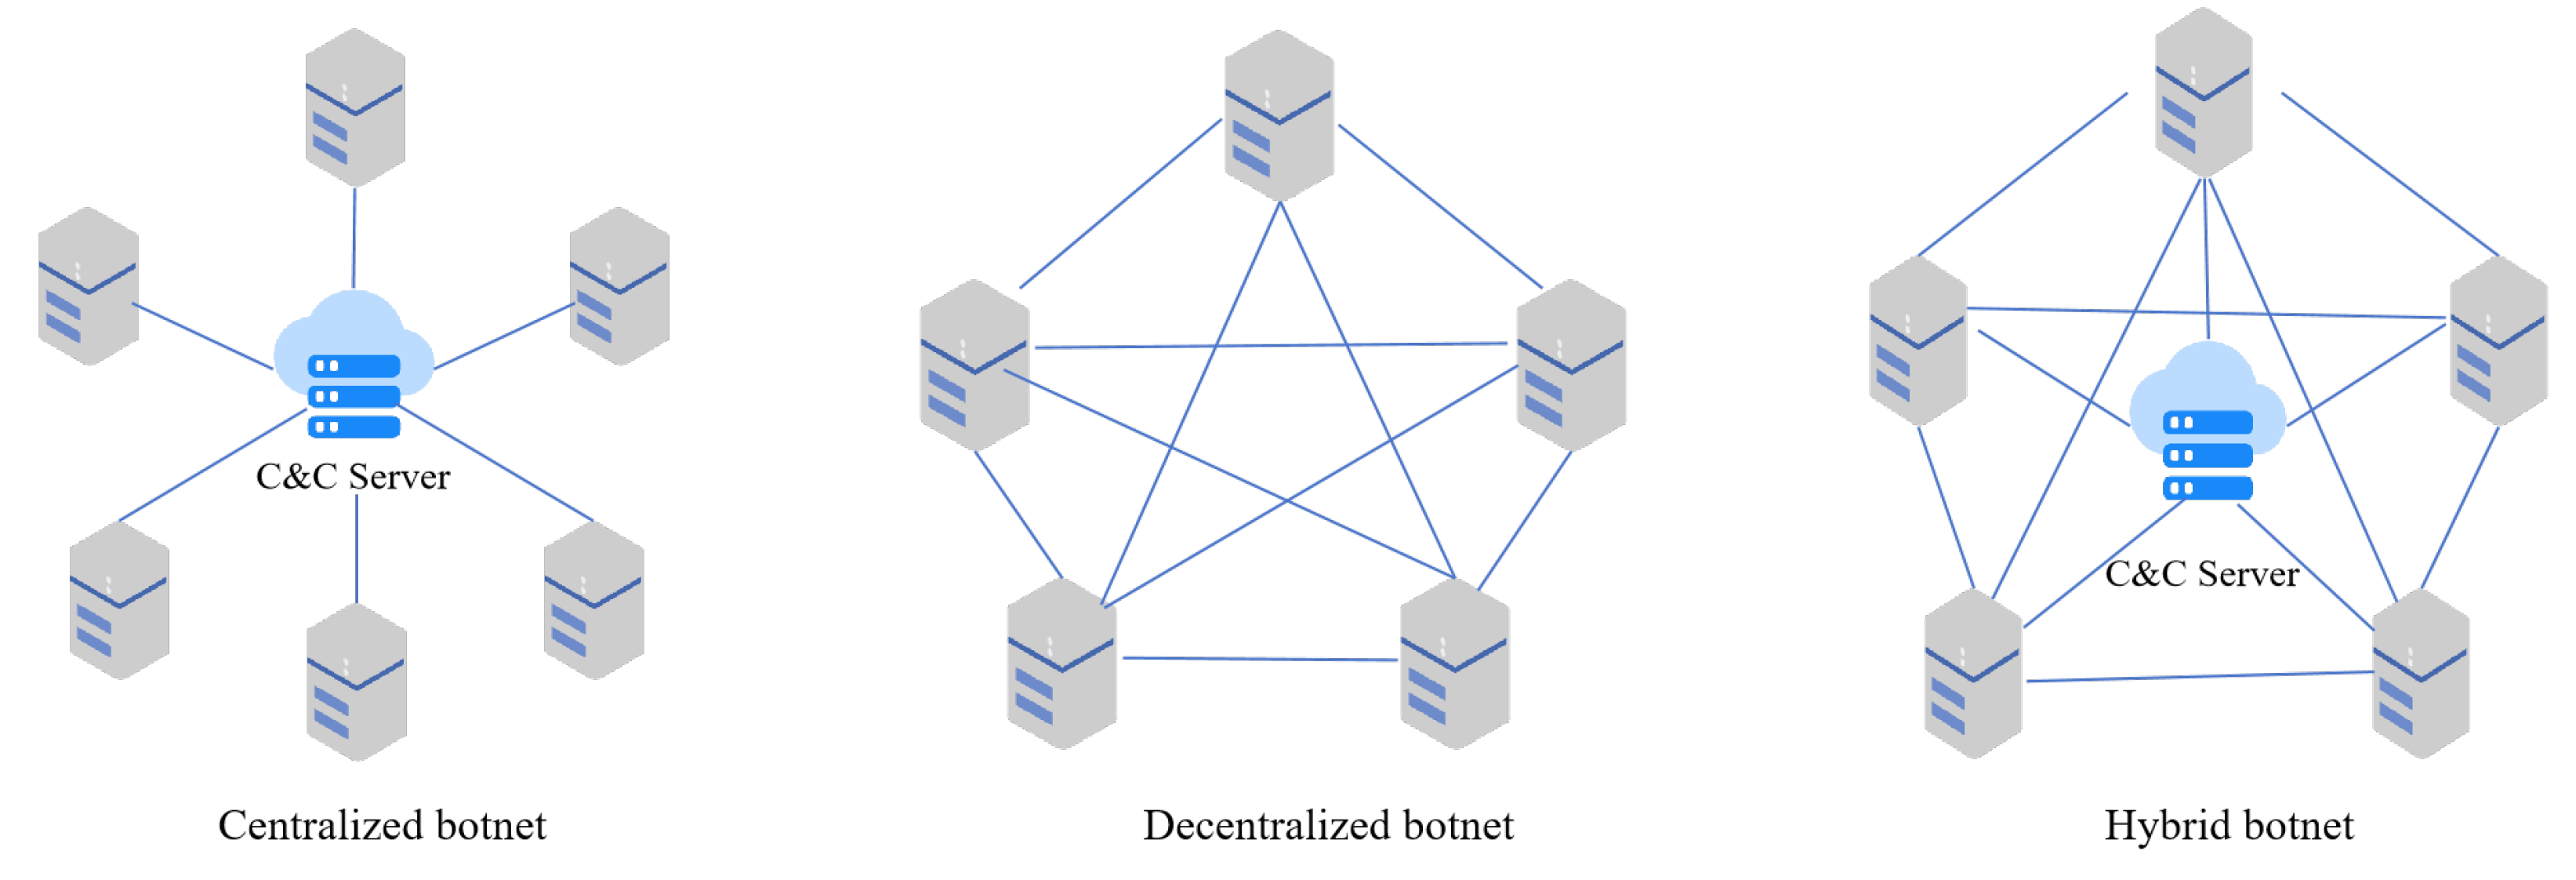
A botnet is a network created by infecting numerous hosts using one or more means of spreading, allowing the controller to have one-to-many control over the infected hosts. Figure 3 shows the botnet’s command and control architecture, which categorizes the three main methods of inputting data and instructions into the bot programs as either centralized [55], decentralized [56], or hybrid [57].
Different botnet architectures carry out different communications and behaviors, but generally speaking, the life cycle is similar and is generally divided into five stages [58]: the scanning and propagation stage, connection stage, latent stage, attack stage, maintenance and upgrade stage.
(1) Scanning and propagation stage: In this stage, attackers or botnets search for vulnerable and vulnerable devices on the Internet to obtain their permission control devices. After finding such devices, they infect them through various strategies. These strategies include using brute force or exploiting vulnerabilities, then downloading the necessary malware in the target host to control them, and the bot program runs on the target device, at which time the target device has become a botnet host. In order to prevent the botnet host from being harmed by other malware and prevent other malware from using the botnet host’s few resources, the botnet program often kills the malware.
(2) Connection stage: During this phase, the host of the botnet makes a connection with the C&C channel, thereby joining the botnet.
(3) Latent stage: In order to prevent the botnet host from being discovered, the bot will generally remain silent, try to make itself the same as normal traffic, evade detection by the anomaly detection system, and wait for instructions from the controller. The botnet host will occasionally communicate with the controller and send it the host’s status. Despite evasion techniques, traces of botnet communications will remain in the network environment.
(4) Attack stage: The botnet host receives instructions from the botnet controller to launch an attack.
(5) Maintenance and upgrade phase: The botnet hosts receive update and upgrade instructions from the botnet controller, with the purpose of maintaining these botnet hosts in order to evade detection, modify script errors, change C&C server information, add new functions, etc.
Facing the characteristics of complex and heterogeneous architecture, massive scale of controlled devices, flexible and diverse control methods, as well as the continuous emergence of new variants in IoT botnet networks, efficient detection of large-scale botnets is crucial to mitigate or eliminate the security threats posed by large-scale attacks.
3.2. GraphSAINT
GraphSAINT [32] is a sampling method for graph neural networks. Due to the computational and storage complexity of large-scale graph data, it is particularly difficult to process data by graph neural networks directly. GraphSAINT significantly reduces computational and storage requirements by selecting sampled subgraphs of the graph data for training. The calculations on each minibatch are performed on the sampling subgraphs, and the “neighbor explosion” phenomenon will not occur. At the same time, the proposed sampling method is theoretically unbiased and has minimum variance, which can better maintain the characteristics of node representation, reduce the variance caused by sampling, and improve the sampling efficiency and model training performance. In addition, this model decouples sampling and the GNN and can be combined with other GNN models based on the proposed sampling method. GraphSAINT uses a sampler to extract a graph from Graph G firstly and then constructs a graph neural network on that subgraph. By using the SAMPLE sampler and two regularization coefficients, unbiasedness and minimum variance are ensured.
In the sampling subgraph , the aggregation process of the GraphSAINT design node is shown in Formula (1). The aggregation method of GNN is redefined to eliminate the deviation caused by sampling:
is a parameter designed to aggregate regularization and eliminate bias; is a normalized adjacency matrix; is a l-layer aggregation parameter. is the sampling metric. If the edges between u and v have been sampled into a subgraph, it is 1; otherwise, it is 0 (provided that v has been sampled into a subgraph). By integrating , the numerical value is defined as the probability that the sampling metric has a value of 1, which is and can cause the two to cancel out in the expected value.
Due to the small number of variations represented by each node, the hidden state represented by all nodes in GraphSAINT adds up to a total estimator:
is the probability of a node being sampled, and division is used to avoid excessive influence from high probability nodes. Calculate the variance of this estimator and obtain the minimum variance (using an edge sampler as an example):
is the edge sampling probability, m is the number of node samples, b is the edge feature, is the adjacency matrix, and is the node representation. In order to enable the sampler to take a sample image before the training starts, the probability of the sampler is simplified as:
In general, GraphSAINT is a kind of graph neural network training method based on sampling graph. By analyzing the estimation bias and variance of the active output and loss on the minibatch, regularization and sampling methods are proposed to improve the training effect and overcome the problem of “neighbor explosion”.
3.3. Graph Neural Network
The graph neural network (GNN) is a neural network architecture that is similar to a convolutional neural network (CNN) but specifically designed to process irregular and unstructured graph input. The goal of the GNN is to acquire the representation of each node inside a graph, extract the nodes’ or graph’s characteristics over several layers, and subsequently utilize these final features in sub-models, such as a multi-layer perceptron, for modeling purposes. The GNN utilizes graph structure and iteratively updates node representations from node neighborhoods through convolutional operations or equivalent methods. Following k aggregation iterations, nodes are denoted by their transformed feature vectors, which encapsulate the structural details within the k-th neighborhood of the node to acquire the ultimate feature representation of the node or graph. Using to represent a graph, where the feature vector of node v in V is . The GNN utilizes the structure and node features of a graph to learn the feature vector of nodes in the graph and the representation of the entire graph, which follows a neighborhood aggregation strategy to update its node representation. The k-th layer of GNN [33] can be represented as:
Among them, is the feature vector of node v in the k-th layer, initialized using . is a neighboring node of node v. For graph-level tasks, an additional function is needed to aggregate node features to obtain graph-level features:
The key to the model lies in the specific selection of functions and , which directly affect the aggregation efficiency of the model. In 2019, Keyulu Xu et al. introduced the Graph Isomorphism Network (GIN) model [33], which is constructed based on the ideas of the WL test algorithm. Different from the traditional GNN model, the GIN can handle the isomorphism between nodes in the graph, which allows the model to better learn the global characteristics of the graph when the nodes are not numbered. In Formulas (6) and (7), the GIN captures neighborhood node information through the SUM aggregator and learns the node representation after k iterations through the multi-layer perceptron. The architecture of the GIN model is easy to extend, and it has been widely used in various graph data learning tasks. This article utilizes the GIN model to train and acquire the representation of individual nodes, derive the vector representation of the graph, and forecast the label category of the graph nodes. The particular usage information will be described in the Methodology section.
4. Methodology
4.1. Overview
In this section, a scheme for constructing botnet community detection is described, using GraphSAINT and the Graph Isomorphism Network (GIN). Figure 4 depicts the complete process of forward propagation. The process consists of the subsequent steps:
Step 1: Integrate the initial node embedding into the input model. Install network monitoring probes at designated places to get traffic data from monitoring devices. Extract the IP and other data characteristics from the traffic information and represent them as nodes and edges accordingly. Construct the graph data structure representation of the network traffic and carry out data preprocessing.
Step 2: During the model training phase, we employed a random edge sampler designed by GraphSAINT. This sampler randomly selects a subset of edges along with their connected nodes from the original graph, forming subgraphs, which are then utilized as training samples for gradient computation and updating model parameters. With the aid of GraphSAINT’s lightweight random edge sampler, we are able to train GNN models with more layers on smaller graphs, thereby accelerating the convergence speed of the model and consequently reducing both training time and cost. By using this meticulous sampling technique, large-scale graph data can be processed more easily by being divided into smaller chunks that are easier to handle and analyze.
Step 3: The processed subgraphs are input to the GIN module for training, which converts the input graph into node feature vectors and aggregates global graph information through multi-layer graph convolution operations. The advantage of the GIN is that it can effectively capture the relationships between nodes and global graph information.
Step 4: Finally, the node representations of each layer are summarized using the CONCAT function to obtain the representation of the entire graph, which is used for the final botnet detection.
4.2. Data Preprocessing
In the context of dataset analysis, a collection of network flows can be viewed as graph data, with each network host IP address representing graph nodes and network communication flows between hosts representing edges. The original dataset forms a non-attributed graph, with all nodes having a feature of one. Therefore, predicting node categories based solely on topological information presents a significant challenge. To accurately ascertain whether a node is a component of a botnet, it is crucial to take into account the labels assigned to the edges that link the nodes. Considering that a hacker has the ability to instruct all the controlled bot hosts in a botnet to simultaneously and persistently target a specific network, a significant discrepancy in traffic volume can be observed between malicious and benign nodes, especially when under attack. Correspondingly, the connection pattern of the edges on the node also varies significantly. During data preprocessing, the label of the edge is taken as a new node feature. The calculation method involves counting the number of benign and malicious edges connected to the node respectively, and subsequently dividing this sum by the node’s degree. The resultant normalized value is subsequently utilized as the node’s new feature. Overall, this preprocessing step is conducted to acquire the updated characteristics of the node.
4.3. Subgraph Sampling
In this article, GraphSAINT is used for subgraph sampling of large-scale botnet graph data. By leveraging GraphSAINT, the scalability of the model is ensured while improving the processing efficiency of large-scale graph data. GraphSAINT samples the entire graph multiple times and applies a graph neural network on the obtained subgraphs. In this paper, the GIN is used for training, and then the information from multiple subgraphs is fused together.
Firstly, we employ the random edge subgraph sampling algorithm described in Algorithm 1 to sample subgraphs from the graph. The number of sampled edges serves as an adjustable parameter, determining the scale of the resulting subgraphs. Given a large-scale graph G, we initially compute the sampling probability P for each edge in the edge set E (as indicated in line 3). Subsequently, based on these probabilities, we randomly extract m edges from the edge set E to obtain the subgraph’s edge set . The nodes involved in the subgraph’s edge set form the vertex set of the subgraph, where represents the subgraph induced from .
| Algorithm 1 Random edge subgraphs sampling algorithm by GraphSAINT |
|
4.4. Detection Based on GIN
In the task of detecting botnets, the graph representation of botnets is crucial information for neural network models to learn features. When classifying data from different graphs, it is essential to solve the problem of graph isomorphism. The GIN exhibits strong graph learning capabilities for addressing the graph isomorphism challenge. The botnet detection model proposed, based on the GIN, comprises fifteen GIN layers with node feature embedding and adjacency matrix embedding as inputs. Following the GINConv layer in each GIN layer are the Leaky ReLU activation, Batch Normalization, and Dropout layers. Node features are represented as an aggregation of the node’s own features and the activation values from the previous GIN layer, which are then fed into a multi-layer perceptron to update the nodes. Consequently, the feature update can be expressed using Formula (9).
Among them, MLP is multi-layer perceptron, k is the number of layers, and are parameters that can be learnable. The following layer in the GIN takes the feature representation of each node from the previous layer as input [33].
After obtaining the node feature representation in each layer of the GIN through Formula (9), the CONCAT function is used to connect representations learned in different iterations. The formula expression is shown in Formula (10).
To address the issue of early feature generalization, the GIN uses Jumping Knowledge Network [59] (JK-Net) to capture node representation information from all iterations. Figure 5 depicts a four-layer Jumping Knowledge Network, where represents the node features of the observed node, N.A. represents the neighborhood aggregation representation of the observed node, represents the node representation after the k-th iteration, represents the final representation vector of the graph structure, where G stands for the graph structure.
In this scheme, the loss is calculated through the cross-entropy loss function to achieve classification detection [60], and the formula is:
where contains the labels of all labeled nodes, represents the true label of node i, and denotes the final predicted result for node i.
5. Metrics
In this section, the metrics utilized in the subsequent experiment are presented in the following Table 1. We evaluated our model using accuracy, precision, recall, and F1 score. Accuracy serves as a metric for assessing the comprehensive performance of a classification model, while quantifies the degree of accuracy with which the model forecasts the positive class. Recall evaluates the model’s capacity to correctly identify positive instances, while the F1 score offers a comprehensive measure of the model’s accuracy and recall abilities. The metrics will be utilized to assess the model’s performance in the subsequent Experiment and Evaluation sections.
6. Experiments and Evaluation
To evaluate our model, we employed three publicly accessible botnet graph datasets, Chord, C2, and P2P [61], which exclusively comprise unattributed graphs. Since the node features in every graph are given a value of 1, the model can only determine the node categories by using the graph’s topological information. Botnets typically have more dense connections, allowing botnet nodes to access other botnet nodes in just a few hops. This particular pattern allows the model to efficiently discriminate between benign and botnet nodes. These datasets are derived from the original network flow data of the botnet dataset CTU-13 [62]. The background traffic in these datasets is derived from real-world scenarios, implying that the background traffic follows a distribution consistent with real-world traffic. Moreover, the botnet traffic in C2 and P2P datasets is extracted from real malicious traffic, while the botnet traffic in the Chord dataset is synthesized from malicious traffic samples. Consequently, we consider C2 and P2P as depicting real-world botnet scenarios, while Chord simulates botnet scenarios based on real-world conditions. Both botnet nodes and botnet topology patterns are represented in the graph structure data. The background traffic data were obtained from the Center for Applied Internet Data Analysis in 2018. The C2 and P2P datasets consist of graphs with around 3000 botnet nodes each, whereas the Chord dataset contains graphs with 10,000 botnet nodes each. In these three datasets, all graphs are non-distributed, which means the model can only export information from the graph topology. Table 2, Table 3 and Table 4 display the statistical data for the C2, P2P, and Chord datasets, respectively.
6.1. Setup
The studies were conducted on a Linux server equipped with two 24-core Intel(R) Xeon(R) Gold 5318Y processors, 256 GB of RAM, and a GPU called Ampere A800. We utilized Python 3.11, PyTorch 2.1.2, and PyTorch Geometric 2.4.0 to implement our model. Furthermore, we performed all experimental evaluations. In Table 5, the hyperparameters of our scheme are presented.
6.2. Comparative Experiment
The proposed method was evaluated on three datasets (C2, P2P and Chord) and compared with five baseline GNN works, namely GATv2, GraphSAGE, GCN, Cluster-GCN, and GraphGPS. The evaluation metrics used included precision, accuracy, F1 score, and recall. The results of the performance evaluation are displayed in Table 6.
According to the comparative results shown in Table 6, our model demonstrates outstanding performance across evaluation metrics, including precision, accuracy, F1 score, and recall. Compared to the reference models (GATv2, GraphSAGE, GCN, Cluster-GCN, and GraphGPS), our model exhibits significant advantages in several key metrics.
The proposed method achieves over 99% precision on all three datasets. On the C2 dataset, the precision is over 0.2 higher than GCN and over 0.001 higher than GraphSAGE. It is also higher than the latest graph-based model, GraphGPS. On the P2P dataset, the precision of the proposed method is 99.70%, which is only lower than GATv2’s 99.76% and Cluster-GCN’s 99.71%. On the Chord dataset, the proposed method’s precision is 99.82%, which is higher than GATv2, GCN, Cluster-GCN, and GraphGPS and is only 0.04% lower than GraphSAGE.
The proposed method exhibits stable performance in terms of accuracy, with accuracy exceeding 99.9% on all three datasets. Of particular note, our model performs better than the other five comparison models on both the C2 and P2P datasets, highlighting its excellent ability to correctly classify samples.
Futhermore, our proposed model also performs well on the F1 score and recall evaluation metrics. On all three datasets, the F1 score exceeded 99.7%, while the recall exceeded 99.8%. Compared with the baseline models, our model has improved performance on F1 score on all three datasets, especially on the P2P and Chord datasets. On the C2 dataset, although the proposed model’s recall is slightly (0.08%) lower than GraphSAGE, it still maintains excellent performance.
Surprisingly, as a latest graph-based model, GraphGPS, does not perform better on the botnet dataset than the model used in this article. This may be due to the dataset being composed of non attribute graphs, so the model only relies on topological information to infer node categories. Therefore, compared to GraphGPS with positional encoding, GNN models utilizing message passing mechanisms may be more suitable for this specific scenario.
In summary, although our model achieved SOTA results on multiple evaluation metrics, it did not achieve the optimal level of precision, especially on the C2 dataset. This may indicate a certain degree of bias in our prediction of positive classes, possibly due to imbalanced categories, model bias, or uneven distribution of errors, leading to a decrease in precision, which may be a potential drawback of our model that requires further analysis and improvement.
During the experimentation, it is observed that the GATv2 model consumes a significant amount of GPU memory during training, which may be attributed to its multi-head attention mechanism. Additionally, due to the lack of effective mitigation of neighborhood expansion problem by GATv2 (in order to calculate the loss on a specific node at layer L, it is necessary to have the embeddings of the neighbouring nodes at layer , which in turn depend on their embeddings at layer and the recursive embeddings in subsequent layers), it is unable to train a model with eight layers on the entire graph (reaching seven layers on the C2 dataset and six layers on the P2P and Chord datasets). Leveraging the random edge sampling technique of GraphSAINT, we can train deeper GATv2 models using small graphs sampled by the sampler. This also presents a new train of thought, whereby in scenarios where computational cost is not highly sensitive, sampling methods (such as GraphSAINT employed in this study) can be utilized to train larger-scale deep learning models.
We also record the changes in model losses on both the training and validation sets over time in Figure 6. It can be observed that, across all three datasets, the model losses gradually converge with increasing training time, which indicates that both the GIN model and GraphSAINT method employed ensure the model learns effective representations from the data.
Furthermore, the changes in model losses on the testing sets of the three datasets were also recorded as the number of model layers increased, as shown in Figure 7. Clearly, due to the distinct topological structures of the botnets in the C2, P2P, and Chord datasets, the model requires different numbers of layers for optimal detection capability: 9 layers of GIN are needed for the C2 dataset, 10 layers for the P2P dataset, and 14 layers for the Chord dataset. This phenomenon has prompted our contemplation, and we intend to explore the construction of graph neural network (GNN) models that can integrate neighbor information at different scales in future work. This approach aims to adaptively acquire features at various scales, rather than relying on complex model hyperparameters.
In our experiments, we employ GraphSAINT for random edge sampling and observe an intriguing phenomenon: there exists a threshold for the improvement of GNN model performance trained with GraphSAINT. In other words, the size of the extracted subgraph is not necessarily the larger, the better, but there exists an optimal sampling size that effectively helps the model capture key features in the data. To visually present this finding, we plotted the line chart as shown in Figure 8 below, where the horizontal axis represents the random edge sampling size (in units of 10k edges), and the vertical axis represents the model’s F1 score and accuracy on the Chord dataset. From the graph, it is evident that when the random edge sampling size is 800k edges, the model achieves the highest F1 score and accuracy, reaching 99.88% and 99.97%, respectively. As the sampling size increases or decreases, the model’s performance declines, further validating the impact of sampling size on model performance and corroborating our observations. We speculate that this might be due to the overfitting of the model or a decrease in training efficiency caused by the excessive subgraph size beyond the threshold, thereby affecting the final detection performance.
To better demonstrate the effectiveness of our proposed method, it is further compared with other related works in botnet detection. As shown in Table 7, we evaluate all these methods on the C2 dataset. In comparison experiments with other botnet detection studies, our technique is excitingly competitive. Our model achieves state-of-the-art performance on accuracy, recall, and F1 score, and it is over 20 times faster than the fastest method among the other methods. Therefore, our method is effective and promising. In future work, we will focus on enhancing the scalability and computational efficiency of the model and possibly reducing computational costs to address the issue of computational resource scarcity in edge computing devices, thereby achieving more efficient detection of IoT botnets.
7. Conclusions
This work proposes a scheme for detecting large-scale IoT botnets. To address the efficiency issue of GNN training on large-scale botnet data, GraphSAINT is used for subgraph sampling to convert large graph data into easy-to-process subgraphs. To optimize the utilization of message passing among neighbor nodes without causing gradient explosion, we employ the GIN to capture neighbouring nodes and represent information for the purpose of training and aggregating subgraphs to detect botnet network attacks. This solution outperforms the existing five GNN-based models in multiple indicators such as accuracy and recall. In comparison with other botnet detection methods, our method demonstrates exciting competitiveness on the C2 dataset, achieving state-of-the-art performance, more than 20 times faster than the other methods. In addition, we observed that data with different structures require different numbers of GIN layers to achieve optimal detection ability, which inspired us to explore the construction of graph neural network models that can integrate multi-scale in future work. This work is of great significance for solving the security issues of the Internet of Things and provides valuable experience for us to further research and optimize botnet detection models. In future research, the generalization ability of the model will be further validated, and its robustness will be enhanced to ensure that the model performs well in a wider and more complex real-world scenario, effectively resisting various challenges and attacks.
Author Contributions
Conceptualization, L.Y. and X.L.; methodology, X.L., W.C. and L.Y.; software, W.C. and H.Y.; validation, H.Y., W.C. and L.Y.; formal analysis, W.C. and L.Y.; investigation, H.Y. and W.C.; resources, L.Y., W.C. and X.L.; writing—original draft preparation, H.Y. and W.C.; writing—review and editing, X.L. and W.C.; visualization, H.Y.; supervision, L.Y.; project administration, X.L. All authors have read and agreed to the published version of the manuscript.
Funding
This work is in part supported by the National Key R&D Program of China (No. 2022YFB 3104100), the National Science Foundation of China (No. 62102109), and the Major Key Project of PCL (No. PCL2022A03).
Data Availability Statement
Publicly available datasets were analyzed in this study. Three datasets were used in this paper: P2P, C2, and Chord. For these datasets, please visit https://zenodo.org/records/3689089 (accessed on 25 March 2024).
Conflicts of Interest
The authors declare no conflicts of interest.
References
- Madakam, S.; Ramaswamy, R.; Tripathi, S. Internet of Things (IoT): A literature review. J. Comput. Commun. 2015, 3, 164–173. [Google Scholar] [CrossRef]
- Montazerolghaem, A.; Yaghmaee, M.H. Load-balanced and QoS-aware software-defined Internet of Things. IEEE Internet Things J. 2020, 7, 3323–3337. [Google Scholar] [CrossRef]
- Montazerolghaem, A. Software-defined Internet of Multimedia Things: Energy-efficient and Load-balanced Resource Management. IEEE Internet Things J. 2021, 9, 2432–2442. [Google Scholar] [CrossRef]
- Vailshery, L. Number of Internet of Things (IoT) Connected Devices Worldwide from 2019 to 2023, with Forecasts from 2022 to 2030. 2023. Available online: https://www.statista.com/statistics/1183457/iot-connected-devices-worldwide (accessed on 25 March 2024).
- Chinese Academy of Cyberspace Studies. The Construction of World Information Infrastructure. In World Internet Development Report 2022: Blue Book for World Internet Conference; Springer: Berlin/Heidelberg, Germany, 2023; pp. 59–81. [Google Scholar]
- Xiang, C.; Wu, C.; Liu, Q.; Zhou, S. Review of Research on Network Security Situation Prediction Technology. Comput. Appl. Softw. 2023, 40, 19–28+36. [Google Scholar]
- Djenna, A.; Harous, S.; Saidouni, D.E. Internet of things meet internet of threats: New concern cyber security issues of critical cyber infrastructure. Appl. Sci. 2021, 11, 4580. [Google Scholar] [CrossRef]
- Lohachab, A.; Karambir, B. Critical analysis of DDoS—An emerging security threat over IoT networks. J. Commun. Inf. Netw. 2018, 3, 57–78. [Google Scholar] [CrossRef]
- Burhan, M.; Alam, H.; Arsalan, A.; Rehman, R.A.; Anwar, M.; Faheem, M.; Ashraf, M.W. A comprehensive survey on the cooperation of fog computing paradigm-based iot applications: Layered architecture, real-time security issues, and solutions. IEEE Access 2023, 11, 73303–73329. [Google Scholar] [CrossRef]
- Koroniotis, N.; Moustafa, N.; Sitnikova, E. Forensics and deep learning mechanisms for botnets in internet of things: A survey of challenges and solutions. IEEE Access 2019, 7, 61764–61785. [Google Scholar] [CrossRef]
- Ghafir, I.; Svoboda, J.; Prenosil, V. A survey on botnet command and control traffic detection. Int. J. Adv. Comput. Netw. Its Secur. (IJCNS) 2015, 5, 75–80. [Google Scholar]
- Admass, W.S.; Munaye, Y.Y.; Diro, A. Cyber security: State of the art, challenges and future directions. Cyber Secur. Appl. 2023, 2, 100031. [Google Scholar] [CrossRef]
- Karanja, E.M.; Masupe, S.; Jeffrey, M.G. Analysis of internet of things malware using image texture features and machine learning techniques. Internet Things 2020, 9, 100153. [Google Scholar] [CrossRef]
- NSFOCUS. 2020 BOTNET Trend Report. Available online: https://www.nsfocus.com.cn/html/2021/136_0705/155.html (accessed on 25 March 2024).
- Xia, H.; Li, L.; Cheng, X.; Cheng, X.; Qiu, T. Modeling and analysis botnet propagation in social Internet of Things. IEEE Internet Things J. 2020, 7, 7470–7481. [Google Scholar] [CrossRef]
- Antonakakis, M.; April, T.; Bailey, M.; Bernhard, M.; Bursztein, E.; Cochran, J.; Durumeric, Z.; Halderman, J.A.; Invernizzi, L.; Kallitsis, M.; et al. Understanding the mirai botnet. In Proceedings of the 26th USENIX Security Symposium (USENIX Security 17), Vancouver, BC, Canada, 16–18 August 2017; pp. 1093–1110. [Google Scholar]
- Moriuchi, P.; Chohan, S. Mirai-variant IoT botnet used to target financial sector in January 2018. In Recorded Future Cyber Threat Analysis Report; Recorded Future: Boston, MA, USA, 2018; pp. 118–140. [Google Scholar]
- Porath, R. Internet, Cyber-Und IT-Sicherheit von AZ; Springer: Berlin/Heidelberg, Germany, 2020; pp. 154–196. [Google Scholar]
- 360Netlab. Pink, a Botnet That Competed with the Vendor to Control the Massive Infected Devices. 2021. Available online: https://blog.netlab.360.com/pink-en/ (accessed on 25 March 2024).
- Tu, T.F.; Qin, J.W.; Zhang, H.; Chen, M.; Xu, T.; Huang, Y. A comprehensive study of Mozi botnet. Int. J. Intell. Syst. 2022, 37, 6877–6908. [Google Scholar] [CrossRef]
- Motylinski, M.; MacDermott, Á.; Iqbal, F.; Shah, B. A GPU-based machine learning approach for detection of botnet attacks. Comput. Secur. 2022, 123, 102918. [Google Scholar] [CrossRef]
- Nadeem, A.; Hammerschmidt, C.; Gañán, C.H.; Verwer, S. Beyond labeling: Using clustering to build network behavioral profiles of malware families. In Malware Analysis Using Artificial Intelligence and Deep Learning; Springer: Berlin/Heidelberg, Germany, 2021; pp. 381–409. [Google Scholar]
- Cong, L.W.; Harvey, C.R.; Rabetti, D.; Wu, Z.Y. An Anatomy of Crypto-Enabled Cybercrimes; Technical Report; National Bureau of Economic Research: Cambridge, MA, USA, 2023. [Google Scholar]
- Beigi, E.B.; Jazi, H.H.; Stakhanova, N.; Ghorbani, A.A. Towards effective feature selection in machine learning-based botnet detection approaches. In Proceedings of the 2014 IEEE Conference on Communications and Network Security, San Francisco, CA, USA, 29–31 October 2014; IEEE: Hoboken, NJ, USA, 2014; pp. 247–255. [Google Scholar]
- LeCun, Y.; Bengio, Y.; Hinton, G. Deep learning. Nature 2015, 521, 436–444. [Google Scholar] [CrossRef] [PubMed]
- Liu, H.; Lang, B. Machine learning and deep learning methods for intrusion detection systems: A survey. Appl. Sci. 2019, 9, 4396. [Google Scholar] [CrossRef]
- Asharf, J.; Moustafa, N.; Khurshid, H.; Debie, E.; Haider, W.; Wahab, A. A review of intrusion detection systems using machine and deep learning in internet of things: Challenges, solutions and future directions. Electronics 2020, 9, 1177. [Google Scholar] [CrossRef]
- Zhang, B.; Li, J.; Chen, C.; Lee, K.; Lee, I. A practical botnet traffic detection system using gnn. In Proceedings of the Cyberspace Safety and Security: 13th International Symposium, CSS 2021, Virtual Event, 9–11 November 2021; Springer: Berlin/Heidelberg, Germany, 2022; pp. 66–78. [Google Scholar]
- Zhu, X.; Zhang, Y.; Zhang, Z.; Guo, D.; Li, Q.; Li, Z. Interpretability evaluation of botnet detection model based on graph neural network. In Proceedings of the IEEE INFOCOM 2022-IEEE Conference on Computer Communications Workshops (INFOCOM WKSHPS), New York, NY, USA, 2–5 May 2022; IEEE: Hoboken, NJ, USA, 2022; pp. 1–6. [Google Scholar]
- Carpenter, J.; Layne, J.; Serra, E.; Cuzzocrea, A. Detecting botnet nodes via structural node representation learning. In Proceedings of the 2021 IEEE International Conference on Big Data (Big Data), Orlando, FL, USA, 15–18 December 2021; IEEE: Hoboken, NJ, USA, 2021; pp. 5357–5364. [Google Scholar]
- Bilot, T.; El Madhoun, N.; Al Agha, K.; Zouaoui, A. Graph neural networks for intrusion detection: A survey. IEEE Access 2023, 11, 49114–49139. [Google Scholar] [CrossRef]
- Zeng, H.; Zhou, H.; Srivastava, A.; Kannan, R.; Prasanna, V. Graphsaint: Graph sampling based inductive learning method. arXiv 2019, arXiv:1907.04931. [Google Scholar]
- Xu, K.; Hu, W.; Leskovec, J.; Jegelka, S. How powerful are graph neural networks? arXiv 2018, arXiv:1810.00826. [Google Scholar]
- Hartigan, J.A.; Wong, M.A. Algorithm AS 136: A k-means clustering algorithm. J. R. Stat. Society. Ser. C (Appl. Stat.) 1979, 28, 100–108. [Google Scholar] [CrossRef]
- Cortes, C.; Vapnik, V. Support-vector networks. Mach. Learn. 1995, 20, 273–297. [Google Scholar] [CrossRef]
- Chen, R.; Niu, W.; Zhang, X.; Zhuo, Z.; Lv, F. An effective conversation-based botnet detection method. Math. Probl. Eng. 2017, 2017, 4934082. [Google Scholar] [CrossRef]
- Zeidanloo, H.R.; Manaf, A.B.; Vahdani, P.; Tabatabaei, F.; Zamani, M. Botnet detection based on traffic monitoring. In Proceedings of the 2010 International Conference on Networking and Information Technology, Manila, Philippines, 11–12 June 2010; IEEE: Hoboken, NJ, USA, 2010; pp. 97–101. [Google Scholar]
- Bullard, C. Audit Record Generation and Utilization System (Argus). 2018. Available online: https://www.qosient.com/argus/index.shtml (accessed on 25 March 2024).
- Karasaridis, A.; Rexroad, B.; Hoeflin, D.A. Wide-Scale Botnet Detection and Characterization. In Proceedings of the first conference on First Workshop on Hot Topics in Understanding Botnets, Cambridge, MA, USA, 10 April 2007. [Google Scholar]
- Gu, G.; Porras, P.A.; Yegneswaran, V.; Fong, M.W.; Lee, W. Bothunter: Detecting malware infection through ids-driven dialog correlation. In Proceedings of the USENIX Security Symposium, Boston, MA, USA, 6–10 August 2007; Volume 7, pp. 1–16. [Google Scholar]
- Amini, P.; Azmi, R.; Araghizadeh, M. Botnet detection using NetFlow and clustering. Adv. Comput. Sci. Int. J. 2014, 3, 139–149. [Google Scholar]
- Azab, A.; Alazab, M.; Aiash, M. Machine learning based botnet identification traffic. In Proceedings of the 2016 IEEE Trustcom/BigDataSE/ISPA, Tianjin, China, 23–26 August 2016; IEEE: Hoboken, NJ, USA, 2016; pp. 1788–1794. [Google Scholar]
- Liu, J.; Liu, S.; Zhang, S. Detection of IoT botnet based on deep learning. In Proceedings of the 2019 Chinese Control Conference (CCC), Guangzhou, China, 27–30 July 2019; IEEE: Hoboken, NJ, USA, 2019; pp. 8381–8385. [Google Scholar]
- Meidan, Y.; Bohadana, M.; Mathov, Y.; Mirsky, Y.; Shabtai, A.; Breitenbacher, D.; Elovici, Y. N-baiot—Network-based detection of iot botnet attacks using deep autoencoders. IEEE Pervasive Comput. 2018, 17, 12–22. [Google Scholar] [CrossRef]
- Javed, Y.; Rajabi, N. Multi-layer perceptron artificial neural network based IoT botnet traffic classification. In Proceedings of the Future Technologies Conference (FTC) 2019, San Francisco, CA, USA, 24–25 October 2019; Springer: Berlin/Heidelberg, Germany, 2020; Volume 1, pp. 973–984. [Google Scholar]
- Ge, M.; Syed, N.F.; Fu, X.; Baig, Z.; Robles-Kelly, A. Towards a deep learning-driven intrusion detection approach for Internet of Things. Comput. Netw. 2021, 186, 107784. [Google Scholar] [CrossRef]
- Alharbi, A.; Alsubhi, K. Botnet detection approach using graph-based machine learning. IEEE Access 2021, 9, 99166–99180. [Google Scholar] [CrossRef]
- Wang, W.; Shang, Y.; He, Y.; Li, Y.; Liu, J. BotMark: Automated botnet detection with hybrid analysis of flow-based and graph-based traffic behaviors. Inf. Sci. 2020, 511, 284–296. [Google Scholar] [CrossRef]
- Nguyen, H.T.; Ngo, Q.D.; Le, V.H. A novel graph-based approach for IoT botnet detection. Int. J. Inf. Secur. 2020, 19, 567–577. [Google Scholar] [CrossRef]
- Chowdhury, S.; Khanzadeh, M.; Akula, R.; Zhang, F.; Zhang, S.; Medal, H.; Marufuzzaman, M.; Bian, L. Botnet detection using graph-based feature clustering. J. Big Data 2017, 4, 1–23. [Google Scholar] [CrossRef]
- Zhao, J.; Liu, X.; Yan, Q.; Li, B.; Shao, M.; Peng, H. Multi-attributed heterogeneous graph convolutional network for bot detection. Inf. Sci. 2020, 537, 380–393. [Google Scholar] [CrossRef]
- Lo, W.W.; Kulatilleke, G.; Sarhan, M.; Layeghy, S.; Portmann, M. XG-BoT: An explainable deep graph neural network for botnet detection and forensics. Internet Things 2023, 22, 100747. [Google Scholar] [CrossRef]
- Xiaoyuan, M.; Bo, L.; Liu, Y.; Yan, Y. Deep fused flow and topology features for botnet detection basing on pretrained GCN. arXiv 2023, arXiv:2307.10583. [Google Scholar]
- Islam, R.; Refat, R.U.D.; Yerram, S.M.; Malik, H. Graph-based intrusion detection system for controller area networks. IEEE Trans. Intell. Transp. Syst. 2020, 23, 1727–1736. [Google Scholar] [CrossRef]
- O’Meara, K.; Shick, D.; Spring, J.; Stoner, E. Malware Capability Development Patterns Respond to Defenses: Two Case Studies; White Paper; Software Engineering Institute, Carnegie Mellon University: Pittsburgh, PA, USA, 2016; pp. 1–11. [Google Scholar]
- Binsalleeh, H.; Ormerod, T.; Boukhtouta, A.; Sinha, P.; Youssef, A.; Debbabi, M.; Wang, L. On the analysis of the zeus botnet crimeware toolkit. In Proceedings of the 2010 Eighth International Conference on Privacy, Security and Trust, Ottawa, ON, Canada, 17–19 August 2010; IEEE: Hoboken, NJ, USA, 2010; pp. 31–38. [Google Scholar]
- Wang, P.; Sparks, S.; Zou, C.C. An advanced hybrid peer-to-peer botnet. IEEE Trans. Dependable Secur. Comput. 2008, 7, 113–127. [Google Scholar] [CrossRef]
- Xing, Y.; Shu, H.; Zhao, H.; Li, D.; Guo, L. Survey on botnet detection techniques: Classification, methods, and evaluation. Math. Probl. Eng. 2021, 2021, 6640499. [Google Scholar] [CrossRef]
- Xu, K.; Li, C.; Tian, Y.; Sonobe, T.; Kawarabayashi, K.I.; Jegelka, S. Representation learning on graphs with jumping knowledge networks. In Proceedings of the International Conference on Machine Learning, Stockholm, Sweden, 10–15 July 2018; pp. 5453–5462. [Google Scholar]
- Kipf, T.N.; Welling, M. Semi-supervised classification with graph convolutional networks. arXiv 2016, arXiv:1609.02907. [Google Scholar]
- Zhou, J.; Xu, Z.; Rush, A.M.; Yu, M. Automating botnet detection with graph neural networks. arXiv 2020, arXiv:2003.06344. [Google Scholar]
- Garcia, S.; Grill, M.; Stiborek, J.; Zunino, A. An empirical comparison of botnet detection methods. Comput. Secur. 2014, 45, 100–123. [Google Scholar] [CrossRef]
- Brody, S.; Alon, U.; Yahav, E. How attentive are graph attention networks? arXiv 2021, arXiv:2105.14491. [Google Scholar]
- Hamilton, W.; Ying, Z.; Leskovec, J. Inductive representation learning on large graphs. Adv. Neural Inf. Process. Syst. 2017, 30, 1–11. [Google Scholar]
- Chiang, W.L.; Liu, X.; Si, S.; Li, Y.; Bengio, S.; Hsieh, C.J. Cluster-gcn: An efficient algorithm for training deep and large graph convolutional networks. In Proceedings of the 25th ACM SIGKDD International Conference on Knowledge Discovery & Data Mining, Anchorage, AK, USA, 4–8 August 2019; pp. 257–266. [Google Scholar]
- Rampášek, L.; Galkin, M.; Dwivedi, V.P.; Luu, A.T.; Wolf, G.; Beaini, D. Recipe for a general, powerful, scalable graph transformer. Adv. Neural Inf. Process. Syst. 2022, 35, 14501–14515. [Google Scholar]
Figure 1.
Evolution of the number of global IoT devices from 2019 to 2021 and predicted trends up to 2030.
Figure 1.
Evolution of the number of global IoT devices from 2019 to 2021 and predicted trends up to 2030.

Figure 2.
The process of botnet attack activity.

Figure 3.
Botnet architecture.

Figure 4.
Overview of the proposed scheme.

Figure 5.
Example of Jumping Knowledge Network.

Figure 6.
The Train/Val Loss Curves of our model on 3 datasets.

Figure 7.
Layer-Loss Curves of our GIN model on 3 datasets.

Figure 8.
Variation of model performance with random edge sampling size on Chord dataset using GraphSAINT.
Figure 8.
Variation of model performance with random edge sampling size on Chord dataset using GraphSAINT.


Table 1.
Metrics.
| Metrics Name | Instruction |
|---|---|
| TP | The number of malicious nodes predicted as malicious |
| FP | The number of benign nodes predicted as malicious |
| TN | The number of benign nodes predicted as benign |
| FN | The number of malicious nodes predicted as benign |
| Accuracy | |
| Precision | |
| Recall | |
| F1 Score |
Table 2.
Botnet dataset statistics of C2.
| Dataset Split | Graph | Avg Nodes | Avg Edges | Avg Botnet Nodes |
|---|---|---|---|---|
| Train | 768 | 143,895 | 813,237 | 3211 |
| Val | 96 | 143,763 | 812,955 | 3234 |
| Test | 96 | 144,051 | 814,003 | 3175 |
Table 3.
Botnet dataset statistics of P2P.
| Dataset Split | Graph | Avg Nodes | Avg Edges | Avg Botnet Nodes |
|---|---|---|---|---|
| Train | 768 | 143,895 | 1,623,217 | 3090 |
| Val | 96 | 143,763 | 1,622,620 | 3093 |
| Test | 96 | 144,051 | 1,624,948 | 3095 |
Table 4.
Botnet dataset statistics of Chord.
| Dataset Split | Graph | Avg Nodes | Avg Edges | Avg Botnet Nodes |
|---|---|---|---|---|
| Train | 768 | 143,895 | 1,502,748 | 10,000 |
| Val | 96 | 143,763 | 1,502,284 | 10,000 |
| Test | 96 | 144,051 | 1,504,310 | 10,000 |
Table 5.
The hyperparameter values employed in the proposed scheme.
| Hyperparameter | Values |
|---|---|
| Layers | 15 |
| Hidden Channels | 128 |
| Dropout | [0.1, 0.2] |
| Activation Function | LeakyReLU |
| Learning Rate | 3 × |
| Weight Decay | 3 × |
| Optimizer | Adam |
| Scheduler | ReduceLROnPlateau |
Table 6.
Comparison with other GNN-based models on different datasets.
| Model | Dataset | Precision | Accuracy | F1 Score | Recall |
|---|---|---|---|---|---|
| GATv2 [63] | C2 | 0.9973 | 0.9996 | 0.9970 | 0.9967 |
| P2P | 0.9976 | 0.9996 | 0.9963 | 0.9950 | |
| Chord | 0.9921 | 0.9915 | 0.9685 | 0.9915 | |
| GraphSAGE [64] | C2 | 0.9946 | 0.9996 | 0.9970 | 0.9995 |
| P2P | 0.9954 | 0.9996 | 0.9970 | 0.9987 | |
| Chord | 0.9986 | 0.9986 | 0.9949 | 0.9986 | |
| GCN [60] | C2 | 0.7540 | 0.9786 | 0.8311 | 0.9881 |
| P2P | 0.7860 | 0.9839 | 0.8593 | 0.9901 | |
| Chord | 0.9980 | 0.9970 | 0.9882 | 0.9788 | |
| Cluster-GCN [65] | C2 | 0.9966 | 0.9993 | 0.9974 | 0.9983 |
| P2P | 0.9971 | 0.9992 | 0.9973 | 0.9983 | |
| Chord | 0.9970 | 0.9997 | 0.9974 | 0.9978 | |
| GraphGPS [66] | C2 | 0.9956 | 0.9989 | 0.9954 | 0.9989 |
| P2P | 0.9956 | 0.9994 | 0.9963 | 0.9970 | |
| Chord | 0.9963 | 0.9993 | 0.9976 | 0.9985 | |
| Our Approach | C2 | 0.9965 | 0.9997 | 0.9976 | 0.9987 |
| P2P | 0.9970 | 0.9998 | 0.9985 | 0.9991 | |
| Chord | 0.9982 | 0.9997 | 0.9988 | 0.9991 |
Table 7.
Comparison with other botnet detection methods on the C2 dataset.
| Method | Accuracy | Recall | F1 Score | Time |
|---|---|---|---|---|
| Wang et al. [48] | 0.9698 | 0.8823 | 0.8333 | 21.230 s |
| Alharbi et al. [47] | 0.9779 | 0.8176 | 0.8534 | 46.333 s |
| Chen et al. [36] | 0.8884 | 0.7810 | 0.8226 | 0.627 s |
| Meng et al. [53] | 0.9885 | 0.9290 | 0.9276 | 1.997 s |
| Ours | 0.9997 | 0.9996 | 0.9980 | 0.02 s |
Disclaimer/Publisher’s Note: The statements, opinions and data contained in all publications are solely those of the individual author(s) and contributor(s) and not of MDPI and/or the editor(s). MDPI and/or the editor(s) disclaim responsibility for any injury to people or property resulting from any ideas, methods, instructions or products referred to in the content. |
© 2024 by the authors. Licensee MDPI, Basel, Switzerland. This article is an open access article distributed under the terms and conditions of the Creative Commons Attribution (CC BY) license (https://creativecommons.org/licenses/by/4.0/).
Share and Cite
MDPI and ACS Style
Yin, L.; Chen, W.; Luo, X.; Yang, H. Efficient Large-Scale IoT Botnet Detection through GraphSAINT-Based Subgraph Sampling and Graph Isomorphism Network. Mathematics 2024, 12, 1315. https://doi.org/10.3390/math12091315
AMA Style
Yin L, Chen W, Luo X, Yang H. Efficient Large-Scale IoT Botnet Detection through GraphSAINT-Based Subgraph Sampling and Graph Isomorphism Network. Mathematics. 2024; 12(9):1315. https://doi.org/10.3390/math12091315
Chicago/Turabian StyleYin, Lihua, Weizhe Chen, Xi Luo, and Hongyu Yang. 2024. "Efficient Large-Scale IoT Botnet Detection through GraphSAINT-Based Subgraph Sampling and Graph Isomorphism Network" Mathematics 12, no. 9: 1315. https://doi.org/10.3390/math12091315
Note that from the first issue of 2016, this journal uses article numbers instead of page numbers. See further details here.