
The San Francisco MSM Epidemic: A Retrospective Analysis

Natural Sciences and Mathematics, Stockton University, 101 Vera King Farris Drive, Galloway, NJ 08205-9441, USA
*
Author to whom correspondence should be addressed.
†
This author contributed equally to this work.
Mathematics 2015, 3(4), 1083-1094; https://doi.org/10.3390/math3041083
Submission received: 30 July 2015
/
Accepted: 13 November 2015
/
Published: 24 November 2015
(This article belongs to the Special Issue Optimal Control and Management of Infectious Diseases)
Abstract
:We investigate various scenarios for ending the San Francisco MSM (men having sex with men) HIV/AIDS epidemic (1978–1984). We use our previously developed model and explore changes due to prevention strategies such as testing, treatment and reduction of the number of contacts. Here we consider a “what-if” scenario, by comparing different treatment strategies, to determine which factor has the greatest impact on reducing the HIV/AIDS epidemic. The factor determining the future of the epidemic is the reproduction number ; if , the epidemic is stopped. We show that treatment significantly reduces the total number of infected people. We also investigate the effect a reduction in the number of contacts after seven years, when the HIV/AIDS threat became known, would have had in the population. Both reduction of contacts and treatment alone, however, would not have been enough to bring below one; but when combined, we show that the effective becomes less than one, and therefore the epidemic would have been eradicated.
1. Introduction
The HIV/AIDS epidemic has had a devastating effect worldwide. To date, 1.7 million Americans have been infected with the disease [1]. San Francisco has remained amongst the top US cities with one of the highest incidence rate of HIV/AIDS since the beginning of the epidemic. MSM (men having sex with men) account for approximately three quarters of the total cases of HIV/AIDS in San Francisco’s history [2]. It is largely assumed that the San Francisco MSM HIV/AIDS epidemic began in 1978 with the first diagnosed case in 1981, at a time when not much was known about the disease.
In our previous publication [3], we developed a differential-equations model for the spread of the disease in San Francisco, and computed the reproduction number, , to be extremely high, over 42. In this paper we use the model to investigate various alternative scenarios that could have driven below 1, thus stopping the epidemic.
HIV testing did not begin until 1985, and antiretroviral treatment (ART) was not approved for treatment until 1987 [1]. Recent studies have shown that while receiving treatment, an individual’s infectivity significantly decreases ([4,5,6,7]). We determine by how much would have been reduced if testing and treatment had been available when the epidemic started in San Francisco. We also consider the reduction of if the number of contacts had been reduced. As men became aware of the disease, reduction in behavior likely occurred. We show that a combination of treatment and reduction in the number of contacts, would have achieved the goal of reducing below 1, and consequently stopping the HIV/AIDS epidemic.
2. The Early San Francisco MSM HIV/AIDS Epidemic with Testing and Treatment
In our previous published paper [3], we derived a model of the early San Francisco HIV/AIDS epidemic (1978–1984) with the addition of testing and treatment. This model is an extension of the model in [8]. The model uses the longitudinal San Francisco City Clinic Cohort (SFCCC) data set detailed in [9,10,11,12], which documents the onset the HIV/AIDS epidemic in San Francisco.
There has been a shift in strategy in the treatment of HIV-infected individuals. Until recently, guidelines for the developed world suggested that, in the absence of an AIDS-defining illness, treatment should start when CD4 levels are between 200 and 350 cells per microliter [13,14]. A shift in this strategy is to diagnose all HIV-infected people as soon as possible after infection and provide them with antiretrovirals (ART) when their levels of CD4 cells are higher [15] . In May of 2011 a multinational study, led by a University of Carolina-Chapel Hill scientist, proved that early treatment dramatically reduces the likelihood of transmitting the virus ([4,5,6,7]). Granich et al. [16] investigated the effect of universal voluntary HIV testing and immediate treatment with ART in a heterosexual epidemic and examined the conditions under which the epidemic could be driven towards elimination. Frequent testing has been extremely effective in keeping Cuba’s HIV prevalence rate one of the lowest in the world [17]. Cuba has a well-developed health care system that assigns a primary care physician to all citizens and conducts routine surveillance for infectious diseases ([18,19]). Individuals are tested for HIV/AIDS during a regular routine check-up. Infected persons are also found through a “blind” search of blood donors, pregnant women, persons with other sexually transmitted diseases, etc. [20]. Once an individual is identified as being infected, there is a search of seropositives through the sexual contacts of these HIV-positive individuals. This system is called contact tracing. Through aggressive testing and contact tracing, Cuba has kept the prevalence rate to 0.3 [21]. We conduct a similar “what-if” study for the SFCCC epidemic. We model the SFCCC with the addition of treatment to investigate the effect on what the epidemic would have become.
2.1. The SFCCC Model with Treatment
For a typical untreated individual who is infected with HIV, his or her infectivity varies with the stage of the infection. The disease can be described as passing through three stages: primary, latent, and symptomatic. These are characterized by significantly different blood viral levels and average durations. First comes a period of primary infection (lasting part of a year). Our “primary infectious stage” is defined as the time soon after initial infection, when infectiousness first rises and then drops. Seroconversion, the period of time during which HIV antibodies develop and become detectable, typically occurs well before the end of our primary stage. One then enters into an asymptomatic period (averaging 7–8 years without treatment), in which infectiousness is very low, followed by a symptomatic stage (averaging three years until death without treatment), where infectiousness rises again. The symptomatic stage begins while individuals are relatively healthy and active, though it also includes the more severe AIDS phase. These average times are based on SFCCC data [22].
In our model, the San Francisco MSM population is separated into six different groups, based on the number of contacts they had per year. The top 10% of the population had 231 contacts per year; the next 15% had, on average, 81 contacts per year, and so on, until a sixth group, which is not sexually active. If we define the average number of yearly contacts of an individual in the ith group, for the San Francisco MSM population we obtained [8,9,23]
The percentage of the total population in the ith group is given by:
these data are essentially from Hethcote and Van Ark’s HIV Transmission and AIDS study in the United States [23].
The top 10% of the population, referred to as the core, are significantly more active than the rest of the population. The core caused nearly 83% of the infections for the San Francisco MSM HIV/AIDS epidemic [8].
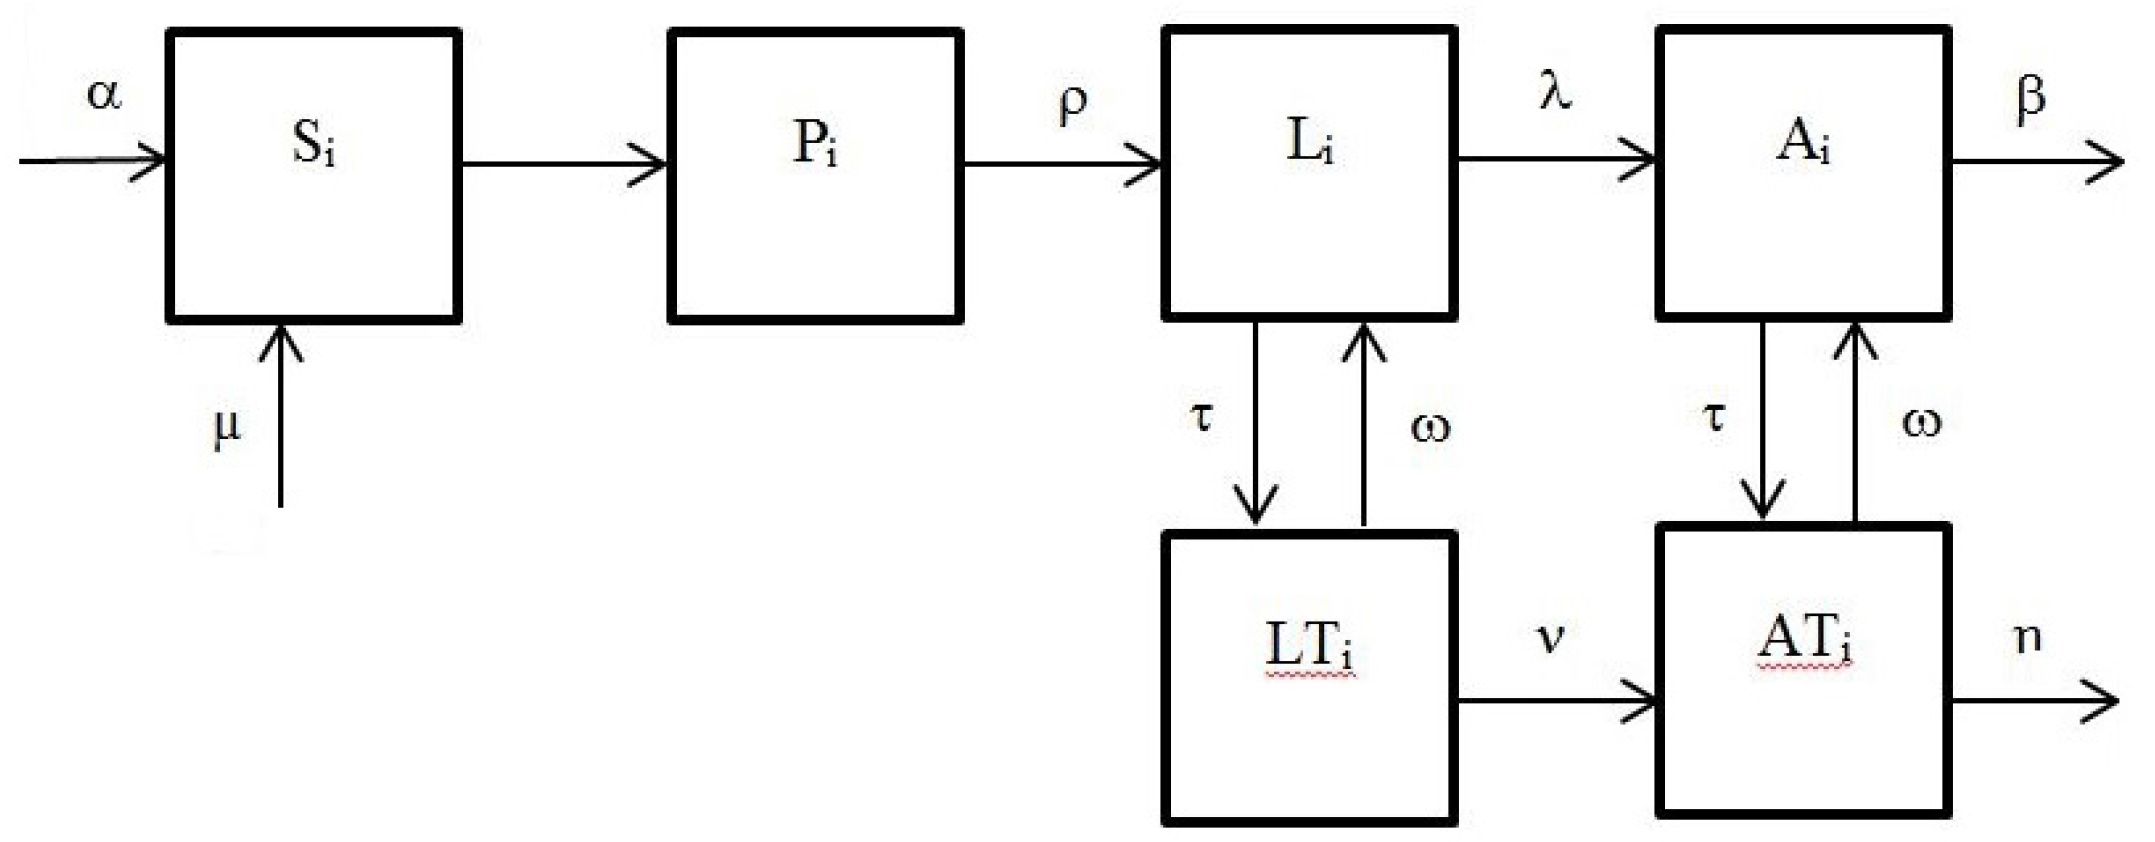
A schematic representation of the model for the ith group, , is in Figure 1.
Figure 1.
The San Francisco City Clinic Cohort (SFCCC) model with testing and treatment.

The variables are as follows:
- is the portion of susceptible individuals in the ith group;
- , the portion of individuals in the primary stage;
- , the portion of individuals in the latent stage;
- , the portion of individuals in the latent stage receiving treatment;
- , the portion of those who have fully developed AIDS; and
- , the portion of those who have fully developed AIDS receiving treatment
Individuals exit the system (they die) with rates β (for the HIV-AIDS group) and η (for the treated HIV-AIDS group). To keep a constant population, our model assumes new individuals enter the system with rates α (proportional to the untreated group ) and μ (proportional to the treated group ). Individuals opt into treatment with rate τ; we also consider the case of individuals opting out of treatment (with rate ω), and re-entering the corresponding non-treated populations groups.
The corresponding system of differential equations is as follows:
where .
The constants are the infectivity coefficients of the stages , , and respectively, while are the transition coefficients; we assume that they are the same for each group. We picked:
The values of the infectivities are the best fit infectivities for the SFCCC epidemic data [9]. These values were calculated in [8]; the optimal values calculated for SFCCC model were:
The infectivity coefficients for the treatment groups, assumed to be the same for all groups, were chosen as:
we also set , , ,
2.2. Constant Population Assumption. The Reduced Model
Since the U.S. Census does not collect data about sexual identity, no solid data is available about the San Francisco MSM population [24]. Using available estimates, it appears that the San Francisco MSM population did not change significantly since 1978. Thus, for example, the MSM population in San Francisco was estimated as 66,000 in 1978 [25], 66,500 in 2010 [26], and 64,700 in 2011 [24].
It appears reasonable, therefore, to assume that in our model Equation (3) the incoming rate β of new individuals coincides with the exit rate α; that is, and ().
This entails that Equation (3) satisfies , so that the total population in each group remains constant; we will assume that this constant is 1 (or ); hence, the variables will be expressed as percentages of the total population in the ith group. The equilibrium and stability properties of this particular case were discussed in [3].
We now have for all , as in the SFCCC system we can find and eliminate the variable from our system. If we now call
we obtain the following reduced system with treatment:
3. Results
We used the SFCCC model developed in [3] to investigate the effect that different strategies—such as testing and immediate treatment and reduction in number of contacts—would have had in reducing the epidemic. In particular, we determined the fraction of the population undergoing treatment that would have been needed in order to bring the reproduction number down to values smaller than 1. Also we wanted to learn if reducing the number of contacts would have been enough. Bringing below 1 would have meant an end to the the San Francisco MSM HIV/AIDS epidemic.
We investigated separately a possible reduction of the epidemic due to the introduction of testing and treatment, a reduction in the number of contacts once the population became aware of the HIV/AIDS threat, and a combination of both.
Below we discuss each possibility. For each reduction strategy we computed the basic reproduction number, , and where applicable we found the endemic equilibrium.
3.1. SFCCC Model
As we showed in [3], when the reproduction number is less than 1, the SFCCC model exhibits a single stable equilibrium, the disease-free equilibrium (DFE). For the DFE becomes unstable, and there appears one more equilibrium, the endemic equilibrium (EE).
Using the parameter values above, the reproduction number for the SFCCC model, without testing or treatment, is extremely high: . Since , our results imply that the system has precisely two equilibria: the disease-free equilibrium (DFE), which is unstable, and an endemic equilibrium (EE). The total infected population at the EE is 74.018%.
3.2. Reducing the Number of Contacts
The San Francisco MSM HIV population has a high level of contacts, averaging 47.7 contacts per year; this is the weighted average of the number of contacts per group, see Equations (1) and (2). As observed, this leads to a very high reproduction number, . As the population became aware of the HIV threat, a significant reduction in the number of contacts occurred. The San Francisco MSM HIV epidemic began around 1978, and individuals became aware of the disease seven years later, about 1984 [27]. We model a reduction in the number of contacts starting at 1984. We consider the effective reproduction number , which is defined as the for the new population behavior, after the number of contacts was significantly reduced. This is not quite the reproduction number for the system during the entire time period, but is a good evaluator of the long-term behavior of the system. We found that if contacts had been reduced by a factor of 10 after seven years, then would have become 4.21, and the total infected population at the endemic equilibrium EE would have been 33.37% (Table 1). Although this is a significant reduction, we still would have had ; consequently, a reduction in the number of contacts alone would not have stopped the spread of the disease.

Table 1.
Reproduction number and total infected population at the endemic equilibrium for reduction strategies.
| Testing Rate | 0% | 50% | 75% | 100% | 7 Reduction in Behavior | |||
|---|---|---|---|---|---|---|---|---|
| 0% | 50% | 75% | 100% | |||||
| Reproduction number | 42.09 | 12.43 | 9.75 | 8.31 | 4.21 | 1.24 | 0.97 | 0.83 |
| Total infected at EE | 74.02 | 56.18 | 51.53 | 48.30 | 33.37 | 5.14 | 0 | 0 |
3.3. Varying Testing Rate
In our model, individuals testing HIV/AIDS positive are immediately placed on antiretrovirals (ART). ART are estimated to reduce infectivity by 96% [6]. The amount of the population being tested, τ, has a significant effect on the reduction of . Our model includes a withdrawal rate associated with treatment, ω; we assume . Figure 2 shows the epidemics (the total infected population) produced with varying testing rates. If the testing rate, τ is (50% ), and the total infected population approaches its EE value of 56.18%. For , and has EE value of 51.43%. For , and has EE value of 48.3%. Even with a 100% of the population being tested every year and receiving immediate treatment, would still have been greater than 1 (Figure 2). Therefore, testing and treatment alone would not have stopped the epidemic either.
Figure 2.
SFCCC epidemic with varying testing rate, Tau.

3.4. Reducing Number of Contacts Combined with Treatment
If we assume that the number of contacts were drastically reduced, by a factor of ten, around 1984, when the San Francisco MSM population became aware of the HIV threat, then, as indicated in Section 3.2, for the untreated model the total infected would still have approached 33.37%, with , which remains bigger than one. Similarly, the introduction of testing and treatment, without assuming a reduction in the number of contacts, would not have brought to values smaller than 1.
However, if we assume both a reduction of contacts by a factor of 10 after seven years, and testing and treatment, then for and or larger, the effective reproduction number would have become less than one. Hence, there would no longer have been an endemic equilibrium EE, and the limit value of the infected population would have been zero. In other words, HIV/AIDS would have been eradicated; see Figure 3. Observe that for the two lower plots—when and respectively—if the horizontal axis were extended, the total infected population would approach zero, as expected when .
Figure 3.
SFCCC epidemic with reduction in number of contacts by a factor of 10 after 7 years of the start of the epidemic and testing rate, Tau.
Figure 3.
SFCCC epidemic with reduction in number of contacts by a factor of 10 after 7 years of the start of the epidemic and testing rate, Tau.

4. Discussion
Using the model developed in [3], we compared the effectiveness of different reduction strategies by investigating the reduction of the reproduction number, . We investigated the effect of reduction strategies on the well-documented San Francisco MSM HIV/AIDS epidemic. In particular, we wanted to find out what would have reduced to below 1, thus eradicating the epidemic. If 50% of the population had been tested each year and those testing positive had been placed immediately on antiretrovirals (ART), would have been reduced by a factor of 3.4, bringing down from to . Even if the entire population had been tested yearly, would have been reduced by a factor of 5, making ; although a significant reduction, the reproduction number is still well above 1. Thus, testing and treatment alone would not have prevented the epidemic.
The problem is, this population had a very elevated number of contacts, with an average of almost 48 per year. This led to the fast spread of the epidemic, characterized by and extremely high for this population, around 42. The number of contacts was significantly reduced once the threat of the HIV epidemics became known to the population. This happened in 1984, about seven years after the onset of the epidemic. In our model, we introduced a reduction in the number of contacts by a factor of 10 after 7 years. Accordingly, this would have reduced for the new parameters (the effective reproduction number ) down to . However, this would still not have been enough to drive below 1 and stop the epidemic.
We thus determined that a combination of the two—that is, a reduction in the number of contacts combined with introduction of testing and treatment—would have been necessary to bring down to a value less than 1. We found that if contacts had been reduced by a factor of ten and the testing rate had been at least of the population, then would have become , a very significant reduction, thus eradicating the epidemic.
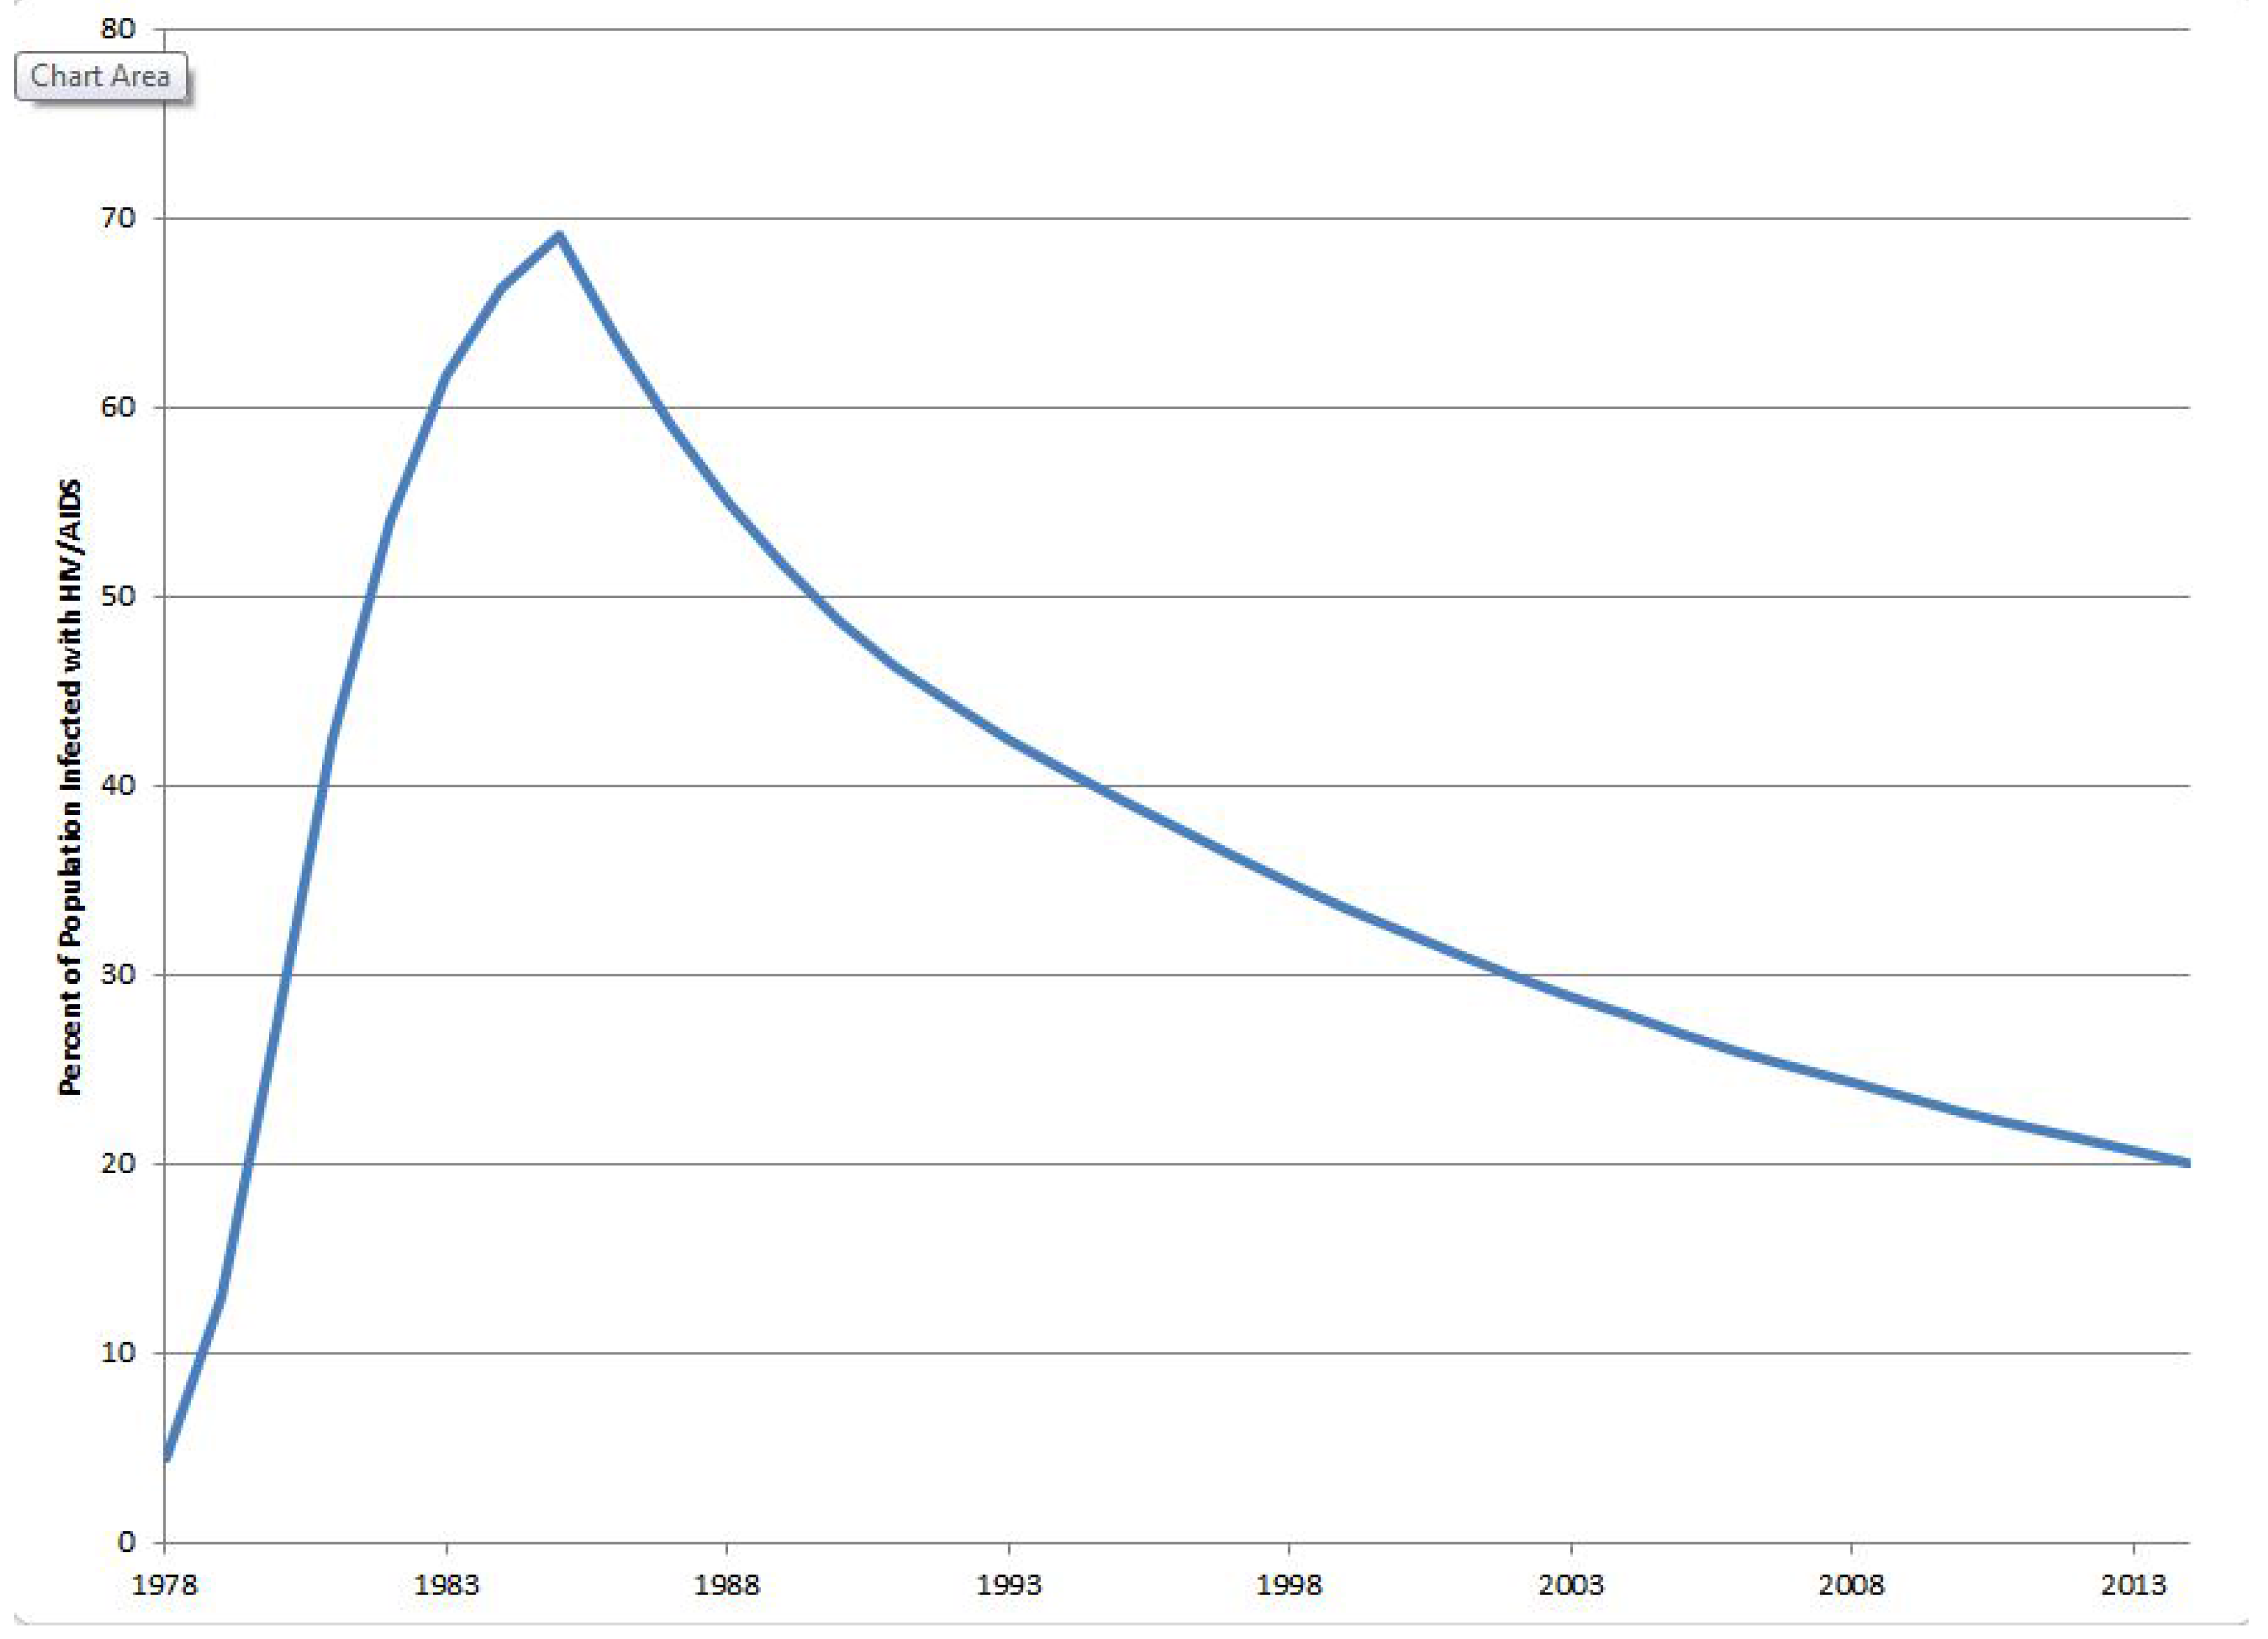
In order to compare how well our assumptions agree with existing data, we conducted a three-stage numerical computation, which mimics what actually happened in the MSM San Francisco population. Namely, in 1984 there was a significant change in sexual behavior, as a consequence of the awareness of the HIV-AIDS epidemic in the community. Later, first treatments started in 1987, at first slowly, and became considerable in 1990. Figure 4 shows a projection of the number of total infected, assuming first a strong change in sexual behavior in 1984—a reduction of the number of contacts by tenfold—and next a start of treatment in 1990, with 50% of the population choosing treatment.
Figure 4.
The three-stage model.

The projected percentage of total infected in 2014, about 20%, agrees with existing data [28]. Interestingly, the predicted long-term percentage of infected population, following this model, is about 7.7%. In other words, this three-stage model predicts an endemic equilibrium of 7.7%. Although the percentage of population choosing treatment in this model is not enough to guarantee a total eradication of the epidemic—for that we would need at least 75% of the population choosing treatment—the predicted endemic equilibrium is relatively low.
Our model does not take into account many factors influencing the actual number of infected individuals. For example, a sizable increase in HIV incidence in San Francisco was registered in later years [29], due to several facts; among others, the change in perception of HIV in the light of success of treatment. However, our model agrees reasonably well with prevailing data.
Finally, we considered a variable-population model, and found that the difference with the constant-population assumption was insignificant, of the order of 0.02% in the period 1978–1984, and 0.06% in 2014; this further justifies the validity of our constant-population assumption.
Future Work
As mentioned in Section 2.1, the top 10% of the population (the core), are significantly more active than the rest of the population; they caused nearly 83% of the infections for the San Francisco MSM HIV/AIDS epidemic [8]. A reduction of the number of contacts for the core population would dramatically reduce the epidemic. Reaching an entire population with reduction efforts is difficult. Focusing on the core population would be more feasible and extremely effective. We plan on investigating how effective such a strategy could be.
Treatment has a significant effect on reducing HIV in a population. Treatment is only effective if individuals do not withdraw from it. We plan on investigating strategies to reduce the withdrawal rate, w in our model. Individuals may withdraw from treatment due to cost, availability or side effects of the HIV-treatment. We assumed the withdrawal rate, w, is . Currently in the United States it may be much higher than that. We plan on investigating varying withdrawal rates in our model.
In July 2012, the U.S. Food and Drug Administration (FDA) approved the first drug to prevent the spread of HIV, Truvada [30]. The drug has been approved to be used by HIV-negative individuals at high risk for infection. This strategy is known as pre-exposure prophylaxis, or PrEP. When taken properly, Truvada has been shown to be up to 92% effective in preventing HIV. We plan on investigating how effective Truvada would have been in reducing in the San Francisco MSM HIV/AIDS epidemic. This would entail including a susceptible class on treatment, in addition to the standard susceptible class.
Author Contributions
Both authors contributed equally to this work.
Conflicts of Interest
The authors declare no conflict of interest.
References
- CDC, HIV/AIDS Statistics and Surveillance Resources, 2012. Available online: http://www.cdc.gov/ hiv/statistics/surveillance/incidence.html (accessed on 12 June 2014).
- The HIV/AIDS Epidemic in the United States, April 2014, Kaiser Family Foundation Fact Sheet. Available online: http://www.kff.org/hivaids/3029.cfm (accessed on 12 June 2014).
- Rapatski, B.; Tolosa, J. Modeling and Analysis of the San Francisco City Clinic Cohort (SFCCC) HIV-Epidemic Including Treatment. Math. Biosci. Eng. 2014, 11, 599–619. [Google Scholar] [CrossRef] [PubMed]
- Grant, R.M.; Lama, J.R.; Anderson, P.L.; McMahan, V.; Vargas, L.; Goicochea, P.; Liu, A.Y.; Casapia, M.; Guanira-Carranza, J.V.; Ramirez-Cardich, M.E.; et al. Preexposure Chemoprophylaxis for HIV Prevention in Men Who Have Sex with Men. N. Engl. J. Med. 2010, 363, 2587–2599. [Google Scholar] [CrossRef] [PubMed]
- Brown, D. HIV Drugs Sharply Cut Risk of Transmission, Study Finds. The Washington Post. 12 may 2011. Available online: https://www.washingtonpost.com/national/ hiv-drugs-sharply-cut-risk-of- transmission-study finds/2011/05/12/AFmFdV1G_story.html (accessed on 12 May 2011).
- McKay, B. Scientists See Breakthrough in the Global AIDS Battle. The Washington Post. Available online: http://www.wsj.com/articles/SB10001424052748703730804576319043572865406 (accessed on 12 May 2011).
- Price, J. Study: Early HIV Treatment Slows Spread of Disease, Lexington Herald Chapel Hill. The Washington Post. Available online: http://www.newzimbabwe.com/news- 5117-Early+HIV+treatment+slows+virus %E2 %80 %99+spread/news.aspx (accessed on 13 May 2011).
- Rapatski, B.L.; Suppe, F.; Yorke, J. HIV epidemics driven by late disease-stage transmission. J. Acquir. Immune Defic. Syndr. 2005, 38, 241–253. [Google Scholar] [PubMed]
- Centers for Disease Control (CDC). Update: Acquired immunodeficiency syndrome in the San Francisco cohort study, 1978–1985. MMWR CDC 2012, 34, 573–575. [Google Scholar]
- Curran, J.W.; Morgan, W.M.; Hardy, A.M.; Jaffe, H.W.; Darrow, W.W.; Dowdle, W.R. The epidemiology of AIDS: Current status and future prospects. Science 1985, 229, 1352–1357. [Google Scholar] [CrossRef] [PubMed]
- Jaffe, H.W.; Darrow, W.W.; Echenberg, D.F.; O’Malley, P.M.; Getchell, J.P.; Kalyanaraman, V.S.; Byers, R.H.; Drennan, D.P.; Braff, E.H.; Curran, J.W.; et al. The acquired immunodeficiency syndrome in a cohort of homosexual men: A six-year follow-up study. Ann. Intern. Med. 1985, 103, 210–214. [Google Scholar] [CrossRef] [PubMed]
- Winkelstein, W., Jr.; Lyman, D.M.; Padian, N.; Grant, R.; Samuel, M.; Wiley, J.A.; Lang, W.; Anderson, R.E.; Riggs, J.; Levy, J.A. Sexual practices and risk of infection by the human immunodeficiency virus: The San Francisco men’s health study. JAMA 1987, 257, 321–325. [Google Scholar] [CrossRef] [PubMed]
- Gilks, C.F.; Crowley, S.; Ekpini, R.; Gove, S.; Perriens, J.; Souteyrand, Y.; Sutherland, D.; Vitoria, M.; Guerma, T.; de Cock, K. The WHO public-health approach to antiretroviral treatment against HIV in resource-limited settings. Lancet 2006, 368, 505–510. [Google Scholar] [CrossRef]
- NIH, Guidelines for the Use of Antiretroviral Agents in HIV-1-Infected Adults and Adolescents, 2012. Available online: http:/aidsinfo.nih.gov/e-news (accessed on 12 June 2014).
- Sterne, J.A.; May, M.; Costagliola, D.; de Wolf, F.; Phillips, A.N.; Harris, R.; Funk, M.J.; Geskus, R.B.; Gill, J.; Dabis, F.; et al. Timing of initiation of antiretroviral therapy in AIDS-free HIV-1-infected patients: A collaborative analysis of 18 HIV cohort studies. Lancet 2009, 373, 1352–1363. [Google Scholar] [PubMed]
- Granich, R.; Gilks, C.; Dye, C.; de Cock, K.M.; Williams, B.G. Universal voluntary HIV testing with Immediate Antiretroviral Therapy as a Strategy for Elimination of HIV Transmission: A Mathematical Model. Lancet 2009, 373, 48–57. [Google Scholar] [CrossRef]
- Rapatski, B.; Klepak, P.; Dueck, S.; Liu, M.; Weiss, L.I. Mathematical epidemiology of HIV-AIDS in Cuba during the period 1986–2000. Math. Biosci. Eng. 2006, 3, 545–556. [Google Scholar] [CrossRef]
- Waitzkin, H.; Wald, K.; Kee, R. Primary care in Cuba: Low and high technology developments pertinent to family medicine. J. Fam. Pract. 1997, 45, 250–258. [Google Scholar] [PubMed]
- Feinsilver, J. Cuba as a “world medical power”: The politics of symbolism. Lat. Am. Res. Rev. 1989, 24, 1–34. [Google Scholar]
- De Arazoza, H.; Lounes, R. A non-linear model for sexually transmitted disease with contact tracing. IMA J. Math. Appl. Med. Biol. 2002, 19, 221–234. [Google Scholar] [CrossRef] [PubMed]
- HIV and AIDS estimates. Available online: http://www.unaids.org/en/regionscountries/countries/cuba (accessed on 12 June 2014).
- Ahlgren, D.; Gorny, M.; Stein, A. Model-based optimization of infectivity parameters: A study of the early epidemic in San Francisco. J. Acquir. Immune Defic. Syndr. 1990, 3, 631–643. [Google Scholar] [PubMed]
- Hethcote, H.W.; van Ark, J.W. Modeling HIV Transmission and AIDS in the United States; Springer-Verlag, Berlin: New York, NY, USA, 1992. [Google Scholar]
- San Francisco City Clinic. STDs Among Men who Have Sex with Men (MSM), San Francisco, 2007–2012. Available online: http://www.sfcityclinic.org/providers/MSMSurveillance2012.pdf (accessed on 12 June 2014).
- Lemp, G.F.; Payne, S.F.; Rutherford, G.W.; Hessol, N.A.; Winkelstein, W., Jr.; Wiley, J.A.; Moss, A.R.; Chaisson, R.E.; Chen, R.T.; Feigal, D.W., Jr.; et al. Projections of AIDS morbidity and mortality in San Francisco. JAMA 1990, 263, 1497–1501. [Google Scholar] [CrossRef] [PubMed]
- Raymond, H.F.; Bereknyei, S.; Berglas, N.; Hunter, J.; Ojeda, N.; McFarland, W. Estimating population size, HIV prevalence and HIV incidence among men who have sex with men: A case example of synthesising multiple empirical data sources and methods in San Francisco. Sex. Transm. Infect. 2013, 89, 383–387. [Google Scholar] [CrossRef] [PubMed]
- Hessol, N.A.; Lifson, A.R.; O’Malley, P.M.; Doll, L.S.; Jaffe, H.W.; Rutherford, G.W. Prevalence, incidence, and progression of human immunodeficiency virus infection in homosexual and bisexual men in hepatitis B vaccine trials, 1978–1988. Am. J. Epidemiol. 1989, 130, 1167–1175. [Google Scholar] [PubMed]
- San Francisco Department of Public Health, HIV/AIDS Epidemiology Annual Report. HIV Epidemiology Section, 2012. Available online: http://www.sfdph.org/dph/files/reports/ RptsHIVAIDS/AnnualReport2012.pdf (accessed on 12 June 2014).
- San Francisco Department of Public Health, The San Francisco Department of Public Health and AIDS Research Institute/UCSF Response to the Updated Estimates of HIV Infection in San Francisco, 2000. Available online: http://caps.ucsf.edu/uploads/pubs/reports/pdf/ HIVEstimatesReport.pdf (accessed on 12 June 2014).
- FDA. Truvada for PrEP Fact Sheet: Ensuring Safe and Proper Use, July 2012. Available online: http://www.fda.gov/downloads/NewsEvents/Newsroom/FactSheets/UCM312279.pdf (accessed on 12 June 2014).
© 2015 by the authors; licensee MDPI, Basel, Switzerland. This article is an open access article distributed under the terms and conditions of the Creative Commons Attribution license (http://creativecommons.org/licenses/by/4.0/).
Share and Cite
MDPI and ACS Style
Rapatski, B.L.; Tolosa, J. The San Francisco MSM Epidemic: A Retrospective Analysis. Mathematics 2015, 3, 1083-1094. https://doi.org/10.3390/math3041083
AMA Style
Rapatski BL, Tolosa J. The San Francisco MSM Epidemic: A Retrospective Analysis. Mathematics. 2015; 3(4):1083-1094. https://doi.org/10.3390/math3041083
Chicago/Turabian StyleRapatski, Brandy L., and Juan Tolosa. 2015. "The San Francisco MSM Epidemic: A Retrospective Analysis" Mathematics 3, no. 4: 1083-1094. https://doi.org/10.3390/math3041083