Numerical Investigation of Aerodynamic Drag and Pressure Waves in Hyperloop Systems


1
Department of Mechanical Engineering, Chung-Ang University, Seoul 06911, Korea
2
Hyper Tube Express (HTX) Research Team, Korea Railroad Research Institute, Gyeonggi-do 16105, Korea
3
School of Intelligent Energy and Industry, Chung-Ang University, Seoul 06911, Korea
*
Author to whom correspondence should be addressed.
Mathematics 2020, 8(11), 1973; https://doi.org/10.3390/math8111973
Submission received: 7 September 2020
/
Revised: 17 October 2020
/
Accepted: 2 November 2020
/
Published: 6 November 2020
(This article belongs to the Special Issue Computational Fluid Dynamics 2020)
Abstract
:Hyperloop is a new, alternative, very high-speed mode of transport wherein Hyperloop pods (or capsules) transport cargo and passengers at very high speeds in a near-vacuum tube. Such high-speed operations, however, cause a large aerodynamic drag. This study investigates the effects of pod speed, blockage ratio (BR), tube pressure, and pod length on the drag and drag coefficient of a Hyperloop. To study the compressibility of air when the pod is operating in a tube, the effect of pressure waves in terms of propagation speed and magnitude are investigated based on normal shockwave theories. To represent the pod motion and propagation of pressure waves, unsteady simulation using the moving-mesh method was applied under the sheer stress transport k–ω turbulence model. Numerical simulations were performed for different pod speeds from 100 to 350 m/s. The results indicate that the drag coefficient increases with increase in BR, pod speed, and pod length. In the Hyperloop system, the compression wave propagation speed is much higher than the speed of sound and the expansion wave propagation speed that experiences values around the speed of sound.
1. Introduction
Hyperloop is an innovative transportation system first outlined in a 2013 white paper by a joint team from Tesla Inc. and SpaceX Corp. As described in the Hyperloop Alpha document, it is a new, alternative, very high-speed mode of transport with benefits in terms of comfort, convenience, time, and cost [1,2]. The Hyperloop system consists of Hyperloop pods (or capsules) transporting cargo and passengers at very high speeds in a near-vacuum tube. The basic concept of the Hyperloop is similar to the evacuated tube transportation system proposed by Oster [3] in 1977. Estimates suggest that the trip between Los Angeles and San Francisco of roughly 350 miles, which usually takes 2.5 h by a high-speed train, would take only 35 min by the Hyperloop system (estimated time at average speeds of approximately 1000 km/h and 240 km/h for Hyperloop pod and high-speed train, respectively) [1,4]. This high-speed pod–tube configuration could be faster and more energy-efficient than trains or cars, as well as cheaper and less polluting than aircraft. SpaceX founder Elon Musk and his team called it the fifth form of public transportation after planes, trains, cars, and boats [1].
There are two big differences between Hyperloop and traditional rail. First, the pods are designed to float on air bearings or by magnetic levitation to reduce friction, unlike trains or cars. Second, the pods (or capsules) transport passengers through tubes in which most of the air is evacuated to reduce air resistance. This should allow the pods to travel at approximately 1250 km/h (or nearly 350 m/s), which is 3–4 times higher than the fastest high-speed train at present (350–380 km/h). Such high-speed operation, however, would cause a larger aerodynamic drag. Addressing this challenge, the closed partial-vacuum tube could drastically lower the aerodynamic drag. Hence, the Hyperloop white paper proposed maintaining a constant pressure of 1/1000 atm (101.325 Pa) inside the tube. In addition, when the pod is operating at transonic speeds, the restricted air owing to air compressibility could lead to large variations in pressure at the front and rear of the pod. Hence, variation of pressure wave propagation should also be considered.
Oh et al. [5] conducted a large parametric study in steady state by applying a two-dimensional axisymmetric model to a compressible flow to investigate the effects of blockage ratio (BR), pod speed/length, and tube pressure/temperature on the aerodynamic drag in a Hyperloop system. The study suggested that these parameters strongly affected drag, except the pod length and tube temperature, which have negligible influences. However, the simulation in their study could not analyze pressure wave propagation. In steady-state simulation, the pressure waves produced by the nose and tail of the pod affect the inlet and outlet boundaries. This limitation can influence the accuracy of the results. Yang et al. [6] concluded that aerodynamic drag increased proportionally with the internal tube pressure and the square of the operating speed. Gillani et al. [7], Singh et al., (2019) [8], and Choi et al. [9] studied the relationship between the pod shape and the aerodynamic drag of the pod. They proposed that the elliptical train shape efficiently reduced the aerodynamic drag at the tube pressure of 1013.25 Pa. Zhang [10] carried out steady computational fluid dynamic (CFD) simulations and indicated that the increase of BR increased the aerodynamic drag. Similar conclusions were presented by Kang et al. [11], who performed parametric simulations of transonic vehicles in an evacuated tube. The authors implied that the BR and internal tube pressure strongly affected aerodynamic drag of transonic trains; the maximized drag coefficient was obtained at Mach 0.7. Kim et al. [12] concluded that the occurrence of shockwaves greatly increased the aerodynamic drag in the tube–train system.
The compressibility of air should be considered in cases where a pod travels through a tube at high speed. The motion of the pod generates a series of compression waves in the front. These pressure waves propagate forward and backward with the direction of the operating pod. Meanwhile, expansion waves propagate behind the pod. The propagation of compression waves intensifies the pressure ahead of the pod, whereas the expansion waves reduce the pressure behind the pod. The difference between the pressures at the nose and the rear of the pod increases as the pod speed increases, causing a sharp rise in pressure drag. A study by Oh et al. [5] observed choked flow in the Hyperloop system at a pod speed of 180 m/s and a BR of 0.36, which significantly increased the drag. The normal shockwave is similar to a step-change of the compression wave. The presence of shockwaves produces discontinuous changes in the flow parameters. The normal and oblique shockwaves in the rear of the pod strongly interfere with the aerodynamic characteristics of the pod–tube system. Hence, in this study, the pressure wave propagation speed is also evaluated.
The analysis of pressure wave propagation requires time-dependent CFD simulation. In addition, a moving overset mesh method was employed to represent the pod motion and determine the influence of a moving pod on the compression waves and expansion waves inside the tube. The overset mesh is a renowned method for moving-mesh simulations and has high accuracy and computational speed by reducing the re-meshing effects during the simulation.
Oh et al. showed that symmetric models of a semicircular nose and tail make the difference between three- and two-dimensional models insignificant (just 4%) [5]. Therefore, the two-dimensional axisymmetric model is sufficient for simulating the Hyperloop with an idealized geometrical shape. Therefore, in this study, a two-dimensional axisymmetric model was constructed. Moreover, the main objective of this study is to analyze the aerodynamic drag and pressure wave propagation, which can be fully described by two-dimensional simulations. The low computational cost of the two-dimensional model allowed us to consider a long tube and carry out a comprehensive parametric study.
2. Numerical Method
The simulation was conducted on ANSYS Fluent 18.1 (Ansys Inc., Canonsburg, PA, USA) with the shear stress transport (SST) viscous model. The compressible ideal gas condition was applied by using the density-based implicit solver. The viscosity was assumed as the Sutherland model, in which the viscosity varies only with temperature.
2.1. Computational Domain
The pressure waves propagate in both forward and backward directions through the tube. If an exceedingly short tube was used in the numerical simulations, the pressure waves would reflect off the boundaries and cause unpredictable pressure variations [9,13]. Hence, a sufficiently long tube was chosen to fully analyze the pressure wave propagation. The simulation was conducted in a two-dimensional axisymmetric model. The nose and tail of the Hyperloop pod were assumed to have idealized semicircular geometries.
The BR is determined by the following equation:
where is the diameter of the pod and is the diameter of the tube.
The pod’s dimensions were ø 3 m × 43 m. The BR of 0.36 gave a tube diameter of 5 m and the BR of 0.25 gave a tube diameter of 6 m. The length of the tube was 1200 m. The computational geometry and boundary conditions used in the simulation are shown in Figure 1. Figure A1 (Appendix A) informs that the designed domain used in this simulation is long enough for the pressure wave to fully develop without losses (reflections).
2.2. Overset Meshing and Computational Grid
For conducting the moving-mesh simulation, the overset and dynamic mesh options were applied simultaneously. The overset mesh method allows multiple disconnected meshes to sufficiently overlap each other. Using the overset mesh method to perform a moving mesh helps achieve more efficient computation time and prevents re-meshing that otherwise reduces the accuracy by causing the generation of poor cells. Generally, the mesh used for the overset method consists of two parts: a background zone and a separate component zone. Background zones are the mesh of the off-body or fluid space. The component zones are meshes that contain the objects of analysis; they require overset boundaries. These meshes must be of high quality and should cover the solution domain [14]. The component zones overlay the background zones near the overset boundaries; near these regions, the background and other component zones unify into one zone. An advantage of overset meshing is that individual parts of the overset mesh are created independently, and hence any zone can be easily replaced without having to recreate the whole geometry [15].
In this study, two mesh zones were independently generated. The background zone is the tube mesh and the component zone is the pod mesh. Figure 2 presents the mesh and the generation of the overset mesh used in this study. The grids were generated on ANSYS ICEM 18.1. Both zones were treated with a hexahedral mesh. A finer mesh is created near the pod and the wall to ensure that the maximum is maintained around 0.5, except at the nose of the pod, where the highest values reach 1.5. Figure 3 shows the variation of the values around the pod surface and the tube wall for the highest pod speed case, in other words, 350 m/s. In this study, the maximum and minimum values were observed at the nose and tail of the pod, respectively.
The number of elements in the tube mesh was fixed at 979,951 cells. For the grid independence test, only the pod mesh was demonstrated by comparing the results of two main objectives of this study, in other words, drag force and pressure obtained with several different grids. The pod speed of 350 m/s and tube pressure of 101.325 Pa (1/1000 atm) were used to evaluate the mesh. Table 1 lists the independence test results of the grid computed from three meshes, in other words, coarse mesh (mesh 1), medium mesh (mesh 2), and fine mesh (mesh 3). The difference between the medium mesh and the fine mesh is 0.02% in total drag and 0.004% in pressure; hence, a fine mesh was unnecessary and mesh 2 was chosen. All simulations in this study were conducted with a mesh composed of 1,684,782 cells.
2.3. Boundary Conditions
Figure 1 describes the boundary conditions of the simulation. For the tube, the pressure-outlet boundary condition was applied at the two tube exits with a constant value of 101.325 Pa (1/1000 atm). The pod and the tube walls are stationary walls with no-slip and adiabatic conditions. The pod was placed at a fixed position and instantly starts to move from right to left at a specified speed. Eight pod speeds were considered, from 100 to 350 m/s. Meanwhile, the pod-mesh zone also moved with the same speed and in the same direction as the pod.
The Reynolds number was calculated using the formula , where and are the reference air density, pod speed, hydraulic diameter, and viscosity, respectively. The hydraulic diameter was determined as 2 m for BR = 0.36 and 3 m for BR = 0.25. Hence, for the range of pod speed considered in this study, the Reynolds number ranged from to for BR = 0.36, which indicates turbulent flow. Table 2 shows the variation of the Reynolds number with respect to the increase in pod speed. As the pod speed increases, the Reynolds number also increases. As increases, the Reynolds number decreases.
The simulations in this study were carried out under unsteady conditions. The variation of drag and the propagation of compression waves in Figure 4 show that the drag and compression waves tend to stabilize after 0.2 s. Owing to this stationary condition, one second of simulation time was enough to fully develop the flow field and investigate the behavior of the pressure waves. Therefore, in this study, we took a total simulation time of 1 s. The values of drag were estimated at 1 s, and results of pressure waves were exported after initial transients. In the steady-state condition, the pressure wave propagation cannot be examined. Furthermore, the pressure waves that arrive at the boundaries may alter the specified boundary conditions and affect drag evaluation. Hence, the unsteady-state simulation was used to explain the pressure wave phenomenon, as well as estimate the drag variation more accurately.
2.4. Mathematical Model
The governing equations are the conservation of mass, momentum (Navier–Stokes), and energy equations, which are described as follows in that order:
Here, is the fluid density, u is the fluid velocity, P is the fluid pressure, and is the fluid viscosity; E is the specific internal energy, is the effective thermal conductivity, and is the effective dynamic viscosity.
To solve the governing equations, a density-based solver built using the finite volume method was employed. The implicit Roe’s flux difference scheme was used as the spatial discretization scheme. The least-squares cell-based method was selected for gradient calculation. Furthermore, the flow was discretized using the second-order upwind scheme. The turbulent kinetic energy and specific dissipation rate were set according to the first-order upwind scheme. Although the first-order upwind scheme may not yield results of greater accuracy compared with the second-order upwind scheme, the first-order upwind scheme easily converges and minimizes the computational cost.
For the time integration, the first-order implicit scheme was used to process the unsteady simulation. The unsteady constant-time stepping with a time step size of 8 × 10⁻⁵ was adopted, and the maximum number of iterations per time step was selected as 20 to reach a residual convergence of . Additionally, the Courant number was set at 2 in all the simulations.
A suitable turbulence model can enhance the precision and reliability of the CFD simulation. Direct numerical simulation (DNS) and large eddy simulation (LES) can effectively analyze the complex fluid-flow model, especially for the turbulence structure [16,17,18,19,20]. However, these turbulence models require a high computational cost. The Reynolds-averaged Navier–Stokes (RANS) model can balance the computational cost and performance efficiency of the numerical analysis. A few RANS models such as SST , transition SST, et cetera. are widely used for compressible flow simulations. In this study, the pod operates in the transonic to supersonic speed regimes. Therefore, to specify the turbulent flow, the SST model was applied. This is a hybrid model combining the advantages of the Wilcox (standard) and the models. The two variables, the turbulence kinetic energy and the specific dissipation rate , were respectively determined by the following two equations [15,21,22]:
where
where denotes the Reynolds stresses (), denotes the mean rate of deformation component (), and denotes the Kronecker delta function.
and are the turbulent Prandtl numbers for and , respectively. is the turbulence viscosity, which is calculated by the following equations:
In Equation (13), the term is the invariant measure of the strain rate, and is a constant equal to 0.31. The other constant values in the above equations are given as follows [15]:
This turbulence model has been widely used to simulate the aerodynamic characteristics of high-speed trains [6,8,10,23,24,25]; it has improved the accuracy and reliability of free shear flows and transonic shockwaves predictions [15]. For more details of this model, readers are directed to [6,21,22].
2.5. Validation
To ensure the stability of the numerical solution, the sphere tests of Charters and Thomas [26] were chosen for validation. Figure 5 shows a comparison of the drag coefficient obtained from our simulations and the work of Charters and Thomas, in which experiments were conducted with small spheres at various velocities. A 2D axisymmetric sphere was simulated with an unsteady moving mesh. The numerical method used for the validation was the same as those mentioned in Section 2.4. Figure 5 shows a similar trend in the drag coefficient between the two studies, indicating a good agreement. Therefore, our selected numerical method is appropriate to simulate the moving pod–tube configuration.
3. Results
Any object moving through a fluid will experience an aerodynamic drag that is produced by both pressure and shear forces acting on its surface.
where is the total drag, is the pressure drag, and is the friction drag. Pressure drag is strongly dependent on the shape or form of the object; friction drag is a function of the wall shear stress, which is affected by surface roughness and the Reynolds number [27]. The drag coefficient is defined by the following equations:
where is the frontal area, which is the cross-sectional area of the pod calculated by . Thus, in this study, the reference area in Equations (16)–(18) is approximately 7.065 m2. is the reference density of air in the tube pressure and temperature of 300 K. is the pod speed.
This study mainly focuses on the influence of various parameters on the aerodynamic drag. The amplitude and speed of pressure waves are also presented. The main variables considered here include BR, operating pod speed, internal tube pressure, and pod length. Owing to a fixed cross-sectional area of the pod, the variation in BR is obtained by changing the tube diameter to 6 m for BR = 0.25 (5 m for BR = 0.36). The pod speed was varied from 100 to 350 m/s in intervals of 50 m/s, in other words, 100, 150, 200, 250, 300, 350 m/s. For investigating the flows near the critical Mach number, two more pod speeds were chosen, namely, 225 and 275 m/s. With changing tube pressure, the pod speed of 300 m/s was selected to evaluate four different tube pressures, namely, 101.325, 500, 750, and 1013.25 Pa under a BR of 0.36 and a pod length of 43 m. The Hyperloop Alpha documents used a pod length of 43 m to carry 28 passengers per trip. To investigate the effect of pod length on drag coefficient, the case of = 43 m and two reference cases and were selected.
3.1. Effect of Blockage Ratio and Pod Speed
As indicated in Figure 6, the changes of friction and pressure drag coefficient vary by two values of BR from of 100 to 350 m/s. The variation of friction and pressure drag is given in insets. Besides, Figure A2 and Figure A3 (Appendix B) also show the variation of friction and pressure drag coefficients on and Mach number. In Figure 6, at the same , the friction drag coefficient and the pressure drag coefficient increase as the BR increases. When the BR is higher, the area where the flow passes through decreases. Thus, the flow becomes harder to bypass, increasing the friction drag generated along the pod surface and resulting in increases as BR increases (Figure 6a). It should be noted that from the of 200 m/s, the effect of BR on reduces due to severe choking.
The change in pressure drag depends on the pressure difference between the nose and tail of the pod. With increasing BR, the air becomes more compressible, which increases the pressure magnitude along the pod surface as well as the pressure difference between the nose and the tail, resulting in an increase in pressure drag; hence increases. With increasing , pressure and friction drag increase continuously and significantly. Unlike drag, the drag coefficients witness different tendencies. As shown in Figure 6b, at BR = 0.36, increases and reaches the maximum at a of 225 m/s. Subsequently, it exhibits a continuous drop. By contrast, presents an incessant decrease with the increment of . The results show tendencies similar with those in previous literature [5,11,23,28]. Note that, at lower values of BR, the maximum value of changes. In this study, at BR = 0.25, reaches a maximum at a of 250 m/s, which will be compared later with BR = 0.36.
Generally, aerodynamic drag is composed of pressure and friction drags. Unlike in the open air, the Hyperloop pod moves in a tunnel, experiencing more aerodynamic drag owing to the increase in pressure generated by its interaction with the tunnel walls [29]. At higher speed, there will be higher pressure. When the pod passes through the tube at a high speed, a high-pressure region is formed in the front of the pod nose. Meanwhile, the pod tail experiences an increase in the velocity of flow and reduces the pressure behind the pod. This phenomenon is similar to the behavior of flow through a convergent–divergent nozzle and results in a greater pressure difference between the nose and the tail of the pod; this leads to an increase in the pressure drag. Besides, the low pressure in the tube reduces the friction drag in the Hyperloop system. Hence, in the pod–tube system, pressure drag is more dominant than friction drag.
To evaluate the portions of pressure and friction drag in the total drag, the ratios of the two drag components to the total drag are shown in Figure 7. At BR = 0.36 and = 100 m/s, pressure drag dominates the total drag by 70%; the remaining percentage belongs to friction drag. However, pressure drag becomes more dominant as increases owing to the increase of the difference in pressure at the nose and tail; the friction drag does not change much. This results in the pressure drag becoming more dominant at of 350 m/s, making up 89.2% of the total drag, whereas friction drag only makes up 10.8%. The portion of decreases with reducing BR, whereas the portion of increases. This is because the effect of BR on the pressure drag is much higher than on friction drag. As BR reduces from 0.36 to 0.25, and at = 100 m/s, pressure drag decreases by more than 50%, whereas the friction decreases by approximately 25%. This gap is greater at = 350 m/s, where the margins of decrease for pressure drag and friction drag are 22.4% and 6.9%, respectively. Note that the ratios of the pressure and friction drags to the total drag begin to converge from a of 250 m/s.
The pressure contours in Figure 8 show that the pressure in front of the pod increases with increase of BR. Figure 8d,e,j,k reveals shockwaves at the rear end of the pod; these shockwaves are made of normal and oblique shockwaves generated by the interaction and reflection of pressure waves between the tube walls and pod surface. When the local flow velocity exceeds the speed of sound, the interaction and connection of the airflow and pod surface create oblique shockwaves [28]. With increasing , the shockwaves become more distinct, expand backward, are reflected by the upper and lower walls of the tube [16], and are then weakened downstream owing to the friction of the airflow. This oblique shockwave intensifies the airflow pressure at the rear end of the pod, resulting in an abrupt pressure increase at the tail (Figure 9a). Note that at lower BR, the formation of oblique shockwaves is delayed. The existence of shockwaves affects the variation of . In this study, shockwaves are noticed before the where is maximized. At BR = 0.25, the shockwave structure can be observed from a of 225 m/s (Figure 8c), and from 200 m/s at BR = 0.36 (Figure 8h). The previous study conducted by Kim et al. (2011) [12] also indicated that the impact of shockwaves was reduced when BR was reduced. Hence, to limit the effect of shockwaves, we considered the influence of BR [8,12].
With increasing BR, the percentage of pressure drag to total drag increases. To explain this phenomenon, Figure 9a illustrates the pressure difference between the nose and the tail of the pod, which is one of the factors affecting pressure drag. As the increases, the pressure at the nose increases significantly, which is in contrast with the slight decrease in pressure at the tail. This difference causes a substantial increase in the pressure difference between the nose and the tail, resulting in a sharp increase in the pressure drag. This pressure difference in turn increases with the increase of and BR. At the same , the pressure at the nose with BR = 0.36 is higher than in the case when BR = 0.25 because of the generation of stronger compression waves. Otherwise, the tail pressure experiences a smaller pressure drop when the BR is smaller, because the air in the larger tube expands easily [11,12,30].
Figure 9b illustrates the pressure variation across the pod surface. There is a sudden increase in the pressure at the tail from a of 250 m/s owing to the formation of strong oblique shockwaves. A noticeable increase in the surface pressure occurs from 200 to 250 m/s, where the choking flow becomes severe. Note that, although an increment in the surface pressure was observed from 100 to 250 m/s, the pressure magnitude at the tail exhibited a considerable drop owing to the stronger flow expansion with increasing . As oblique shockwaves appear at the tail from a of 250 m/s, the tail pressure slightly increases.
3.2. Effect of Tube Pressure
The Hyperloop Alpha documents recommended an ideal tube pressure of 1/1000 atm for operating the Hyperloop systems. In this section, to verify this factor, different tube pressures were applied for the pod speed of 300 m/s with a BR of 0.36 and a pod length of 43 m. Figure 10a illustrates the changes in drag and drag coefficient with the tube pressure. As shown in the sub-figure, aerodynamic drag linearly increases with tube pressure. With increasing tube pressure, pressure drag becomes more dominant, whereas the variation of friction drag is minor. The tenfold increase of tube pressure has increased the total drag by more than nine times. Therefore, it is better to maintain a lower tube pressure to have a smaller drag. The variation of drag coefficient is inversely proportional to the flow density, reference area, and the square of operating speed. As mentioned earlier, the cross-sectional area and operating speed were fixed to investigate the effect of tube pressure. Hence, in this study, the change of drag coefficient with respect to tube pressure is mostly affected by the density of air, which is calculated by , where is the tube pressure, is the gas constant, and is the temperature. The higher tube pressure causes higher density, resulting in a larger and a marginal decrease in the drag coefficient. Figure 10b shows the proportion of pressure and friction drag in the total drag. Note that tube pressure has only a small influence on the proportion of the drag components to the total drag.
3.3. Effect of Pod Length
This section investigates the effect of pod length on the drag coefficient. Three cases were examined based on the reference pod length from the Hyperloop Alpha documents. The pod length of = 43 m was used as a reference case to analyze the two cases of and . Figure 11 examines the effect of pod length on the drag coefficient and the ratios of pressure and friction drags to the total drag.
As indicated in Figure 11a, the pod length does not have a significant effect on , whereas it leads to a considerable increase in . The variation of drag coefficient with respect to pod length follows a similar trend as the variation of drag force. The variation of drag force with pod length is presented in the sub-figure. Friction drag is generally generated along the pod surface; hence, when increasing the pod length, friction drag increases nearly proportionally. The drag acting on a shorter pod mostly depends on the pressure drag. The increase of pressure drag is mostly affected by the pressure distribution in the front and rear of the pod; hence, the extension of pod length has little effect on the pressure drag. Nevertheless, friction drag is significantly altered because it is strongly dependent on the surface area. is nearly doubled when doubling the pod length, whereas the increase of is negligible. Consequently, with the increase of pod length, the increase of total drag is mostly because of the increase in friction drag. To further explain the statement, the ratios of the pressure and friction drags to the total drag are presented in Figure 11b. With , the ratio of pressure drag to friction drag is approximately 12:1. However, with , this ratio reduces to 5:1.
3.4. Pressure Wave Propagation
The speed of sound in gases is dependent on the temperature. Under the assumption of isentropic flow, the speed of sound is estimated by . and are the ratios of specific heats and the individual gas constant with the assigned values of 1.4 and 287.058 J/kg.K, respectively; at an air temperature of 300 K, = 347.1 m/s. Under atmosphere pressure and linear wave assumption, the pressure waves propagate at the speed of sound [31]. However, in the Hyperloop system, the reference pressure is reduced to 1/1000 atm and the pressure waves have high amplitude, causing the nonlinear wave phenomenon. Therefore, the pressure wave propagation speeds are greater than the speed of sound. Figure 12 compares the pressure wave propagation speeds induced at the front and rear end of the pod with the speed of sound. A higher BR creates higher pressure wave propagation speed at the front end of the pod , but it barely affects the pressure wave propagation speed at the end of the pod .
Figure 12a shows the values of pressure wave propagation speed () in absolute coordinates. The range of is from 355 to 473 m/s, which is much higher than the normal speed of sound of 347.1 m/s. As increases, increases steeply. In the rear end of the pod, did not change much and maintained a speed around the speed of sound. At of 350 m/s, the differences between speed of sound and for forward and backward flows are 26.6% and 0.6%, respectively. Note that in this study, the analysis of is conducted under ideal operating conditions, where the tube walls are smooth and straight and without the application of a vacuum pump.
As shown in Figure 12b, the pod-relative coordinates and the absolute coordinates are vastly different. is much higher than . This is because the directions of and are the same, in contrast to the direction of , which is the opposite of . That means as increases, the difference between and the compression wave speed decreases, whereas the difference between and the expansion wave speed increases.
Figure 13 illustrates the pressure variation along the tube axis and the pod surface. As increases, the pressure magnitude at the front of the pod significantly increases, whereas the pressure behind the pod slightly decreases. Compression waves are generated in front of the pod and propagate mainly in the forward direction faster than the speed of sound. These compression waves cause the pressure variation in front of the pod to fluctuate abruptly and generate a high-pressure region. Meanwhile, expansion waves are generated behind the pod, and propagate both in the forward and backward directions of the pod at around the speed of sound. The forward expansion waves pass the pod surface and merge with the incident compression waves, decreasing the pressure of the front waves. This phenomenon is probably observed at lower speeds, namely, 100 m/s and 150 m/s. This pressure wave distribution is similar to the variation in the high-speed train–tunnel system presented by Zonglin et al. [13]. When increases, the compressibility of air and the compression wave propagation speed increase, and consequently alter the forms of the high-pressure region in front of the pod. Figure A4 (Appendix C) describes this high-pressure region in more detail. By contrast, the position of the low-pressure region shows only a minor change. The oblique shockwaves caused by the reflection of waves between the tube walls and the pod tail are illustrated in Figure 13 for 250 m/s.
Figure 14 shows the pressure variation along the tube axis in the front and rear of the pod (depicted in Figure 15) for s. Compression waves are generated ahead of the pod and propagate in the same direction, whereas expansion waves propagate in the opposite direction. The following equation presents the pressure ratio for flows across a normal shock [27,31]:
with
The term in Equation (19) is the pressure term of the front shockwave shown in Figure 16a. Figure 16a compares the pressure magnitude of the front shockwave between BRs of 0.25 and 0.36. The results indicate that a higher BR produces a higher front shockwave pressure. In Figure 12, Figure 13 and Figure 14, stronger compression waves form in front of the pod with increase of . This behavior of front waves is similar to the phenomenon in the normal shockwave theory. Hence, Figure 16b compares the compression wave propagation speed generated in front of the pod from the simulation with the ones calculated by Equations (19) and (20). There is a good agreement between the two results. Therefore, the compression wave generated in front of the pod in this study conforms to the normal shockwave theory.
4. Conclusions
This study simulated the unsteady conditions of a Hyperloop system using the overset moving mesh to investigate the influences of pod speed, BR, tube pressure, and pod length on the aerodynamic drag and pressure waves induced in the system.
The results provide a clear picture of the variation of the drag coefficient. The drag coefficient is maximized at lower pod speeds with a higher BR, in other words, 225 m/s for BR = 0.36 and 250 m/s for BR = 0.25. The drag coefficient increases with the increase of pod speed, BR, and pod length. In the Hyperloop system, pressure drag is regarded as a considerable component of total drag, whereas the influence of friction drag is minor. In addition, the pressure difference between the nose and the tail significantly impacts the pressure drag, and consequently the total drag. The drag increases proportionally with the tube pressure, whereas the drag coefficient decreases slightly. The increase of total drag with the increase of pod length is mostly dependent on the increment of the friction drag.
The presence of compression waves and expansion waves generates the opposite tendency of pressure in the front and rear of the pod. Once the local flow speed exceeds the supersonic speed, oblique shockwaves occur, vastly influencing the tail pressure of the pod. In the smaller tube (higher BR), the compressed air pushes the pod nose and significantly increases the pressure at the front while decreasing the pressure behind the pod.
The compression waves and expansion waves, along with their speeds were investigated. In the Hyperloop system, these waves become faster than the local speed of sound at lower internal tube pressures and higher operating speeds. As BR increases, the speed of compression wave propagation is largely affected, while the expansion waves propagate at a similar speed. The study also suggested that the normal shockwave theory can be used to predict the variation of compression wave propagation speed.
Author Contributions
Conceptualization, methodology, and investigation: T.T.G.L. and J.R.; validation and writing—original draft preparation: T.T.G.L.; formal analysis, data curation, and visualization: T.T.G.L. and K.S.J.; writing—review and editing, supervision, project administration, and funding acquisition: K.-S.L. and J.R. All authors have read and agreed to the published version of the manuscript.
Funding
This research was supported by the MSIT (Ministry of Science and ICT), Korea, under the ITRC (Information Technology Research Center) support program (IITP-2020-2020-0-01655) supervised by the IITP (Institute of Information and Communications Technology Planning and Evaluation), and by the National Research Foundation of Korea (NRF) grant funded by the Korean government (MEST) (No. 2019R1A2C1087763). This research was supported by “Core Technology Development of Subsonic Capsule Train” of the Korea Railroad Research Institute under Grant PK2001A1A, Korea.
Conflicts of Interest
The authors declare no conflict of interest.
Appendix A. Pressure Wave Propagation with Respect to Simulation Time
In this study, 1 s was sufficient for the flow to fully develop. Therefore, the tube was created long enough and the pod was placed at the given position to prevent the pressure waves from being reflected by the boundaries in 1 s. The following figures show that at t = 1s, the compression waves and expansion waves do not reflect off the boundaries. Therefore, the designed geometry is reasonable.
Figure A1.
Pressure line plot along the centerline in the front and rear of the pod varied with simulation time ( = 350 m/s). The simulation was terminated before the expansion wave could reflect off from the outlet boundary.
Figure A1.
Pressure line plot along the centerline in the front and rear of the pod varied with simulation time ( = 350 m/s). The simulation was terminated before the expansion wave could reflect off from the outlet boundary.

Appendix B
Figure A2.
Variation of friction drag coefficients on blockage ratio and (a) Re, (b) Mach number. Insets represent the variation of drag.
Figure A2.
Variation of friction drag coefficients on blockage ratio and (a) Re, (b) Mach number. Insets represent the variation of drag.

Figure A3.
Variation of pressure drag coefficients on blockage ratio and (a) Re, (b) Mach number. Insets represent the variation of drag.
Figure A3.
Variation of pressure drag coefficients on blockage ratio and (a) Re, (b) Mach number. Insets represent the variation of drag.

Appendix C. High-Pressure Region
The pressure contours at the front and rear of the pod are shown in Figure A4 to describe the high-pressure region and the form of oblique shockwaves coexist with normal shockwaves. Figure A4 indicates that because the front wave propagation speed is much higher than the operating pod speed (150 m/s), a high-pressure region is created in places far from the nose. This is contrary to the phenomenon that occurs at a of 350 m/s, in which the high-pressure region occurs right in front of the nose. This means that when the local flow exceeds supersonic speed, the compression wave gets increasingly closer. This high-pressure region separates the pressure in front of the pod into two distinct regions: a disturbed region (orange-red color) and an undisturbed region (green color) that is at the initial tube pressure. A severe shock phenomenon occurs at a of 350 m/s, which did not appear at a of 150 m/s. The low-pressure region is not significant compared to other pressure regions behind the pod. Hence, it was not observed in the pressure contour.
Figure A4.
Pressure contour of pressure waves generated at the front and rear of the pod. The largest red regime describes the high-pressure regime.
Figure A4.
Pressure contour of pressure waves generated at the front and rear of the pod. The largest red regime describes the high-pressure regime.

References
- Musk, E. Hyperloop Alpha Documents; SapceX: Hawthorne, CA, USA, 2013. [Google Scholar]
- Opgenoord, M.M.J.; Merian, C.; Mayo, J.; Kirschen, P.; O’Rourke, C.; Izatt, G. MIT Hyperloop Final Report; Massachusetts Institute of Technology: Cambridge, MA, USA, 2017. [Google Scholar]
- Oster, D. Evacuated Tube Transport. U.S. Patent 5950543A, 14 September 1999. [Google Scholar]
- Taylor, C.L.; Hyde, D.J.; Barr, L.C. Hyperloop Commercial Feasibility Analysis: High Level Overview; John, A., Ed.; Volpe National Transportation Systems Center: Cambridge, MA, USA, 2016.
- Oh, J.-S.; Kang, T.; Ham, S.; Lee, K.-S.; Jang, Y.-J.; Ryou, H.-S.; Ryu, J. Numerical analysis of aerodynamic characteristics of hyperloop system. Energies 2019, 12, 518. [Google Scholar] [CrossRef] [Green Version]
- Yang, Y.; Wang, H.; Benedict, M.; Coleman, D. Aerodynamic Simulation of High-Speed Capsule in the Hyperloop System. In Proceedings of the 35th AIAA Applied Aerodynamics Conference, Denver, CO, USA, 5–9 June 2017. [Google Scholar]
- Gillani, S.A.; Panikulam, V.P.; Sadasivan, S.; Yaoping, Z. CFD Analysis of aerodynamic drag effects on vacuum tube trains. J. Appl. Fluid Mech. 2019, 12, 303–309. [Google Scholar] [CrossRef]
- Singh, Y.K.; Kamyar, M. Numerical analysis for aerodynamic behaviour of hyperloop pods. Preprints 2019. [Google Scholar] [CrossRef]
- Yoon, T.S.; Lee, S.; Hwang, J.H.; Lee, D.H. Prediction and validation on the sonic boom by a high-speed train entering a tunnel. J. Sound Vibrat. 2001, 247, 195–211. [Google Scholar] [CrossRef] [Green Version]
- Zhang, Y. Numerical simulation and analysis of aerodynamic drag on a subsonic train in evacuated tube transportation. J. Modern Transp. 2012, 20, 44–48. [Google Scholar] [CrossRef] [Green Version]
- Kang, H.; Jin, Y.; Kwon, H.; Kim, K. A Study on the aerodynamic drag of transonic vehicle in evacuated tube using computational fluid dynamics. Int. J. Aeronaut. Space Sci. 2017, 18, 614–622. [Google Scholar] [CrossRef]
- Kim, T.-K.; Kim, K.-Y.; Kwon, H.Y. Aerodynamic characteristics of a tube train. J. Wind Eng. Ind. Aerodyn. 2011, 99, 1187–1196. [Google Scholar] [CrossRef]
- Zonglin, J.; Matsuoka, K.; Sasoh, A.; Takayama, K. Numerical and experimental investigation of wave dynamic processes in high-speed train/tunnels. Acta Mech. Sin. 2002, 18, 209–226. [Google Scholar] [CrossRef] [Green Version]
- Steinbrenner, J.P. Automatic Structured and Unstructured Grid Cell Remediation for Overset Meshes. In Proceedings of the 52nd Aerospace Sciences Meeting, Harbor, MD, USA, 13–17 January 2014. [Google Scholar]
- ANSYS. ANSYS Fluent Version, 18.1 User’s Guide; ANSYS: Canonsburg, PA, USA, 2015. [Google Scholar]
- Cao, D.; He, G.; Qin, F.; Wei, X.; Shi, L.; Liu, B.; Huang, Z. LES Study on flow features of the supersonic mixing layer affected by shock waves. Int. Commun. Heat Mass Transf. 2017, 85, 114–123. [Google Scholar] [CrossRef]
- Choi, M.G.; Ryu, J. Numerical study of the axial gap and hot streak effects on thermal and flow characteristics in two-stage high pressure gas turbine. Energies 2018, 11, 2654. [Google Scholar] [CrossRef] [Green Version]
- Moin, P.; Mahesh, K. Direct numerical simulation: A tool in turbulence research. Ann. Rev. Fluid Mech. 1998, 30, 539–578. [Google Scholar] [CrossRef] [Green Version]
- Ryu, J.; Lele, S.K.; Viswanathan, K. Study of supersonic wave components in high-speed turbulent jets using an les database. J. Sound Vibrat. 2014, 333, 6900–6923. [Google Scholar] [CrossRef]
- Ryu, J.; Livescu, D. Turbulence structure behind the shock in canonical shock–vortical turbulence interaction. J. Fluid Mech. 2014, 756, 143–195. [Google Scholar] [CrossRef] [Green Version]
- Menter, F. Zonal Two Equation k-ω Turbulence Models for Aerodynamic Flows. In Proceedings of the 23rd Fluid Dynamics, Plasmadynamics, and Lasers Conference, Orlando, FL, USA, 6–9 July 1993. [Google Scholar]
- Rocha, P.A.; Costa, H.H.; Barbosa, R.; Moura Carneiro, F.O.; Vieira da Silva, M.E.; Valente Bueno, A. k-ω SST (Shear Stress Transport) turbulence model calibration: A case study on a small scale horizontal axis wind turbine. Energy 2014, 65, 412–418. [Google Scholar] [CrossRef]
- Hruschka, R.; Klatt, D. In-pipe aerodynamic characteristics of a projectile in comparison with free flight for transonic mach numbers. Shock Waves 2019, 29, 297–306. [Google Scholar] [CrossRef]
- Zhou, P.; Zhang, J.; Li, T. Effects of blocking ratio and mach number on aerodynamic characteristics of the evacuated tube train. Int. J. Rail Transp. 2020, 8, 27–44. [Google Scholar] [CrossRef]
- Zhou, P.; Zhang, J.; Li, T.; Zhang, W. Numerical study on wave phenomena produced by the super high-speed evacuated tube maglev train. J Wind Eng. Ind. Aerodyn. 2019, 190, 61–70. [Google Scholar] [CrossRef]
- Charters, A.C.; Thomas, R.N. The aerodynamic performance of small spheres from subsonic to high supersonic velocities. J. Aeronaut. Sci. 1945, 12, 468–476. [Google Scholar] [CrossRef]
- Munson, B.R.; Okiishi, T.H.; Huebsch, W.W.; Rothmayer, A.P. Fluid Mechanics; Wiley: Singapore, 2013. [Google Scholar]
- Sui, Y.; Niu, J.; Yuan, Y.; Yu, Q.; Cao, X.; Wu, D.; Yang, X. An aerothermal study of influence of blockage ratio on a supersonic tube train system. J. Therm. Sci. 2020, 29. [Google Scholar] [CrossRef]
- Raghunathan, R.S.; Kim, H.-D.; Setoguchi, T. Aerodynamics of high-speed railway train. Progress Aerospace Sci. 2002, 38, 469–514. [Google Scholar] [CrossRef]
- Baron, A.; Mossi, M.; Sibilla, S. The alleviation of the aerodynamic drag and wave effects of high-speed trains in very long tunnels. J. Wind Eng. Ind. Aerodyn. 2001, 89, 365–401. [Google Scholar] [CrossRef]
- Anderson, J.D. Modern Compressible Flow: With Historical Perspective; McGraw-Hill: New York, NY, USA, 1990; Volume 12. [Google Scholar]
Figure 1.
Geometry and boundary conditions of the simulation. for BR = 0.36 and for BR = 0.25.
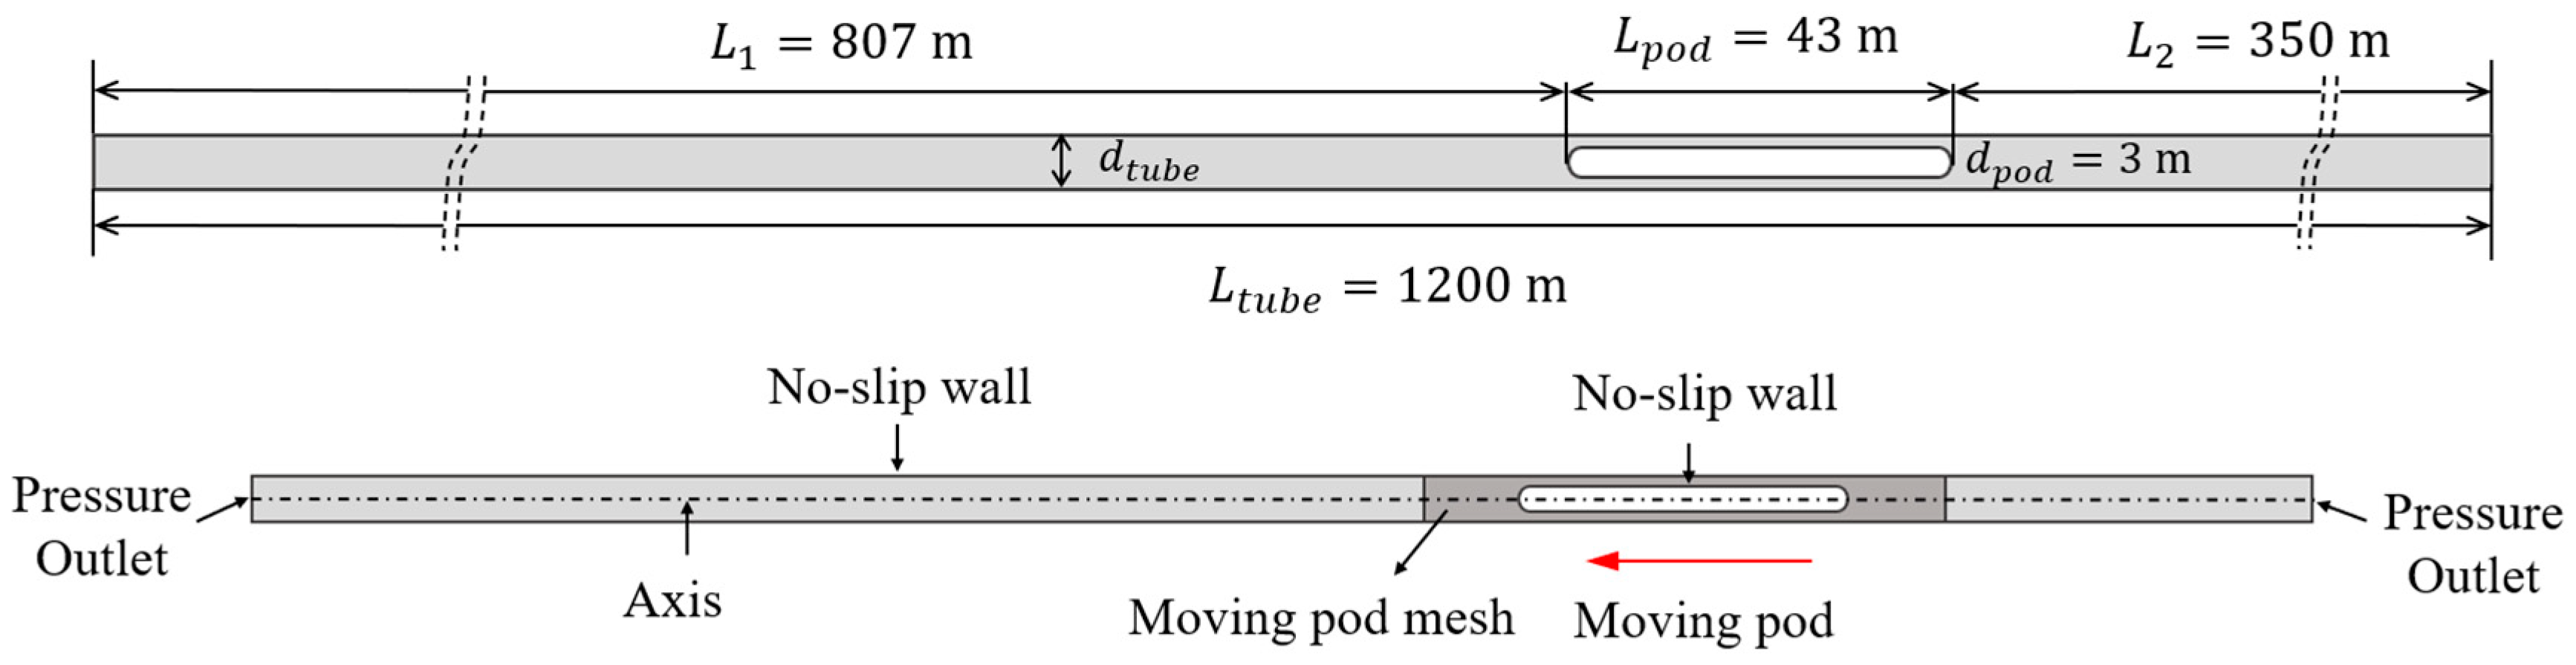
Figure 2.
Schematic of the overset mesh generation. The number of meshes in this figure is only 1/10 of the number of final meshes. Yellow lines represent the overset boundaries where the pod mesh (a) and tube mesh connect (b). When two meshes overlap, the redundant mesh of the tube mesh vanishes as shown in (c).

Figure 3.
Variation of around the pod surface and tube wall at a pod speed of 350 m/s. The maximum was obtained at the nose of the pod.
Figure 3.
Variation of around the pod surface and tube wall at a pod speed of 350 m/s. The maximum was obtained at the nose of the pod.

Figure 4.
Variation of (a) drag and (b) compression wave propagation with respect to time in unsteady conditions. All results after the initial transients are analyzed.
Figure 4.
Variation of (a) drag and (b) compression wave propagation with respect to time in unsteady conditions. All results after the initial transients are analyzed.
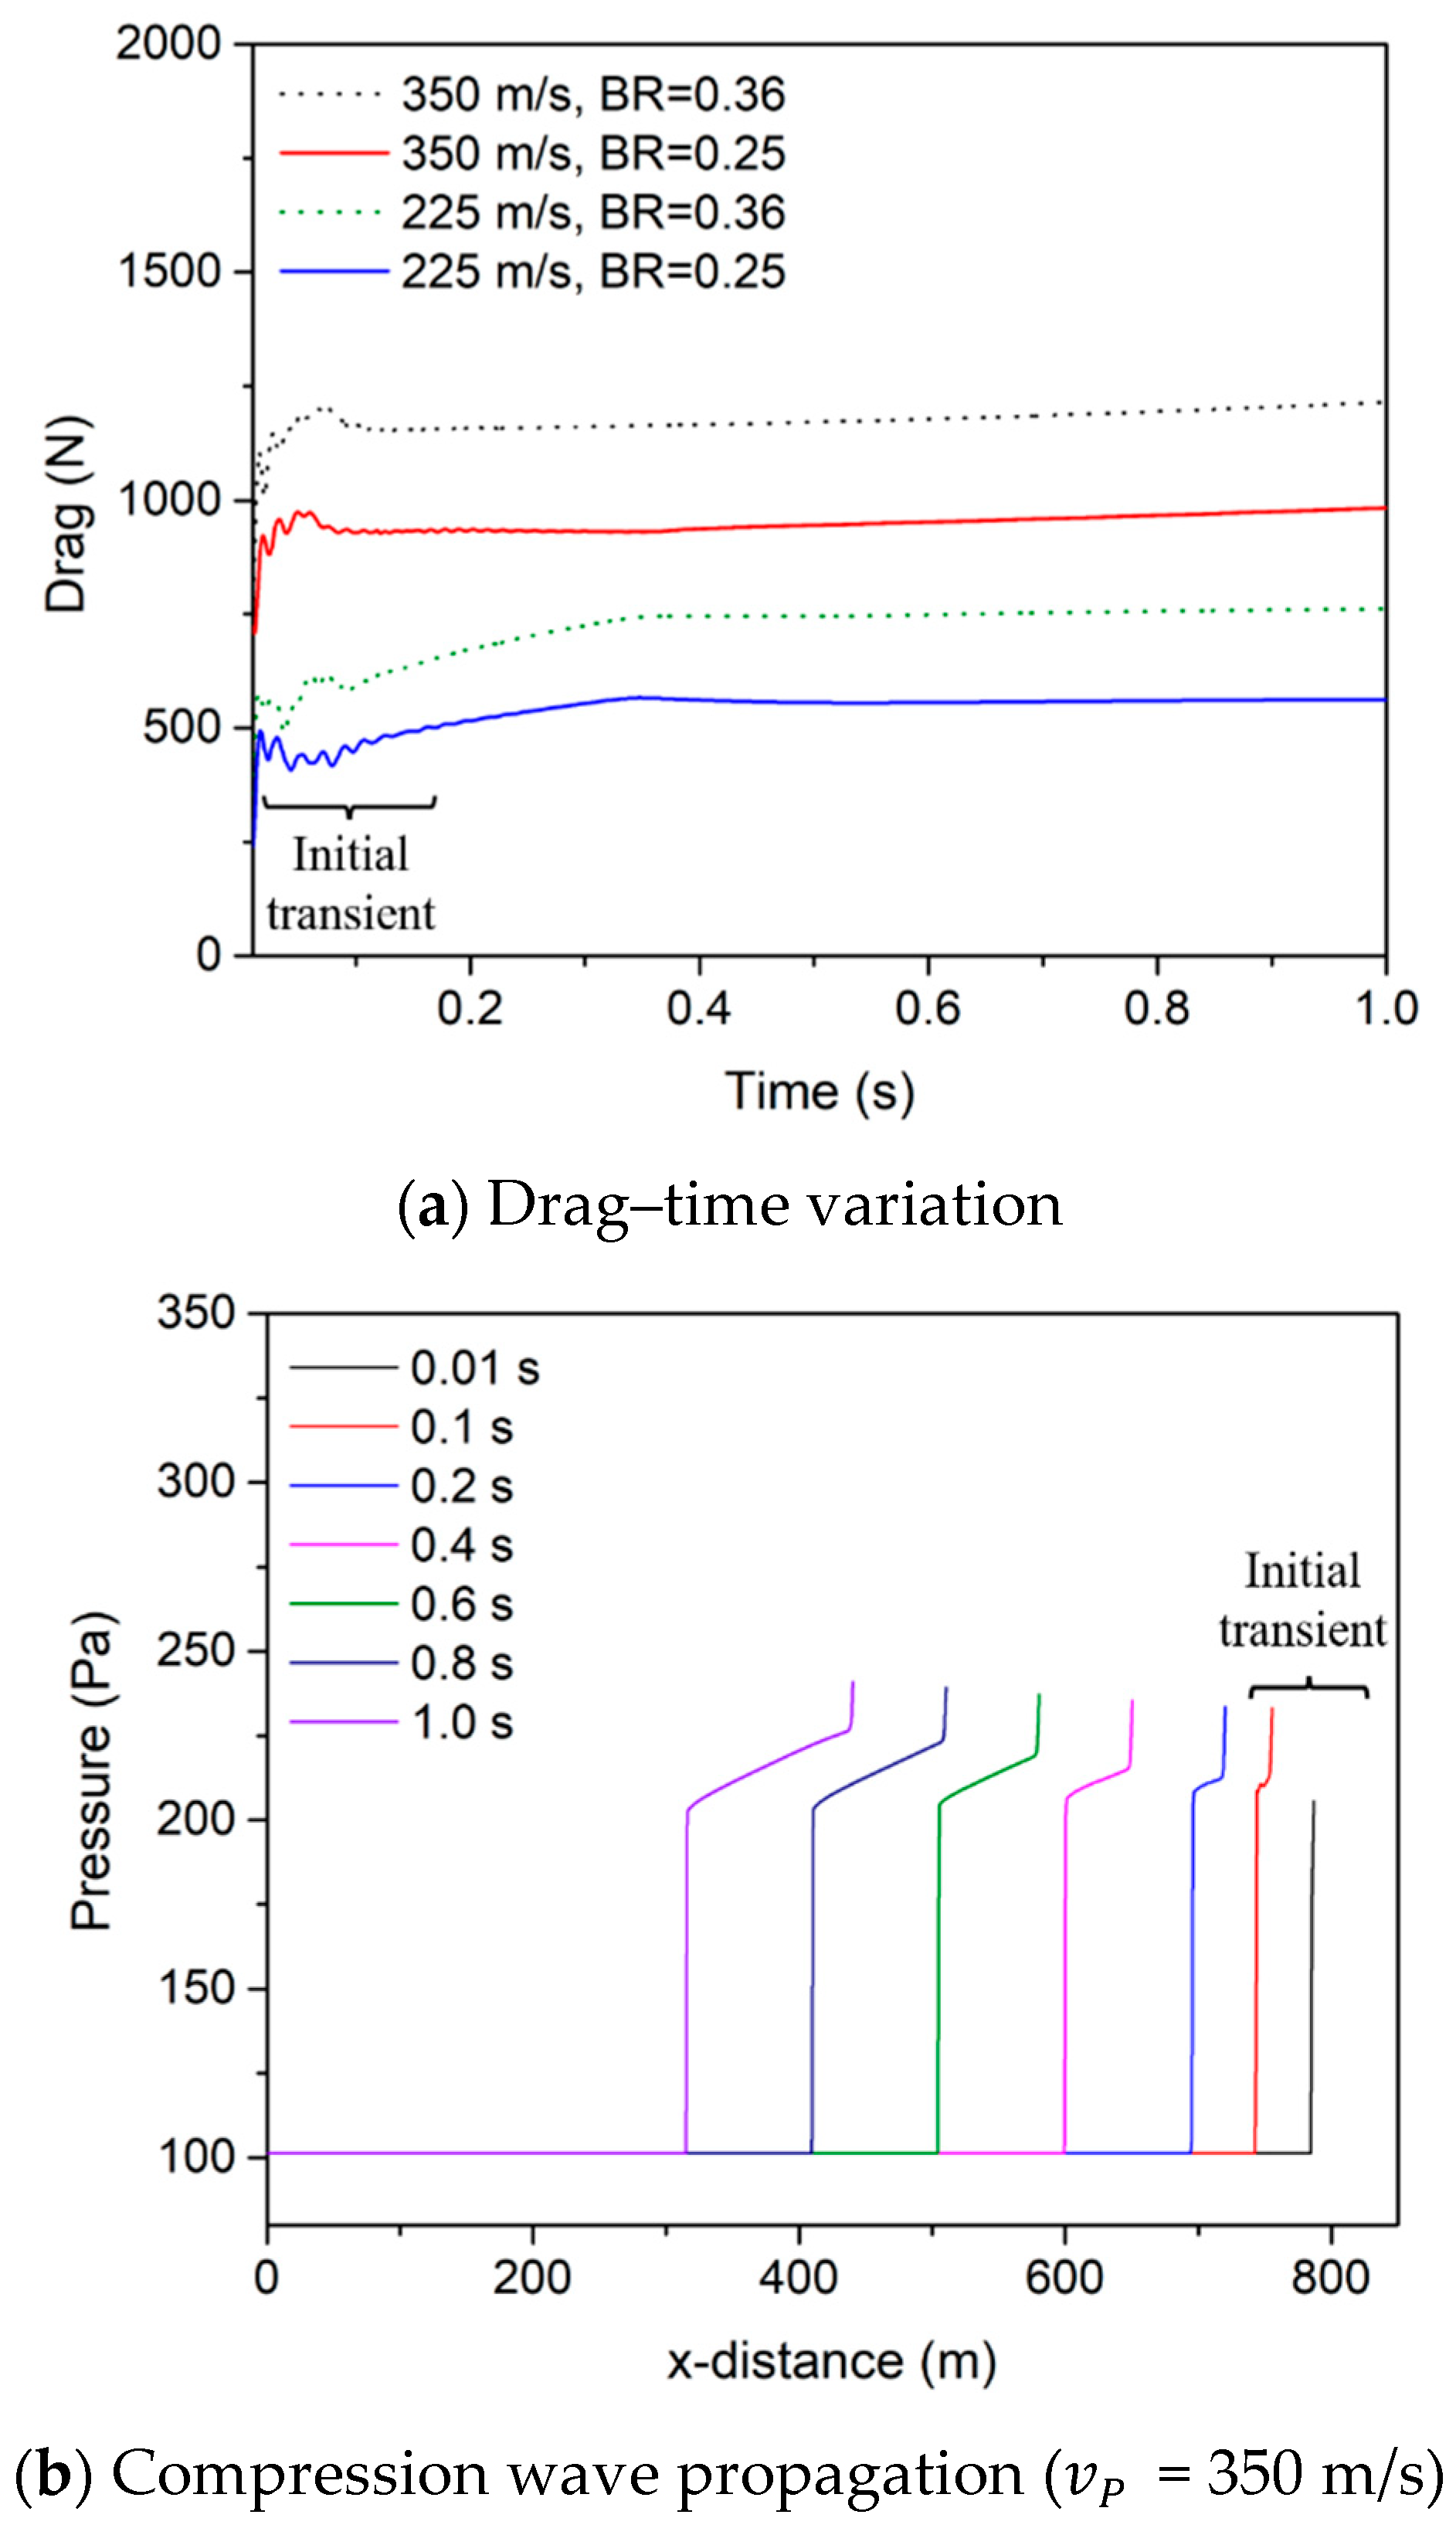
Figure 5.
Comparison of drag coefficients between the 2D axisymmetric simulation and the experimental data for a 14.28-mm sphere reported by Charters and Thomas [26].
Figure 5.
Comparison of drag coefficients between the 2D axisymmetric simulation and the experimental data for a 14.28-mm sphere reported by Charters and Thomas [26].

Figure 6.
Variations of (a) friction and (b) pressure drag coefficients with pod speed and blockage ratio. Insets illustrate the variation of drag.
Figure 6.
Variations of (a) friction and (b) pressure drag coefficients with pod speed and blockage ratio. Insets illustrate the variation of drag.
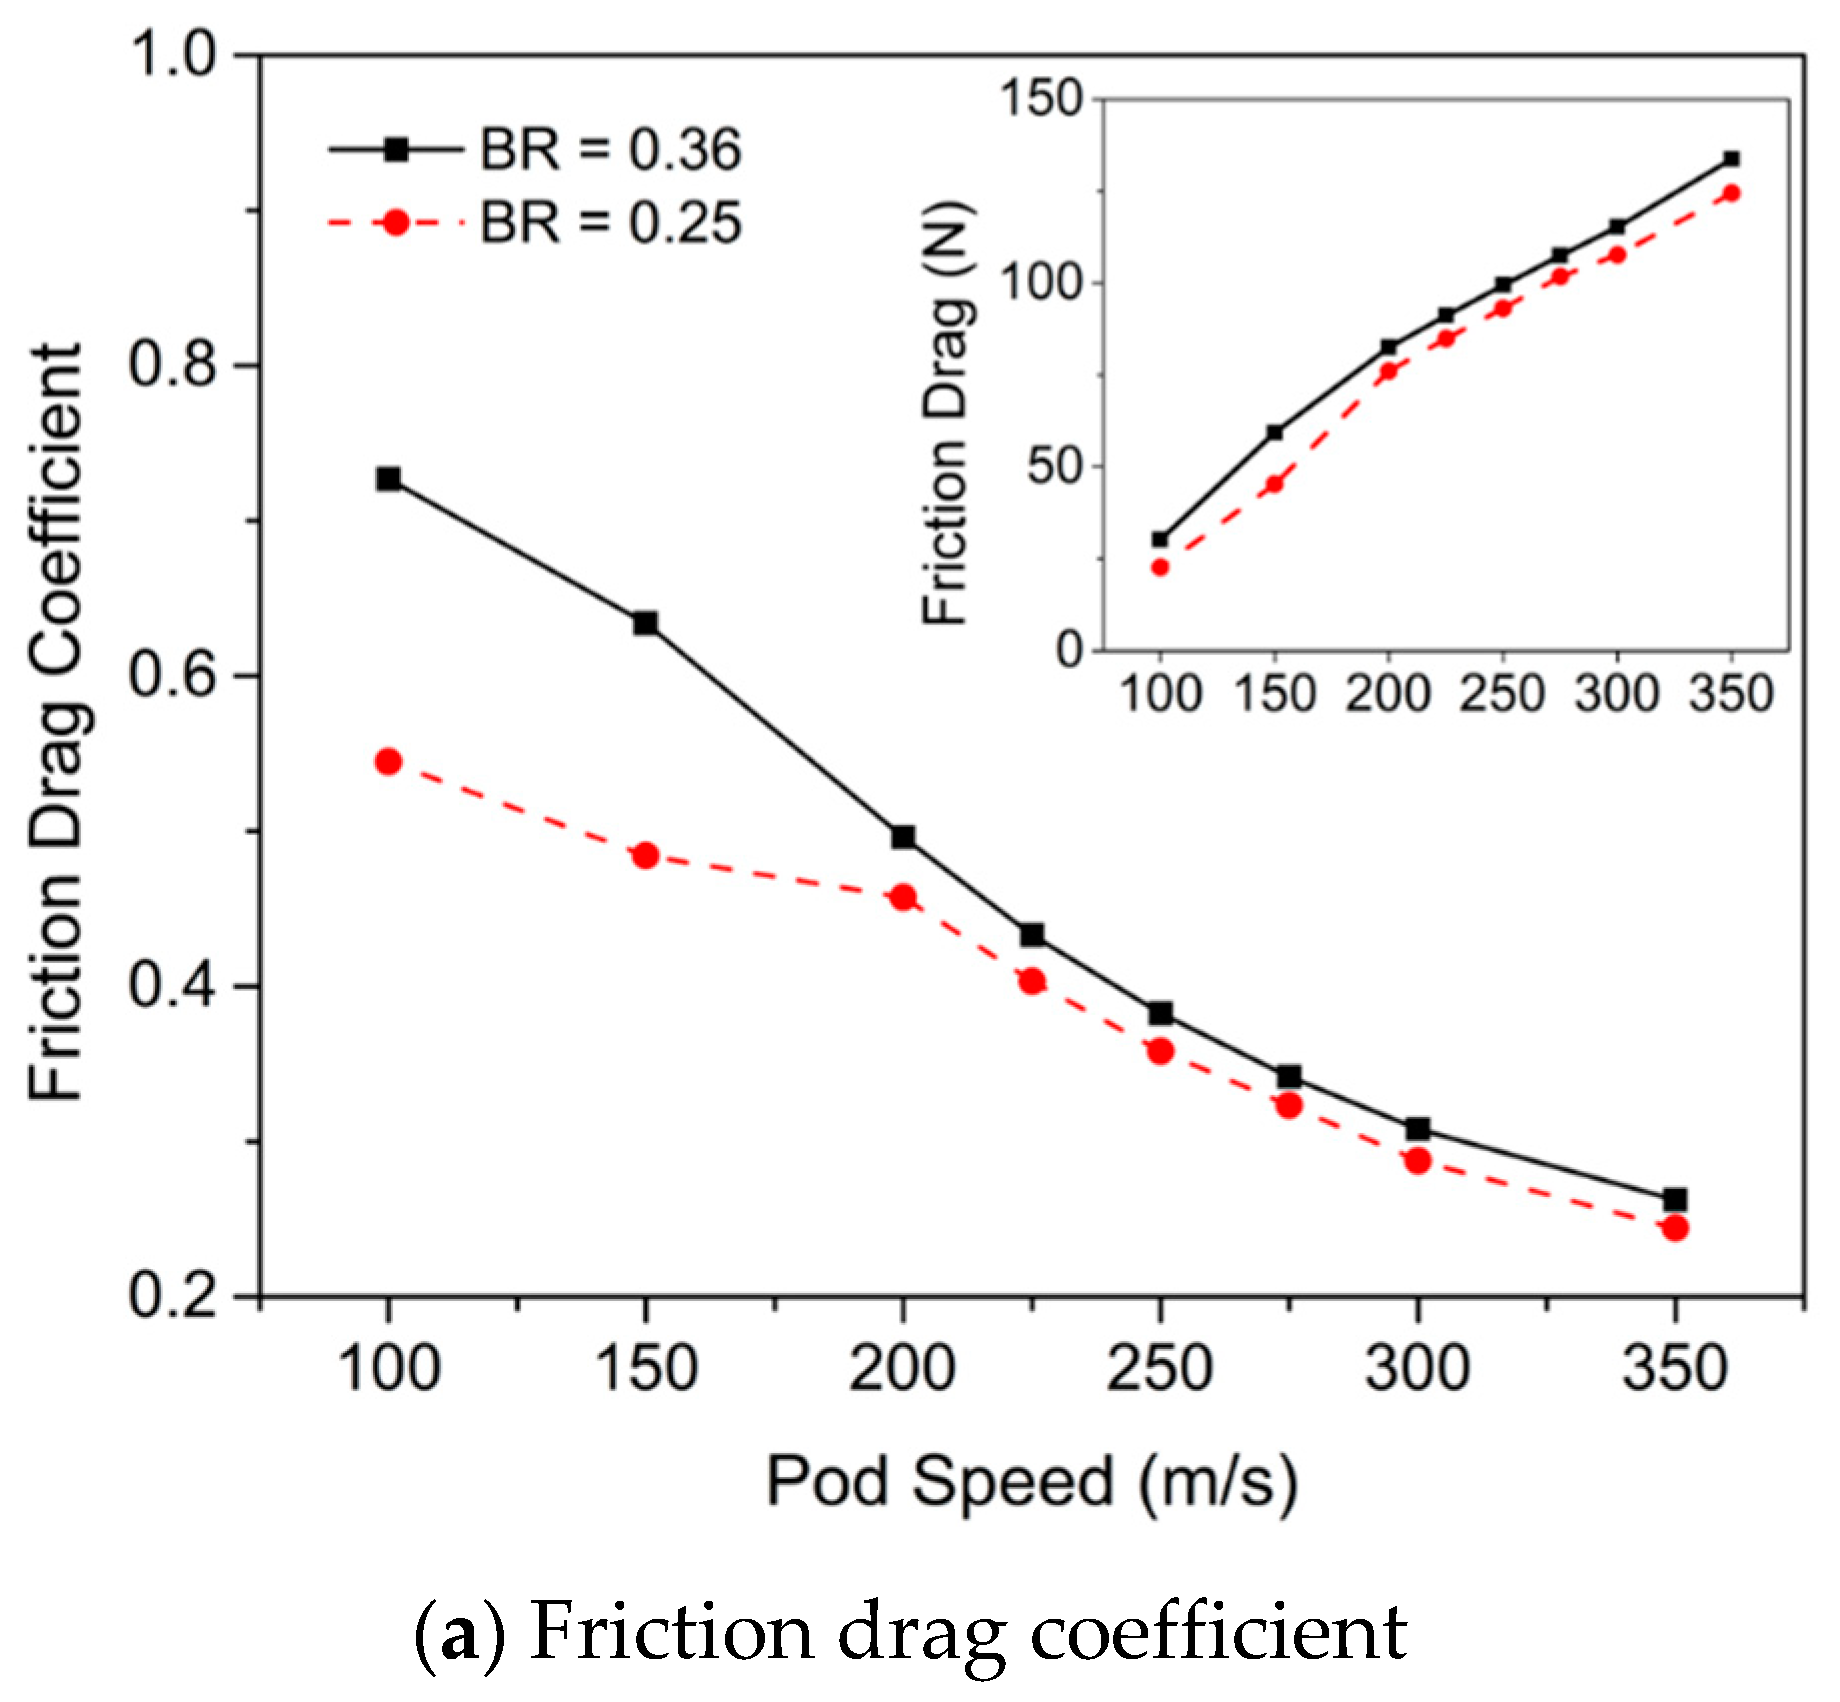
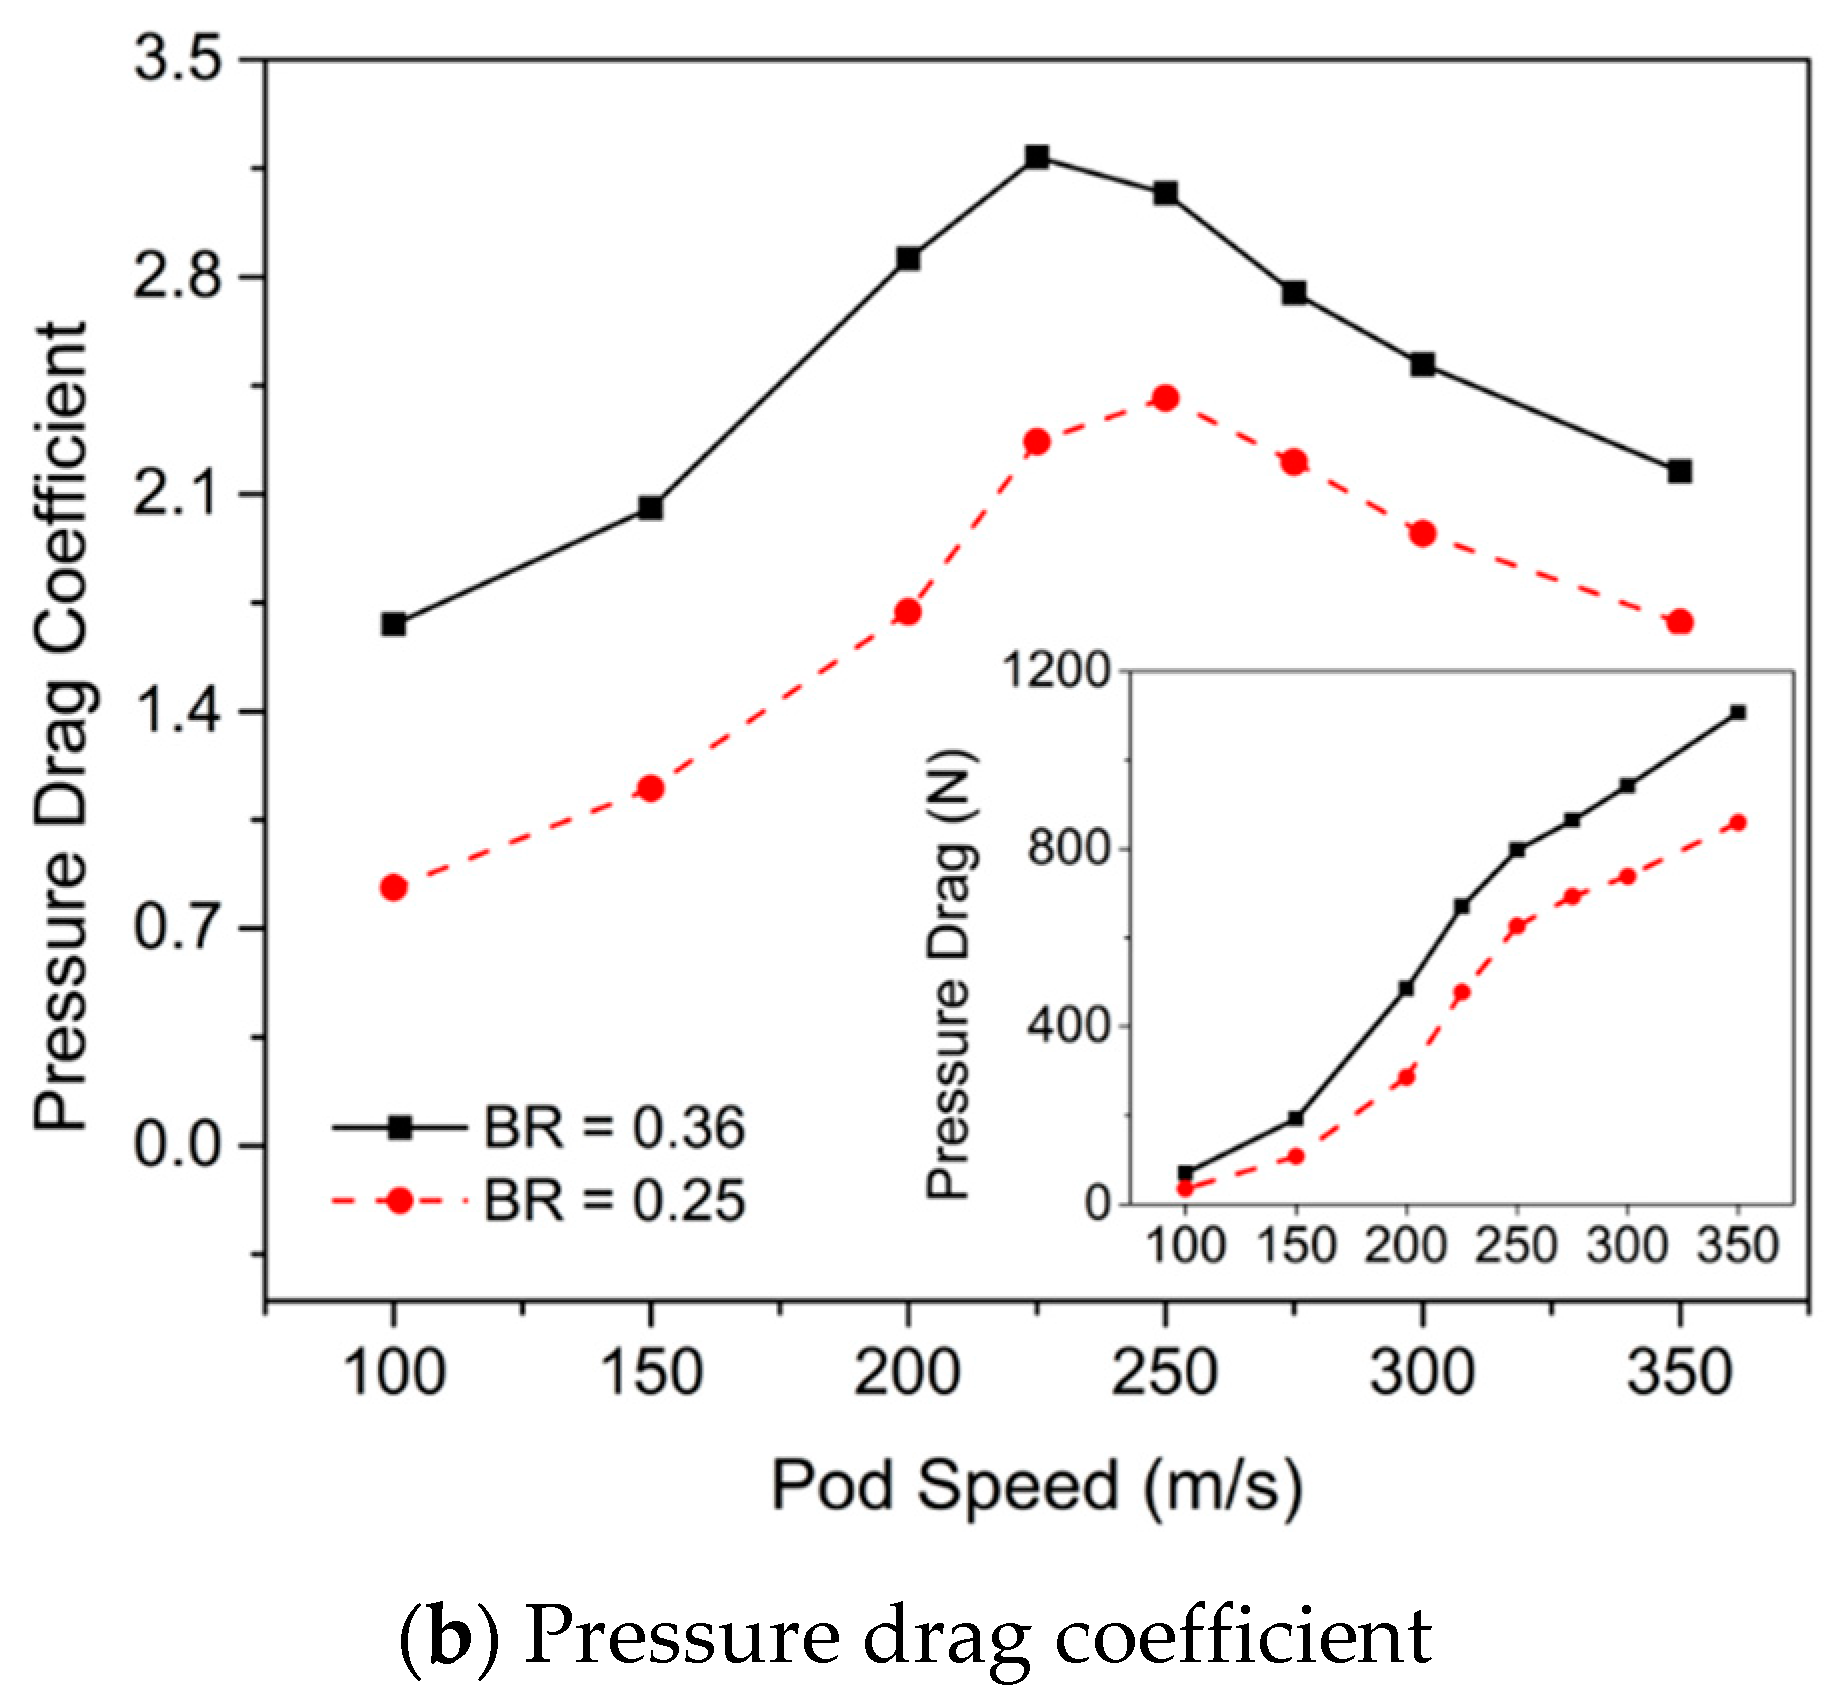
Figure 7.
Ratios of the pressure and friction drags to the total drag. The results are similar to those of Oh et al. (2019) [5], who conducted steady-state simulations.
Figure 7.
Ratios of the pressure and friction drags to the total drag. The results are similar to those of Oh et al. (2019) [5], who conducted steady-state simulations.
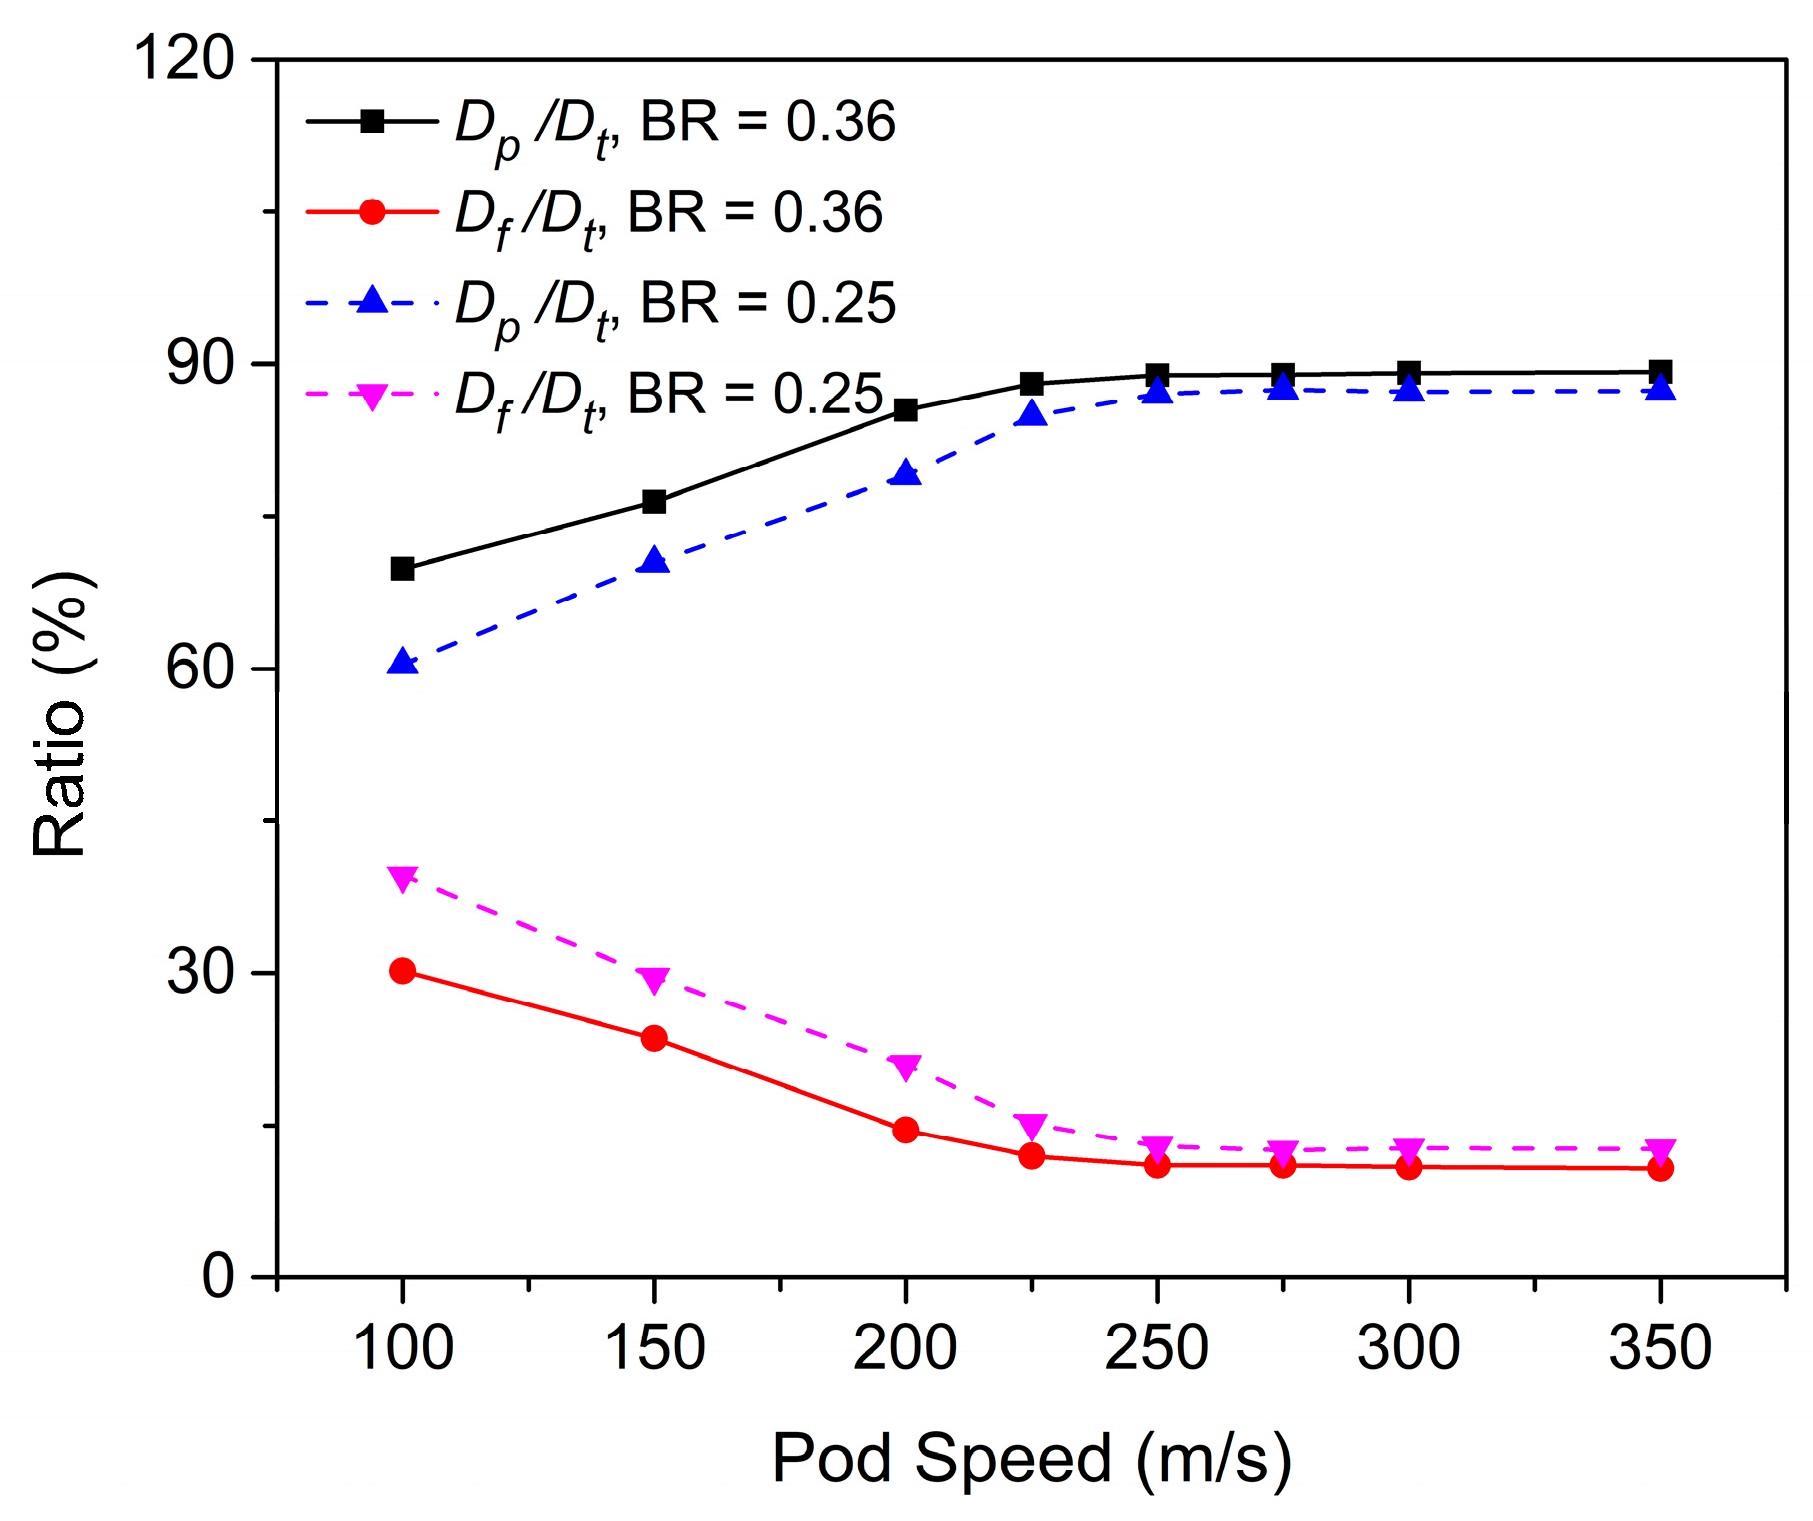
Figure 8.
Pressure contours for selected pod speeds with , , and (a–e) for BR = 0.25, (f–j) for BR = 0.36. Contour levels are fixed for each pod speed.
Figure 8.
Pressure contours for selected pod speeds with , , and (a–e) for BR = 0.25, (f–j) for BR = 0.36. Contour levels are fixed for each pod speed.

Figure 9.
(a) Pressure difference between the nose and the tail. (b) Pressure distribution across the pod surface . Inset shows the magnified view of the tail.
Figure 9.
(a) Pressure difference between the nose and the tail. (b) Pressure distribution across the pod surface . Inset shows the magnified view of the tail.

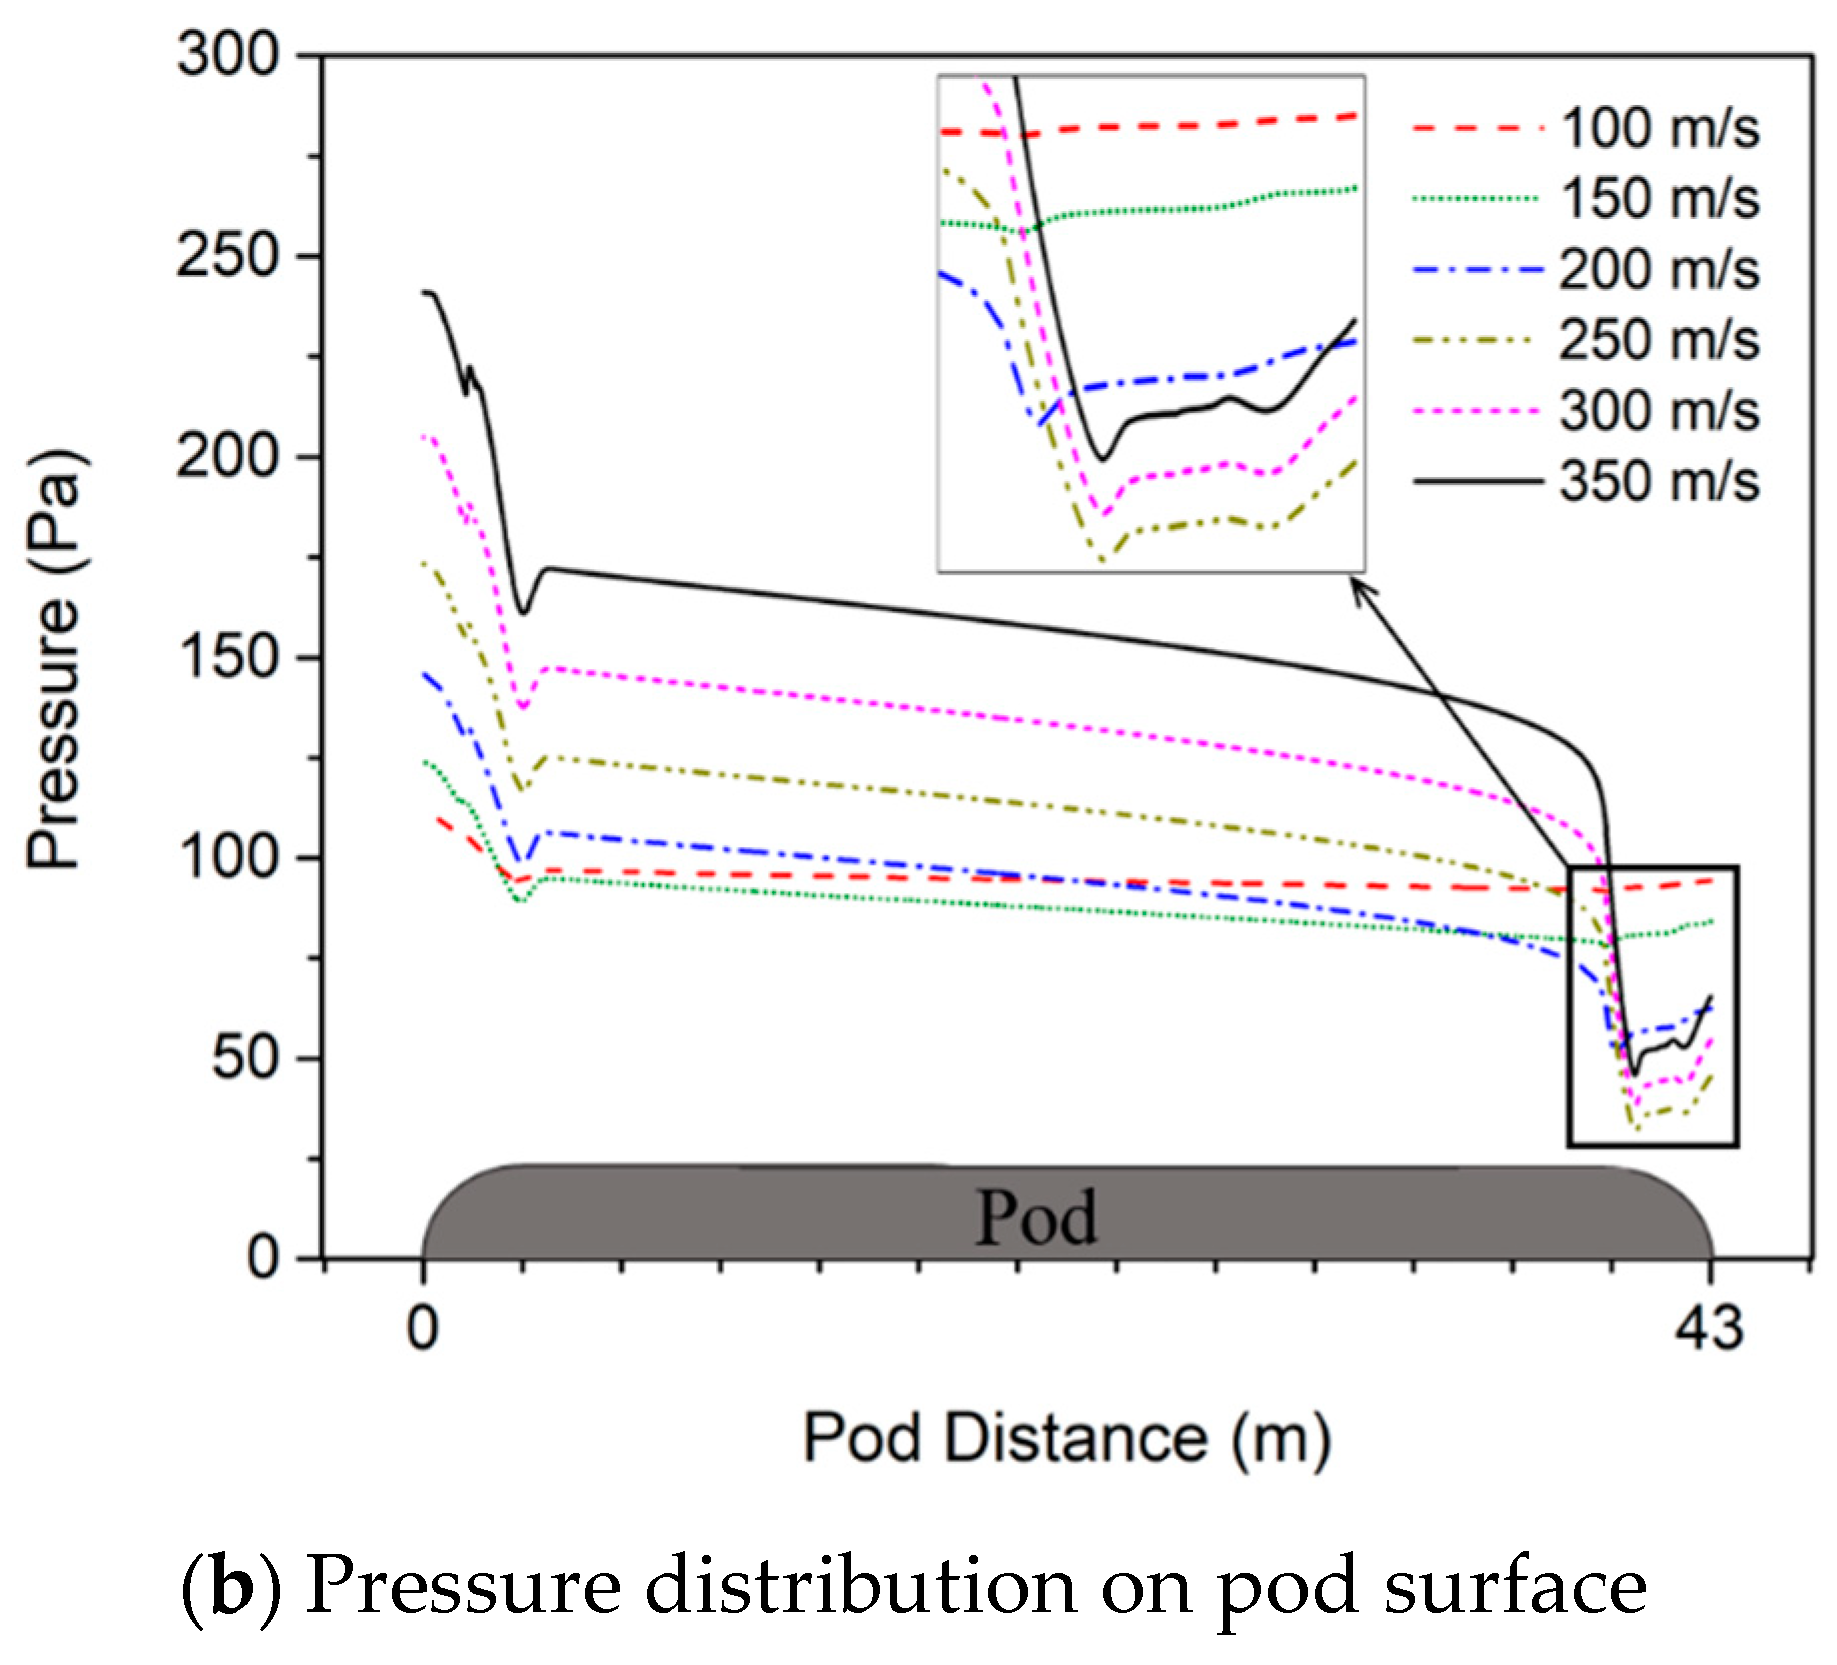
Figure 10.
Effect of tube pressure: (a) Variation of drag and drag coefficient with respect to the tube pressure. (b) Ratios of the pressure and friction drags to the total drag.
Figure 10.
Effect of tube pressure: (a) Variation of drag and drag coefficient with respect to the tube pressure. (b) Ratios of the pressure and friction drags to the total drag.

Figure 11.
Effect of pod length: (a) Variation of drag and drag coefficient with respect to pod length. The results are similar to those of the steady state study by Oh et al., (2019) [5] (the difference is below 17%). (b) Ratio of pressure and friction drag to total drag.
Figure 11.
Effect of pod length: (a) Variation of drag and drag coefficient with respect to pod length. The results are similar to those of the steady state study by Oh et al., (2019) [5] (the difference is below 17%). (b) Ratio of pressure and friction drag to total drag.

Figure 12.
Forward and backward pressure wave propagation speeds observed in (a) absolute coordinates (the reference frame is fixed) and (b) pod-relative coordinates (the reference frame moves with the pod). The red dashed line represents the speed of sound (347.1 m/s).
Figure 12.
Forward and backward pressure wave propagation speeds observed in (a) absolute coordinates (the reference frame is fixed) and (b) pod-relative coordinates (the reference frame moves with the pod). The red dashed line represents the speed of sound (347.1 m/s).

Figure 13.
Pressure wave distribution along the centerline of the tube and pod surface at = 1.0 s. Four cases of selected pod speeds under , , and BR = 0.36 are presented. Pod moves from right to left.
Figure 13.
Pressure wave distribution along the centerline of the tube and pod surface at = 1.0 s. Four cases of selected pod speeds under , , and BR = 0.36 are presented. Pod moves from right to left.

Figure 14.
Pressure distributions of line 1 (the axis line in front of the pod) and line 2 (the axis line at the rear of the pod) for (, BR = 0.36, , ). Pod moves from right to left. Red triangles represent the tube pressure of 101.325 Pa.
Figure 14.
Pressure distributions of line 1 (the axis line in front of the pod) and line 2 (the axis line at the rear of the pod) for (, BR = 0.36, , ). Pod moves from right to left. Red triangles represent the tube pressure of 101.325 Pa.

Figure 15.
Descriptions of line 1 and line 2 from Figure 12.
Figure 15.
Descriptions of line 1 and line 2 from Figure 12.

Figure 16.
Pressure magnitude and speed of front shockwave. The compression wave is well-matched with the normal shockwave theory. (a) Pressure magnitude of compression wave traveling in the forward direction of the pod. (b) Comparison of compression wave propagation speeds calculated using the simulation and normal shockwave equations.


Table 1.
Grid independent test: Only the pod zone is demonstrated. Drag force and maximum pressure are used to estimate the grid. —pressure drag, —friction drag, —total drag, and —maximum pressure. Mesh 2 is applied in all simulations. Total number of elements in this simulation is 1,684,782.
Table 1.
Grid independent test: Only the pod zone is demonstrated. Drag force and maximum pressure are used to estimate the grid. —pressure drag, —friction drag, —total drag, and —maximum pressure. Mesh 2 is applied in all simulations. Total number of elements in this simulation is 1,684,782.
| Case | Total Number of Cells (Pod Zone) | ||||
|---|---|---|---|---|---|
| Mesh 1 | 638,067 | 1108.33 (0.13%) | 134.62 (0.72%) | 1242.95 (0.19%) | 238.09 (1.34%) |
| Mesh 2 | 704,331 | 1106.89 (0.005%) | 133.60 (0.26%) | 1240.49 (0.02%) | 241.28 (0.004%) |
| Mesh 3 | 792,607 | 1106.83 | 133.31 | 1240.20 | 241.27 |
Table 2.
Variation of Reynolds number (Re) with respect to pod speed and BR.
| Pod Speed (m/s) | 100 | 150 | 200 | 225 | 250 | 275 | 300 | 350 | |
|---|---|---|---|---|---|---|---|---|---|
| Re | BR = 0.36 | 12,752 | 9128 | 25,504 | 28,692 | 31,880 | 35,068 | 38,256 | 44,632 |
| BR = 0.25 | 19,128 | 28,692 | 38,256 | 43,037 | 47,820 | 52,602 | 57,383 | 66,947 | |
Publisher’s Note: MDPI stays neutral with regard to jurisdictional claims in published maps and institutional affiliations. |
© 2020 by the authors. Licensee MDPI, Basel, Switzerland. This article is an open access article distributed under the terms and conditions of the Creative Commons Attribution (CC BY) license (http://creativecommons.org/licenses/by/4.0/).
Share and Cite
MDPI and ACS Style
Le, T.T.G.; Jang, K.S.; Lee, K.-S.; Ryu, J. Numerical Investigation of Aerodynamic Drag and Pressure Waves in Hyperloop Systems. Mathematics 2020, 8, 1973. https://doi.org/10.3390/math8111973
AMA Style
Le TTG, Jang KS, Lee K-S, Ryu J. Numerical Investigation of Aerodynamic Drag and Pressure Waves in Hyperloop Systems. Mathematics. 2020; 8(11):1973. https://doi.org/10.3390/math8111973
Chicago/Turabian StyleLe, Thi Thanh Giang, Kyeong Sik Jang, Kwan-Sup Lee, and Jaiyoung Ryu. 2020. "Numerical Investigation of Aerodynamic Drag and Pressure Waves in Hyperloop Systems" Mathematics 8, no. 11: 1973. https://doi.org/10.3390/math8111973
Note that from the first issue of 2016, this journal uses article numbers instead of page numbers. See further details here.