Effects of Leading-Edge Modification in Damaged Rotor Blades on Aerodynamic Characteristics of High-Pressure Gas Turbine


1
Department of Mechanical Engineering, Chung-Ang University, Seoul 06911, Korea
2
Department of Intelligent Energy and Industry, Chung-Ang University, Seoul 06911, Korea
*
Author to whom correspondence should be addressed.
Mathematics 2020, 8(12), 2191; https://doi.org/10.3390/math8122191
Submission received: 9 November 2020
/
Revised: 3 December 2020
/
Accepted: 5 December 2020
/
Published: 9 December 2020
(This article belongs to the Special Issue Computational Fluid Dynamics 2020)
Abstract
:The flow and heat-transfer attributes of gas turbines significantly affect the output power and overall efficiency of combined-cycle power plants. However, the high-temperature and high-pressure environment can damage the turbine blade surface, potentially resulting in failure of the power plant. Because of the elevated cost of replacing turbine blades, damaged blades are usually repaired through modification of their profile around the damage location. This study compared the effects of modifying various damage locations along the leading edge of a rotor blade on the performance of the gas turbine. We simulated five rotor blades—an undamaged blade (reference) and blades damaged on the pressure and suction sides at the top and middle. The Reynolds-averaged Navier–Stokes equation was used to investigate the compressible flow in a GE-E3 gas turbine. The results showed that the temperatures of the blade and vane surfaces with damages at the middle increased by about 0.8% and 1.2%, respectively. This causes a sudden increase in the heat transfer and thermal stress on the blade and vane surfaces, especially around the damage location. Compared with the reference case, modifications to the top-damaged blades produced a slight increase in efficiency about 2.6%, while those to the middle-damaged blades reduced the efficiency by approximately 2.2%.
1. Introduction
Unlike the conventional thermal power plants using coal as the power source, combined-cycle power plants (CCPPs) utilizes natural gas to generate electricity to satisfy the industrial demand and daily consumption, reducing the CO2 emission. Hence, for environmental concerns, CCPPs have been widely used in replacement of the thermal power plants in recent years. In CCPPs, the gas turbine is one of the most important components as it has a significant effect on power generation and overall efficiency. To enhance the power and efficiency of a CCPP, the turbine inlet temperature (TIT) is usually increased. The TIT is strongly affected by the outlet flow and temperature distribution of the combustor. This complex phenomenon in the TIT is called a hot streak (HS). The conditions of HS operation are similar to the actual operation conditions of gas turbines. Hence, it is important to examine the conditions of a HS in the analysis of gas turbine performance. Several experimental and numerical studies have been conducted to analyze the effects of a HS on the flow and heat transfer characteristics of a gas turbine [1,2]. Therefore, it is necessary to consider the HS condition instead of uniform inlet temperature conditions when performing simulations, for more accurate results and to reflect the actual operation conditions of a gas turbine.
In general, the turbine blade are fabricated with metals or alloys, and the TIT is higher than the melting temperature of metals and alloys, which usually is affected by pressure [3,4]. Hence, if the TIT is increased to enhance efficiency, the flow and heat transfer characteristics of the blade surface will be significantly affected. If a suitable cooling method cannot be provided, a sudden increase in heat loads will be produced on the blade surface, which will ultimately reduce the fatigue life of the blade or could even damage the blade after a certain time. Primary turbine blades can suffer several types of damage, such as dents, scores, and scratches, which can occur on the leading as well as trailing edge of the blade and which have a significant effect on the gas turbine performance. Replacing a damaged blade is more expensive than repairing it. Consequently, the latter is the preferred option. Kaewbumrung et al. [5] proposed a repair method for a damaged blade in the compressor, i.e., the blend method. The surface of the damaged blade becomes smoother after repair, which improves its aerodynamic performance in the compressor compared with that of unmodified blades.
The reasons behind the failure of gas turbine blades have been extensively investigated. Kumari et al. [6] examined the effects of blade surface cracks on the internal structure of the blade. They also examined the path of crack propagation within the coating barrier layer. Witek [7] conducted experiments and simulations on crack growth propagation due to vibration in compressor blades. The simulation results agreed well with experimental results. Mazur et al. [8] analyzed the effects of the failure of the first-stage nozzle of a gas turbine on the fatigue life of the blades; they concluded that the failure of the nozzle significantly reduced the fatigue life of the blade. These studies have provided valuable insight into the effects of several parameters, such as axial gap, HS, and inlet pressure conditions, on the flow and heat transfer behaviors in normal blades. Moreover, cracking and crack growth propagation in damaged blades have been successfully predicted. However, previous studies have only investigated the effects of critical damage leading to sudden failure during operation or the effects of inlet conditions on normal blades, which provide limited information regarding primary damage to blades and its effect on the flow and thermal characteristics of a turbine.
Many studies have examined the heat flow characteristics of the surface of normal turbine blades under various conditions. Choi and Ryu [9] investigated the effects of the axial gap and inlet temperature conditions on the thermal flow characteristics of a blade surface. They claimed that the thermal load on the surface of rotor blades increased when the axial gap decreased. Wang et al. [10] examined the differences between the effects of uniform and non-uniform inlet pressures and temperatures on the aerodynamic characteristics of turbine blades. Azad et al. [11] reported the effects of the tip gap and inlet turbulence intensity on the local heat transfer at the tip surface. They found that a higher tip gap, as well as a higher turbulence intensity, resulted in a higher heat transfer coefficient on the tip surface. These studies focused only on normal blades without surface damage. Therefore, it is crucial to determine the combined effects of the primary damage and inlet conditions, especially HS conditions, on the complex heat flow in a gas turbine.
Gas turbines should be simulated with multistage conditions for predicting the flow and heat transfer characteristics in the passage and on the blade surface more accurately. However, multistage gas turbine simulations are expensive; hence, previous studies have considered only one stage for the simulation [10,11,12,13,14]. Furthermore, the first stage of a gas turbine is significantly affected by the HS condition. In this study, we consider minor damage to a rotor blade. Therefore, 1.5 stages are sufficient to predict the combined effects of the HS condition and rotor blade damage on the flow and heat transfer characteristics in the passage and on the blade surface.
It is necessary to examine the influence of rotor blade damage on the flow and heat transfer in high-pressure gas turbines under the HS condition. This study provides a clearer understanding of the heat flow and thermal characteristics of gas turbines with blades damaged at different locations. It is important for engineers to identify the locations that require greater protection from damage, as this can reduce maintenance costs, which are considered to be the highest among the operating costs of gas turbines. Therefore, unsteady simulation was performed to analyze the combined effects of the HS condition and modification of damaged rotor blades on the aerodynamic characteristics and heat flow behaviors in a 1.5-stage high-pressure gas turbine.
2. Numerical Details
2.1. Geometry and Grid
In this study, a model of the first 1.5 stages in a GE-E3 engine was used as the gas turbine model for the unsteady simulation. The original turbine stage has 46 stator guide vanes, 76 rotor blades in the first stage, and 48 stator guide vanes in the next half stage [15]. For accurate prediction, the pitch angles of one stator vane and two rotor blades should be the same. This assumption can be realized using a domain scaling method [16]. In this study, the number and other parameters of the rotor blades were fixed. After applying the domain scaling method, the first and second stator vanes were magnified by 46/38 times and 48/38 times, respectively. Details regarding the vanes and blades can be found in a previous numerical study [9]. In this study, we assumed that the rotor blade initially had minor damage to the middle and top sections—on both the pressure and suction sides—to investigate the influence of various damage locations on the flow, heat transfer, and aerodynamic characteristics. The damage constituted approximately 0.5% of the volume of a normal blade. The final damage used in the simulations was the smoother post-modification damage. The computational domain consisted of two stator vanes and two rotor blades, as shown in Figure 1. Figure 1b shows the designs of the undamaged reference blade and the four blades with damage at different locations.
A specialized computational fluid dynamics (CFD) tool for meshing in turbomachinery analysis, ANSYS Turbogrid [17], was adopted for the mesh generation, as shown in Figure 2. We used the blade and vane geometry of the GE-E3 gas turbine engine. The simulation parameters and mesh generation process for the first stage were referred to from Choi and Ryu [9]. However, we used a different length for the outlet of the second stator vane (S2). Therefore, a grid-independent test had to be conducted to find an appropriate mesh size for S2. Consequently, we simulated a total of five mesh sizes and ultimately selected a mesh size of 2.4 million for the computation. Details of the grid-independent test for the second stator vane are shown in Table 1. After the grid-independent test, the total mesh size of the computational domain was approximately 8 million, with the value being less than 0.5 at the blade surface and less than 1 at the other walls. The variations in at different span-wise locations on the rotor blade are shown in Figure 3.
2.2. Governing Equations and Turbulence Model
To analyze the three-dimensional compressible fluid flow in a gas turbine under unsteady-state conditions, we used the continuity equation, momentum equation, and energy equation, which can be expressed as shown below:
Continuity equation:
Momentum equation:
Energy equation:
where is the fluid density, u is the fluid velocity, P is the fluid pressure, and is the fluid viscosity. In the energy equation, E is the specific internal energy, is the effective thermal conductivity, and is the effective dynamic viscosity. A finite volume method (FVM)-based commercial CFD software, ANSYS CFX [18], was used to solve the governing equations.
Accurate prediction of the complex heat flow in a gas turbine requires an appropriate turbulence model for the simulation. Various methods, such as direct numerical simulation (DNS), large eddy simulation (LES), and the Reynolds-average Navier–Stokes (RANS) method, have been introduced for this purpose. DNS and LES can provide details of turbulence statistics but are high-cost methods [19,20,21]. The RANS method is usually used for CFD simulations due to its lower computational cost [22,23], especially for turbomachinery simulation. Moreover, previous studies have confirmed that the SST model and SST model are the most suitable for analysis of transitional flows [24,25]. Furthermore, Choi and Ryu [9] concluded that results obtained using the SST turbulence model were in agreement with the corresponding experimental results [26]. Therefore, to accurately predict the complex fluid flow and heat transfer characteristics in a gas turbine, we used the SST turbulence model in this study.
The SST model was combined with free stream formulations and the formulation in the near wall using a blending function proposed by Menter [27,28]. The corresponding continuity, momentum, turbulence kinetic energy () equation, and eddy dissipation () equations were formulated to express the baseline (BSL) model:
where:
is the turbulence viscosity calculated using the following equation:
The blending functions and are defined by the following variables:
as follows:
where and are the turbulent Prandtl numbers for and , respectively. The formulations for these equations are expressed below:
Moreover, it is necessary to define the transport equation for the intermittency () to obtain the complete expression for the SST turbulence model. The transport equation of can be defined as:
The transition sources are defined as follows:
The destruction/ relaminarization sources are defined as follows:
The transition onset is controlled by the following functions:
where S is the strain rate magnitude, is an empirical correlation, is the vorticity magnitude, and is the critical Reynolds number, at which the intermittency first starts to increase in the boundary layer. The other constant coefficients for the equations above are as follows [5,29]:
2.3. Boundary Conditions and Unsteady Simulation
The boundary conditions used for the simulation were obtained from a report on a GE-E3 performance test [15], shown in Table 2. Ideal gas was used as the working fluid. Total pressure and temperature were set for the inlet, while static pressure was specified for the outlet. The magnitude of the total pressure used for the inlet was 344,740 Pa, with a uniform turbulence intensity of 5%. A non-uniform temperature, which was considered as the HS condition, was applied. The maximum and average temperatures of the HS were approximately 839 and 728 K, respectively. The detailed profile of the HS is shown in Figure 4. The static pressure specified for the outlet was 104,470 Pa. The speed of the rotor blade was fixed at 3600 rpm. Furthermore, to investigate the effects of rotor blade damage coupled with HS conditions, we analyzed five rotor blades cases. An undamaged rotor blade was considered as the reference case. The other cases were damage (i) at the middle of the blade on the pressure side, (ii) at the middle of the blade on the suction side, (iii) at the top of the blade on the pressure side, and (iv) at the top of the blade on the suction side. Moreover, we conducted both adiabatic and isothermal condition tests for the blade surface to calculate the heat transfer characteristics. The temperature applied to the blade surface under isothermal conditions was set as 389.95 K.
To perform an unsteady simulation, it is necessary to conduct a steady simulation, the results of which are used as an initial condition for the unsteady simulation. A frozen rotor was set as the interface between the stator and rotor in the steady simulation. The unsteady simulation was performed with a transient rotor-stator setting for the rotor–stator interface. To obtain accurate results in the unsteady simulation, the appropriate number of time steps per pitch—the number of steps when one rotor blade passes a pitch of the stator—needs to be considered. Previous studies have confirmed that 32 steps are the most suitable to guarantee convergence in such unsteady simulations [9,10].
In this study, we used a total of 20 pitches for the unsteady simulation as the results started to become periodic after 10 pitches. The first 10 pitches were considered to be the initial transient condition, and the final 10 pitches were used to analyze the results. We set several monitoring points near the pressure side of the blade and vane to check the convergence history. When the pressure and temperature of monitored points started to exhibit periodicity, the unsteady simulations were considered to have become convergent. The simulations were conducted using a 96-core workstation (4 Intel Xeon CPU E7-8890 v4 @ 2.20 GHz, RAM 512 GB), and the time needed for an unsteady simulation was approximately 72 h using 60 cores.
3. Results and Discussion
3.1. Flow Characteristics
Figure 5 shows the velocity streamlines and total pressure contours at different locations in the span-wise direction of the R1 blade, to illustrate the effects of different blade damage locations on the flow field. It can be seen that the damage mainly affected the flow field on the suction side of the blade. The hub +5% location had a small flow-circulation zone in the reference case. However, in the damaged blades, this zone was not present, due to the effects of the altered the blade profile on the flow in span-wise direction. In the mid-span, in comparison with the reference case, the middle-damage cases exhibited more circulation, while the top-damage cases exhibited less circulation. As a result, a noticeable difference in the total pressure contours at the mid-span can be seen among the five cases, as shown in Figure 5b. The middle-damage cases exhibited lower total pressures than other cases at the mid-span since they had more flow circulation at this location. Moreover, at the shroud −5% location, a lower total pressure can be observed in the top-damage cases than in the other cases; this is because a small flow circulation was generated in the top-damage cases. It can be concluded that the damage location affected not only the circulation zones at the suction side of the blade but also the total pressure near the damage, which significantly impacted the flow and heat transfer characteristics.
Figure 6 shows the temperature contours on the rotor blade surface under various blade conditions. The highest temperature on the pressure side of the blade was near the mid-span of the leading edge, which exhibited more vorticity and was affected by the HS condition. The damage did not affect the temperature distribution on the pressure side, but it significantly affected the temperature distribution on the suction side. The high-temperature regions extended in the span-wise direction in the top-damage cases, and in both the span-wise and radial directions in the middle-damage cases. As shown in Figure 6, the suction-side surface of the damaged blades had a higher temperature than the corresponding surface of the reference blades, due to the effects of the damage on the passage flow and flow circulation. As a result, both the average and maximum temperatures of the blade surface increased when the blades were damaged, as shown in Figure 7. Compared with the reference case, the middle-damage case at the suction side exhibited a higher temperature—by approximately 5 (average) and 2 K (maximum). Considering the effects of the HS, the maximum temperature in the middle-damage cases was higher than that in the other cases.
It is necessary to examine the effects of damage locations on the flow characteristics downstream of the rotor blade. Figure 8 shows the contours of static entropy and total pressure at the R1 outlet under various blade conditions. The static entropy was directly affected by the rotor blade conditions. Compared with the reference case, in the top-damage cases, the high-static-entropy regions extended in the radial direction, while in the middle-damage cases, these regions extended in both the span-wise and radial directions. These conditions strongly influenced the temperature distribution, which significantly affected the flow and heat transfer characteristics of the S2 vane. Similarly, the total pressure at the R1 outlet was significantly dependent on the blade conditions. Overall, the total pressure increased when damage occurred on the blade. The increase in total pressure resulted in an increase in the leakage flow passing through the blade tip or the main passage flow. This increment is reflected in the contours of the total pressure, shown in Figure 8b.
The attributes of heat transfer are strongly affected by the flow vortex structure [30,31]. Touil and Ghenaiet [32] investigated the effects of blade–vane interaction on the vortex structure in high-pressure gas turbines. Wei et al. [33] describe the flow structure using an iso-surface with the —criteria method. Figure 9 shows the 3-D complex vortex structure of the flow passing through R1 under various blade conditions. The structure was expressed using the —criteria method, with the magnitudes of strength level and values of being 104 and 5.14 × 10⁶ s−2, respectively. In comparison with the reference case, the top-damage cases exhibited a weaker tip leakage vortex, while the middle-damage cases exhibited a stronger tip leakage vortex. The pressure field directly affected the tip leakage flow conditions since the tip leakage flow is driven by the pressure difference between the pressure and suction sides of the rotor blade.
Figure 10 shows the pressure difference between the pressure and the suction sides of the R1 blade and the leakage flow passing through blade tip under various blade conditions. The top-damage cases had lower pressure differences, while the middle-damage cases had higher pressure differences than the reference case. As a result, the tip leakage flow in the middle-damage cases was higher than that in the reference case, whereas the opposite was true for the top-damage cases. The tip leakage flow significantly affected the heat transfer characteristics and efficiency of the gas turbine, as discussed in the following section.
To provide a better understanding of the effects of changes in the upstream-to-downstream flow, we first present the velocity contour at the S2 vane entrance, as shown in Figure 11. It can be seen that the changes in the profile of the damaged blade had significant effects on the flow characteristics downstream. In the top-damage cases, the flow fields arriving into S2 were similar to those in the reference case. The flow extended from the hub—where the flow velocity was the highest—to the casing. The flow in the middle-damage cases also extended from the hub to the casing. However, the flow only developed to mid-span; the flow from 60%-span to the casing in the middle-damage cases was not significantly different from the corresponding flows in the top-damage cases and the reference case. This was due to the leakage from the various damaged rotor blade locations. In the top-damage cases, the leakage flow passing through the damage locations was not significant, resulting in flow velocity contours similar to those in the reference case. Conversely, the leakage flow in the middle-damage cases was noticeable, with a higher flow velocity around the mid-span. Moreover, the turbulence intensity of the flow increased due to changes in the blade profile resulting from the damage. The turbulence intensity also depended on the damage location—damage on the pressure side generated a higher turbulence intensity downstream than damage on the suction side did; in addition, damage at the middle created more turbulence than damage at the top did. This is because we had applied the HS for the inlet condition with the highest flow at the center, which had a more significant effect on the middle of the blade than that at the top.
From the velocity contours at the S2 vane entrance, shown in Figure 11, the flow arriving at the suction side of the S2 vane was more noticeable than that arriving at the pressure side. Figure 12 shows the velocity streamlines on the S2 vane suction side, which were used for analyzing the flow characteristics. The flow formation was less near the hub of the S2 vane in the middle-damage cases than in the reference case and top-damage cases, due to the higher tip leakage flow, which generated secondary flow and changed the flow structure in the passage and vane surface. Moreover, the flow trends near the shroud of the vane—denoted by the black rectangles in Figure 12—were strongly dependent on the damage locations. Compared with the reference case, there were fewer forming lines in the damage cases, due to the effects of damage on the secondary flow and tip leakage flow. Moreover, the difference in the non-uniform total pressure at the entrance of the S2 vane due to the effects of various damage locations resulted in changes in the flow structure on the S2 vane surface. Due to the effects of damage, compared with the reference case, the total pressure at the S2 vane entrance increased by 0.25% and 0.5% in the top-damage and middle-damage cases, respectively. The changes in the rotor blade profile affected not only the passage flow but also the flow on the blade and vane surfaces due to their effects on the total pressure and consequently, on the leakage flow through the blade tip and passage.
The structure of the flow strongly affects its characteristics and the heat transfer properties of the vane surface. Figure 13 shows the temperature contours on the S2 vane surface under various blade conditions. Unlike for the R1 blade, the damage resulted in significant changes in both the pressure and suction sides for the S2 vane. This vane received more leakage flow when the blades were damaged; hence, more flow arrived at S2. The greater flow produced higher temperatures on both the pressure and suction sides of the S2 vane, leading to a significant increase in both the average and maximum temperatures, as shown in Figure 14. The increments in the average and maximum temperatures were approximately 9 and 7 K, respectively. These changes are more noticeable than those for the R1 blade surface. This increment in the temperature of the vane surface generated a higher thermal stress, which consequently reduced the fatigue life of the vane. It can be concluded that the damage on the rotor blade had more significant effects downstream than at the blade surface. Overall, the damage on the rotor blade considerably affected the flow characteristics both in the passage and on the surface of the blade and vane.
3.2. Heat Transfer Characteristics
The change in flow characteristics due to the effects of various damage locations on the rotor blade strongly affected the heat transfer on the blade and vane surface. Figure 15 shows the contour distribution of heat flux on the R1 blade surface under various blade conditions. As with the temperature distribution, the heat flux on the suction side was significantly affected, while the effects on the pressure side were negligible. This occurred because of the effects of the blade profile on the flow at the leading edge of the blade. Although the profile became smoother after modification, it considerably altered the flow field, especially at the suction side of the blade. When the profile changed, it generated a stronger vortex and created a larger circulation-flow region on the suction side, as shown in Figure 5a. Therefore, the heat flux on the suction side of the blade increased noticeably when the blade was damaged. Moreover, the heat flux increased significantly at the edges of the damage locations. This caused a sudden increase in thermal stress around the damage locations, which caused the damage to become more critical and reduced the fatigue life of the blade. Another reason for the sudden increase in heat flux around the mid-span was the HS applied to the inlet flow. With the HS, the highest temperature was at the center of the flow. Coupled with the altered blade profile, it caused a significant increase in heat flux at the suction side around the mid-span location. Overall, when the rotor blade was damaged, the heat flux increased suddenly at the suction side of the blade and around the damaged region. Hence, it is necessary to provide a suitable cooling method to prevent excessive thermal stress at these locations.
Figure 16 presents the contours of heat flux distribution on the S2 vane surface under various blade conditions. The characteristics of the flow after passing through R1 changed significantly. This considerably affected the heat transfer behaviors on the S2 vane surface on both the pressure and suction sides. On the pressure side, the heat flux increased noticeably when the blades were damaged. The high-heat-flux region extended in the span-wise direction in both the top-damage and middle-damage cases. This phenomenon occurred due to the increased turbulence intensity of the flow and the increased vane surface temperature in the damaged blades. The combined effects of the turbulence intensity and temperature tended to increase the heat flux on the pressure side of the S2 vane. Similarly, the heat flux on the suction side increased due to these coupled effects. The high-heat-flux regions on the pressure side of the vane surface were located around the mid-span, while those on the suction side were located near the hub and tip. Overall, the damaged rotor blade surfaces significantly increased the heat flux on the S2 vane surface. Hence, to protect the vane surface from sudden changes in thermal stress, efficient cooling methods need to be provided at these locations.
The tip leakage flow created by the difference in pressure between the pressure and suction sides significantly affected the heat transfer characteristics at the tip surface. To analyze the heat transfer at the blade tip under various blade conditions, contours of the Stanton number distribution on the blade tip were plotted and are shown in Figure 17. The Stanton number can be expressed as follows:
where is the heat flux, is the temperature of the wall surface, is the average total temperature of the inlet flow, is the specific heat of ideal air, and and are the average density and average velocity of the inlet flow, respectively.
Compared with the reference case, the top-damage cases exhibited lower heat transfer, while the middle-damage cases exhibited higher heat transfer. This result is consistent with the pressure difference and tip leakage flow shown in Figure 10—where the middle-damage cases exhibit more tip leakage flow—as well as with the results of a previous study by Yang and Feng [34]. In addition, the high-heat-transfer regions were located on the pressure side of the blade, while the low-heat-transfer regions were located on the suction side. This occurred because the heat transfer at the blade tip was directly affected by the leakage flow from the pressure side to the suction side of the blade. The tip leakage flow in the top-damage cases was lower than that in the reference case, the high-heat-transfer region near the pressure side narrowed, and the low heat transfer region near the suction side widened. Conversely, the tip leakage flow in the middle-damage cases was higher than that in the reference case, the low-heat-transfer region near the suction side narrowed, and the high-heat-transfer region near the pressure side expanded. Overall, the heat transfer on the blade tip was strongly dependent on the rotor blade conditions. Especially, damage at the middle causes an increase of the heat transfer characteristics, which increased the local thermal stress at the blade tip region.
3.3. Aerodynamic and Total-to-Total Efficiencies
Herein, we calculate the aerodynamic and total-to-total efficiencies to evaluate the performance of the gas turbine under various blade conditions. These efficiencies are calculated using Equations (30) and (31):
where is the aerodynamic efficiency, is the lift force, is the drag force, is the total-to-total efficiency, is the torque, is the angular velocity, is the mass flow rate, is the specific heat of ideal air, κ is the ratio of specific heat, is the outlet mass-averaged total pressure, and and are the average temperature and total pressure of the turbine inlet, respectively.
Figure 18 presents the aerodynamic and total-to-total efficiencies under various blade conditions. Both the efficiencies are strongly dependent on the damage locations and exhibit the same trends. Compared with the reference case, the top-damage cases exhibited a slight increase in efficiency. Conversely, the middle-damage cases exhibited a significant efficiency reduction. The aerodynamic efficiency is strongly affected by lift and drag forces, while the total-to-total efficiency is significantly affected by torque and outlet pressure. Figure 19 shows the drag force, lift force, torque, and outlet pressure under various blade conditions. Compared with the reference case, the middle-damage cases exhibited a significant increase in drag force, while the top-damage cases exhibited a reduction. In contrast, the middle-damage cases exhibited a decrease in lift force, while the top-damage cases exhibited a slight increase. The changes in the drag and lift forces can be explained by the velocity contour shown in Figure 5a. In the middle-damage cases, the circulation zone on the suction side was closer to the leading edge at the mid-span than in the other cases. This means that the flow separation point in the middle-damage cases was closer to the leading edge than in the other cases. According to flight theory, the closer the separation point moves to the leading edge, the higher the drag and the lower the lift that are generated. In the top-damage cases, the separation point was farther away from the leading edge than in the reference case. Therefore, these cases exhibited higher lift and lower drag forces than the reference case. As a result, the aerodynamic efficiency increased slightly in the top-damage cases but was significantly reduced in the middle-damage cases.
The torque values directly affected the total-to-total efficiency. Similar to the lift force, the torque in the top-damage cases was slightly higher than in the other cases—including the reference case—under normal blade conditions. The outlet pressure also increased in the damaged blades due to the pressure loss at the damage location. The increase in torque and outlet pressure resulted in an improvement in the total-to-total efficiency in the top-damage cases. However, in the middle-damage cases, the decrease in torque was greater than the increase in outlet pressure; for example, in comparison with the reference case, the torque decreased by approximately 2.8% while the outlet pressure only increased by approximately 1.2% in the middle-damage at the pressure side case. Hence, compared with that in the reference case, the total-to-total efficiency in the middle-damage cases were noticeably reduced. Overall, it can be concluded that the efficiency of gas turbines is strongly dependent on the blade conditions—either normal or damaged. Moreover, if the blades are damaged, the damage locations significantly affect the turbine efficiency. Specifically, if the top part of the blade is damaged, the turbine efficiency can be slightly increased after modification.
4. Conclusions
This paper presented a numerical investigation of the effects of modifications along the leading edge of a damaged rotor blade on the flow field and heat transfer characteristics in a 1.5-stage GE-E3 gas turbine. This is the first study in which the effects of different damage locations of a turbine blade are examined. We analyzed five cases of rotor blades—an undamaged blade as reference and blades damaged at the top and middle on the pressure and suction sides.
The results confirmed that:
- −
- The average and maximum temperatures on the R1 blade and S2 vane surfaces of the damaged blades were higher than those in the reference case. This was due to the effects of the altered flow field profiles on the damaged blades.
- −
- The tip leakage flow increased in the middle-damage cases but decreased in the top-damage cases, compared to the reference case.
- −
- The heat transfer on the blade tip in the middle-damage cases was remarkably higher than the one in the other cases.
- −
- The location of the damage had significant effects on the heat transfer characteristics on the blade and vane surfaces. On the R1 blade, the heat flux around the damage location exhibited a sudden increase. The heat flux on the S2 vane surface considerably increased around the mid-span on the pressure side and around the hub and tip on the suction side. This led to an increase in the local thermal stress, showing a potential reduction in the fatigue life of the blade and the vane which would increase the maintenance costs.
- −
- Moreover, the modifications to the top-damaged blades enhanced the aerodynamic and total-to-total efficiencies, while the same for the middle-damaged blades caused reductions in the efficiencies.
This study investigated the effects of modification at various locations along the leading edge of the rotor blades. Hence, additional studies should be conducted on damage at other locations, such as the center and trailing edge of the blade, to provide a comprehensive overview of the effects of damage on the flow field, heat transfer, and aerodynamic performance of a gas turbine. This could provide more insight for design engineers to develop better cooling methods to enhance the fatigue life of the blades and vanes of gas turbines. Moreover, the findings of this study can facilitate damage or failure detection in gas turbines through monitoring of sudden changes in pressure and temperature fields.
Author Contributions
Conceptualization, methodology, investigation: T.D.M. and J.R.; validation, formal analysis, writing—original draft preparation, visualization: T.D.M.; writing—review and editing, supervision, project administration, funding acquisition: J.R. All authors have read and agreed to the published version of the manuscript.
Funding
This work was supported by the Korea Institute of Energy Technology Evaluation and Planning (KETEP) grant funded by the Korea government (MOTIE) (20193310100060, Evaluation of the performance for F-class or more gas turbine blade prototype). This research was supported by Korea Electric Power Corporation (Grant number: R19XO01-39). This research was supported by the MSIT (Ministry of Science and ICT), Korea, under the ITRC (Information Technology Research Center) support program (IITP-2020-2020-0-01655) supervised by the IITP (Institute of Information & Communications Technology Planning & Evaluation).
Conflicts of Interest
The authors declare no conflict of interest.
Nomenclature
| Fluid density (kg/ | Vorticity magnitude | ||
| u | Fluid velocity (m/s) | Critical Reynolds number | |
| P | Fluid pressure (Pa) | Stanton number | |
| Fluid viscosity (Pa.s) | Heat flux (W/ | ||
| E | Specific internal energy (J) | Temperature of the wall surface (K) | |
| Effective thermal conductivity [(W/m.K) | Average total temperature of the inlet flow (K) | ||
| Effective dynamic viscosity (Pa.s) | Specific heat of ideal air (J/kg.K) | ||
| Turbulence viscosity (Pa.s) | Average density of the inlet flow (kg/ | ||
| Blending functions | Average velocity of the inlet flow (m/s) | ||
| Turbulence kinetic energy (J/kg) | Average total pressure of inlet flow (Pa) | ||
| Eddy dissipation/ Angular velocity (rad/s) | Torque (N.m)/Temperature (K) | ||
| Turbulent Prandtl number for | Mass flow rate (kg/s) | ||
| Turbulent Prandtl number for | κ | Ratio of specific heat | |
| Intermittency | Lift force (N) | ||
| S | Strain rate magnitude () | Drag force (N) | |
| Empirical correlation | Aerodynamic efficiency | ||
| Total-to-total efficiency |
References
- Povey, T.; Qureshi, I. Developments in hot-streak simulators for turbine testing. J. Turbomach. 2009, 131, 031009-1–031009-15. [Google Scholar] [CrossRef]
- An, B.-T.; Liu, J.-J.; Jiang, H.-D. Numerical investigation on unsteady effects of hot streak on flow and heat transfer in a turbine stage. J. Turbomach. 2009, 131, 031015-1–031015-15. [Google Scholar] [CrossRef]
- Anzellini, S.; Monteseguro, V.; Bandiello, E.; Dewaele, A.; Burakovsky, L.; Errandonea, D. In situ characterization of the high pressure–high temperature melting curve of platinum. Sci. Rep. 2019, 9, 1–10. [Google Scholar] [CrossRef] [Green Version]
- Errandonea, D.; Burakovsky, L.; Preston, D.L.; MacLeod, S.G.; Santamaría-Perez, D.; Chen, S.; Cynn, H.; Simak, S.I.; McMahon, M.I.; Proctor, J.E. Experimental and theoretical confirmation of an orthorhombic phase transition in niobium at high pressure and temperature. Commun. Mater. 2020, 1, 1–11. [Google Scholar] [CrossRef]
- Kaewbumrung, M.; Tangsopa, W.; Thongsri, J. Investigation of the trailing edge modification effect on compressor blade aerodynamics using SST k-ω turbulence model. Aerospace 2019, 6, 48. [Google Scholar] [CrossRef] [Green Version]
- Kumari, S.; Satyanarayana, D.; Srinivas, M. Failure analysis of gas turbine rotor blades. Eng. Fail. Anal. 2014, 45, 234–244. [Google Scholar] [CrossRef]
- Witek, L. Simulation of crack growth in the compressor blade subjected to resonant vibration using hybrid method. Eng. Fail. Anal. 2015, 49, 57–66. [Google Scholar] [CrossRef]
- Mazur, Z.; Hernandez-Rossette, A.; Garcia-Illescas, R.; Luna-Ramirez, A. Failure analysis of a gas turbine nozzle. Eng. Fail. Anal. 2008, 15, 913–921. [Google Scholar] [CrossRef]
- Choi, M.G.; Ryu, J. Numerical study of the axial gap and hot streak effects on thermal and flow characteristics in two-stage high pressure gas turbine. Energies 2018, 11, 2654. [Google Scholar] [CrossRef] [Green Version]
- Wang, Z.; Wang, D.; Liu, Z.; Feng, Z. Numerical analysis on effects of inlet pressure and temperature non-uniformities on aero-thermal performance of a HP turbine. Int. J. Heat Mass Transf. 2017, 104, 83–97. [Google Scholar] [CrossRef]
- Azad, G.S.; Han, J.-C.; Teng, S.; Boyle, R.J. Heat transfer and pressure distributions on a gas turbine blade tip. J. Turbomach. 2000, 122, 717–724. [Google Scholar] [CrossRef] [Green Version]
- Asgarshamsi, A.; Benisi, A.H.; Assempour, A.; Pourfarzaneh, H. Multi-objective optimization of lean and sweep angles for stator and rotor blades of an axial turbine. Proc. Inst. Mech. Eng. Part G J. Aerosp. Eng. 2015, 229, 906–916. [Google Scholar] [CrossRef]
- Pogorelov, A.; Meinke, M.; Schröder, W. Large-eddy simulation of the unsteady full 3D rim seal flow in a one-stage axial-flow turbine. Flowturbulence Combust. 2019, 102, 189–220. [Google Scholar] [CrossRef]
- Sasao, Y.; Kato, H.; Yamamoto, S.; Satsuki, H.; Ooyama, H.; Ishizaka, K. F208 numerical and experimental investigations of unsteady 3-d flow through two-stage cascades in steam turbine model (Steam Turbine-3). In Proceedings of the International Conference on Power Engineering (ICOPE), Kobe, Japan, 16–20 November 2009. [Google Scholar]
- Timko, L. Energy Efficient Engine High Pressure Turbine Component Test Performance Report; Technical Report; National Aeronautics and Space Administration (NASA): Cincinnati, OH, USA, 1 January 1984.
- Arnone, A.; Benvenuti, E. Three-Dimensional Navier-Stokes Analysis of a Two-Stage Gas Turbine; American Society of Mechanical Engineers: New York, NY, USA, 1994; Volume 78835. [Google Scholar]
- ANSYS. ANSYS TurboGrid Tutorials, Release 15.0; ANSYS: Canonsburg, PA, USA, 2013. [Google Scholar]
- ANSYS. ANSYS CFX, 12.1 Ansys Cfx-Solver Theory Guide; ANSYS: Canonsburg, PA, USA, 2009. [Google Scholar]
- Celik, I.; Yavuz, I.; Smirnov, A. Large eddy simulations of in-cylinder turbulence for internal combustion engines: A review. Int. J. Engine Res. 2001, 2, 119–148. [Google Scholar] [CrossRef]
- Ryu, J.; Lele, S.; Viswanathan, K. Study of supersonic wave components in high-speed turbulent jets using an LES database. J. Sound Vib. 2014, 333, 6900–6923. [Google Scholar] [CrossRef]
- Ryu, J.; Livescu, D. Turbulence structure behind the shock in canonical shock–vortical turbulence interaction. J. Fluid Mech. 2014, 756, R1-1–R1-13. [Google Scholar] [CrossRef] [Green Version]
- Ngo, T.T.; Phu, N.M. Computational fluid dynamics analysis of the heat transfer and pressure drop of solar air heater with conic-curve profile ribs. J. Therm. Anal. Calorim. 2020, 139, 3235–3246. [Google Scholar] [CrossRef]
- Nguyen, M.P.; Ngo, T.T.; Le, T.D. Experimental and numerical investigation of transport phenomena and kinetics for convective shrimp drying. Case Stud. Therm. Eng. 2019, 14, 100465. [Google Scholar] [CrossRef]
- Hao, Z.-R.; Gu, C.-W.; Ren, X.-D. The application of discontinuous Galerkin methods in conjugate heat transfer simulations of gas turbines. Energies 2014, 7, 7857–7877. [Google Scholar] [CrossRef] [Green Version]
- Kim, J.; Bak, J.; Kang, Y.; Cho, L.; Cho, J. A study on the numerical analysis methodology for thermal and flow characteristics of high pressure turbine in aircraft gas turbine engine. Ksfm J. Fluid Mach. 2014, 17, 46–51. [Google Scholar] [CrossRef]
- Hylton, L.; Mihelc, M.; Turner, E.; Nealy, D.; York, R. Analytical and Experimental Evaluation of the Heat Transfer Distribution over the Surfaces of Turbine Vanes; Technical Report; National Aeronautics and Space Administration (NASA): Indianapolis, IN, USA, 1 May 1983.
- Menter, F.; Rumsey, C. Assessment of two-equation turbulence models for transonic flows. In Proceedings of the Fluid Dynamics Conference, Colorado Springs, CO, USA, 20–23 June 1994; p. 2343. [Google Scholar]
- Menter, F.R. Two-equation eddy-viscosity turbulence models for engineering applications. Aiaa J. 1994, 32, 1598–1605. [Google Scholar] [CrossRef] [Green Version]
- ANSYS. ANSYS Fluent Theory Guide; ANSYS, Inc.: Canonsburg, PA, USA, 2013. [Google Scholar]
- Gentry, M.; Jacobi, A.M. Heat transfer enhancement by delta-wing-generated tip vortices in flat-plate and developing channel flows. J. Heat Transf. 2002, 124, 1158–1168. [Google Scholar] [CrossRef]
- Lee, J.; Lee, H.J.; Ryu, J.; Lee, S.H. Three-dimensional turbulent flow and heat transfer characteristics of longitudinal vortices embedded in turbulent boundary layer in bent channels. Int. J. Heat Mass Transf. 2018, 117, 958–965. [Google Scholar] [CrossRef]
- Touil, K.; Ghenaiet, A. Simulation and analysis of vane-blade interaction in a two-stage high-pressure axial turbine. Energy 2019, 172, 1291–1311. [Google Scholar] [CrossRef]
- Wei, Z.-J.; Qiao, W.-Y.; Chen, P.-P.; Liu, J. Formation and Transport of Secondary Flows Caused by Vortex-Blade Interaction in a High Pressure Turbine. In Proceedings of the Turbo Expo: Power for Land, Sea, and Air, Montreal, QC, Canada, 15–19 June 2015; p. V02AT38A008. [Google Scholar]
- Yang, D.; Feng, Z. Tip leakage flow and heat transfer predictions for turbine blades. In Proceedings of the Turbo Expo: Power for Land, Sea, and Air, Montreal, QC, Canada, 14–17 May 2007; pp. 589–596. [Google Scholar]
Figure 1.
(a) Computational domain used for this study; (b) Damaged rotor blade after modification; Top and Mid denote the top and middle regions of the blade, respectively. PS and SS denote the pressure-side and suction-side damage, respectively.
Figure 1.
(a) Computational domain used for this study; (b) Damaged rotor blade after modification; Top and Mid denote the top and middle regions of the blade, respectively. PS and SS denote the pressure-side and suction-side damage, respectively.
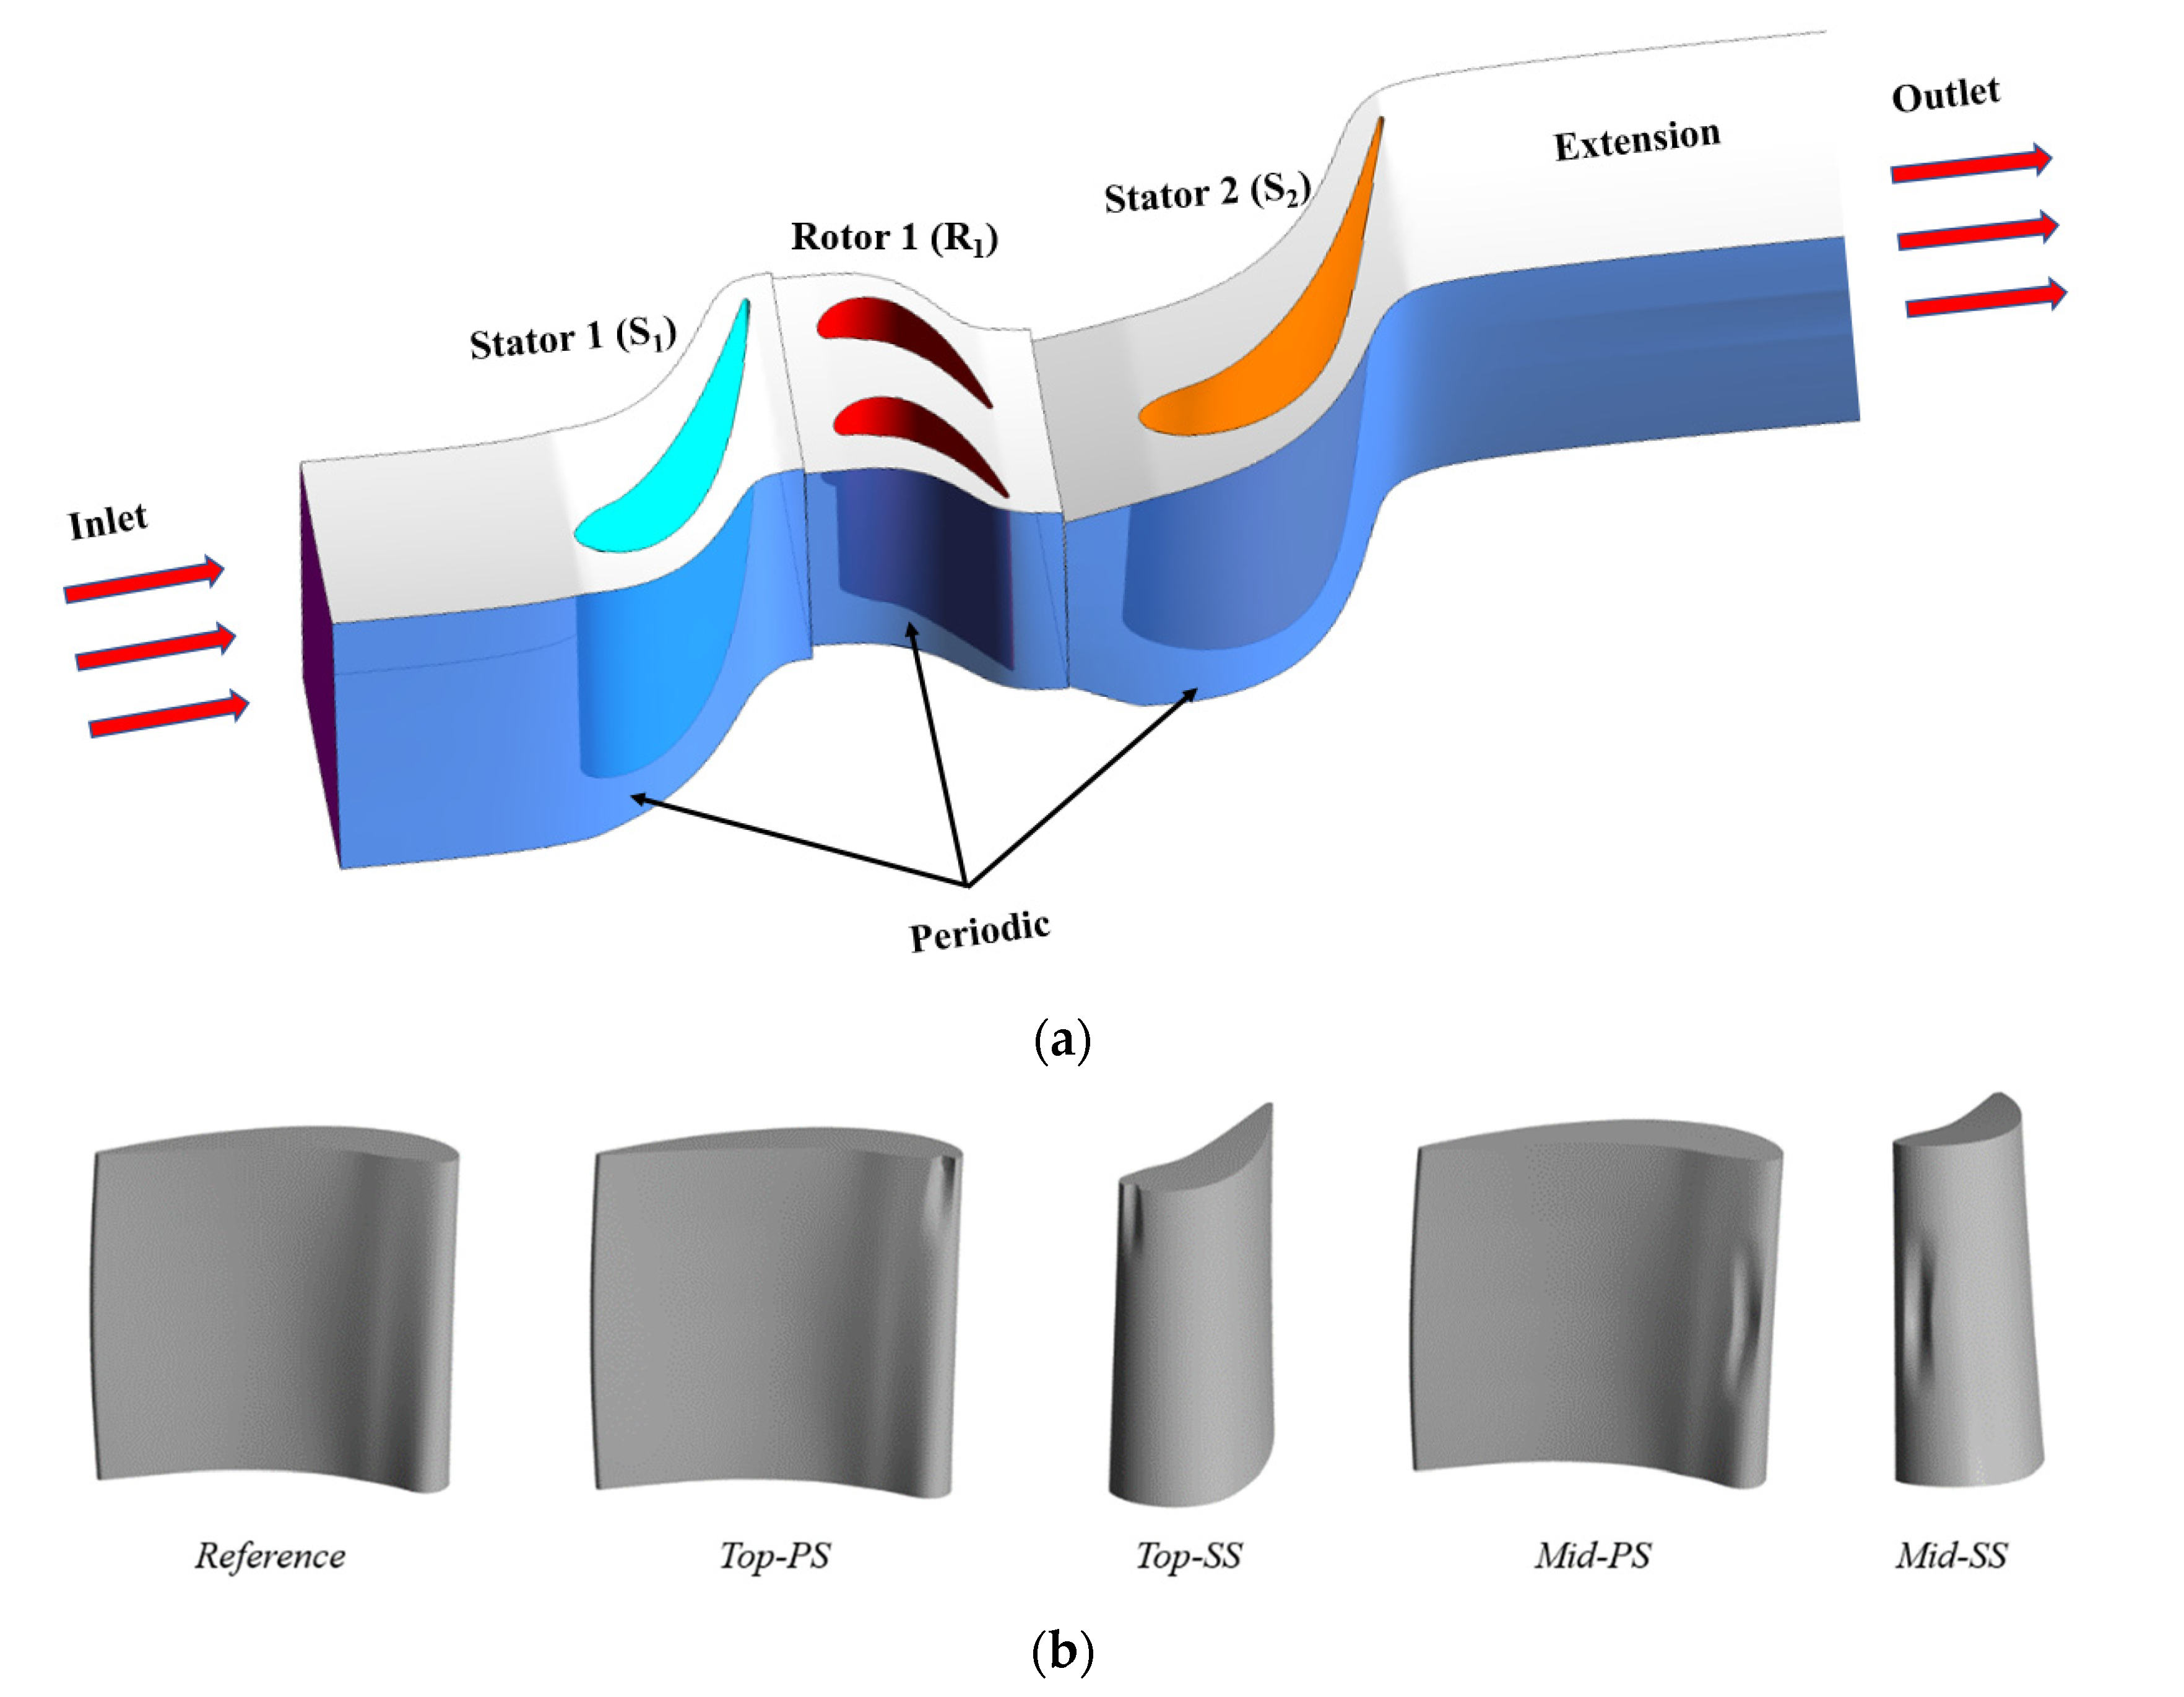
Figure 2.
Detailed mesh of computational domain for the 1.5-stage GE-E3 gas turbine.

Figure 3.
Variation in at different span-wise locations in the rotor blade.
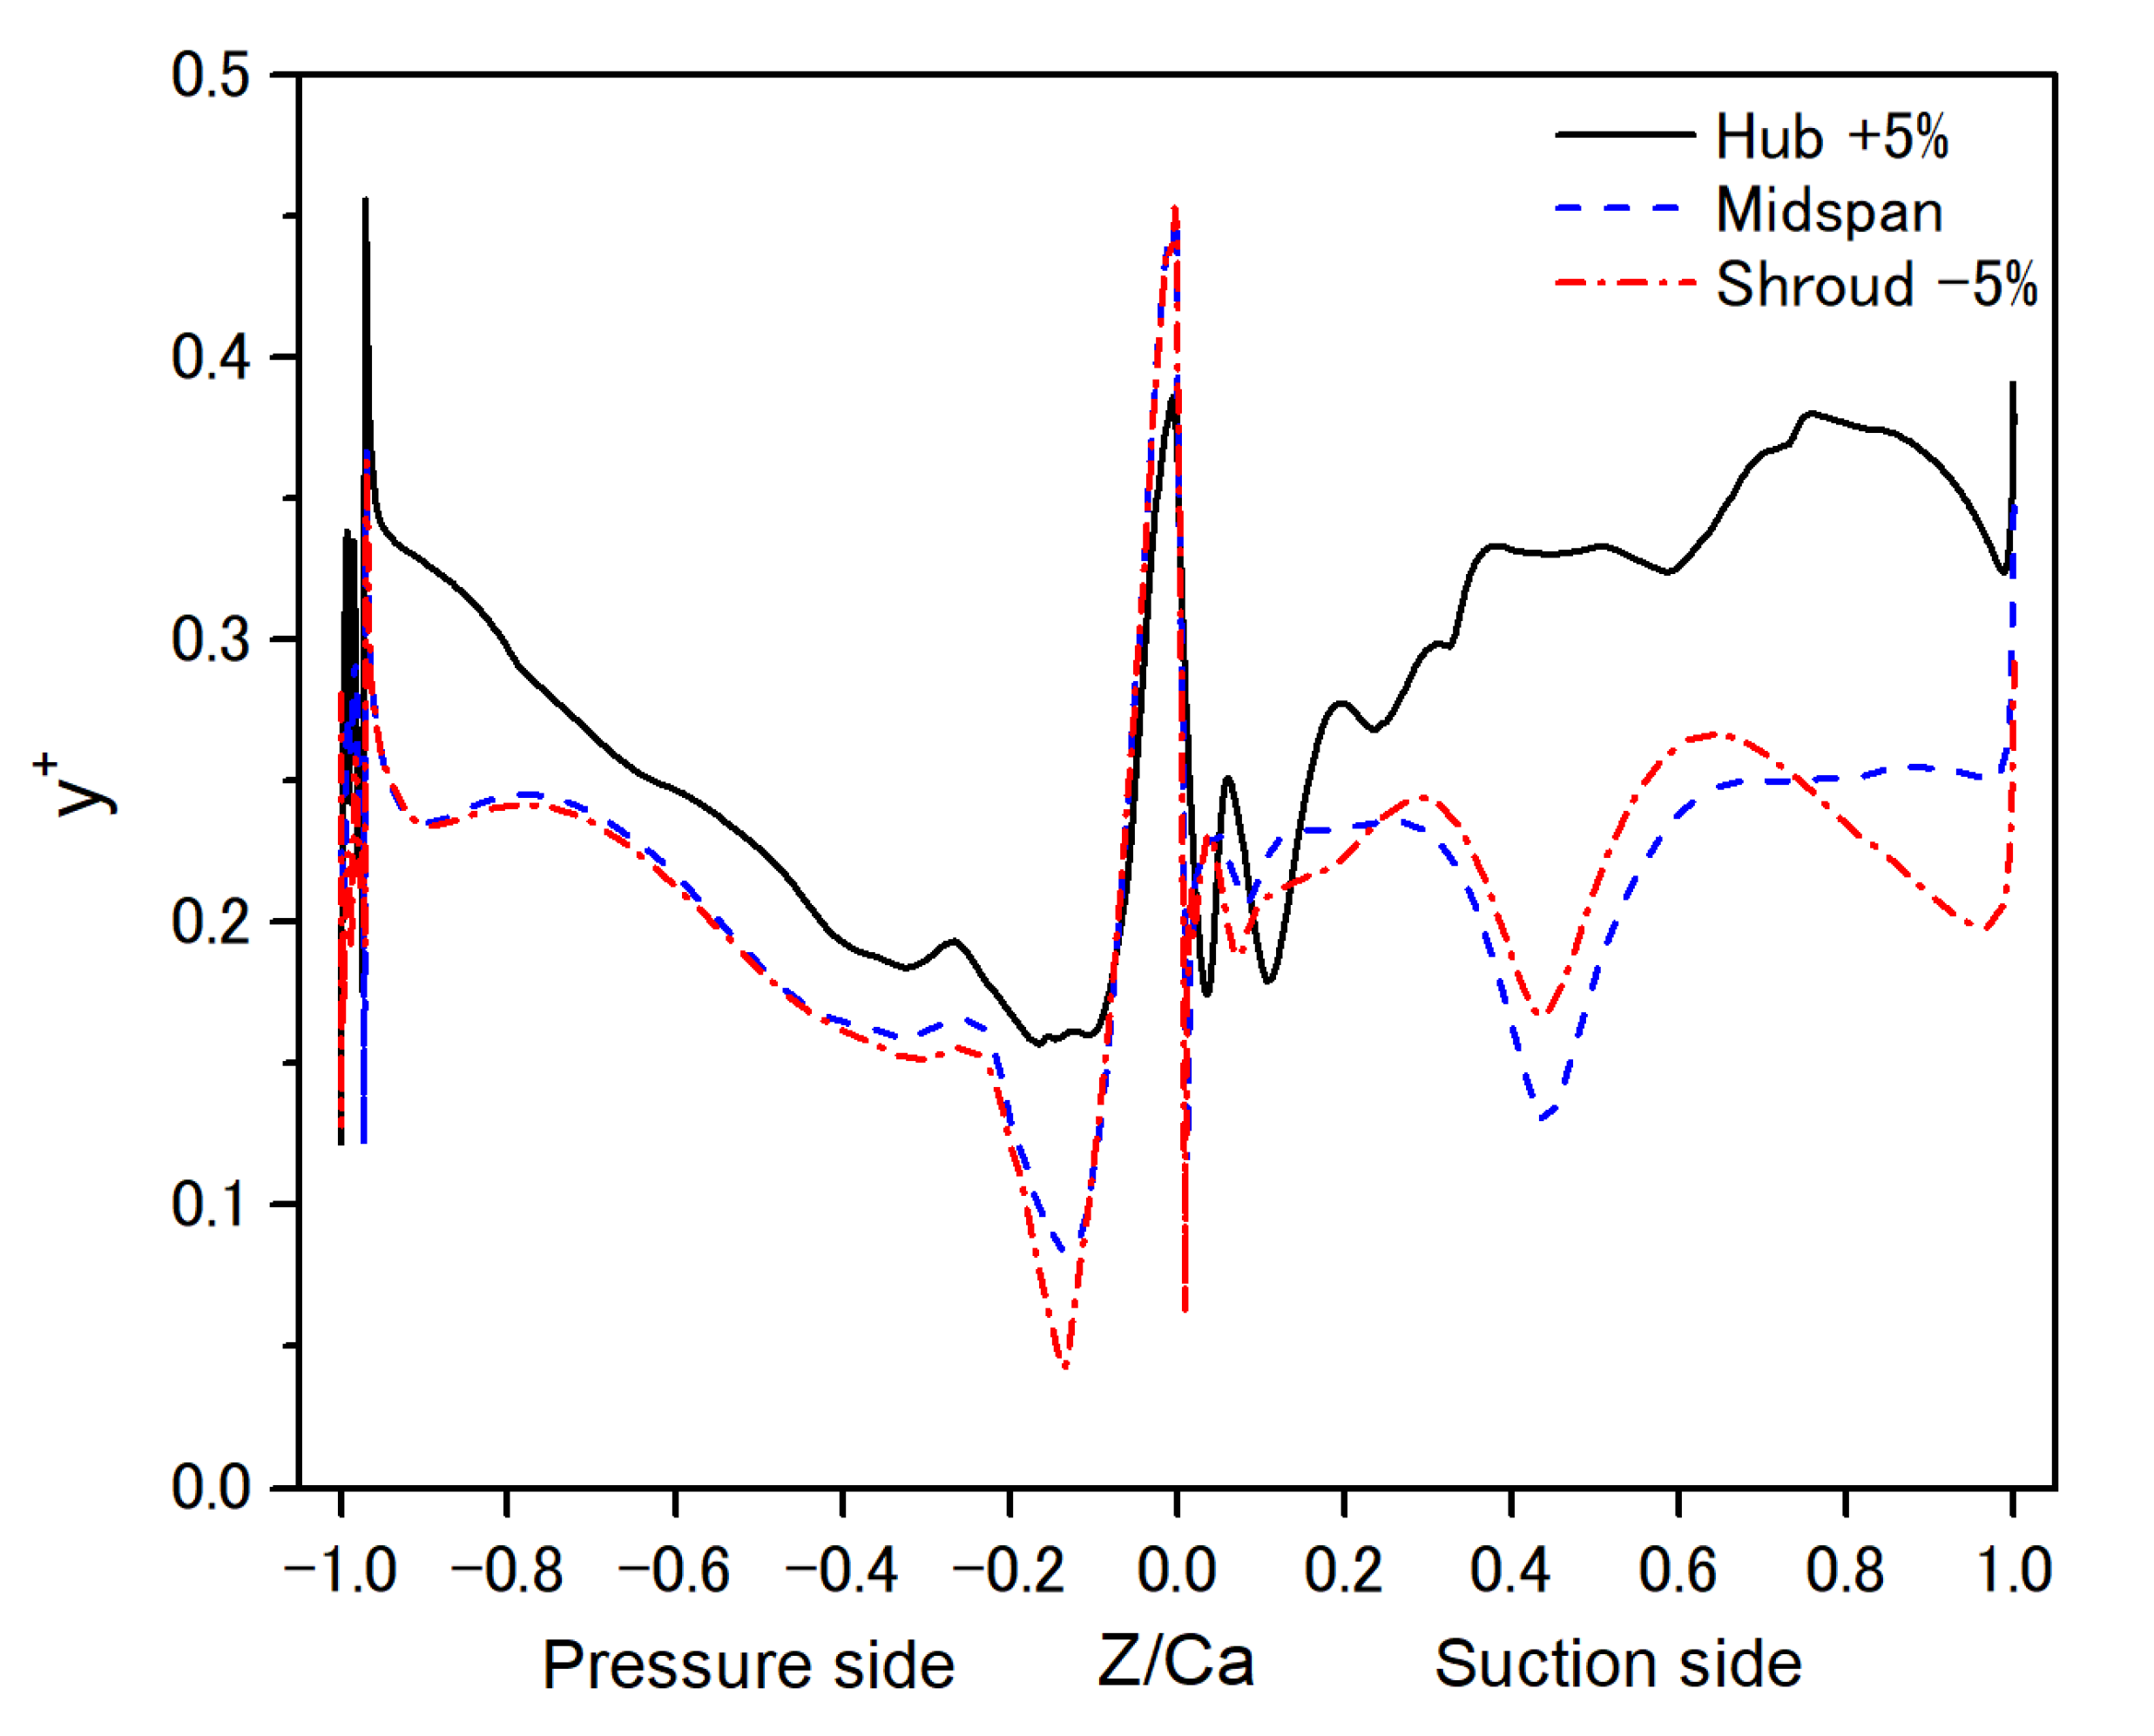
Figure 4.
(a) Hot streak distribution at the inlet; (b) Radial temperature at different span-wise locations and average temperature at the inlet.
Figure 4.
(a) Hot streak distribution at the inlet; (b) Radial temperature at different span-wise locations and average temperature at the inlet.

Figure 5.
(a) Velocity streamlines; (b) total pressure contours at different span-wise locations of the R1 blade.
Figure 5.
(a) Velocity streamlines; (b) total pressure contours at different span-wise locations of the R1 blade.

Figure 6.
Temperature distribution on the R1 blade under various blade conditions.

Figure 7.
Average and maximum temperatures on the R1 blade under various blade conditions.

Figure 8.
(a) Static entropy; (b) Total pressure at the R1 outlet under various blade conditions.
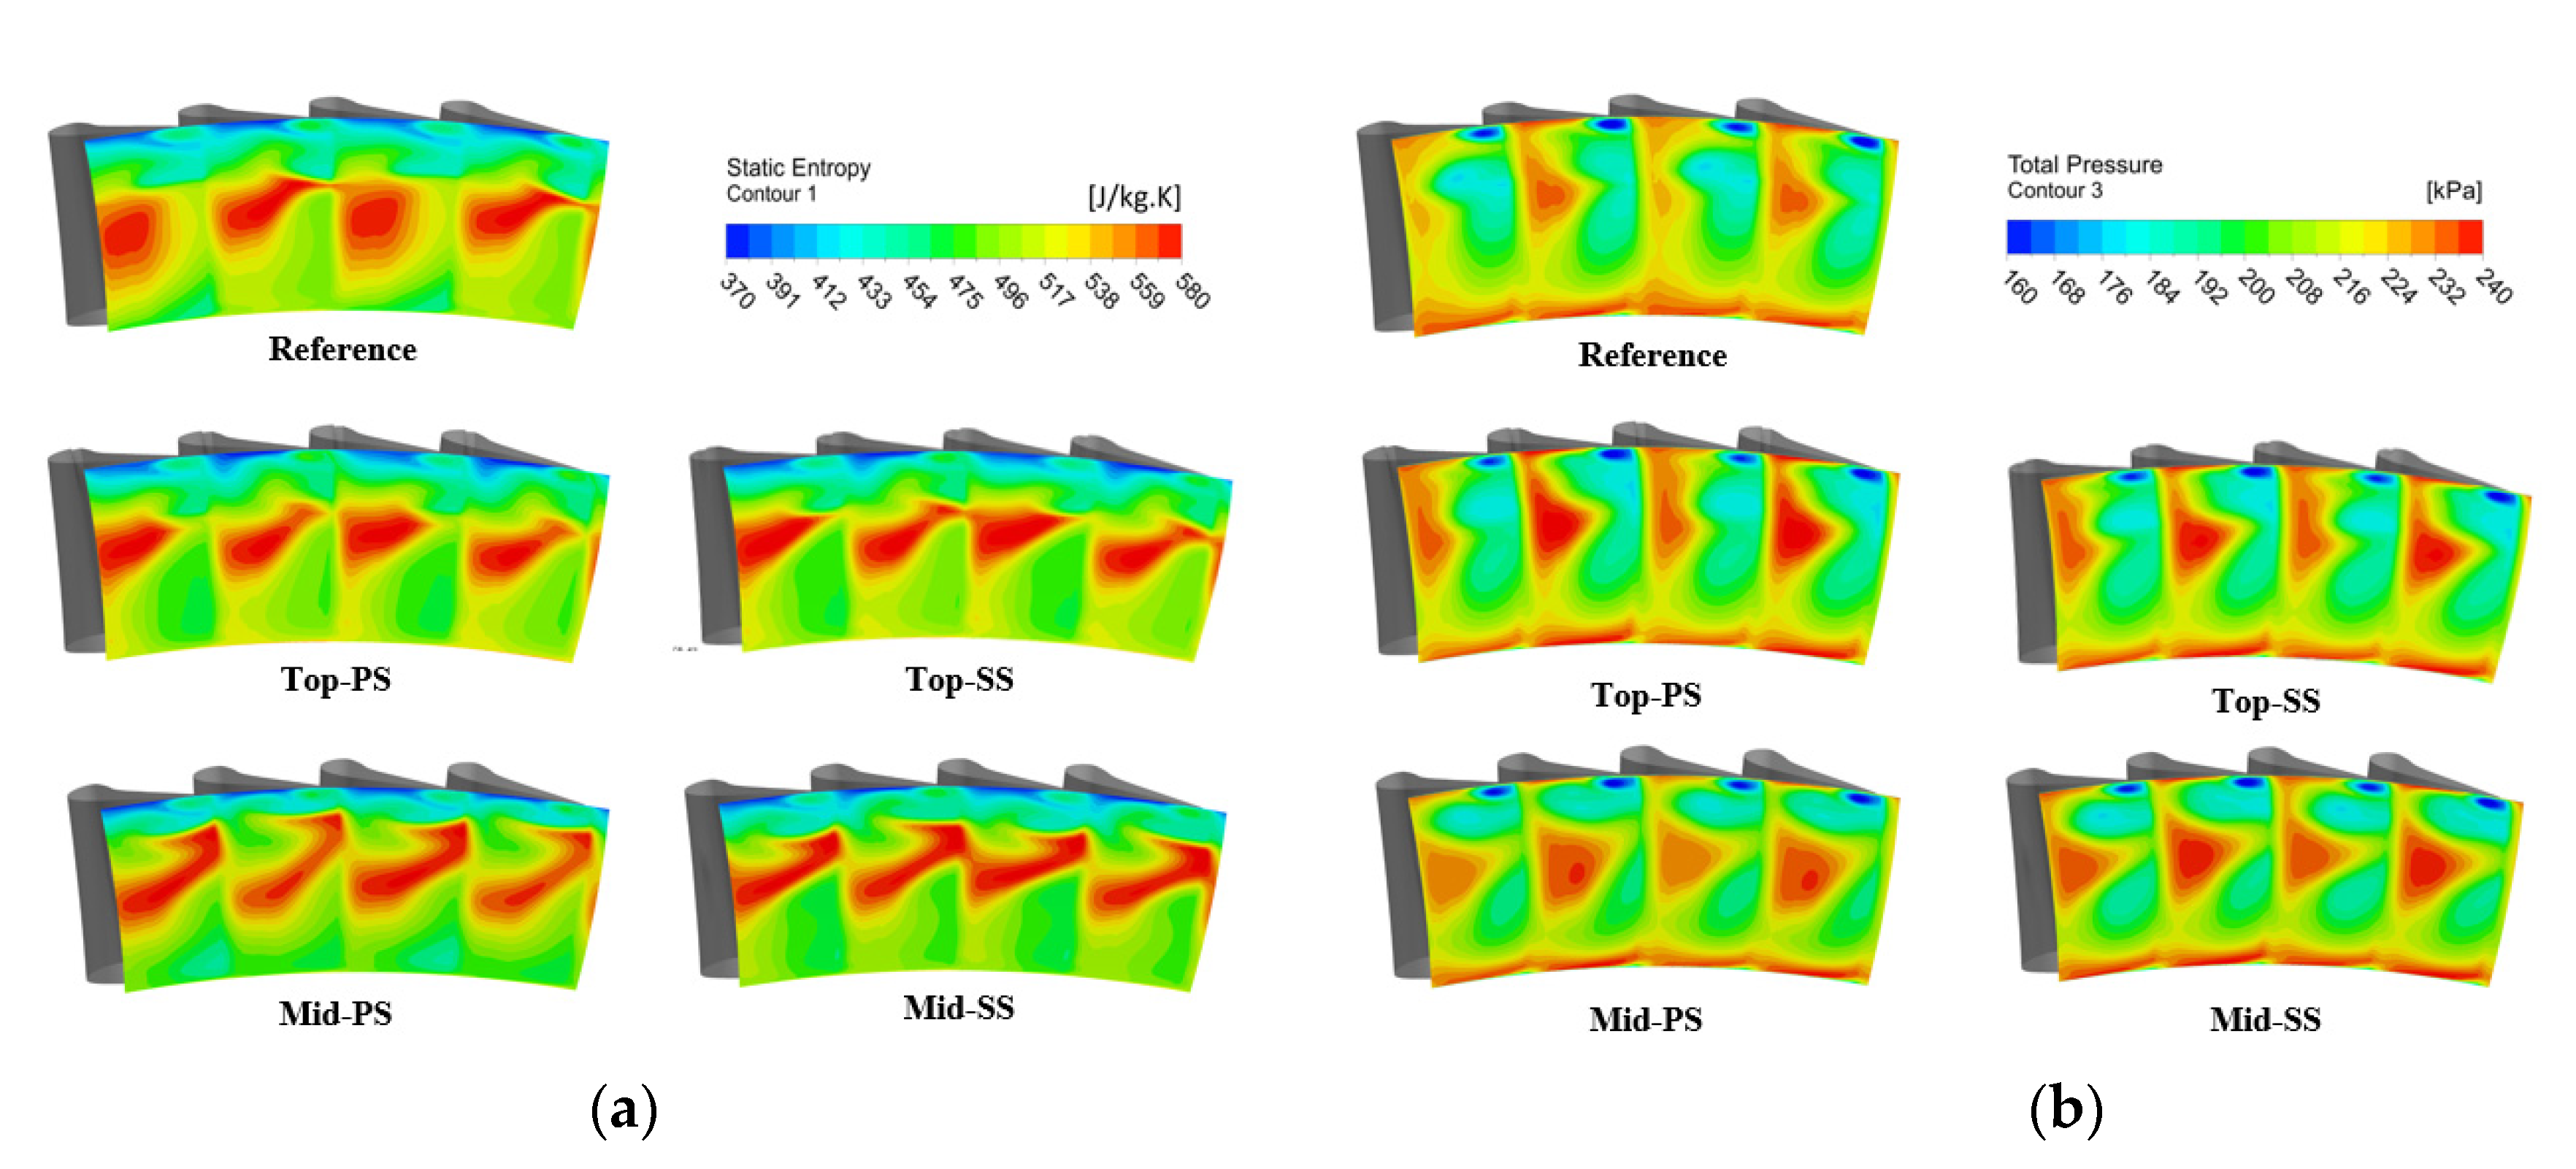
Figure 9.
3-D vortex structure at outlet of the R1 blade.

Figure 10.
Pressure difference between pressure side and suction side of the R1 blade and tip leakage flow through the R1 blade tip.
Figure 10.
Pressure difference between pressure side and suction side of the R1 blade and tip leakage flow through the R1 blade tip.

Figure 11.
Velocity contours at the entrance of the S2 vane.

Figure 12.
Velocity streamlines at the suction side of the S2 vane surface.

Figure 13.
Temperature distribution on the S2 vane surface.

Figure 14.
Average and maximum temperature of the S2 vane surface under various blade conditions.
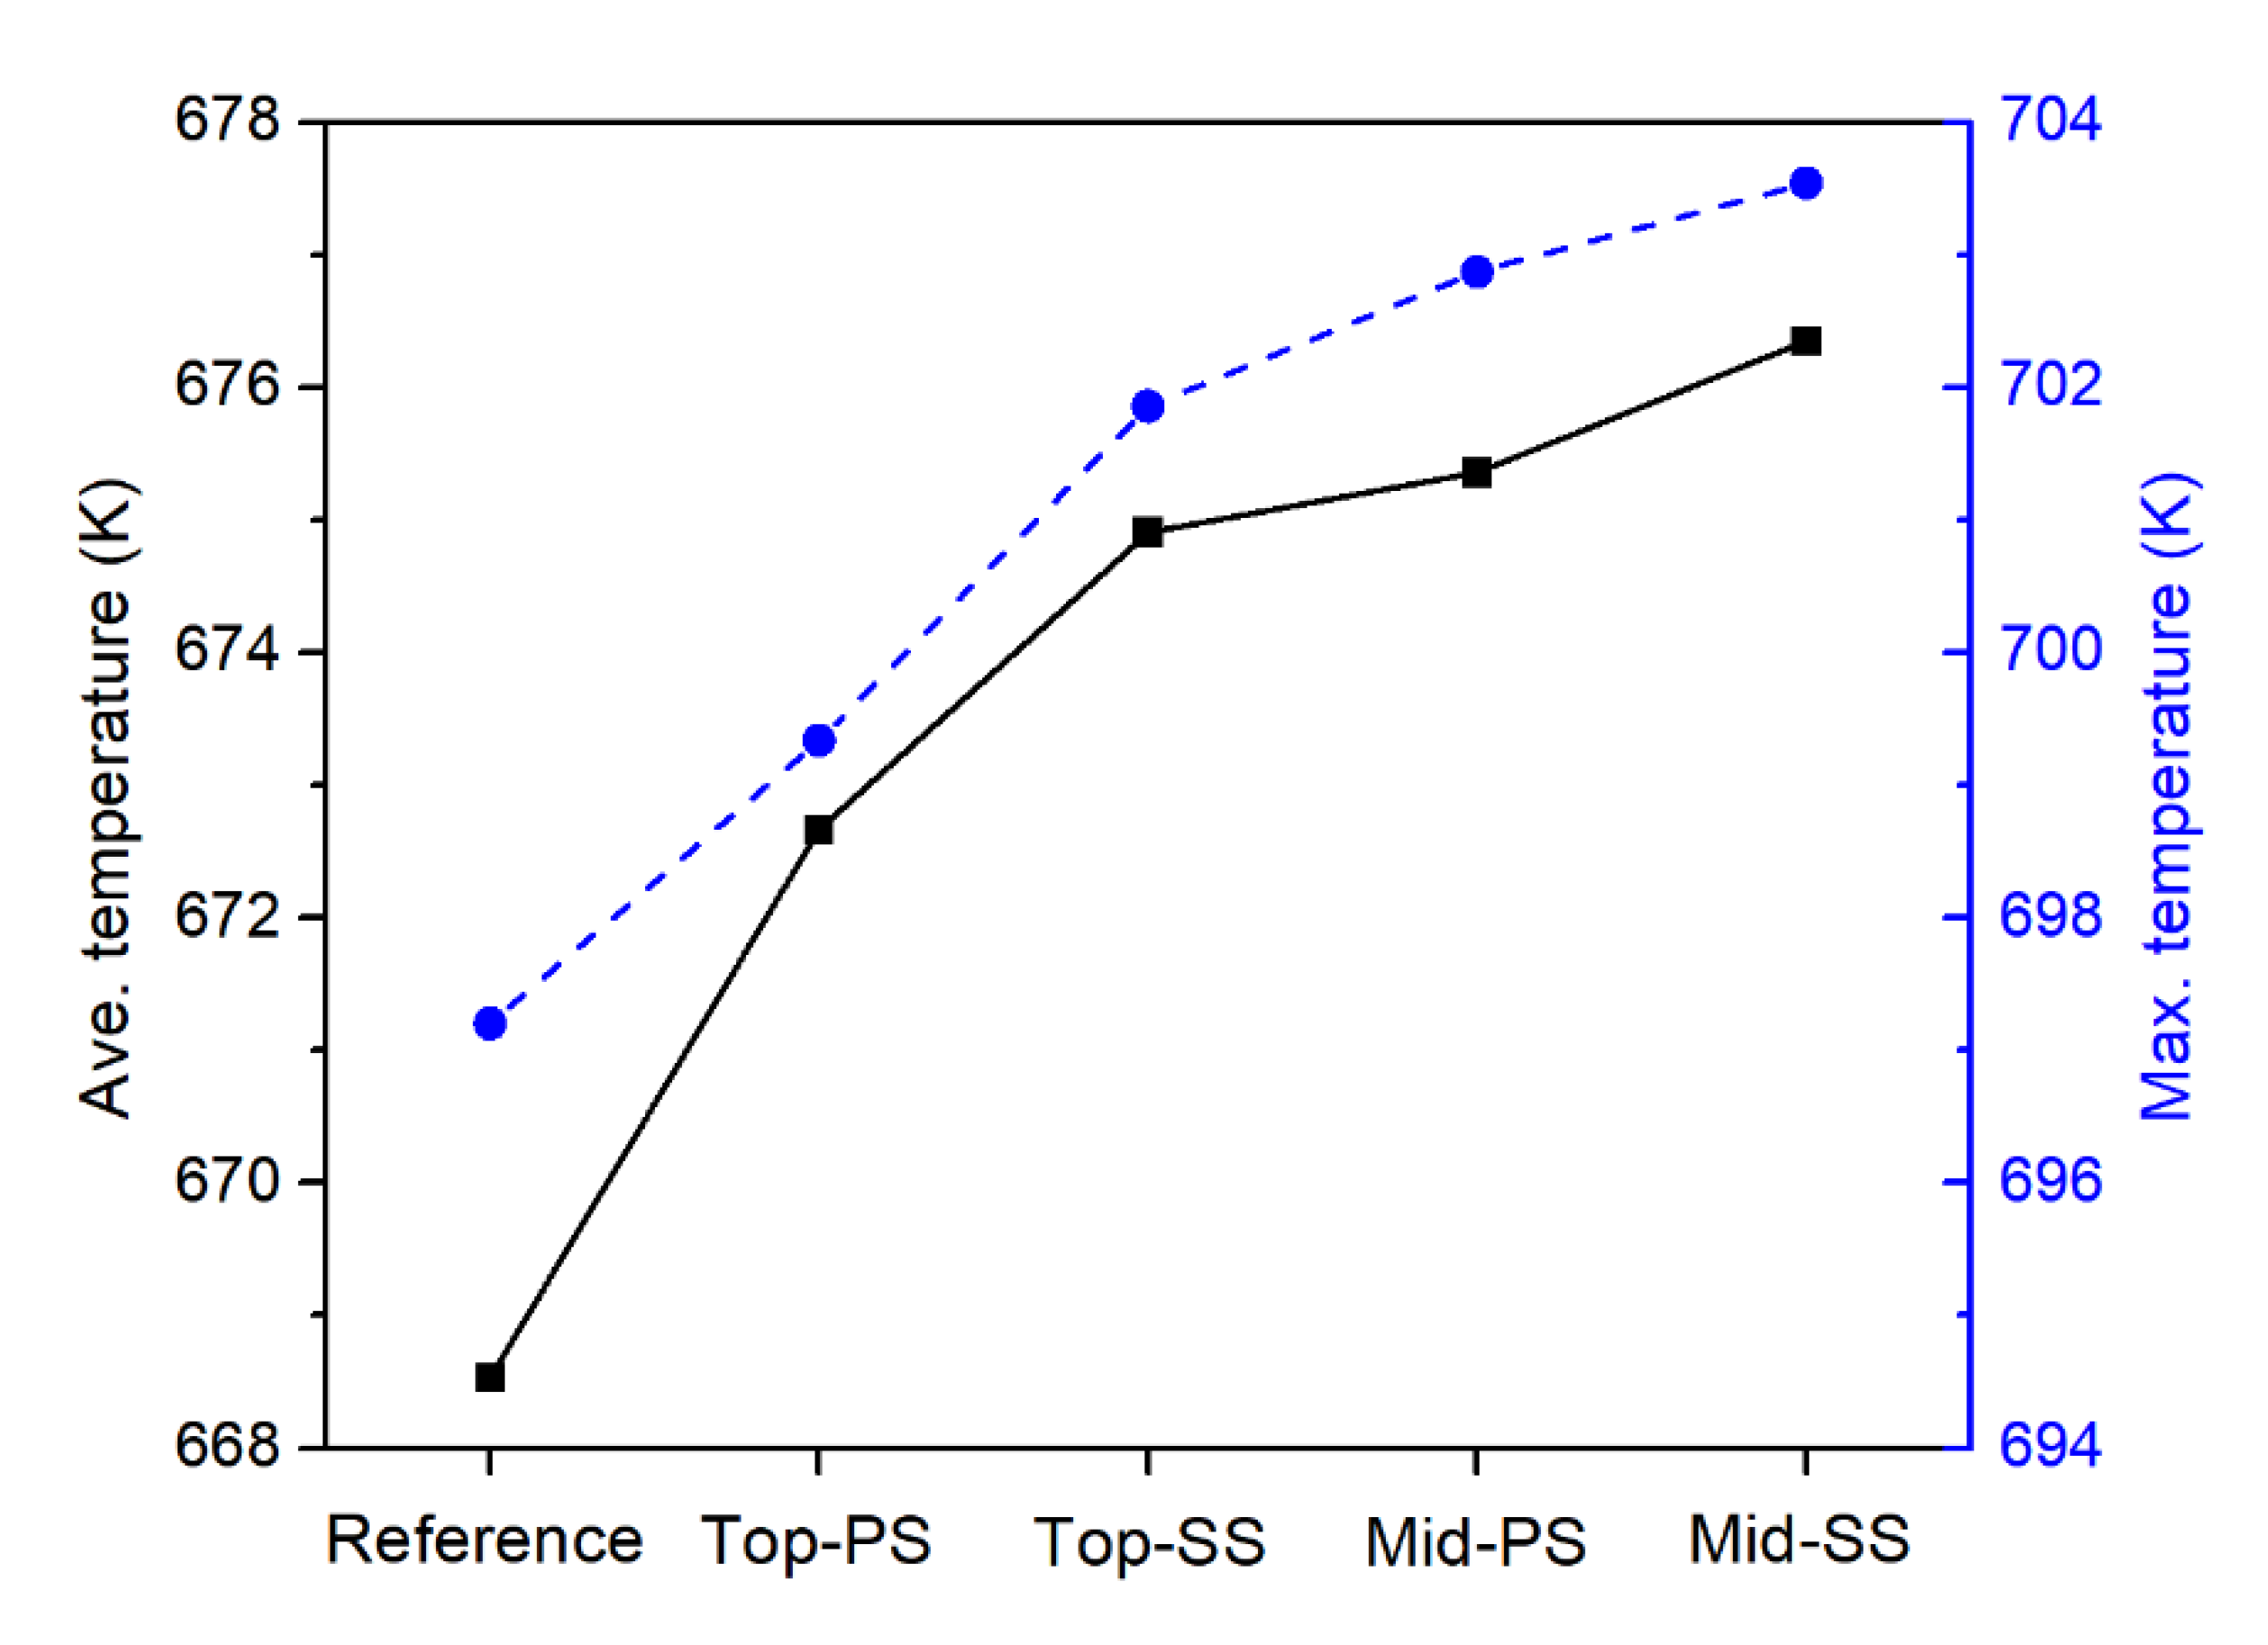
Figure 15.
Heat flux distribution on the R1 blade under various blade conditions.

Figure 16.
Heat flux distribution on the S2 vanes surface under various blade conditions.

Figure 17.
Stanton number distribution on blade tip under various blade conditions.

Figure 18.
Total-to-total and aerodynamic efficiencies under various blade conditions.

Figure 19.
Drag force, lift force, torque, and outlet pressure under various blade conditions.


Table 1.
Grid-independent test.
| Average Pressure (kPa) (Relative Error) | |||
|---|---|---|---|
| Case 1 | 1 | 274.88 (0.76%) | 124.69 (1.17%) |
| Case 2 | 1.34 | 276.97 (1.06%) | 126.15 (0.69%) |
| Case 3 | 1.8 | 279.91 (0.82%) | 127.03 (0.58%) |
| Case 4 | 2.4 | 282.21 (0.43%) | 127.76 (0.23%) |
| Case 5 | 3.2 | 283.41 | 128.05 |
Table 2.
Boundary conditions and simulation settings.
| Boundary conditions | |
| Inlet | Total pressure: 344,740 Pa Total temperature: 839 K Turbulence intensity: 5% |
| Outlet | Static pressure: 104,470 Pa |
| Simulation settings | |
| Wall conditions | Adiabatic or iso-thermal |
| Rotor blade conditions | Undamaged or damaged at PS and SS in top and middle of blade |
| Vane and blade interface | Transient rotor-stator (unsteady simulation) |
| Rotor speed | 3600 RPM |
Publisher’s Note: MDPI stays neutral with regard to jurisdictional claims in published maps and institutional affiliations. |
© 2020 by the authors. Licensee MDPI, Basel, Switzerland. This article is an open access article distributed under the terms and conditions of the Creative Commons Attribution (CC BY) license (http://creativecommons.org/licenses/by/4.0/).
Share and Cite
MDPI and ACS Style
Mai, T.D.; Ryu, J. Effects of Leading-Edge Modification in Damaged Rotor Blades on Aerodynamic Characteristics of High-Pressure Gas Turbine. Mathematics 2020, 8, 2191. https://doi.org/10.3390/math8122191
AMA Style
Mai TD, Ryu J. Effects of Leading-Edge Modification in Damaged Rotor Blades on Aerodynamic Characteristics of High-Pressure Gas Turbine. Mathematics. 2020; 8(12):2191. https://doi.org/10.3390/math8122191
Chicago/Turabian StyleMai, Thanh Dam, and Jaiyoung Ryu. 2020. "Effects of Leading-Edge Modification in Damaged Rotor Blades on Aerodynamic Characteristics of High-Pressure Gas Turbine" Mathematics 8, no. 12: 2191. https://doi.org/10.3390/math8122191
Note that from the first issue of 2016, this journal uses article numbers instead of page numbers. See further details here.