Decision Trees for Evaluation of Mathematical Competencies in the Higher Education: A Case Study


Department of Applied Mathematics and Modeling, University of Plovdiv Paisii Hilendarski, 4000 Plovdiv, Bulgaria
Mathematics 2020, 8(5), 748; https://doi.org/10.3390/math8050748
Submission received: 30 March 2020
/
Revised: 3 May 2020
/
Accepted: 5 May 2020
/
Published: 8 May 2020
(This article belongs to the Special Issue Mathematical Modeling and Simulation in Science and Engineering Education)
Abstract
:The assessment of knowledge and skills acquired by the student at each academic stage is crucial for every educational process. This paper proposes and tests an approach based on a structured assessment test for mathematical competencies in higher education and methods for statistical evaluation of the test. A case study is presented for the assessment of knowledge and skills for solving linear algebra and analytic geometry problems by first-year university students. The test includes three main parts—a multiple-choice test with four selectable answers, a solution of two problems with and without the use of specialized mathematical software, and a survey with four questions for each problem. The processing of data is performed mainly by the classification and regression tree (CART) method. Comparative analysis, cross-tables, and reliability statistics were also used. Regression tree models are built to assess the achievements of students and classification tree models for competency assessment on a three-categorical scale. The influence of 31 variables and groups of them on the assessment of achievements and grading of competencies is determined. Regression models show over 94% fit with data and classification ones—up to 92% correct classifications. The models can be used to predict students’ grades and assess their mathematical competency.
1. Introduction
The training in mathematics during the first academic year at university has special characteristics. First-year students come from diverse high schools with different levels of knowledge and skills and varied personal attitudes toward mathematical education. Overcoming these differences is crucial to achieve the objectives of higher education—training highly qualified specialists for the labor market. This is valid for university majors such as mathematics, informatics, engineering sciences, etc. In addition to knowledge and skills, students need to possess various abilities to apply their knowledge and skills to solving practical problems, too. The grouping of these requirements leads to a definition of the concept of mathematical competency. This term was first introduced by the American psychologist R. W. White in 1959, as a concept for performance motivation [1]. Various aspects of this concept are also defined in many other publications. We note [2] where a general concept of mathematical competency is considered, describe the characteristics of the concept in detail, and give examples in the case of school mathematics.
This study is based on the definition in [3], adopted and developed further in the document [4], according to which, mathematical competency is understood as the ability to understand, judge, do, and use mathematics in a variety of intra- and extra-mathematical contexts and situations in which mathematics plays or could play a role. In a recent publication [5], a revised summary version of the concept of mathematical competency is proposed. In particular, References [3,4] define mathematical competency as a combination of eight main competencies, which overlap to a large degree. These are as follows: C1—thinking mathematically; C2—reasoning mathematically; C3—posing and solving mathematical problems; C4—modeling mathematically; C5—representing mathematical entities; C6—handling mathematical symbols and formalism; C7—communicating in, with, and about mathematics; and C8—making use of aids and tools. These competencies are characterized by three dimensions: degree of coverage, radius of action, and technical level.
An important issue that valid in many European Union member states is the lack of unified teaching, training, and assessment standards in mathematics. The European Society for Engineering Education (SEFI) report “A Framework for Mathematics Curricula in Engineering Education” [4] provides a European framework for the teaching of Mathematics in engineering degrees. Particular attention is also given in this framework to the assessment of mathematical competences. These are outlined as the “content-related competencies, knowledge and skills which can be assessed by traditional final written exams, or technology supported assessments like multiple choice tests, or a combination of these”. Regarding the possible ways of assessing the C1–C8 competencies, it is noted that “[t]he competence handling mathematical symbols and formalism is, to some extent, assessed in any written exam. Reasoning mathematically can be assessed by theory questions in the exam”. In addition, “[t]he problem solving or modelling can include numerical calculations or experiments using software, the presentation can include graphical representations of the result. All this can be done as a minor part of a single course module or as a larger project” (see [4], pp. 70–72).
The development of specific approaches for assessment of mathematical competencies under the SEFI framework is presented in the recent publications [6,7,8,9,10]. These papers use specific examples to showcase the main aspects of the assessment standards and activities to implement an innovative pedagogical approach in engineering and science degrees. The approach is based on a competency-based methodology for alteration of traditional teaching methods, teaching, and assessment and assigns an active role to the student in the educational process [6]. Reference [7] describes the results of a study of the data from a survey of students from Portugal and Spain about the use of mathematical software for solving problems in calculus courses. A three-level scale was used to assess the eight competencies with questionnaire questions. The integration of the considered eight competencies using software for the education of students in the course for Software Systems in Mathematics is presented in Reference [8]. Results from a combined test for the assessment of mathematical competencies, processed using two data-mining techniques—cluster analysis and decision trees for statistical evaluation of summative and competency-based assessments—are presented in [9]. The authors of the recent publication [10] describe an experiment mixes game learning methodology (escape room), with engineering students learning linear algebra, calculus, or cryptography. It is concluded that students are more motivated to learn mathematics and acquire mathematical competencies through gaming.
Some studies examine specific issues related to the assessment of mathematical competencies. Later on, we mention [11], which discusses the importance of mastering basic mathematics for engineers and presents the results of an interesting pilot project on core skills assessment to improve student mathematical competency. In [12], large-scale assessments of PISA data are analyzed for measuring mathematics competency at the international and national level. The authors of [13] applied a neuro-fuzzy tool to classify and predict electrical engineering students’ graduation achievements based on a graduation and mathematics grades key performance index.
The statistical study of cumulative data is a significant component of the assessment of the efficacy of mathematics education and the results achieved by the students and/or through surveys about their opinions. Conventional statistical analyses have limited assumptions, such as data type, distribution type, testing for stochastic noise, etc., which often do not permit adequate modeling of dependencies and classifications. Computer-oriented statistical techniques based on a data-mining and machine-learning approach are gaining ever-increasing popularity because they do not have such disadvantages. For example, conventional multiple linear regression finds the linear mathematical relation between the observed independent variables and the dependent variable under numerous assumptions, such as normal distribution, linear dependence, etc. These requirements are not necessitated by the new data-mining methods. They are of the “data-driven” type and assume that the data are the only input, making it possible to automatically extract the hidden patterns and dependences. Instead, these methods are characterized by a large number of resulting models with different statistical features out of which the best could be selected [14]. Data analysis in machine learning and data mining is applied both for classifications and to discover regression-type dependencies, enabling the classification and prediction of studied objects.
In the field of education, a large arsenal of such approaches is applied. Among these, we can mention the methods of cluster analysis, decision trees, classification and regression trees (CART), random forest, artificial neural networks (ANN), fuzzy functions, and others. Modeling and predicting students’ academic performance by using data-mining techniques are among the most frequently studied topics. The authors of [15] studied the applicability of several decision trees’ algorithms to classify students into one of two categories, in order to predict their academic success. The model was developed on the basis of eight predictors, including annual freshman grades in Croatian language, mathematics, and foreign languages, as well as other factors. The best decision-tree model, obtained by the so called REPTree algorithm, classifies well up to 79% of students. The work also contains a comprehensive review of the application of various data-mining methods in higher education. The authors of [16] applied three different data-mining-classification algorithms (decision trees, artificial neural networks, and Naïve Bayes) to analyze and predict students’ academic performance based on their academic record, personal and social information, and forum participation. It was established that the Naïve Bayes classifier outperforms the other two classifiers by achieving overall prediction accuracy of 86%. In [17], five classification methods, variants of decision trees, random forest, and Naïve Bayes are applied to study the impact of different students’ personal, social, and cultural factors on their educational outcomes at the end of the semester. The best results show the models obtained with ID3 decision trees and random forest had 66.2% accuracy. Six data-mining algorithms are used in [18], in order to determine the extent to which the fifth-year grade and final cumulative grade of engineering students depend on five input variables—the program of study, the year of entry, and the grade point average for the first three years of study. A maximum accuracy of 89% is achieved by the logistic regression model. The authors of [19] studied and compared the results of various classifiers, including support vector machine (SVM), decision trees, and others for processing college-student data. The factors which determine graduates’ employability using decision trees are investigated in [20,21]. Predicting students’ dropout rates at university is modeled by random forest and neural networks in [22,23].
Data-mining techniques are also applied in systems for e-learning [24,25], distance learning [26], for a fairer grading of English tests [27], and for many other educational purposes.
Some specifics for applying machine-learning approaches in the field of education are examined [28] for the cases of K-Nearest Neighbors (K-NN), logistic regression, and random forest. An overview of a large number of publications applying data mining is summarized and discussed in review papers [29,30,31].
The objective of this study was to investigate the importance of numerous factors such as the grades of students on individual test problems, students’ self-assessment of their mathematical competencies, their ability to use mathematical software, among others, on the obtained final grade, and the overall mathematical competency. Competency is assessed by using a three-level scale. To this end, a specific example for an assessment test and a methodology for its evaluation are demonstrated, including assessment of mathematical competencies acquired by students that is done by applying the powerful statistical data-mining technique CART. The test is complemented by a survey for validation of students’ opinions, including their opinion about the difficulty of test problems, the use of specialized software, the use of various types of external help features, and their intuitive self-assessment of the level of personal mathematical competency for solving the test problems.
2. Materials and Methods
2.1. Proposed Assessment Test
The assessment test presented in this paper includes multiple-choice questions and problems to be solved in class, in the field of linear algebra and analytical geometry. The students may do the test manually or by using software. In our case, the Wolfram Mathematica package was provided.
A sample test is shown in Figure 1. The questions in the first group are Multiple Choice Test, denoted by Q1, Q2, Q3, and Q4. Each correct answer is awarded 1 point, and each wrong answer gets 0 points.
The problems in the second group are denoted by P1 and P2, awarded respectively 0 to 4 points, as their subproblems are interconnected. For each problem, the student fills in a survey sheet with 4 main questions, S1, S2, S3, and S4, as shown in Table 1. If no response is given, the field is interpreted as a missing value. The survey enables the study of the students’ opinions based on their personal self-assessment. Furthermore, it can be assessed to what extent there is preference for the use of specialized software when solving mathematical problems.
Following the general recommendations from [4], we can identify the eight competencies in the six tasks of the test, as shown in Table 2.
The survey questions will help to evaluate, to a certain extent, the general preparation of students in the chosen mathematical subject, respectively: S1—for basic competencies C1–C4; S2—for C3–C6; S3—for C7; and S4—for C8.
Considering mathematical competency as the most general category that unifies students’ knowledge, skills, and ability to apply them in different situations, it will be evaluated on the basis of the overall scores, depending on the test tasks and the answers to the survey questions.
The developed assessment test is performed by first-year students who are majoring in Software Technology and Design at the Faculty of Mathematics and Informatics at Plovdiv University “Paisii Hilendarski”. During the first trimester, students passed a linear algebra and analytic geometry (LAAG) course, and it is assumed that they have acquired knowledge and skills in the selected field. The assessment test was performed during the second trimester, as part of the specialized course in Software Technology for Mathematics (SSM course), where students are trained to use specialized software to solve mathematical problems and for visualizations, namely Wolfram Mathematica and the online tool wolframalpha (see also [8]).
According to the curriculum, students study the elements of mathematical analysis in a course in Applied Mathematics 1 in the second academic year and modeling in a course in Applied Mathematics 2 in the fourth year. Mathematics training in the first two years is conducted by using traditional methods, without the use of project-oriented, game-based, or other modern approaches. Therefore, the inclusion of a practical mathematical problem was considered inappropriate in the design of the test. On the other hand, the opportunity given to students to solve mathematical problems using software and references on the Internet and other sources allows us to evaluate implicitly their practical preparation in relation to their future profession as ICT specialists and software engineers.
2.2. Data
The number of students participating in the study was n = 62. Each student solved an individual test and filled in a survey for each problem. The total time to complete the test was 45 min. The sum of points for each student forms the variable Score. Intermediate variables are introduced as follows: ScoreQ = Q1 + Q2 + Q3 + Q4 and ScoreP = P1 + P2. The data from the responses to the survey with the test (S1, S2, S3, and S4; see Table 1) are coded numerically and recorded as ordinal variables or a total of 24 variables. They are denoted respectively by R_Q11, R_Q12, …, R_P24, where R_Q11 stands for “Response to Question 1 with S1”, R_Q12 stands for “Response to Question 1 with S2”, …, and R_P24 stands for “Response to Problem 2 with S4”.
We also used an additional dichotomous categorical variable, Sex, to account for the sex of the student.
2.3. Methods
2.3.1. Initial Processing of the Data
This includes the following analyses and type of evaluation:
- Investigation of the difficulty of the problems. The difficulty coefficient is determined by the percentage of correct solutions. MCT problems with a choice of 4 distractors are considered to be difficult if the coefficient of difficulty is between 0 and 73, and easy if the coefficient is between 74 and 100 [32]. The same rule is applied for both problems P1 and P2. The difficulty of the test is evaluated as a percentage of the mean value of Score against the maximum possible number of points—in this case, 12.
- The level of mathematical competencies acquired by the student (variable Competency). It is assessed by using 3 levels. The following assessment is used for this test: low level—when the total number of points for the student is compared against the maximum number of points, rated against the level difficulty of the problem between 0 and 27; mean—between 28 and 73; and high—between 74 and 100.
- Descriptive statistics of survey data. Student opinions for S1, S2, S3, and S4 are processed through comparison with the achieved results for the solution of the problems, using a cross-table. The answers are coded as follows: (a) 1 point, (b) 2 points and (c) 3 points. It needs to be noted that some opinions are also given in cases where problems have not been solved or there are no opinions for problems which have been solved. This is reflected in the processing of the data.
2.3.2. Statistical Analyses
Short Description of CART
Decision trees is a family of data-mining and machine-learning methods used for classification and regression. The method allows for the processing of numerical and nominal data without requirements for their distribution or other limitations. There are various algorithms in the method, and the one we use in this study is CART, as developed in [33]. CART is considered to be one of the top 10 algorithms for data mining [34]. CART distributes the working sample of cases for a target variable, denoted as , as a binary tree structure with non-intersecting subsamples called nodes, according to certain rules.
The rule for each split of the current (parent) node is as follows: “if , then the case for Y is classified and distributed in the left child node of , otherwise in the right one”. Here, is the ith value of the predictor , and is some threshold value of . At each step of node formation, the predicted model value of the target is the mean value or the relative number of classified cases in a given node. The algorithm searches all predictors and all values in order to determine those which minimize a given error type for the model at each split. In order to stop the growing of the tree and to avoid model overfitting, initial control parameters are set. These can be the minimum number of cases in a parent node, minimum number of cases in a child node, type of cross-validation, tree depth, reaching a set error type, and others. For machine learning, the standard recommendation is to use 10-fold cross-validation. The resulting model contains all cases of the target classified in the terminal nodes of the tree. A detailed description of the CART method, its properties, and examples are given in [33,34,35,36].
Performed Statistical Analyses
- CART regression for determining the dependency of Score on the obtained scores of all problems of the test, on the responses to the survey, and on both groups of variables together. Assessment of the importance of variables in the regression model.
- CART classification for assessment of Competency depending on the obtained scores of all problems of the test, the responses to the survey, and both groups of variables together.
- Determining the reliability of the test by calculating Cronbach’s alpha coefficients.
- Studying the influence of the category Sex on the results of the Score and Competency using T-test.
Statistical modeling was performed by using the software product SPSS, version 26 [37].
3. Results of the Initial Processing of the Data with Discussion
3.1. Problem Difficulty
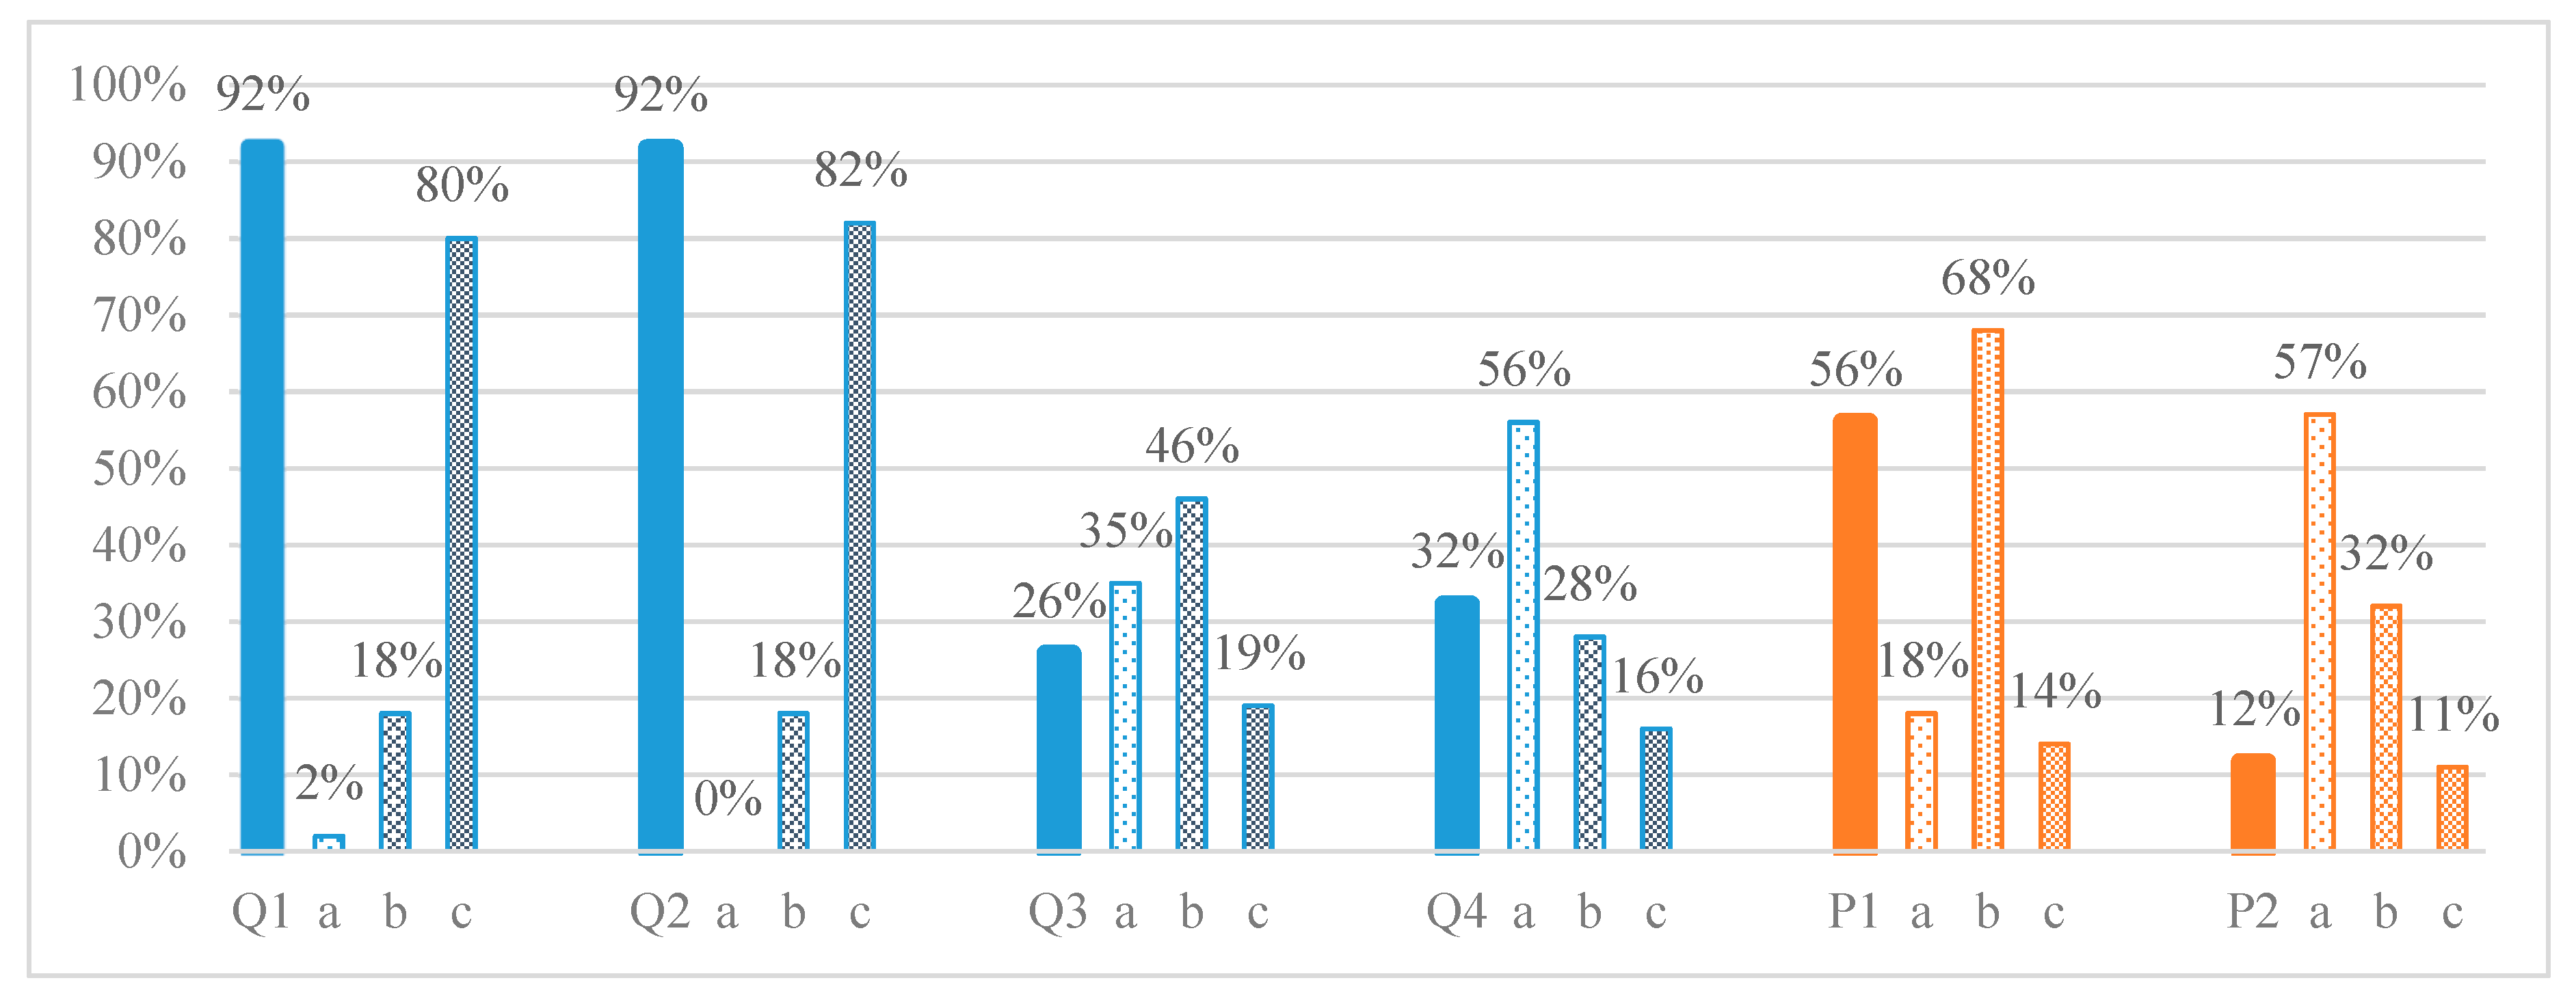
Problems in the assessment test (Figure 1) were solved respectively for Q1, Q2, … P1, P2 by 61, 62, 60, 58, 60, and 41 students. If there is no solution, a score of 0 is given. The summary results for the difficulty of the problems in the assessment test are presented in Figure 2 as percentages of the number of responses in columns with background fill color. It can be concluded that the first two questions, Q1 and Q2 (linear algebra), of the MCTs are easy; Q4 and P1 are of medium difficulty; and the rest—Q3 and P2 (analytic geometry)—are difficult. This matches exactly the intended level when preparing the test with respect to the educational materials.
3.2. Assessment of the Level of Acquired Mathematical Competencies, Measured by the Test
After sorting the variable Score, the following results were obtained for the measured level of overall Competency in the studied sample:
- Low level of competency (0% to 27%)—9 students;
- Medium level of competency (28%–73%)—48 students;
- High level of competency (74%–100%)—5 students.
3.3. Cross-Analysis of the Survey
To this end, we study the results of the responses to the survey S1, S2, S3, and S4.
Figure 2 shows the summary results as percentages of student opinions about difficulty (S1), in the shaded columns. The self-assessed levels of difficulty according to the students is compared against the obtained Score results and shows the following: for Q1 and Q2, the predominant response is “c” (easy) with values greater than 73%, and for P1 the predominant response is “b” (68%), i.e., correctly evaluated; for P2, the largest number of responses are “a” (57%), which corresponds to “difficult”, and adding “b” (32%) provides an approximately accurate evaluation. The only exception is that of the self-assessment for problems Q3 and Q4, which were assessed by the students as one level easier than the actual result. It needs to be noted that these assessments are approximate, given that there are missing data for survey responses.
Table 3 shows the percentages for the distribution of responses for all 24 survey variables.
Survey question S2 about the manner of problem solving in Table 3 shows that, for algebraic problems Q1, Q2, and P1, students have opted to use software, with some people (33%) solving Q2 manually. In this case, it is indeed recommended to use software, especially when calculating more complex problems, such as systems of algebraic equations with four unknowns and transformations of matrices (P1). The geometry problems Q3, Q4, and P2 are solved predominantly manually, since formal calculations are far fewer.
For survey question S3, the predominant answer is “c”, with the use of software systems and/or Internet sources in separate cases, probably materials from LAAG and SSM lectures and seminars, accessible during the test on the faculty website.
With regard to the self-assessment of students about their level of mathematical competencies according to problems, Table 3 shows that, in their opinion, they have a sufficiently high level for Q1 and Q2 and a medium level for P1. Their self-assessment for the geometry problems is within 50% for low and 30% for medium level of competency. This matches well the difficulty of the problems. The last four rows of the last column of Table 3 can practically be interpreted as low self-assessment. The general conclusion is that students are not confident in their knowledge, predominantly in analytical geometry, tested with Q3, Q4, and P2. This indicates that the SSM course should place an emphasis exactly on this type of problem and solving using software.
4. Results of Statistical Analyses with CART with Discussion
Four groups of independent variables were used when building regression and classification models, as shown in Table 4. In particular, the G4 predictor group was introduced to investigate separately the impact of student scores for questions/problems and their respective self-assessment of competency (S4) on the target variables Score and Competency.
Depending on the group, the total number of independent variables varies between 7 and 31. Due to the small sample size, (m1, m2) = (5, 2) are selected as control parameters, where m1 is the minimum number of cases in parent node and m2 is the minimum number of cases in child node [35,36].
4.1. Regression Models of Score Using CART
The objective of these models is to assess the importance of points for individual problems and the influence of the other factors on the total number of points (Score variable) for the conducted assessment test. The best models are selected according to the following goodness-of-fit criteria: high coefficient of determination and minimum root mean squared error (RMSE) [36]. It needs to be noted that the CART method is not influenced by the type and distribution of variables, or the use of standardized values. Table 5 shows summary statistics for the obtained models.
Table 5 shows that the structure of the trees is comparatively simple, with a limited number of terminal nodes. The obtained statistics for models M1, M3, and M4 with coefficient of determination of 94% indicate that these models describe about 94% of sample variance. There is internal consistency and stability of the models based on the examined data. To an extent, model M2 is an exception, with predictors only from the responses to S1, S2, S3, and S4 from the survey and relatively inferior statistics, in this case = 75.4%. This, in terms of psychological testing, is a good result.
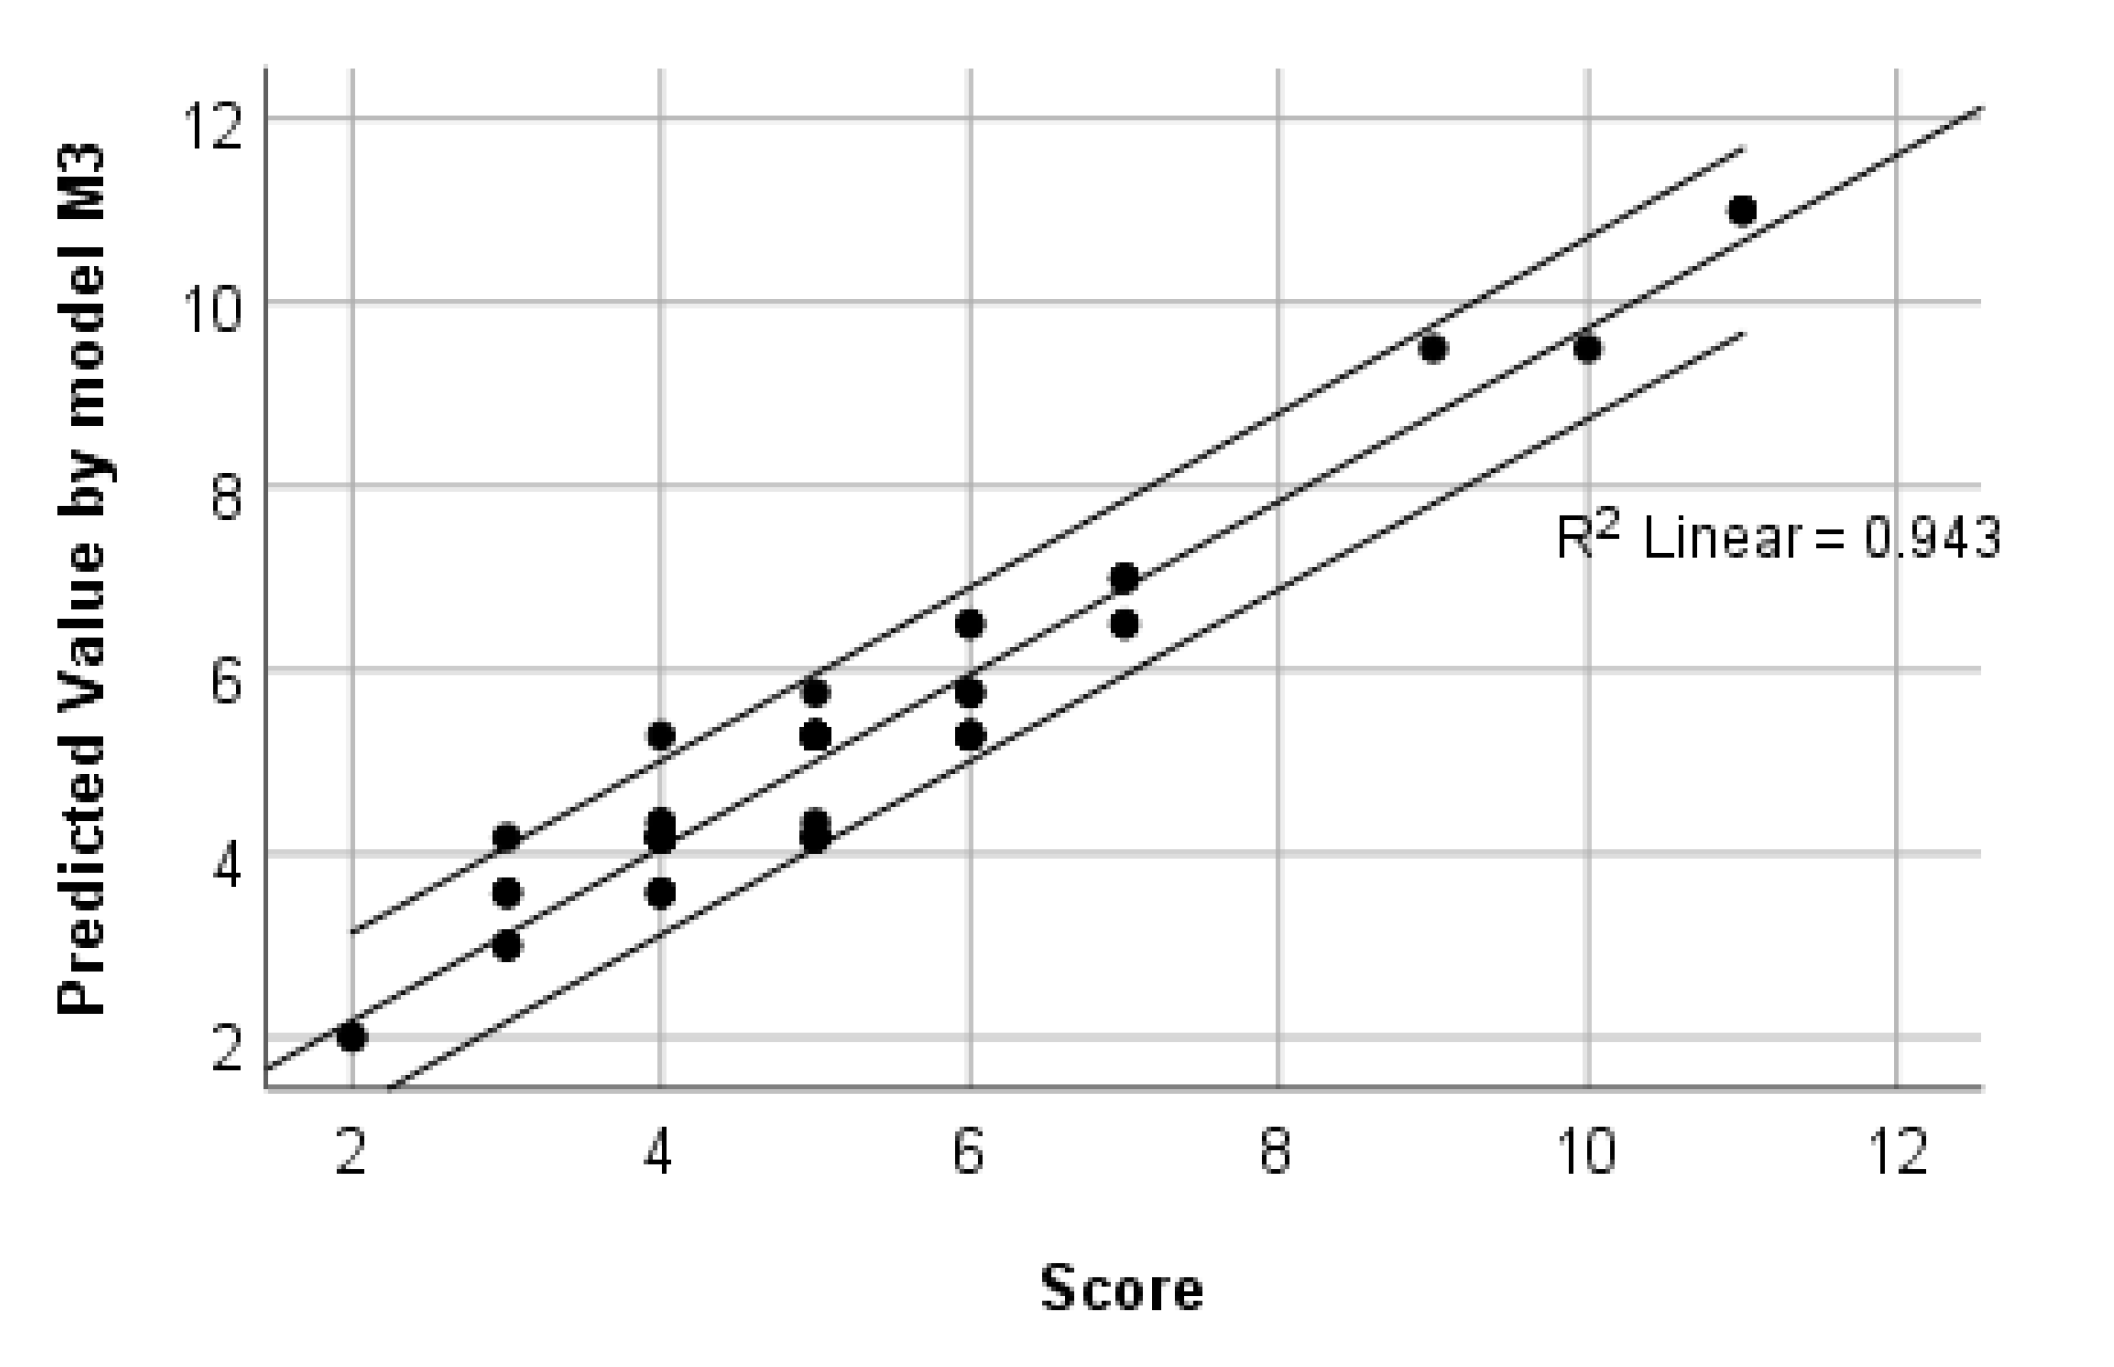
The last column of Table 5 shows the relative influences of individual variables within the models. For example, for the difficulty of problems (model M1), the greatest significance is that of variables P2, P1, and, to a much lesser extent, Q4. The rest have relative influence of under 5% and Sex has no influence. As an example, Figure 3 compares the values of Score against those predicted by model M3. Figure 4 shows a part of the CART tree of model M3.
4.2. Assessment of Competency through Classification Models Using CART
As described above, in Section 3.2, this study considered three levels of mathematical competency—low, medium, and high. The objective of the modeling was to examine to what extent the models correctly assess the average level of the group of students with regard to four groups of variables, G1, G2, G3, and G4 (see Table 4). This would make it possible to determine the main factors which form the level of competency, as well as the applicability of the CART approach for disclosing important patterns within data with great accuracy.
A summary of built models is given in Table 6. Similar ratios are seen compared to regression CART models of individual groups of variables. The importance of individual variables within the classification models is given in the last column of this table, where the variable with the highest impact has 100% and the other variables -% with respect to it.
As an example, the classification from model MC4 compared to the levels of competency is given in Table 7. Very good agreement of the correctly classified cases is observed with direct assessment of the level of competency by the variable Competency, as achieved by the model. It is especially high for medium competency, at 95.8%. This is based mainly on the variables P2, R_P24, P1, Q3, R_Q24, Q2, etc. (see Table 6).
The classification tree for the MC4 model is shown in Figure 5.
4.3. Reliability of Survey Data
The reliability of the survey was studied by using Cronbach’s alpha statistics [38], respectively, with regard to the students’ opinions S1, S2, S3, and S4 for MCT (16 variables), problems P1 and P2 (8 variables), and the overall 24 variables. The Cronbach’s alpha reliability coefficient is a measure of internal consistency, which shows how closely related particular items are as a group in a psychometric test [39].
Table 8 shows that the coefficients for both groups of constructs are greater than 0.7, and therefore, they are acceptable. Missing responses are taken into account when calculating the statistics. It can be concluded that the survey responses are sufficiently reliable as a test.
4.4. Study of the Influence of Gender of the Student
In the performed study, out of a total of n = 62 students, 26 were women (code 1) or 42%, and 36 were men (code 2) or 58%. In order to study the influence of sex, independent sample T-tests were also performed for the variables ScoreQ, ScoreP, Score, and Competency. The results indicate that respondents’ sex is statistically non-significant for each of these four variables. These statistics confirm the obtained results for lack of influence by sex, as shown in the obtained CART models for all considered variables.
5. Conclusions
The statistical processing of data in education is an important research topic that makes it possible to study and summarize collected empiric information of varying types. The application of new powerful data-mining and machine-learning methods enables the development of high-performance models for analysis and extraction of significant information and patterns from the data, through classification and identification of dependencies. These methods are suitable for both small- and large-scale data volumes. The obtained models can be used to improve teaching and assessment methods; to influence student success and motivation factors; and to adjust academic curricula and schedules, among others. In this study a midterm test was developed to assess the knowledge and mathematical competency of first-year students in linear algebra and analytic geometry. The specific part of the test is a survey developed to ask students about their opinion about each problem. This provides feedback from the students. The presented methodology for assessment of the test and the mathematical competencies demonstrate internal consistency, a unifying level of difficulty of the problems, and a three-level competency scale, to find the dependence of each problem on the overall assessment of the test and other components.
The basic results obtained in the study can be summarized as follows:
- A three-level scale was introduced to assess both the acquired knowledge and the mathematical competencies of students.
- Through cross-analysis of the collected data, the power of the distractors of the test was estimated and a relatively good match was found between these and the responses of the self-assessment questions in the survey. This can be applied in practice, to adjust and improve test design.
- By applying the powerful and flexible CART technique, four regression models were built to examine student knowledge, using a target variable Score and four CART models for assessment of the mathematical competencies, using target Competency. The influence of a total of 31 predictor variables is measured in these models, with predictors divided into four groups. Classification models of Competency indicate very good accuracy with correct classifications of 83.3% up to 91.9% in individual models. Therefore, it can be assumed that the degree of influence of the factors is very close to the actual one. For CART regression models of Score data, fitting is up to 94.3%. Only for the model of Score with predictors from the survey alone, fitting is 75%. The practical benefit from the CART models built lies also in the fact that the weight/importance of individual factors, which approximate with high-accuracy Score and Competency are determined explicitly. This makes it possible to draw the correct conclusions and to take subsequent actions both by teachers and by students, and also at the university level, in order to improve the teaching process and its results.
- It is confirmed that there is internal consistency of the survey questions by using reliability Cronbach’s alpha coefficients.
- Using T-test and CART models, it is found that gender is not a significant factor for test results.
As far as the author is aware, in literature, the studies to assess mathematical competency in higher education by using data-mining methods are scant. Here, the results can be compared against Reference [9], where regression type CART models are built to explain the final exam results in linear algebra and analytic geometry of students in two other specialties at the same university, based on a short competency test with mathematical problems and midterm tests results. In [9], the models describe 92.6% and 93.4% of data variance, which concurs with our results. Generally, in cases where other types of empirical data and data-mining techniques are used, similar model performance is achieved (see, for instance, [15,16,18]).
It can be concluded that the approach proposed in this study has very perspective and varied practical applications. The methodology can be applied to all types of competencies, such as content-related, procedural, contextualized, etc., if the data are available. As with all methods which use empirical model building, there are also a number of limitations. Among these, we have to mention the need for very careful selection of modeling predictors when using data-mining methods, which should not correlate strongly, the possibility of obtaining unstable models, as well as selection of the best model, in order to avoid model overfitting. In the latter case, it is always recommended to use cross-validation, comparing against similar models, etc.
The proposed approach was developed within the framework of the European project Rules Math. It can be complemented by short projects for solving practice-oriented problems.
The results obtained by using CART enable future studies for the assessment of mathematical competencies. The structure of the test is to be expanded by adding a new group of factors, which characterizes students according to age, type of school education, average grades upon admission at the university, average mathematics grade in the high school diploma, current average grade at university, and university major, among others. There is also interest in studying as many students as possible, encompassing students from the entire faculty, as well as first-year students from other partner universities in Europe, participating in the development of standards for the Rules Math project.
Funding
This work was supported by the Erasmus+ program of the European Union, under grant 2017-1-ES01-KA203-038491 (RULES_MATH).
Acknowledgments
We want to thank all the students who participated in the test.
Conflicts of Interest
The author declares no conflict of interest.
References
- White, R.W. Motivation reconsidered: The concept of competence. Psychol. Rev. 1959, 66, 297–333. [Google Scholar] [CrossRef]
- Abrantes, P. Mathematical competence for all: Options, implications and obstacles. Educ. Stud. Math. 2001, 47, 125–143. [Google Scholar] [CrossRef]
- Niss, M. Mathematical Competencies and the Learning of Mathematics: The Danish KOM Project. In Proceedings of the 3rd Mediterranean Conference on Mathematical Education, Athens, Greece, 3–5 January 2003; The Hellenic Mathematical Society: Athens, Greece; pp. 115–124. Available online: http://www.math.chalmers.se/Math/Grundutb/CTH/mve375/1112/docs/KOMkompetenser.pdf (accessed on 20 March 2020).
- Alpers, B.A.; Demlova, M.; Fant, C.-H.; Gustafsson, T.; Lawson, D.; Leslie Mustoe, L.; Olsen- Lehtonen, B.; Robinson, C.; Velichova, D. A Framework for Mathematics Curricula in Engineering Education: A Report of the Mathematics Working Group; European Society for Engineering Education (SEFI): Brussels, Belgium, 2013; Available online: http://sefi.htw-aalen.de/Curriculum/Competency%20based%20curriculum%20incl%20ads.pdf (accessed on 20 March 2020).
- Niss, M.; Højgaard, T. Mathematical Competencies in Mathematics Education; Springer: New York, NY, USA, 2019. [Google Scholar]
- Queiruga-Dios, A.; Sanchez, M.J.S.; Perez, J.J.B.; Martin-Vaquero, J.; Encinas, A.H.; Gocheva-Ilieva, S.; Demlova, M.; Rasteiro, D.D.; Caridade, C.; Gayoso-Martinez, V. Evaluating Engineering Competencies: A New Paradigm. In Proceedings of the Global Engineering Education Conference (EDUCON), Tenerife, Spain, 17–20 April 2018; IEEE: New York, NY, USA, 2018; pp. 2052–2055. [Google Scholar] [CrossRef]
- Caridade, C.M.; Encinas, A.H.; Martín-Vaquero, J.; Queiruga-Dios, A.; Rasteiro, D.M. Project-based teaching in calculus courses: Estimation of the surface and perimeter of the Iberian Peninsula. Comput. Appl. Eng. Educ. 2018, 26, 1350–1361. [Google Scholar] [CrossRef]
- Kulina, H.; Gocheva-Ilieva, S.; Voynikova, D.; Atanasova, P.; Ivanov, A.; Iliev, A. Integrating of Competences in Mathematics through Software-Case Study. In Proceedings of the Global Engineering Education Conference (EDUCON), Tenerife, Spain, 17–20 April 2018; IEEE: New York, NY, USA, 2018; pp. 1586–1590. [Google Scholar] [CrossRef]
- Gocheva-Ilieva, S.; Teofilova, M.; Iliev, A.; Kulina, H.; Voynikova, D.; Ivanov, A.; Atanasova, P. Data mining for statistical evaluation of summative and competency-based assessments in mathematics. In Advances in Intelligent Systems and Computing; Martínez Álvarez, F., Troncoso, L.A., Sáez Muñoz, J., Quintián, H., Corchado, E., Eds.; Springer: Cham, Switzerland, 2020; Volume 951, pp. 207–216. [Google Scholar] [CrossRef]
- Queiruga-Dios, A.; Sánchez, M.J.S.; Queiruga-Dios, M.; Gayoso-Martínez, V.; Encinas, A.H. A virus infected your laptop. Let’s play an escape game. Mathematics 2020, 8, 166. [Google Scholar] [CrossRef] [Green Version]
- Carr, M.; Brian, B.; Fhloinn, E.N. Core skills assessment to improve mathematical competency. Eur. J. Eng. Educ. 2013, 38, 608–619. [Google Scholar] [CrossRef]
- Ehmke, T.; van den Ham, A.-K.; Sälzer, C.; Heine, J.; Prenzel, M. Measuring mathematics competence in international and national large scale assessments: Linking PISA and the national educational panel study in Germany. Stud. Educ. Eval. 2020, 65, 100847. [Google Scholar] [CrossRef]
- Mat, U.B.; Buniyamin, N. Using neuro-fuzzy technique to classify and predict electrical engineering students’ achievement upon graduation based on mathematics competency. Indones. J. Electr. Eng. Comput. Sci. 2017, 5, 684–690. Available online: http://ijeecs.iaescore.com/index.php/IJEECS/article/download/6523/6260 (accessed on 20 March 2020).
- Hastie, T.; Tibshirani, R.; Friedman, J. The Elements of Statistical Learning: Data Mining, Inference, and Prediction; Springer: New York, NY, USA, 2011. [Google Scholar]
- Mesarić, J.; Šebalj, D. Decision trees for predicting the academic success of students. Croat. Oper. Res. Rev. 2016, 7, 367–388. [Google Scholar] [CrossRef] [Green Version]
- Mueen, A.; Zafar, B.; Manzoor, U. Modeling and predicting students’ academic performance using data mining techniques. Int. J. Mod. Educ. Comp. Sci. 2016, 8, 36–42. [Google Scholar] [CrossRef]
- Jain, A.; Choudhury, T.; Mor, P.; Sabitha, A.S. Intellectual performance analysis of students by comparing various data mining techniques. In Proceedings of the 3rd International Conference on Applied and Theoretical Computing and Communication Technology (iCATccT), Tumkur, India, 21–23 December 2017; IEEE Press: Singapore; Shah Alam, Malaysia, 2017; pp. 57–62. [Google Scholar] [CrossRef]
- Adekitan, A.I.; Salau, O. The impact of engineering students’ performance in the first three years on their graduation result using educational data mining. Heliyon 2019, 5, e01250. [Google Scholar] [CrossRef] [Green Version]
- Agarwal, S.; Pandey, G.N.; Tiwari, M.D. Data mining in education: Data classification and decision tree approach. Int. J. e-Educ. e-Bus. e-Manag. e-Learn. 2012, 2, 140–144. [Google Scholar] [CrossRef] [Green Version]
- Yang, F. Decision tree algorithm based university graduate employement trend prediction. Informatica 2019, 43, 573–579. [Google Scholar] [CrossRef] [Green Version]
- Tapado, B.M.; Acedo, G.G.; Palaoag, T.D. Evaluating information technology graduates employability using decision tree algorithm. In Proceedings of the 9th International Conference on E-Education, E-Business, E-Management and E-Learning, IC4E 2018, New York, NY, USA, 11–13 January 2018; pp. 88–93. [Google Scholar] [CrossRef]
- Behr, A.; Giese, M.; Teguim, K.; Theune, K. Early prediction of university dropouts-A random forest approach. Jahrb. Natl. Stat. J. Econ. Stat. 2020. [Google Scholar] [CrossRef]
- Siri, A. Predicting students’ dropout at university using artificial neural networks. Italian J. Sociol. Educ. 2015, 7, 225–247. [Google Scholar] [CrossRef]
- Castro, F.; Vellido, A.; Nebot, À.; Mugica, F. Applying data mining techniques to e-learning problems. Stud. Comput. Intell. 2007, 62, 183–221. [Google Scholar] [CrossRef]
- Jovanovic, M.; Vukicevic, M.; Milovanovic, M.; Minovic, M. Using data mining on student behavior and cognitive style data for improving e-learning systems: A case study. Int. J. Comput. Intell. Sys. 2012, 5, 597–610. [Google Scholar] [CrossRef] [Green Version]
- Brandao, I.V.; Da Costa, J.P.C.L.; Santos, G.A.; Praciano, B.J.G.; Junior, F.C.M.D.; De, S.; Junior, R.T. Classification and predictive analysis of educational data to improve the quality of distance learning courses. In Proceedings of the WCNPS 2019-Workshop on Communication Networks and Power Systems, Brasilia, Brazil, 3–4 October 2019; Volume 8896312. [Google Scholar] [CrossRef]
- Ivanova, V.; Zlatanov, B. Implementation of fuzzy functions aimed at fairer grading of students’ tests. Educ. Sci. 2019, 9, 214. [Google Scholar] [CrossRef] [Green Version]
- Xiao, Z.M.; Higgins, S. The power of noise and the art of prediction. Int. J. Educ. Res. 2018, 87, 36–46. [Google Scholar] [CrossRef] [Green Version]
- Shahiri, A.M.; Husain, W.; Rashid, N.A. A review on predicting student’s performance using data nining techniques. Proced. Comp. Sci. 2015, 72, 414–422. [Google Scholar] [CrossRef] [Green Version]
- Dutt, A.; Ismail, M.A.; Herawan, T. A systematic review on educational data mining. IEEE Access 2017, 5, 15991–16005. [Google Scholar] [CrossRef]
- Alyahyan, E.; Düştegör, D. Predicting academic success in higher education: Literature review and best practices. Int. J. Educ. Technol. High. Educ. 2020, 17, 3. [Google Scholar] [CrossRef] [Green Version]
- Bizhkov, G. Theory and Methodology of Didactic Tests; Prosveta: Sofia, Bulgaria, 1996. (In Bulgarian) [Google Scholar]
- Breiman, L.; Friedman, J.H.; Olshen, R.A.; Stone, C.J. Classification and Regression Trees; Chapman and Hall/CRC: Boca Raton, FL, USA, 1984. [Google Scholar]
- Wu, X.; Kumar, V. The Top Ten Algorithms in Data Mining; Chapman & Hall/CRC: Boca Raton, FL, USA, 2009. [Google Scholar]
- Steinberg, D. CART: Classification and regression trees. In The Top Ten Algorithms in Data Mining; Wu, X., Kumar, V., Eds.; Chapman & Hall/CRC: Boca Raton, FL, USA, 2009; pp. 179–202. [Google Scholar]
- Izenman, A.J. Modern Multivariate Statistical Techniques. Regression, Classification, and Manifold Learning; Springer: New York, NY, USA, 2008. [Google Scholar]
- IBM Inc., IBM SPSS Software, New York. 2020. Available online: https://www.ibm.com/analytics/spss-statistics-software (accessed on 20 March 2020).
- Cronbach, L.J. Coefficient alpha and the internal structure of tests. Psychometrika 1951, 16, 297–334. [Google Scholar] [CrossRef] [Green Version]
- DeVellis, R.F. Scale Development: Theory and Applications, 4th ed.; Sage: Los Angeles, CA, USA, 2016. [Google Scholar]
Figure 1.
Sample test.

Figure 2.
The evaluation of the difficulty of the problems in the assessment test (background fill color) and the students’ self-assessment from question S1 (shaded columns).
Figure 2.
The evaluation of the difficulty of the problems in the assessment test (background fill color) and the students’ self-assessment from question S1 (shaded columns).

Figure 3.
Predicted values of Score, obtained by CART model M3 versus observed values.

Figure 4.
Decision tree model M3 for Score and G3 predictor group.

Figure 5.
CART tree of model MC4.


Table 1.
Survey sheet for each problem in the test.
| S1 For Me, This Problem Is: | S2 I Have Solved It: | S3 I Used the Help of: | S4 My Mathematical Competencies for This Problem Are: |
|---|---|---|---|
| (a) difficult | (a) manually | (a) Internet source | (a) insufficient |
| (b) average | (b) manually and with software | (b) with the help of software | (b) almost sufficient |
| (c) easy | (c) with software | (c) nothing additional | (c) sufficient |
Table 2.
Correspondence between competencies and the test elements 1.
| Competency | Test Questions/Problems | ||||||
|---|---|---|---|---|---|---|---|
| Q1 | Q2 | Q3 | Q4 | P1 | P2 | ||
| C1 | Thinking mathematically | - | - | 0 | + | 0 | + |
| C2 | Reasoning mathematically | - | - | 0 | 0 | 0 | 0 |
| C3 | Problem solving | - | - | - | - | + | + |
| C4 | Modeling mathematically | - | - | - | 0 | 0 | 0 |
| C5 | Representation | 0 | 0 | + | + | 0 | + |
| C6 | Symbols and formalism | + | + | 0 | 0 | + | 0 |
| C7 | Communication | 0 | 0 | - | - | 0 | - |
| C8 | Aids and tools | + | + | 0 | 0 | + | 0 |
1 The meaning of the signs is as follows: +, “very important”; 0, “medium important”; -, “less important”.
Table 3.
Cross-table with survey results for questions S1, S2, S3, and S4 as percentages.
| S1, % | S2, % | S3, % | S4, % | |||||||||
|---|---|---|---|---|---|---|---|---|---|---|---|---|
| a | b | c | a | b | c | a | b | c | a | b | c | |
| Q1 | 2 | 18 | 80 | 13 | 29 | 58 | 13 | 25 | 62 | 0 | 31 | 69 |
| Q2 | 0 | 18 | 82 | 33 | 10 | 57 | 27 | 18 | 55 | 3 | 33 | 64 |
| Q3 | 35 | 46 | 19 | 73 | 8 | 19 | 14 | 12 | 74 | 50 | 33 | 17 |
| Q4 | 56 | 28 | 16 | 49 | 19 | 32 | 14 | 13 | 73 | 46 | 34 | 20 |
| P1 | 19 | 68 | 13 | 0 | 34 | 66 | 19 | 36 | 45 | 8 | 67 | 25 |
| P2 | 57 | 32 | 11 | 69 | 10 | 21 | 24 | 6 | 70 | 52 | 33 | 15 |
Table 4.
Distribution of independent variables in CART models.
| Predictor Group | Number of Independent Variables | Independent Variables |
|---|---|---|
| G1 | 7 | Q1, Q2, Q3, Q4, P1, P2, Sex |
| G2 | 24 | R_Q11, …, R_Q44, …, R_P11, …, R_P24 |
| G3 | 31 | All from G1 and G2 |
| G4 | 12 | Q1, Q2, Q3, Q4, P1, P2, R_Q14, R_Q24, R_Q34, R_Q44, R_P14, R_P24 |
Table 5.
Summary statistics of regression CART models for Score.
| Model | Predictors | Terminal Nodes | R2, % | RMSE | Normalized Independent Variable Importance, % |
|---|---|---|---|---|---|
| M1 | G1 | 11 | 94.0 | 0.471 | P2(100), P1(44.2), Q4(5.8), Q1(2.5), Q3(0.5), Q2(0.4), Sex(0) |
| M2 | G2 | 14 | 75.4 | 0.981 | R_Q41(100), R_Q13(79.3), R_P14(79.0), R_P24(74.0), R_P11(73.6), R_P21(72.1), R_Q44(5.1), R_Q34(58.0) |
| M3 | G3 | 11 | 94.3 | 0.474 | P2(100), P1(44.2), R_Q41(11.4), R_P11(9.9), R_Q31(8.2), R_P14(7.1), R_Q34(6.0), R_Q24(5.9), Q4(5.8), R_Q11(5.7), R_Q32((5.3), R_P22(5.2) |
| M4 | G4 | 11 | 94.0 | 0.486 | P2(100.0), P1(44.2), R_P14(6.8), R_Q34(6.0), R_Q24(5.9), Q4(5.8) |
Table 6.
Summary statistics of classification CART models for Competency 1.
| Model | Group of Variables | Terminal Nodes | Percent Correct, % | Normalized Independent Variable Importance, % |
|---|---|---|---|---|
| MC1 | G1 | 8 | 91.9 | P2(100), P1(74.8), Q4(11.4), Q1(10.9), Q3(9.1), Q2(6.5) |
| MC2 | G2 | 10 | 82.3 | R_Q41(100), R_P23(82.5), R_Q23(66.1), R_Q31(55.5), R_P22(53.2), R_P14(50.9), R_Q44(48.9), R_Q24(43.0), R_P13(40.1) |
| MC3 | G3 | 8 | 90.3 | P2(100), R_P24(64.9), P1(64.3), R_P22(39.8), Q3(38.2), R_P21(28.8), R_Q44(22.4), R_Q22(20.7), R_P11(19.8), R_Q13(17.2), R_Q41(15.2) |
| MC4 | G4 | 8 | 91.9 | P2(100), R_P24(78.8), P1(59.4), Q3(17.5), R_Q24(14.7), Q2(9.2), R_Q44(8.7), Q1(6.1), R_P14(5.4) |
1 Low-impact variables are omitted.
Table 7.
Contingency table for obtained classification by model MC4 for variables in group G4.
| Observed | Predicted | |||
|---|---|---|---|---|
| Low Competency | Medium Competency | High Competency | Percent Correct | |
| Low competency | 8 | 1 | 0 | 88.9% |
| Medium competency | 2 | 46 | 0 | 95.8% |
| High competency | 0 | 2 | 3 | 60.0% |
| Overall Percentage | 16.1% | 79.0% | 4.8% | 91.9% |
Table 8.
Reliability statistics.
| Scale from S1, S2, S3, S4 | Cronbach’s Alpha | Cronbach’s Alpha Based on Standardized Items | Number of Items |
|---|---|---|---|
| Variables: Q1, Q2, Q3, Q4 | 0.767 | 0.746 | 16 |
| Variables: Q1, Q2, Q3, Q4, P1, P2 | 0.818 | 0.819 | 24 |
© 2020 by the author. Licensee MDPI, Basel, Switzerland. This article is an open access article distributed under the terms and conditions of the Creative Commons Attribution (CC BY) license (http://creativecommons.org/licenses/by/4.0/).
Share and Cite
MDPI and ACS Style
Ivanov, A. Decision Trees for Evaluation of Mathematical Competencies in the Higher Education: A Case Study. Mathematics 2020, 8, 748. https://doi.org/10.3390/math8050748
AMA Style
Ivanov A. Decision Trees for Evaluation of Mathematical Competencies in the Higher Education: A Case Study. Mathematics. 2020; 8(5):748. https://doi.org/10.3390/math8050748
Chicago/Turabian StyleIvanov, Atanas. 2020. "Decision Trees for Evaluation of Mathematical Competencies in the Higher Education: A Case Study" Mathematics 8, no. 5: 748. https://doi.org/10.3390/math8050748
Note that from the first issue of 2016, this journal uses article numbers instead of page numbers. See further details here.