
Integrated Survival Analysis and Frequent Pattern Mining for Course Failure-Based Prediction of Student Dropout


MTA-PE “Lendület” Complex Systems Monitoring Research Group, Department of Process Engineering, University of Pannonia, Egyetem Street 10, H-8200 Veszprém, Hungary
*
Author to whom correspondence should be addressed.
Mathematics 2021, 9(5), 463; https://doi.org/10.3390/math9050463
Submission received: 4 February 2021
/
Revised: 19 February 2021
/
Accepted: 20 February 2021
/
Published: 24 February 2021
(This article belongs to the Special Issue Artificial Intelligence in Education)
Abstract
:A data-driven method to identify frequent sets of course failures that students should avoid in order to minimize the likelihood of their dropping out from their university training is proposed. The overall probability distribution of the dropout is determined by survival analysis. This result can only describe the mean dropout rate of the undergraduates. However, due to the failure of different courses, the chances of dropout can be highly varied, so the traditional survival model should be extended with event analysis. The study paths of students are represented as events in relation to the lack of completing the required subjects for every semester. Frequent patterns of backlogs are discovered by the mining of frequent sets of these events. The prediction of dropout is personalised by classifying the success of the transitions between the semesters. Based on the explored frequent item sets and classifiers, association rules are formed providing the estimates of the success of the continuation of the studies in the form of confidence metrics. The results can be used to identify critical study paths and courses. Furthermore, based on the patterns of individual uncompleted subjects, it is suitable to predict the chance of continuation in every semester. The analysis of the critical study paths can be used to design personalised actions minimizing the risk of dropout, or to redesign the curriculum aiming the reduction in the dropout rate. The applicability of the method is demonstrated based on the analysis of the progress of chemical engineering students at the University of Pannonia in Hungary. The method is suitable for the examination of more general problems assuming the occurrence of a set of events whose combinations may trigger a set of critical events.
1. Introduction
Student dropout in higher education is a world-wide problem that is worth paying attention to. The problem is especially significant in the United States, where one third of the students give up their studies before the second year, causing significant financial damage to the government [1]. A significant proportion of students do not complete their studies in Latin American countries either, especially in Chile [2]. Another issue is that dropout is significantly in different levels of education, so it also appears in students pursuing doctoral studies [3]. Therefore, the analysis of student dropout is a significant task from an international point of view, and this is only further confirmed by the fact that the prestige of educational institutions lies in the success of their participants, and the successful completion of the started training has a crucial importance from the viewpoint of the students as well.
Educational data mining focuses on analysing the impact of various factors in this area. The impact of artificial intelligence on education has already been reviewed [4]. The study found that artificial intelligence has been adopted and used in various fields of educational institutions. These areas are administrative functions, grading assignments, improving teaching activities. The applications of big data and artificial intelligence (AI) have become significant, and they open a novel trend. AI has enormous potential to realize highly effective learning and teaching. However, it is still fairly novel and unfamiliar to many researchers and educators, indicating exciting unsolved challenges [5]. This paper aims to deal with this claim.
Student dropout has also become a popular topic of research of educational data mining. Due to the complex nature of the topic, specific objectives need to be formulated and methodologically developed instead of general models [6]; therefore, some studies examine the performance of the students by using a variety of data mining methods [7]. Data mining methods are also used to examine the overlapping of the completion of individual courses and the difficulties they are likely to cause to the participants during the training [8]. The most popular data mining methods include decision trees, neural networks, logistic regression and cluster analysis [9]. The traditional classification cannot directly be utilized for estimating probability events [10]. The neural network can make predictions, but the process of the algorithm cannot be interpreted [11]. This method is also not suitable to determine frequent itemsets. Cluster analysis is suitable for partitioning the students, but it cannot provide a prediction model [12]. We note that there are often only a few samples to which to apply a complex parametric model. In this case a semi-parametric model is proposed.
Survival analysis provides solutions to many problems, and it is possible to examine dropouts with this technique [13]. Although the study of dropouts usinga survival models has not yet received much attention [14], it is clear that it is worth paying attention to explore its possibilities. The survival model is suitable for predicting the possibility of a dropout up to several semesters. In contrast, basic machine learning tools are more advantageous in determining the outcome of a given semester [15]. This framework has proven to be similarly useful for predicting the success of online education [16]. Moreover, it can also detect dropout factors [17] The significant advantage of this method is that it can only predict which student is likely to fail in the completion of their studies, but also indicates the time of their dropout [15]. The disadvantage of the method is that only early predictions can be made for forecasting of few semesters and an extended model is needed to examine the long-term students [18]. The explanation of this lies in the countless variations of missing subjects making the task of forecasting extremely complex.
There can be a myriad of research aspects why a student becomes at-risk or drops out of university. So far, the researches have been focusing on estimates based on high school performance [19]. The interesting factors are the gathered background information combined with the semester performance [20], as well as the financial [21] and family background [22]. However, there are also some universal factors in the studies in addition to the factors mentioned earlier. These are, for example, demographics and personal characteristics. The literature review revealed that none of the studies published estimations based on the student’s lack of subjects patterns. This investigation aspect is aimed at in this paper.
One of the significant deficiencies of student dropout studies is that methodologies focus only on early prediction. Thus, one of the future challenges is to develop a robust and comprehensive early warning system that can also effectively predict and identify “at-risk” students in the distant future [23]. Considering the mentioned challenge, this paper aims to integrate survival analysis with machine learning methods to make the appropriate predictions. Based on these, our research aims to identify a model that discovers regularities in the frequently uncompleted subjects based on the available performance data of students. Not only are the frequently occurring association rules predicting the dropout of students determined by the association rule mining algorithms, but the associated Kaplan–Meier estimate of the empirical distribution of the dropout times is provided as well. The association rule mining is a well-known technique. It helps to discover hidden patterns and highlights relationships and correlations [24]. In the study of student dropout, this is a particularly advantageous feature that can identify the dynamics that ultimately lead to student failure. This method is thus able to predict dropouts up to several semesters and show critical subjects and critical subject sequences based on the requirements of a subject. The association rule mining method has easily understandable probability theory, and it seems to be analogous to survival analysis [25]. The initial ideas aimed to represent the uncompleted subjects as sequences for the total study time, but it turned out that this requires huge computing capacity. The proposed associated Kaplan–Meier methodology has been compared to the Naive Bayes Classification method.
Association rule mining has already been used in the past to examine dropout. One study examined failure using several methods, and the study also includes the association rule mining [26]. The difference from the current study is that it predicts based on factors influencing the student: family problems, health problems, personal problems, institutional problems. Only fallen students were observed, and the significance of dropout is caused by the individual influencing factors. In contrast, this study considers the proportion of students who graduated and gives information about success. Machine learning methods to predict dropout in the first year based on some student-specific features such as gender and high school id were also compared [27]. The study also covered some admission tests, and this is not considered in this study. If this test is failed, the student has to attend further specific courses and has to pass. The results show that the prediction is more accurate and performs better if the proper features are selected.
The novelties of the paper are: (i) it uses a different aspect to predict the dropout, namely the uncompleted subjects; (ii) it integrates the survival analysis and machine learning methods to deeper explore the interrelations and correlations, (iii) the methodology is able to predict the dropout in a long time range. The method was developed based on the data of approximately 350 students of the chemical engineering undergraduate program of the University of Pannonia in Hungary.
2. Integration of Survival Analysis and Frequent Itemset Mining
This section presents the developed methodology in a generalized form as it is suitable for the examination of more general problems assuming the occurrence of a set of events whose combinations may trigger a set of critical events.
The methodology starts with the integration of the various data sources needed for the identification of the triggering and consequential events, whose probabilities are considered as competitive risks, in order to obtain a general model that is valid for the whole dataset (population) by the means of survival analysis. As the obtained model cannot provide specific predictions or risk assessments for a specific individual, in-depth event analysis is performed based on the frequent itemsets of the triggering effects.
Among the large set of itemsets generated by the frequent itemset mining algorithms, only a few will be informative regarding their ability to predict the consequential events. The applicable sets of itemsets are filtered by forming association rules that describe how a specific consequential event is caused by the certain sets of the triggering events.
The probability of the consequential events is calculated based on the integrated analysis of the identified association rules. By aggregating the calculated probabilities for the whole population, the resultant estimate is suitable for the validation of the model based on the results of the survival analysis.
The following subsections provide the details of the method.
2.1. Empirical Survival Function of the Occurrence Times
The proposed method studies the nonparametric empirical distribution of the occurrence of events in ordered discrete occurrence times: . The survival function represents the conditional probability that determines that an event occurs later than , provided that it has not yet occurred until the time :
Let be the probability that gives a recursive description of the survival function:
The value of can be estimated based on the number of events that occurred at time and the number of cases at time k in which the event has not occurred until time yet (which means represents the size of the risk set at time ):
Substituting Equation (3) into Equation (2), the Kaplan–Meier empirical distribution of the occurrence of the events can be obtained [28]:
An example for the resulted distribution function is shown in Figure 1.
2.2. Handling Competing Risks in Survival Analysis
The presented Kaplan–Meier model cannot be directly applied when there is more than one consequential event, e.g., besides the dropout of students, they can successfully graduate as well (and the graduating students cannot be expelled by the university). Our key idea is that, the probability of occurrence of these consequential events should be handled as competing risks. Depending on what type of competing risks exist and which survival analysis procedure is used, there are several methods to handle competing risks. In the case of the Kaplan–Meier survival analysis, the calculation of the Cumulative Incidence Curves is the obvious way of extending the method to handle competing risks:
where is the number of occurrences of the th competing risk at time , where C represents the number of competing risks.
The hazard function of the cth examined risk () represents the probability of the occurrence of the cth consequential event:
The Incidence Curve () can be calculated from the survival function and the hazard function as:
By aggregating the values of the Incidence Curve, we obtain the Cumulative Incidence Curve () [28]:
One of the significant advantages of the presented empirical distribution is that it can be easily applied even if the problem also requires the management of competing risks. However, the disadvantage of this method is that the whole dataset is treated as one and no additional information, like the impact of different uncompleted subjects, is provided on individual cases. For applications where there may be a variety of causes of an event, it is advisable to explore the impact of the sets of possible causes and their contribution to the risk of a consequential event. The following subsection presents how such frequent itemsets of events and association rules can be explored.
2.3. Frequent Event Pattern Mining for Survival Analysis
The formalisation of the frequent itemset mining-based event analysis is based on the following definitions.
Similarly to the survival analysis, the studied events can occur in discrete time instances . Let denote the occurrence of the ith event at time . We study a set of cases at time , so when the ith event occurs at time in the jth case, it is denoted as . The set contains events that occur in the th time instance or kth time period in case j, while the set of these sets represents all the events at the time. In our analysis a case is the set of uncompleted subjects of a specific student, or, in more general terms, the event trace in process mining.
The purpose of frequent itemset mining is to reveal a set of informative event patterns, where p represents the index of the mined patterns, . A pattern is supported by the case when . The importance of a pattern is measured by its support () that measures the relative number of cases in which the pattern occurs:
The pattern is frequent, if its support exceeds a specific value: .
The frequent pattern mining algorithms aim to find all the frequent patterns. Therefore, the higher the value is, the smaller the number of generated patterns, which intuitively improves the interpretability of the model, while at a smaller value, more itemsets are extracted representing more specific cases and a more accurate, yet less interpretable, model is produced.
We are looking for frequent patterns that can be grouped into a set of triggering events and a consequential event as follows: , as the antecedent part of the association rule is the set of triggering events and the consequential part is the triggered consequential event.
The confidence of the association rule is the conditional probability, that describes the probability that the set of triggering events causes the consequential event:
Based on the support and confidence measures of the association rules, the probability of the consequential events can be calculated as it is presented in the next subsection.
2.4. Integrated Analysis of the Association Rules
As in most of the cases more frequent itemsets are generated; the proper aggregation of these association rules is a cardinal step of the analysis to calculate the probability measures of certain consequential events.
Naturally, based on each rule, a different probability (risk) is associated with the occurrence of the event. A logical conclusion is that the rule with the highest probability will have the greatest impact on the fate of a specific student; therefore, the rule with the highest probability () is considered in the case of each student:
The next step is to calculate the probability of drop out generalized for all students. In this case, it is advisable to take the maximum of the maximum probability values () of individual students:
This probability defines the hazard function for the competing risk of the survival analysis:
which can be used to estimate the number of events,
3. Application to Student Dropout Prediction
To set up the model, the course completion data of former chemical engineering students at the University of Pannonia was used who had already either graduated or been expelled from the university. Active and passive students were excluded from the study because there is no information about their outcome. Reapplied students were also excluded from the analysis. The students were completely anonymized. It was not necessary to obtain permissions as we use data from our university. The input of the method was created by integrating student log files and sample curriculum. The provided data were recorded between 2011 and 2018 and included approximately 350 students. Care had to be taken to exclude students during the data processing as to who had already applied and dropped out before 2011. If these students reapply after 2011, it causes confusing factors like the student graduating too soon for incomprehensible reasons. It was also challenging to formulate each case of uncompleted subject failure patterns.
3.1. The Description of the Analysed Dataset of Course Completions
All data was anonymized prior to your access and analysis. The studied data can be downloaded from the website of the authors (https://www.abonyilab.com/about-us/software-and-data, accessed on 22 October 2018.).
The integrated student log file consists of two components. The student database records each attempt to complete a subject as an elementary event. There is also a binary variable describing graduation and unsuccessful graduation (drop out). Combining these with the information extracted from the sample curriculum, an integrated student log file can be created. A sample for this log file is shown in Table 1.
Based on the integrated student log file, the empirical distribution function can be specified by the Kaplan–Meier method. However, for more complex event analysis, conversion steps must be included.
The student subject failures are represented as events. An example is shown in the Gantt chart in Figure 2. Let be the semester in which the student should complete the ith subject according to the sample curriculum, and be the semester in which the first successful completion of the subject was recorded. The elementary event is the ith lack of subject completion event of the jth student in the kth semester, if . These events can be grouped according to semesters. The causal events (whose triggering causes are to be found) represent when the jth student does not continue his studies in the semester, and leaves the university due to failure. As will be presented in the next subsection, this event will be considered the competing risk that the student will continue his/her studies.
3.2. Investigation of Student Dropout with Survival Analysis Taking into Account the Competing Risks
Examining the study path of a university student, it is clear that if someone successfully graduates, no other outcome can happen to that person. However, if someone interrupts his/her studies or is fired for any reason, that person can re-enrol on the training. These students are excluded from the study. Thus, the unsuccessful finishing of the program and the successful graduation will be competing risks that need to be handled. In this case, by determining the Cumulative Incidence Curve of the unfortunate case, the exact dropout rate of students can be estimated. To obtain this measure, it is necessary to identify the number of students who dropped out in a given semester and the number of successful degrees that the students obtained. The number of graduates in the fth semester is denoted by and the number of students who dropped out is indicated by . Then, substituting the parameters mentioned above into Equation (15), the Cumulative Incidence Curve can be calculated as follows:
The calculation process of the individual results over time is collected and explained in Table 2.
The comparison of the function estimated by the Kaplan Meier method and the function estimated by the Cumulative Incidence method can be seen in Figure 3. The emergence of competing risks begins in the seventh semester. Since this is the length of the sample curriculum, this is the moment when the other output option, the graduation, appears. If there is no other competing risk, the Cumulative Incidence Curve is the same as the empirical distribution by Kaplan–Meier, which is well visible in the figure until the seventh semester as well, and the two functions begin to differ only after that. The relation of the functions to each other is also satisfactory, since due to the typical phenomenon that the Kaplan–Meier distribution overestimates the risks, the probability of survival is lower than in the case of the Cumulative Incidence Curve. The difference between the two functions determines the graduated students.
As mentioned earlier, the disadvantage of the Kaplan–Meier model, which manages competing risks, is that it describes the entire population at once. However, it must be recognized that considerable differences can occur when students follow different subject (in)completion pathways during their university years. The consequences of failing in Mathematics or Chemistry in the first semester can be completely different. This is the reason why event analysis is introduced, into the means of frequent itemset and association rule mining.
3.3. Event Analysis with the Mining of Frequent Itemsets and Association Rules
Based on the previously presented concepts in this case study, the event denotes the missing completion of the ith subject in the kth semester, is the pattern of missing subjects of the jth student in the kth semester, and the is the pattern of missing subject completions of the students in the kth semester. It should be highlighted that the set is extended to contain both the triggered consequential events, so when the given student fails at the end of the kth semester.
As each case study has different types of relevant information, it is important to note that in the case of student dropout, conditions should be made to mine frequent itemsets. There are some results when the support of a certain uncompleted subject is the same as the support of that certain uncompleted subject and some other subjects together. In this case, the other subjects do not affect the dropout and may determine poor results after aggregating. To avoid this phenomenon, we use the Closed Frequent Itemset Mining method [29]. The frequent itemsets are mined based on the set of patterns. The method has an important hyper-parameter, which is the minimum support of the frequent itemset mining algorithm. A smaller number of supports results in a higher number of rules, so the complexity of the rule base can be fine-tuned by this parameter. Similarly to other machine learning tasks, the optimal complexity of the model can be fine-tuned by cross validation as will be presented in the following section.
3.4. Integrated Analysis of Student Dropout
In order to verify the authenticity of the data and to handle the over-fitting issue, we used five-fold cross-validation. After performing the steps mentioned in the previous sections, the analysis of the results can be performed. The five most critical rules of every semester are summarized in Table 3. Based on the critical dropout rules, the subjects with their names are summarized in Table 4, using the ID-s and names of the subjects according to Appendix A. Apparently, every semester has its subject, which seems to be critical, for example, in the first semester, the core subjects providing the basic engineering knowledge such as mathematics, physics and chemistry. Moreover, there are uncompleted subjects that reoccur over multiple semesters. Examples are the comprehensive exam in chemistry, which appears from the fifth semester and lasts until the end of the analysis, or the transportphenomena, which is a critical subject in three semesters as well.
The Cumulative Incidence Curve generated from the association rules and the Cumulative Incidence Curve generated from the survival analysis is shown in Figure 4. This model apparently approximates the Cumulative Incidence Curve of survival analysis very well with the aggregation strategy of the maximum confidences method. It can be said that a student can easily be accepted at an engineering course in Hungary, even at ones that are supported by the government, as it is a highly deficient profession. Therefore, many students try to complete the course, but they soon realize that they cannot make it. In the first few semesters, more than half of the students abandon the study by the end of the fifth semester. In the first two semesters, students leave who realize on their own that course is too hard for them. A higher dropout rate is seen in the third semester. Its reason is that there are requirements to continue the course. Every student must complete all subjects recommended by the sample curriculum in the first semester by the end of the third semester. However, one time, it is possible to request a so-called fairness request, and this allows for one subject to be completed in the fourth semester. The dropout rate in the fourth semester usually affects those who have not managed this request well either. The last significant dropout is seen in the fifth semester. Its reason is that there is also a requirement to continue the course. Another dropout phenomenon is that students can decide to reapply for the course at any time. This is done to obtain better chances by erasing their previous bad results and resetting the requirement system. Thus, as the method examines only the first attempt of performing the training, these students are also considered as dropped out. Previous studies have shown that there are few students who complete the training after reapplying. However, experience shows that it is not worth applying again because the failure is still significant. Once students reach the 5th semester, they are less likely to drop out after this semester. Finally, based on the 11th semester, it can be stated that approximately 40% of students can graduate on their first attempt.
The obtained results suggest that it would be necessary for university management to reconsider some functional elements. First, it would be essential to reschedule the sample curriculum subjects. There are subjects whose primary skills are created for subjects that are recommended in later semesters. Since many people dropped out in the 3rd semester due to the requirement there, it would be important to rethink its terms. Furthermore, it can be noticed that, in many cases, there is a connection between the given subject and the teacher. In this regard, it would be important to organize useful training for these educators based on the section 1.5 of the European Standards and Guidelines [30].
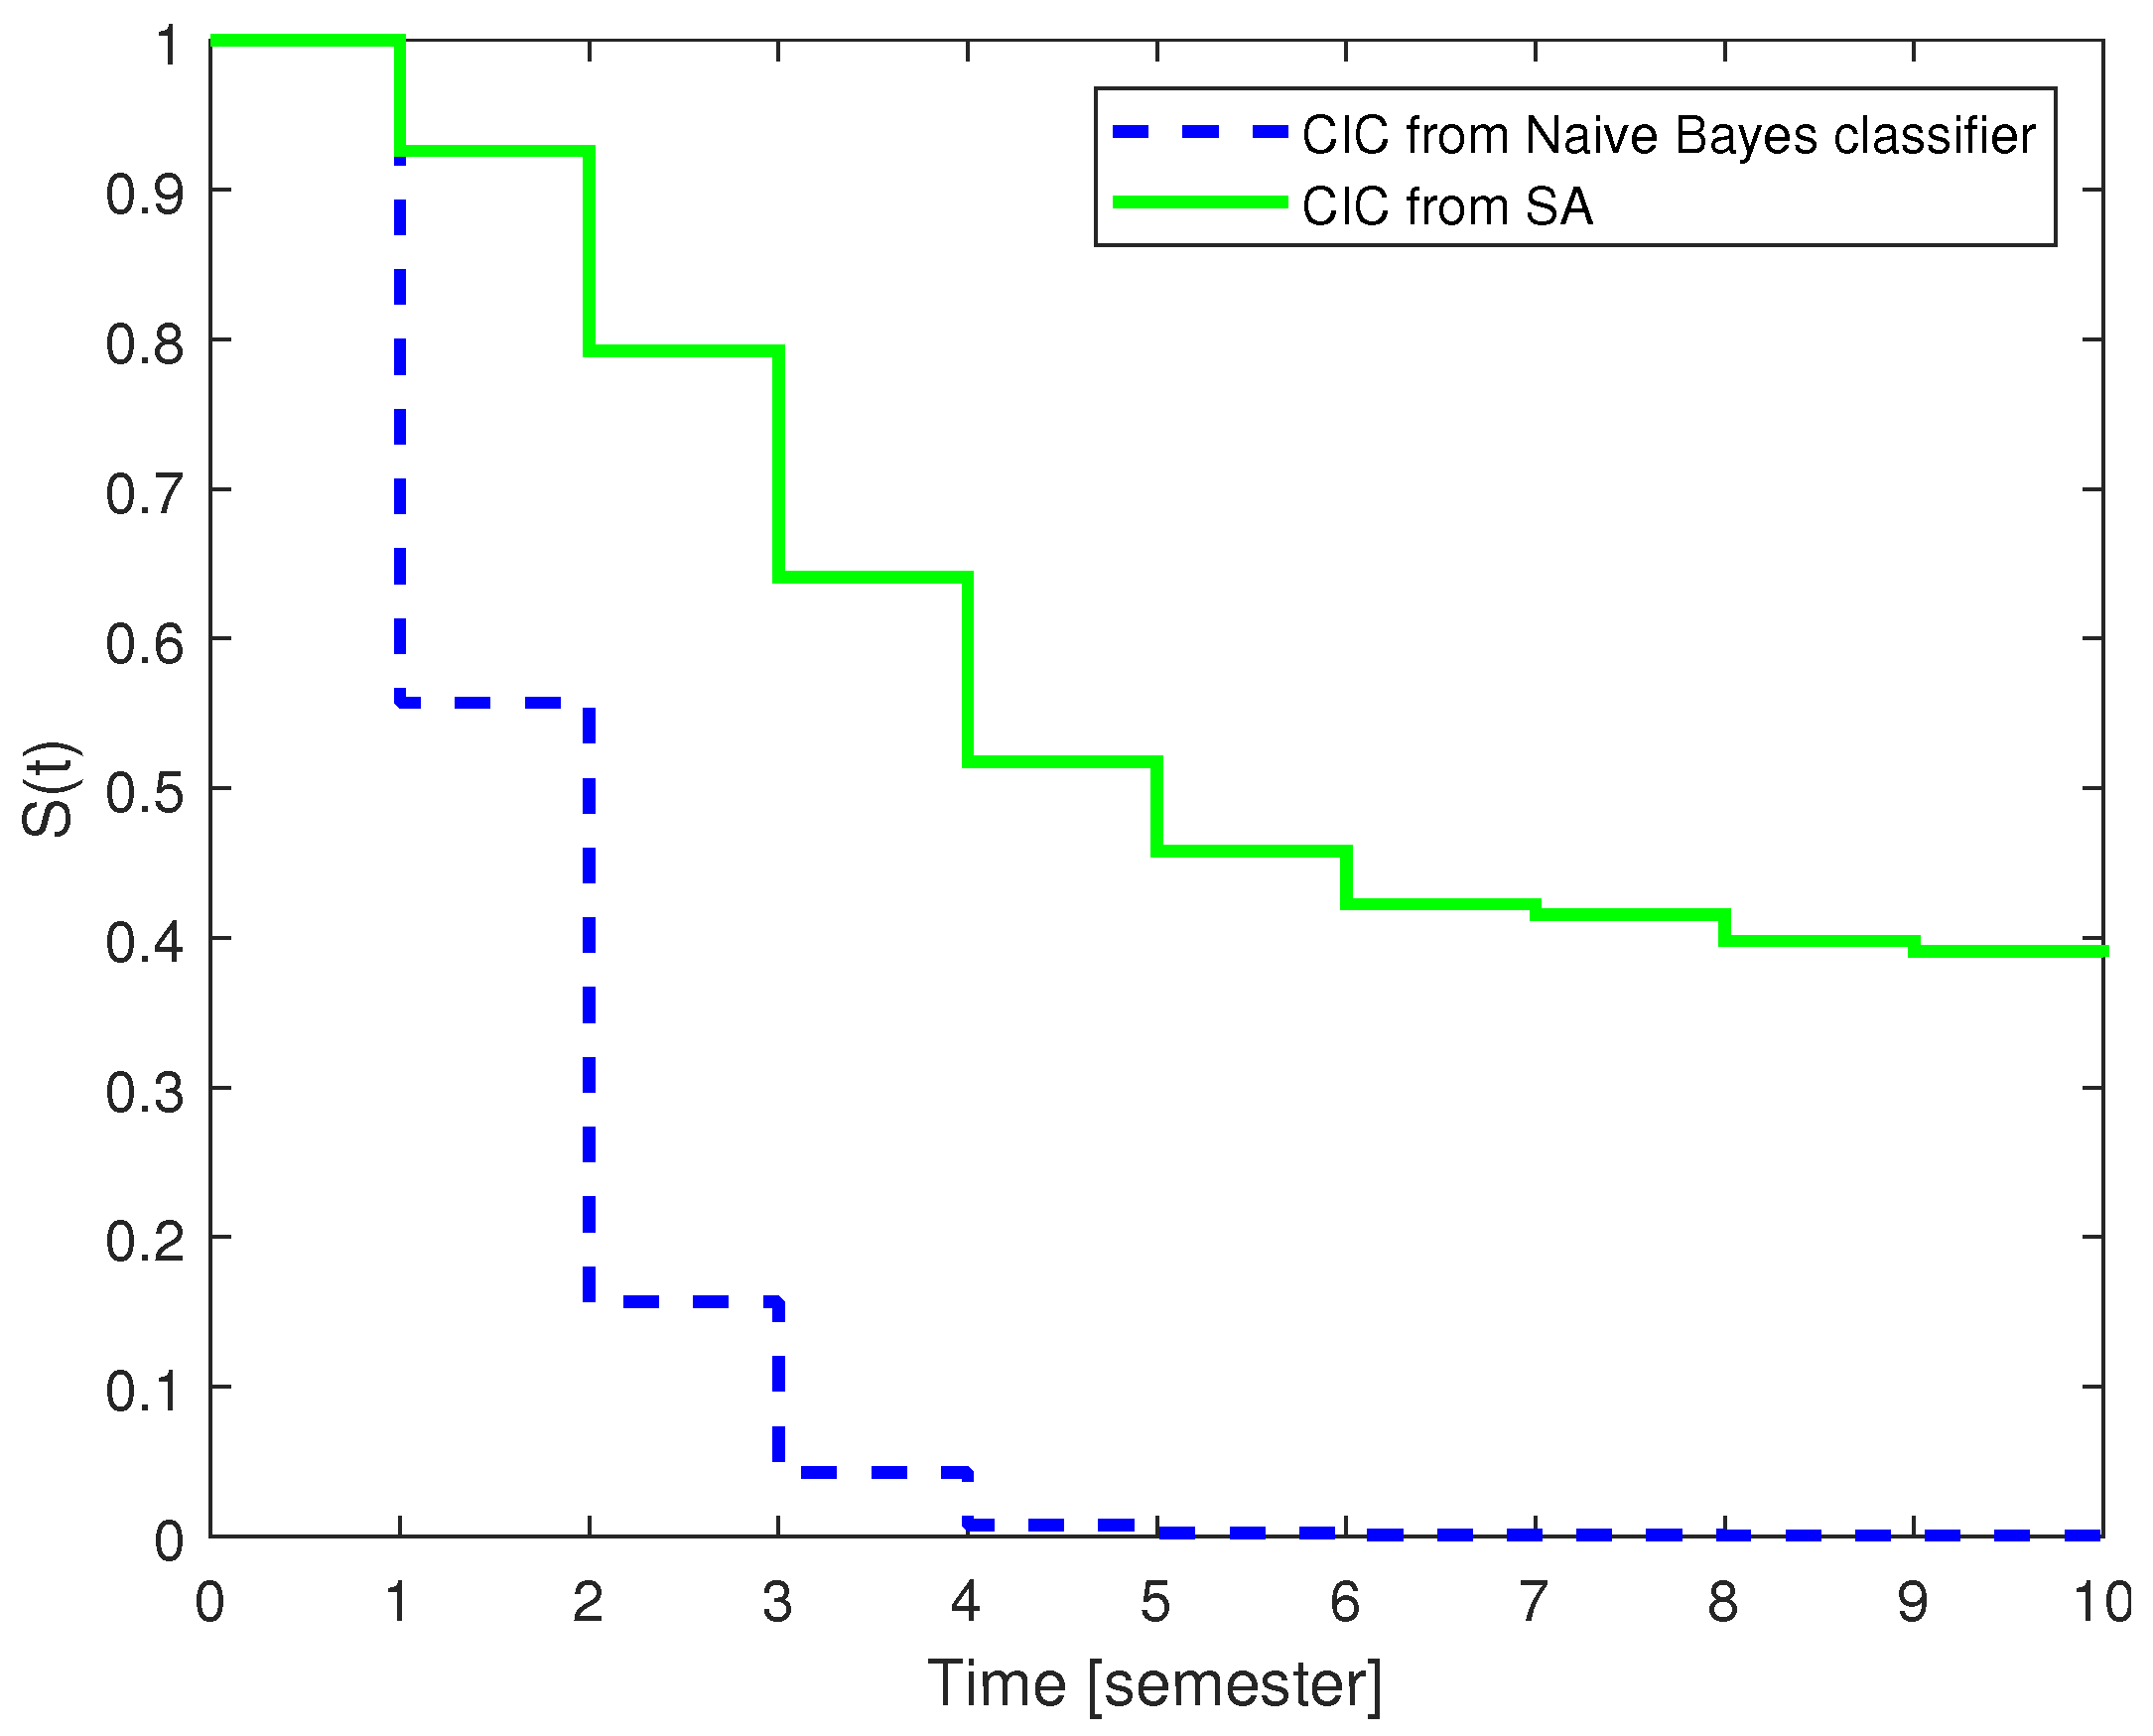
In order to present the effectiveness of the developed methodology from several perspectives, we also performed comparative analysis. The Naive Bayes Classification method was selected for comparison. Based on the results, it can be said that the classifier is very poorly able to estimate dropout based on uncompleted subjects. The Cumulative Incidence Curve of the Naive Bayes classifier and the survival analysis is compared in Figure 5 for one-fold change. It can be said that the Naive Bayes model overestimated the number of failures. Based on this, the method proved to be weak for prediction. However, in the case of failed students, the model was accurate, so the method may still be suitable as an alerting system.
To illustrate the effectiveness of the two methods, in both cases we determined the mean of the absolute difference between the Cumulative Incidence Curve function derived from the Naive Bayes and the proposed model as can be seen in Table 5.
Based on the confidence of the association rules, the proposed method is also suitable for estimating the probability of dropping out of an active student who is still in training based on his/her current uncompleted subjects. Since the student already has a given pattern of uncompleted subjects, the conditional probability must be calculated. Based on the missing subject completions, personalized predictions can be made by looking for what new uncompleted subjects can most likely follow the pattern of uncompleted subjects. Thus, the developed method also answers what kind of uncompleted subjects are expected of the student. Like any methodology, this one also has its limitations. It can be observed that after a given semester, the majority of students who have not dropped out will graduate. There are very few students who reached the 11th semester, so there are significantly fewer data available in proportion, which results in uncertainty in the forecast for the last semesters. If much more data are available, more accurate results can be obtained, but the proportions still result a minimal amount of data.
4. Conclusions
Student drop-out is one of the problems of our age, causing significant economic loss and social tension. Despite the fact that more and more researchers analyse the issue, to our knowledge, so far no method has been developed that would predict the student’s academic success based on the student’s uncompleted subjects.
The present paper illustrates that the survival analysis based on a competing risk model effectively provides an estimate of the probability of graduation. The disadvantage of survival analysis, however, is that by itself it cannot incorporate the impact of different (currently) uncompleted subjects into the probability of drop out from the course. However, deviations from the sample curriculum can be present in innumerable permutations and can show significant differences in terms of risk. After identifying the problem, it was highlighted that it is expedient to extend the survival analysis model with event analysis methods. Representing subject completion deficiencies as events, frequent patterns can be identified by frequent itemset mining, from which association rules are formed to discover the lack of subject completions that leads to the dropout of a student. A method to estimate the probability of a student progressing from semester to semester and obtaining a degree based on the characteristics of the pattern of uncompleted subjects was also developed.
The probability of surviving (remaining active student in the next semester) calculated by the model approximates well the results of the survival analysis, that is, the Kaplan–Meier estimate of the empirical distribution. By extending the method, it is also possible to estimate subjects are likely to be uncompleted in the future by an active student still in training. The method can be further developed into an automated personalized counselling system.
The model may also be suitable for examining a wide class of problems. An important characteristic of the applications is the presence of overlapping process steps and the occurrence of transitions caused by the triggering phenomenon. Examples include the development activities, so the method seems to be suitable to support capability maturity model integration processes which will be one of our future research avenues.
Author Contributions
Conceptualisation and supervision, J.A.; experimentation, code development: R.C.; writing—original draft preparation, R.C., and J.A.; funding acquisition, J.A. All authors have read and agreed to the published version of the manuscript.
Funding
This research was supported by the Cooperative Doctoral Program financed under Ministry of Innovation and Technology by the National Research, Development and Innovation Fund (NKFIH) of Hungary and by the OTKA-135195 project financed by the National Research, Development and Innovation Office (NKFIH) of Hungary. Publication charges for this article were fully paid by the TKP2020-NKA-10 project financed under the 2020-4.1.1-TKP2020 Thematic Excellence Program by the National Research, Development and Innovation Fund (NKFIH) of Hungary.
Institutional Review Board Statement
Not applicable.
Informed Consent Statement
Not applicable.
Data Availability Statement
The studied data can be downloaded from the website of the authors https://www.abonyilab.com/about-us/software-and-data (accessed on 22 October 2018).
Conflicts of Interest
Authors declare no conflict of interest.
Abbreviations
The following abbreviations are used in this manuscript:
| Denotation | Meaning |
| Empirical distribution function of survival | |
| Hazard function of ith competitive risk | |
| Incidence Curve of ith competitive risk | |
| Cumulative Incidence Curve of ith competitive risk | |
| e | Event |
| The ith event occurs at time | |
| The set of events of jth case | |
| The set of events of jth case at time | |
| Set of events at time | |
| The set of typical series of events at time | |
| The ith typical series of events at time | |
| The support of set of events at time | |
| Treshold of minimal support | |
| Left side of the association rules of the frequent itemset associated with a consequential event |
Appendix A. Information about the Sample Curriculum

Table A1.
Summary of the Identifiers, Names Used in the Study and the Number of Recommended Semesters of Subjects According to the Sample Curriculum part 1.
Table A1.
Summary of the Identifiers, Names Used in the Study and the Number of Recommended Semesters of Subjects According to the Sample Curriculum part 1.
| Subject ID | Subject Name | Recommended Semester |
|---|---|---|
| 1 | Material science | 1 |
| 2 | Introduction to chemical engineering | 4 |
| 3 | Biochemistry | 3 |
| 4 | Electronics | 4 |
| 5 | Electronics laboratory practice | 4 |
| 6 | Process design I. | 4 |
| 7 | Physics I. | 1 |
| 8 | Physics (problem solving practice) | 1 |
| 9 | Physics II. | 2 |
| 10 | Physics lab. Pract. | 2 |
| 11 | Physical chemistry I. | 2 |
| 12 | Physical chemistry II. | 3 |
| 13 | Laboratory practice in physical chemistry | 3 |
| 14 | Problem solving practice in physical chemistry | 3 |
| 15 | Process control | 4 |
| 16 | Machine elements and presentation | 1 |
| 17 | Process dynamics and control | 4 |
| 18 | Introduction to law | 4 |
| 19 | Corrosion Basics | 4 |
| 20 | Comprehensive exam in chemistry | 5 |
| 21 | Chemical analysis | 3 |
| 22 | Chemical analysis laboratory practice | 4 |
| 23 | Economics | 1 |
| 24 | Mathematical analysis I. | 1 |
| 25 | Mathematical analysis I. Practice | 1 |
| 26 | Mathematical analysis II. | 2 |
| 27 | Mathematical analysis I. Practice | 2 |
| 28 | Quality assurance | 2 |
| 29 | Industrial quality management | 6 |
| 30 | Effective technical communication | 6 |
| 31 | Effective technical communication practice | 6 |
| 32 | IT tools for effective technical communication | 6 |
| 33 | Engineering thermodynamics | 3 |
| 34 | Technical thermodynamics | 3 |
Table A2.
Summary of the Identifiers, Names Used in the Study and the Number of Recommended Semesters of Subjects According to the Sample Curriculum part 2.
Table A2.
Summary of the Identifiers, Names Used in the Study and the Number of Recommended Semesters of Subjects According to the Sample Curriculum part 2.
| Subject ID | Subject Name | Recommended Semester |
|---|---|---|
| 35 | Flow and heat engineering machines (lab. pract) | 4 |
| 36 | Technical fluid mechanics | 3 |
| 37 | Basic energetics for unit operations | 2 |
| 38 | Unit operations A | 4 |
| 39 | Unit operations B | 4 |
| 40 | Numerical mathematics | 2 |
| 41 | Statistics | 2 |
| 42 | Basics of radiation | 1 |
| 43 | Organic chemistry I. | 2 |
| 44 | Organic chemistry II. | 3 |
| 45 | Laboratory practice on organic chemistry | 4 |
| 46 | Computer science for engineers I. | 1 |
| 47 | Modeling of chemical processes | 5 |
| 48 | Modeling of chemical processes (laboratory practice) | 5 |
| 49 | Design of technological systems | 6 |
| 50 | Design project I. | 6 |
| 51 | Design project II. | 7 |
| 52 | Transportphenomena | 3 |
| 53 | Chemical process engineering laboratory practice | 5 |
| 54 | Chemical Engineering BSc Field Practice | 7 |
| 55 | Chemical process safety | 6 |
| 56 | Selected chemical technologies | 5 |
| 57 | Selected chemical technologies (laboratory practice) | 5 |
| 58 | Process design II. | 5 |
| 59 | Process design III. | 6 |
| 60 | General and inorganic chemistry | 1 |
| 61 | Problem solving in general and inorganic chemistry I. | 1 |
| 62 | Problem solving in general and inorganic chemistry II. | 2 |
| 63 | Laboratory practice in general and inorganic chemistry | 2 |
| 64 | Hydrocarbons and petrochemical technologies | 5 |
References
- Aulck, L.; Nambi, D.; Velagapudi, N.; Blumenstock, J.; West, J. Mining University Registrar Records to Predict First-Year Undergraduate Attrition. In Proceedings of the 12th International Educational Data Mining Society, Montreal, QC, Canada, 2–5 July 2019. [Google Scholar]
- Von Hippel, P.T.; Hofflinger, A. The data revolution comes to higher education: Identifying students at risk of dropout in chile. J. High. Educ. Policy Manag. 2020, 43, 1–22. [Google Scholar] [CrossRef]
- Laufer, M.; Gorup, M. The invisible others: Stories of international doctoral student dropout. High. Educ. 2019, 78, 165–181. [Google Scholar] [CrossRef]
- Chen, L.; Chen, P.; Lin, Z. Artificial intelligence in education: A review. IEEE Access 2020, 8, 75264–75278. [Google Scholar] [CrossRef]
- Luan, H.; Geczy, P.; Lai, H.; Gobert, J.; Yang, S.J.; Ogata, H.; Baltes, J.; Guerra, R.; Li, P.; Tsai, C.C. Challenges and future directions of Big Data and Artificial Intelligence in education. Front. Psychol. 2020, 11. [Google Scholar] [CrossRef] [PubMed]
- Dutt, A.; Ismail, M.A.; Herawan, T. A systematic review on educational data mining. IEEE Access 2017, 5, 15991–16005. [Google Scholar] [CrossRef]
- Asif, R.; Merceron, A.; Ali, S.A.; Haider, N.G. Analyzing undergraduate students’ performance using educational data mining. Comput. Educ. 2017, 113, 177–194. [Google Scholar] [CrossRef]
- Hussain, M.; Zhu, W.; Zhang, W.; Abidi, S.M.R.; Ali, S. Using machine learning to predict student difficulties from learning session data. Artif. Intell. Rev. 2019, 52, 381–407. [Google Scholar] [CrossRef]
- Ameen, A.O.; Alarape, M.A.; Adewole, K.S. Students’ Academic Performance and Dropout Prediction. Malays. J. Comput. 2019, 4, 278–303. [Google Scholar] [CrossRef]
- Kemper, L.; Vorhoff, G.; Wigger, B.U. Predicting student dropout: A machine learning approach. Eur. J. High. Educ. 2020, 10, 28–47. [Google Scholar] [CrossRef]
- Imran, A.S.; Dalipi, F.; Kastrati, Z. Predicting Student Dropout in a MOOC: An Evaluation of a Deep Neural Network Model. In Proceedings of the 2019 5th International Conference on Computing and Artificial Intelligence, Bali, Indonesia, 19–22 April 2019; pp. 190–195. [Google Scholar]
- Espinoza, O.; González, L.E.; Castillo, D.; McGinn, N. Classification of Dropouts to Improve Student Re-Engagement: The Case of Chilean Secondary Opportunity Centers. Urban Educ. 2020. [Google Scholar] [CrossRef]
- Wang, P.; Li, Y.; Reddy, C.K. Machine learning for survival analysis: A survey. ACM Comput. Surv. (CSUR) 2019, 51, 1–36. [Google Scholar] [CrossRef]
- Prenkaj, B.; Velardi, P.; Stilo, G.; Distante, D.; Faralli, S. A survey of machine learning approaches for student dropout prediction in online courses. ACM Comput. Surv. (CSUR) 2020, 53, 1–34. [Google Scholar] [CrossRef]
- Chen, Y.; Johri, A.; Rangwala, H. Running out of stem: A comparative study across stem majors of college students at-risk of dropping out early. In Proceedings of the 8th International Conference on Learning Analytics and Knowledge, Sydney, NSW, Australia, 7–9 March 2018; pp. 270–279. [Google Scholar]
- Gitinabard, N.; Khoshnevisan, F.; Lynch, C.F.; Wang, E.Y. Your actions or your associates? Predicting certification and dropout in MOOCs with behavioral and social features. arXiv 2018, arXiv:1809.00052. [Google Scholar]
- Yang, D.; Sinha, T.; Adamson, D.; Rosé, C.P. Turn on, tune in, drop out: Anticipating student dropouts in massive open online courses. In Proceedings of the 2013 NIPS Data-Driven Education Workshop, Lake Tahoe, NV, USA, 9–10 December 2013; Volume 11, p. 14. [Google Scholar]
- Ameri, S.; Fard, M.J.; Chinnam, R.B.; Reddy, C.K. Survival analysis based framework for early prediction of student dropouts. In Proceedings of the 25th ACM International on Conference on Information and Knowledge Management, Indianapolis, IN, USA, 24–28 October 2016; pp. 903–912. [Google Scholar]
- Nagy, M.; Molontay, R. Predicting dropout in higher education based on secondary school performance. In Proceedings of the 2018 IEEE 22nd International Conference on Intelligent Engineering Systems (INES), Gran Canaria, Spain, 21–23 June 2018; pp. 000389–000394. [Google Scholar]
- Zhang, L.; Rangwala, H. Early identification of at-risk students using iterative logistic regression. In Proceedings of the International Conference on Artificial Intelligence in Education, London, UK, 27–30 June 2018; pp. 613–626. [Google Scholar]
- Platt, A.; Fan-Osuala, O.; Herfel, N. Understanding and Predicting Student Retention and Attrition in IT Undergraduates. In Proceedings of the 2019 on Computers and People Research Conference, Nashville, TN, USA, 20–22 June 2019; pp. 135–138. [Google Scholar]
- Suresh, A.; Rao, H.S.; Hegde, V. Academic Dashboard—Prediction of Institutional Student Dropout Numbers Using a Naïve Bayesian Algorithm. In Computing and Network Sustainability; Springer: Berlin/Heidelberg, Germany, 2017; pp. 73–82. [Google Scholar]
- Mduma, N.; Kalegele, K.; Machuve, D. A survey of machine learning approaches and techniques for student dropout prediction. Data Sci. J. 2019, 18, 14. [Google Scholar] [CrossRef] [Green Version]
- Kumar, M.; Singh, A.; Handa, D. Literature survey on educational dropout prediction. Int. J. Educ. Manag. Eng. 2017, 7, 8. [Google Scholar] [CrossRef] [Green Version]
- Simon, B.K.; Nair, A.P. Association rule mining to identify the student dropout in MOOCs. Int. Res. J. Eng. Technol. (IRJET) 2019, 6, 1223–1229. [Google Scholar]
- Rai, S. Student Dropout Risk Assessment in Undergraduate Course at Residential University. arXiv 2014, arXiv:1405.3727. [Google Scholar]
- Del Bonifro, F.; Gabbrielli, M.; Lisanti, G.; Zingaro, S.P. Student Dropout Prediction. In Proceedings of the International Conference on Artificial Intelligence in Education, Ifrane, Morocco, 6–10 July 2020; pp. 129–140. [Google Scholar]
- Kleinbaum, D.G.; Klein, M. Survival Analysis; Springer: Berlin/Heidelberg, Germany, 2010; Volume 3. [Google Scholar]
- Fournier-Viger, P.; Gomariz, A.; Gueniche, T.; Soltani, A.; Wu, C.W.; Tseng, V.S. SPMF: A Java open-source pattern mining library. J. Mach. Learn. Res. 2014, 15, 3389–3393. [Google Scholar]
- Standards and Guidelines for Quality Assurance in the European Higher Education Area. 2015. Available online: https://https://enqa.eu/index.php/home/esg/ (accessed on 15 February 2021).
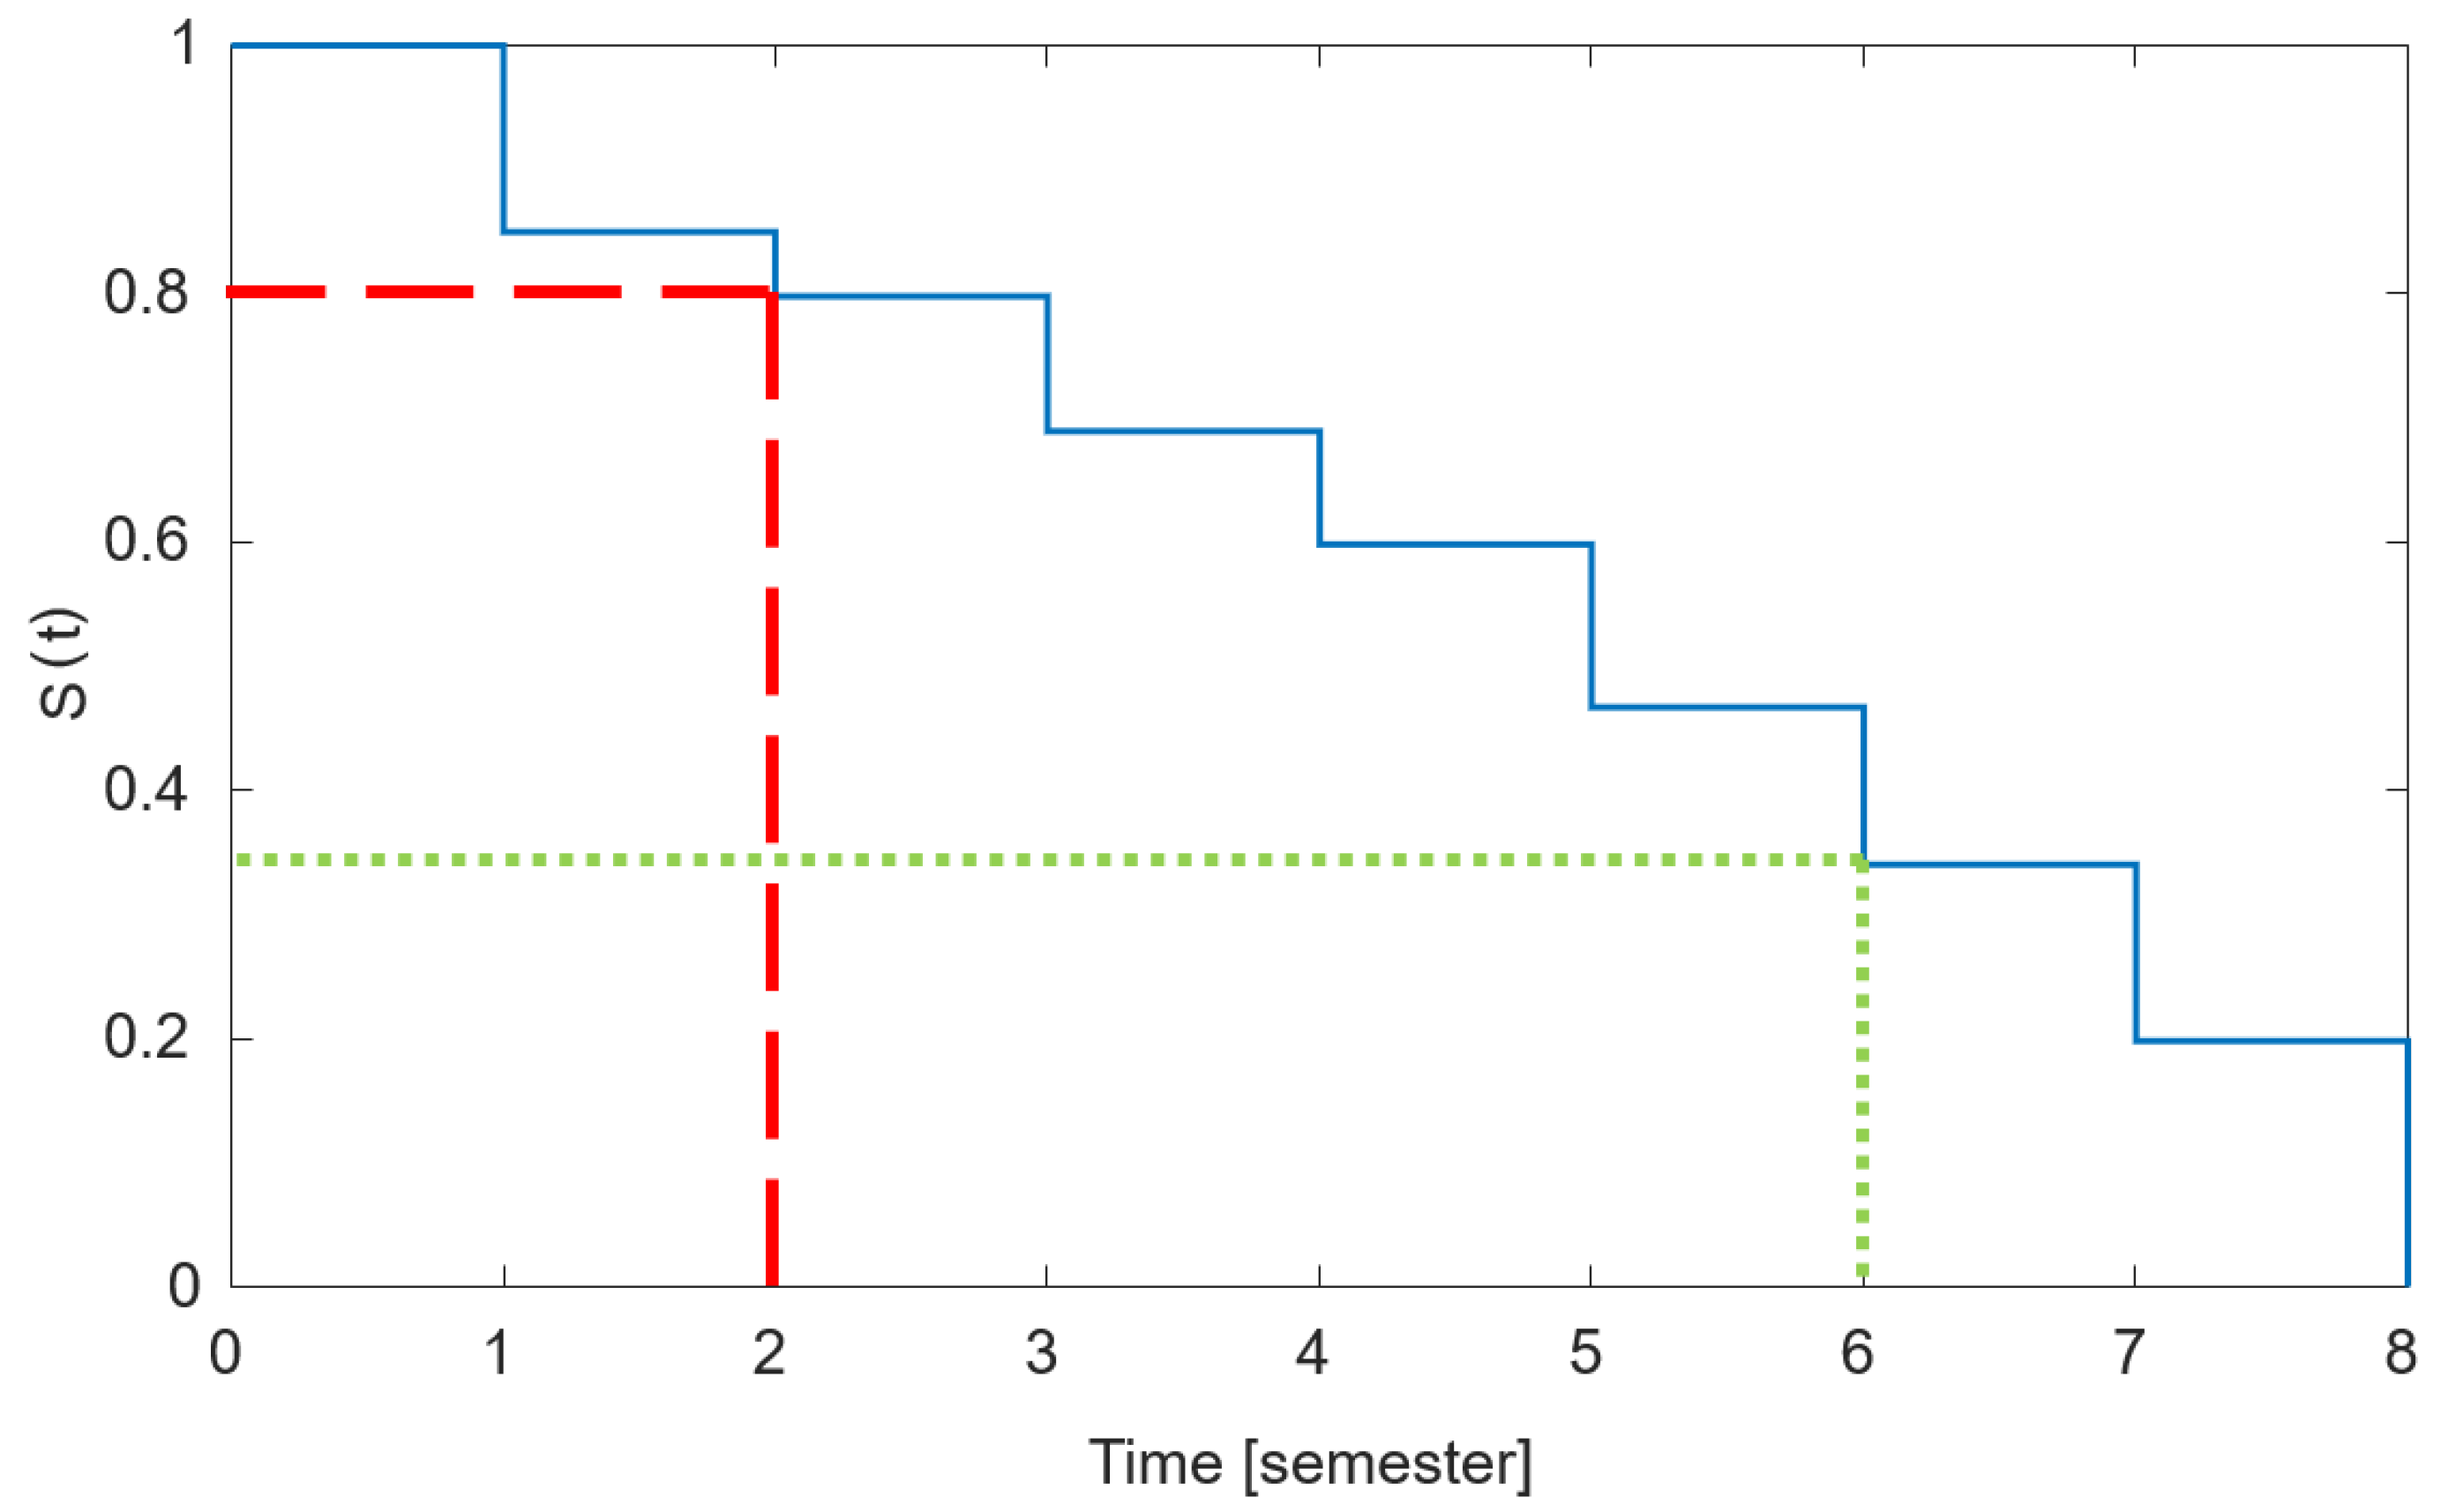
Figure 1.
Example of the Kaplan–Meier empirical survival function. In this example, the probability that the event (e.g., the dropout) will occur after the second time instance (e.g., semester) is , while the probability that the event will occur later than the sixth time instance is .
Figure 1.
Example of the Kaplan–Meier empirical survival function. In this example, the probability that the event (e.g., the dropout) will occur after the second time instance (e.g., semester) is , while the probability that the event will occur later than the sixth time instance is .

Figure 2.
A Gantt chart illustrating the missing subjects of students which have been not performed until it was advised by the sample curriculum. The semesters in which the subject should have been already completed are indicated by dark blue.
Figure 2.
A Gantt chart illustrating the missing subjects of students which have been not performed until it was advised by the sample curriculum. The semesters in which the subject should have been already completed are indicated by dark blue.

Figure 3.
The empirical distribution by the Kaplan–Meier method (KM) (red) and the Cumulative Incidence Curve of non-graduate students (blue). Since the competitive risk of graduation appears only from the 7th semester (the length of the sample curriculum), it is expected that the two functions will be different from this semester. The difference determines the graduated students.

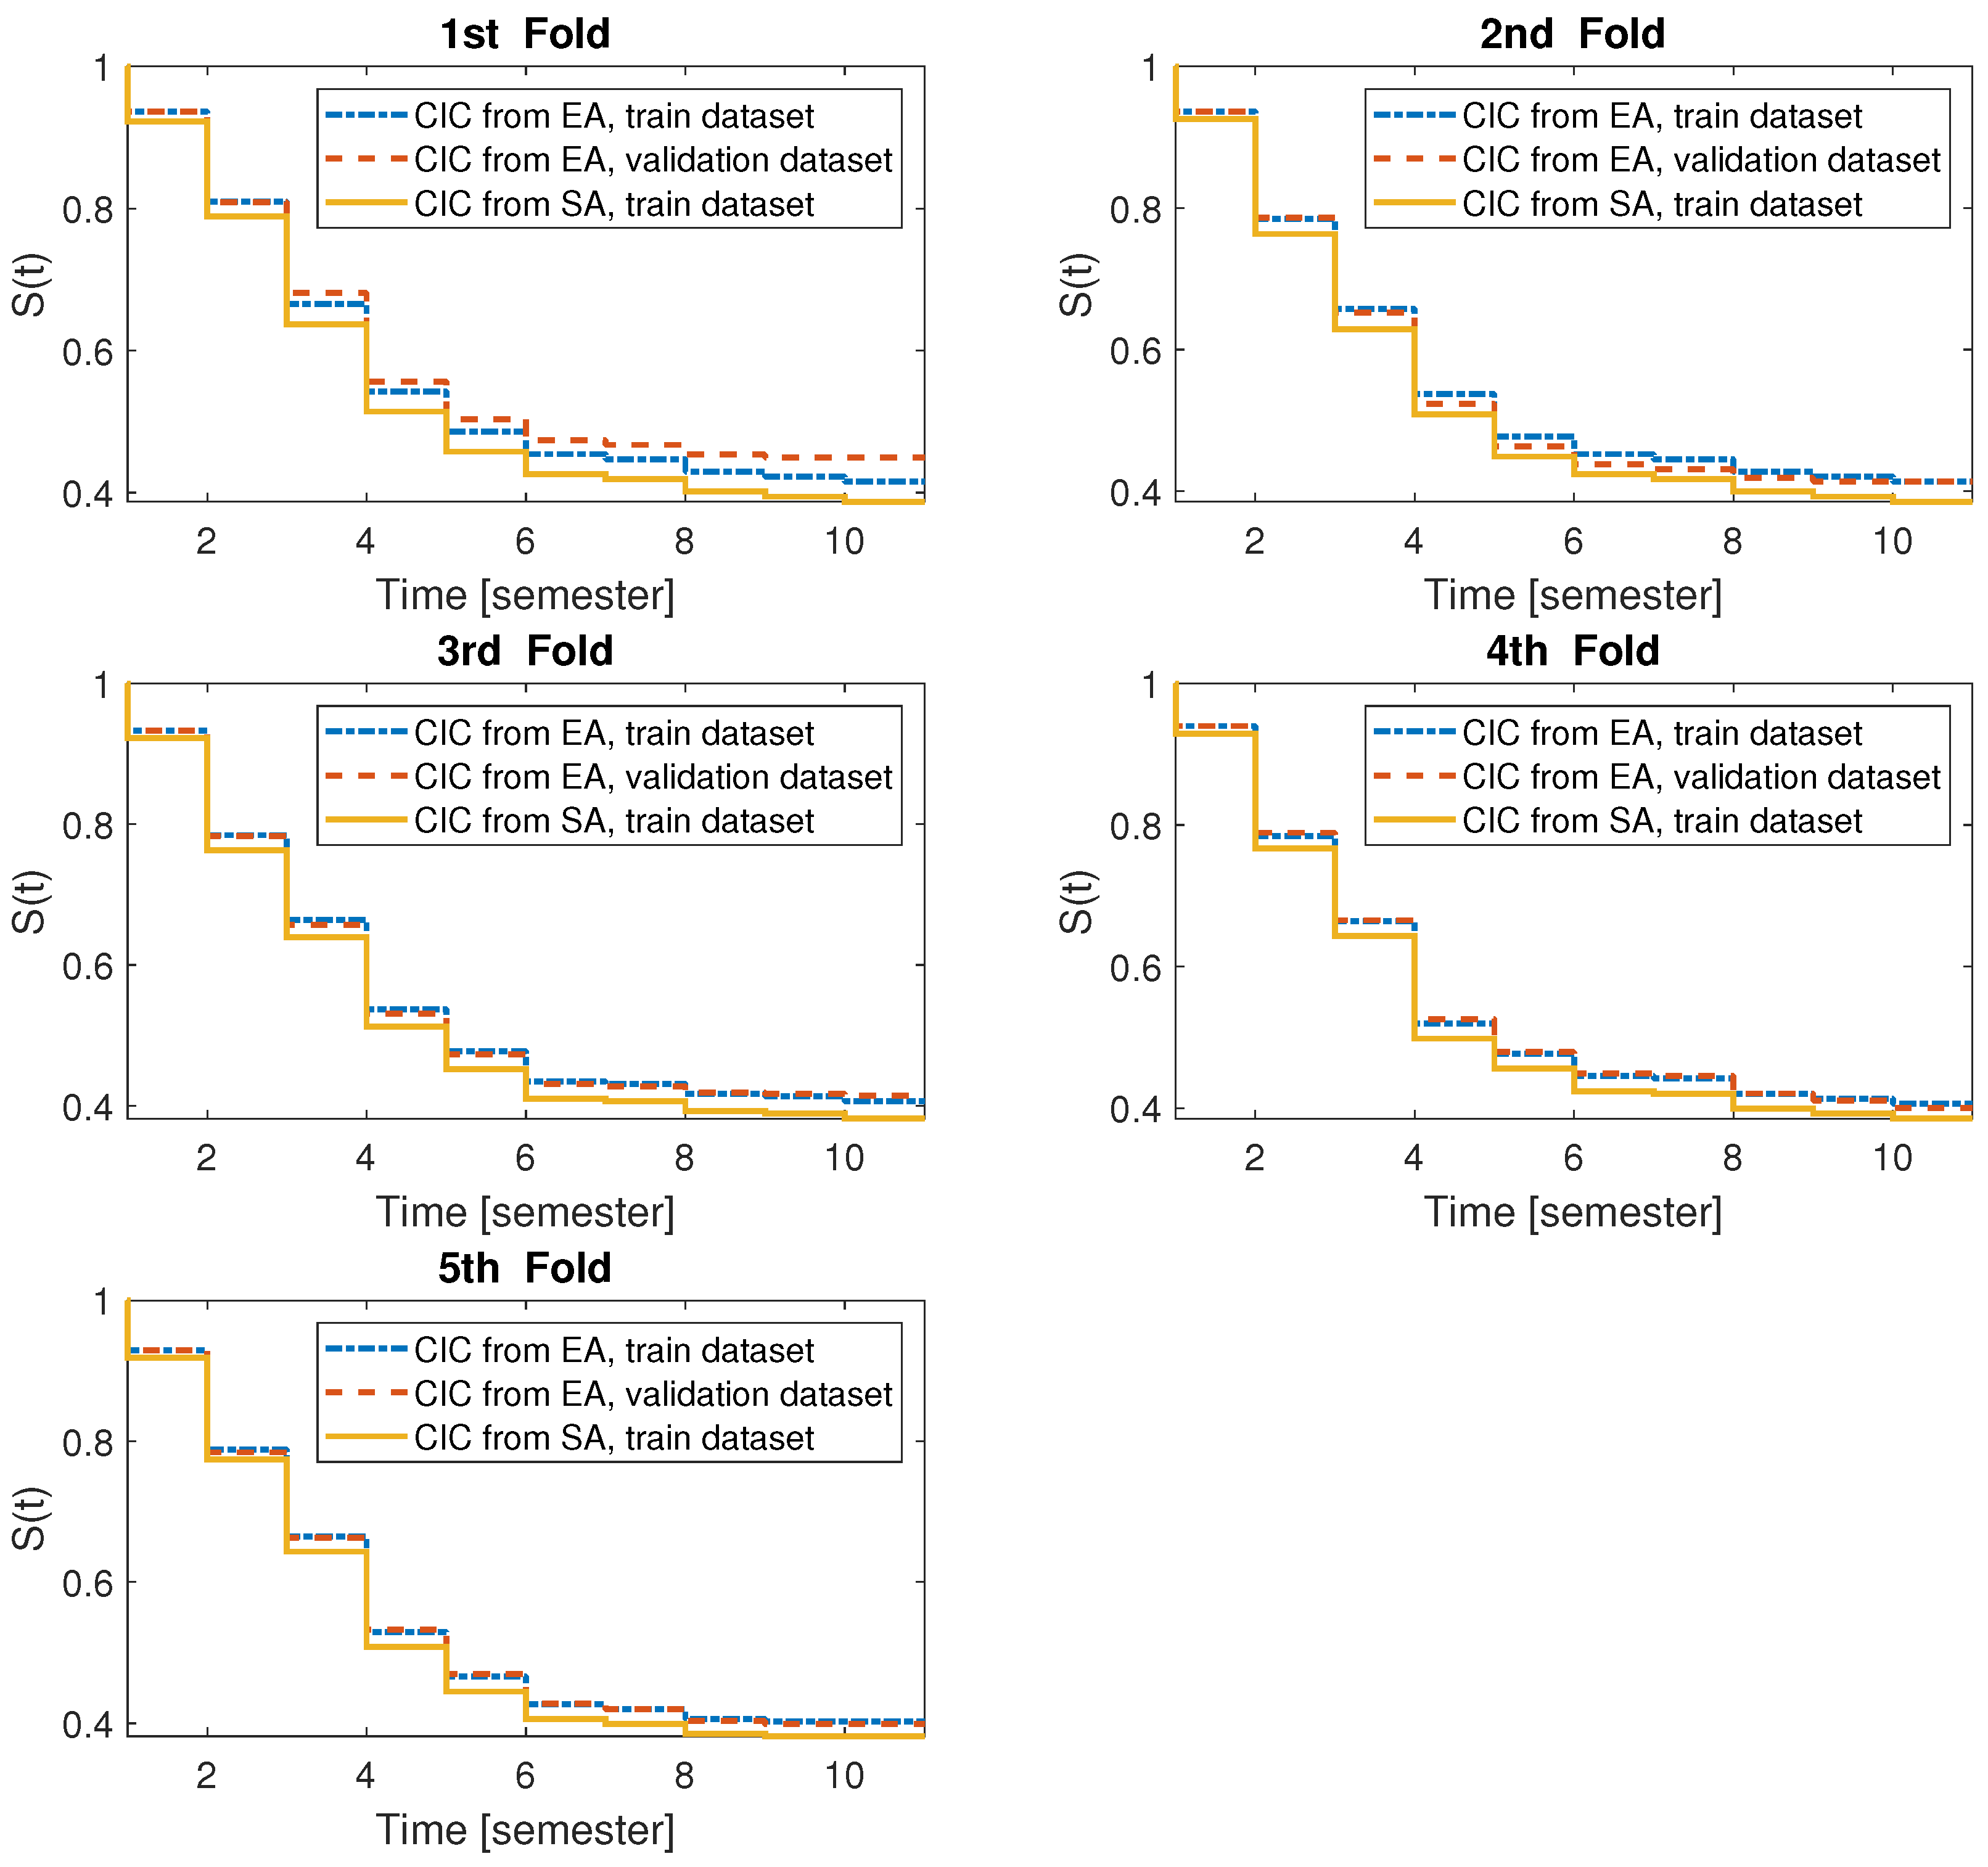
Figure 4.
The Cumulative Incidence Curve (CIC) formed from Event Analysis (EA) by association rules (training dataset—blue; validation dataset—red) and Survival Analysis (SA) (green) for non-graduate students. The functions illustrates well that the proposed methodology is able to predict the dropout of a student.

Figure 5.
Cumulative Incidence Curves formed from the Naive Bayes classifier (validation dataset—blue) and survival analysis (test dataset—green) for non-graduate students in the case of one-fold change. The functions illustrates well, that the Naive Bayes classifier can poorly predict the dropout of a student.

Table 1.
A sample for the student log file which integrates the student-specific data and the sample curriculum.
Table 1.
A sample for the student log file which integrates the student-specific data and the sample curriculum.
| Student ID | Graduated or Dropped Out | Subject ID | Subject Is Completed or Failed | Attempted Semester | Recommended Semester |
|---|---|---|---|---|---|
| 1 | graduated | 1 | completed | 1 | 1 |
| 1 | graduated | 2 | failed | 2 | 2 |
| 1 | graduated | 3 | failed | 2 | 2 |
| 1 | graduated | 2 | failed | 3 | 2 |
| 1 | graduated | 3 | completed | 3 | 2 |
| 1 | graduated | 2 | completed | 4 | 2 |
| 2 | dropped out | 1 | failed | 1 | 1 |
| 2 | dropped out | 4 | failed | 1 | 1 |
| 2 | dropped out | 5 | failed | 1 | 1 |
| 2 | dropped out | 6 | failed | 1 | 1 |
| 2 | dropped out | 2 | failed | 2 | 2 |
| 2 | dropped out | 3 | failed | 2 | 2 |
| 3 | graduated | 4 | failed | 1 | 1 |
| 3 | graduated | 2 | completed | 2 | 2 |
| 3 | graduated | 3 | failed | 2 | 2 |
| 3 | graduated | 4 | completed | 2 | 1 |
| 3 | graduated | 3 | completed | 3 | 2 |
| 3 | graduated | 7 | failed | 3 | 3 |
| 3 | graduated | 7 | failed | 4 | 3 |
| 3 | graduated | 7 | failed | 5 | 3 |
| 3 | graduated | 7 | completed | 6 | 3 |
Table 2.
Calculation of Cumulative Incidence Curves for dropped out students.
| Semester | |||||||
|---|---|---|---|---|---|---|---|
| 1 | 362 | 27 | 0 | 0.0746 | 1.0000 | 0.0746 | 0.0746 |
| 2 | 335 | 54 | 0 | 0.1612 | 0.9254 | 0.1492 | 0.2238 |
| 3 | 281 | 47 | 0 | 0.1673 | 0.7762 | 0.1298 | 0.3536 |
| 4 | 234 | 46 | 0 | 0.1966 | 0.6464 | 0.1271 | 0.4807 |
| 5 | 188 | 20 | 0 | 0.1064 | 0.5193 | 0.0552 | 0.5359 |
| 6 | 168 | 12 | 0 | 0.0714 | 0.4641 | 0.0331 | 0.5691 |
| 7 | 156 | 2 | 40 | 0.0128 | 0.4309 | 0.0055 | 0.5746 |
| 8 | 114 | 6 | 39 | 0.0526 | 0.3149 | 0.0166 | 0.5912 |
| 9 | 69 | 2 | 30 | 0.0290 | 0.1906 | 0.0055 | 0.5967 |
| 10 | 37 | 2 | 20 | 0.0541 | 0.1022 | 0.0055 | 0.6022 |
| 11 | 15 | 4 | 3 | 0.2667 | 0.0414 | 0.0110 | 0.6133 |
Table 3.
The critical dropout rules of given semesters. It shows the pattern of uncompleted subjects which should definitely be avoided by active students.
Table 3.
The critical dropout rules of given semesters. It shows the pattern of uncompleted subjects which should definitely be avoided by active students.
| Rule ID | Rule Length | Support (%) | Confidence (%) | Rule ID | Rule Length | Support (%) | Confidence (%) |
|---|---|---|---|---|---|---|---|
| 1st Semester | 2nd Semester | ||||||
| 222 | 7 | 0.0353 | 0.5263 | 900 | 13 | 0.0498 | 0.5417 |
| 189 | 8 | 0.0318 | 0.5294 | 966 | 11 | 0.0728 | 0.5429 |
| 283 | 3 | 0.0459 | 0.5417 | 971 | 10 | 0.0728 | 0.5429 |
| 256 | 6 | 0.0424 | 0.5455 | 964 | 13 | 0.0383 | 0.5556 |
| 191 | 7 | 0.0389 | 0.5500 | 965 | 12 | 0.0728 | 0.5588 |
| 3rd Semester | 4th Semester | ||||||
| 60 | 23 | 0.0370 | 0.8889 | 10300 | 23 | 0.0608 | 0.9167 |
| 59 | 23 | 0.0417 | 0.9000 | 4110 | 23 | 0.0663 | 0.9231 |
| 46 | 23 | 0.0463 | 0.9091 | 4443 | 22 | 0.0663 | 0.9231 |
| 54 | 23 | 0.0463 | 0.9091 | 5003 | 21 | 0.0663 | 0.9231 |
| 61 | 22 | 0.0556 | 0.9231 | 5020 | 24 | 0.0663 | 0.9231 |
| 5th Semester | 6th Semester | ||||||
| 769 | 26 | 0.0552 | 0.8889 | 3508 | 17 | 0.0469 | 0.8571 |
| 1080 | 26 | 0.0552 | 0.8889 | 1532 | 20 | 0.0547 | 0.8750 |
| 467 | 23 | 0.0621 | 0.9000 | 2323 | 20 | 0.0547 | 0.8750 |
| 503 | 23 | 0.0621 | 0.9000 | 3550 | 16 | 0.0547 | 0.8750 |
| 2249 | 25 | 0.0621 | 0.9000 | 2324 | 19 | 0.0625 | 0.8889 |
| 7th Semester | 8th Semester | ||||||
| 723 | 11 | 0.0086 | 0.2500 | 77 | 11 | 0.0370 | 0.6000 |
| 727 | 7 | 0.0086 | 0.2500 | 3 | 24 | 0.0247 | 0.6667 |
| 794 | 16 | 0.0086 | 0.2500 | 31 | 10 | 0.0247 | 0.6667 |
| 810 | 16 | 0.0086 | 0.2500 | 33 | 7 | 0.0247 | 0.6667 |
| 1053 | 13 | 0.0086 | 0.2500 | 22 | 14 | 0.0370 | 0.7500 |
| 9th Semester | 10th Semester | ||||||
| 5 | 15 | 0.0208 | 0.5000 | 15 | 4 | 0.0455 | 0.5000 |
| 6 | 4 | 0.0208 | 0.5000 | 23 | 1 | 0.0909 | 0.5000 |
| 13 | 14 | 0.0208 | 0.5000 | 24 | 2 | 0.0909 | 0.5000 |
| 18 | 11 | 0.0208 | 0.5000 | 18 | 2 | 0.0909 | 0.6667 |
| 21 | 12 | 0.0208 | 0.5000 | 19 | 3 | 0.0909 | 0.6667 |
Table 4.
Grouping of critical objects by their names according to the subject identifiers in Appendix A.
Table 4.
Grouping of critical objects by their names according to the subject identifiers in Appendix A.
| Semester | Subject ID | Name of Subject | Semester | Subject ID | Name of Subject |
|---|---|---|---|---|---|
| 1 | 7 | Physics I. | 6 | 2 | Introduction to chemical engineering |
| 1 | 46 | Computer science for engineers I. | 6 | 47 | Modelling of chemical processes |
| 1 | 60 | General and inorganic chemistry | 6 | 56 | Selected chemical technologies |
| 1 | 24 | Mathematical analysis I. | 6 | 59 | Process design III. |
| 2 | 11 | Physical chemistry I. | 6 | 64 | Hydrocarbons and petrochemical technologies |
| 2 | 26 | Mathematical analysis II. | 8 | 20 | Comprehensive exam in chemistry |
| 2 | 40 | Numerical mathematics | 8 | 48 | Modelling of chemical processes (laboratory practice) |
| 2 | 62 | Problem solving in general and inorganic chemistry II. | 8 | 49 | Design of technological systems |
| 3 | 3 | Biochemistry | 8 | 51 | Design project II. |
| 3 | 36 | Technical fluid mechanics | 8 | 53 | Chemical process engineering laboratory practice |
| 3 | 52 | Transportphenomena | 8 | 59 | Process design III. |
| 4 | 2 | Introduction to chemical engineering | 10 | 20 | Comprehensive exam in chemistry |
| 4 | 15 | Process control | 10 | 35 | Flow and heat engineering machines (lab. pract) |
| 4 | 17 | Process dynamics and control | 10 | 51 | Chemical process engineering laboratory practice |
| 5 | 3 | Biochemistry | 10 | 53 | Chemical process engineering laboratory practice |
| 5 | 15 | Process control | 10 | 59 | Process design III. |
| 5 | 20 | Comprehensive exam in chemistry | 11 | 20 | Comprehensive exam in chemistry |
| 5 | 45 | Laboratory practice on organic chemistry | 11 | 35 | Flow and heat engineering machines (lab. pract) |
| 5 | 52 | Transportphenomena | 11 | 52 | Transportphenomena |
Table 5.
Mean value of absolute errors of the proposed method and the Naive Bayes classifier. It can be considered that the proposed method outperforms the Naive Bayes classifier.
Table 5.
Mean value of absolute errors of the proposed method and the Naive Bayes classifier. It can be considered that the proposed method outperforms the Naive Bayes classifier.
| Method | 1st Fold | 2nd Fold | 3rd Fold | 4th Fold | 5th Fold |
|---|---|---|---|---|---|
| Naive Bayes | 0.4081 | 0.4052 | 0.3998 | 0.4268 | 0.3988 |
| Proposed Method | 0.0411 | 0.0176 | 0.0207 | 0.0188 | 0.0168 |
Publisher’s Note: MDPI stays neutral with regard to jurisdictional claims in published maps and institutional affiliations. |
© 2021 by the authors. Licensee MDPI, Basel, Switzerland. This article is an open access article distributed under the terms and conditions of the Creative Commons Attribution (CC BY) license (http://creativecommons.org/licenses/by/4.0/).
Share and Cite
MDPI and ACS Style
Csalódi, R.; Abonyi, J. Integrated Survival Analysis and Frequent Pattern Mining for Course Failure-Based Prediction of Student Dropout. Mathematics 2021, 9, 463. https://doi.org/10.3390/math9050463
AMA Style
Csalódi R, Abonyi J. Integrated Survival Analysis and Frequent Pattern Mining for Course Failure-Based Prediction of Student Dropout. Mathematics. 2021; 9(5):463. https://doi.org/10.3390/math9050463
Chicago/Turabian StyleCsalódi, Róbert, and János Abonyi. 2021. "Integrated Survival Analysis and Frequent Pattern Mining for Course Failure-Based Prediction of Student Dropout" Mathematics 9, no. 5: 463. https://doi.org/10.3390/math9050463
Note that from the first issue of 2016, this journal uses article numbers instead of page numbers. See further details here.