
Glucose Oxidase Captured into Electropolymerized p-Coumaric Acid towards the Development of a Glucose Biosensor


Chemistry Department, Universidad Autónoma Metropolitana Unidad Iztapalapa (UAM-I), Av. San Rafael Atlixco 186, Leyes de Reforma 1ra Secc., Ciudad de Mexico 09340, Mexico
*
Author to whom correspondence should be addressed.
Chemosensors 2023, 11(6), 345; https://doi.org/10.3390/chemosensors11060345
Submission received: 20 April 2023
/
Revised: 25 May 2023
/
Accepted: 8 June 2023
/
Published: 14 June 2023
(This article belongs to the Special Issue Advanced Glucose Biosensors)
Abstract
:An electrochemical biosensor based on the immobilization of glucose oxidase into an electropolymerized p-coumaric acid membrane on a Pt electrode has been developed and evaluated for glucose detection in the range of 1 to 30 mM. The glucose biosensor exhibits a sensitivity of 36.96 mA/mMcm2, a LOD of 0.66 mM, and a LOQ of 2.18 mM. The biosensing membrane was electropolymerized by cyclic voltammetry in 100 mM phosphates pH 7.00 and 3% ethanol containing glucose oxidase and p-coumaric acid. The glucose biosensors’ stability, repeatability, reproducibility, and selectivity were estimated. The biosensing membrane shows permselective properties and antifouling effects. The applicability of the developed glucose biosensor was evaluated in the presence of 20 mg/mL proteins, and any signal associated with biofouling was observed. The glucose biosensors were employed for the determination of the glucose concentration in three commercial beverages.
1. Introduction
Diabetes mellitus is a disease produced by several factors involving genetic, as well as lifestyle, factors. It can cause body dysfunction, such as renal failure and neuropathy, as well as cardiovascular diseases [1,2]. The International Diabetes Federation (DIF) has estimated that in 2021, around 10.5% of the world’s population lived with diabetes, and by 2045, the population with the disease will be 12.2% [3]. Nowadays, diabetes mellitus cannot be cure with medical treatment; however, it could be controlled, reducing the medical complications. The treatment includes diabetes education, diet, medication, and glucose monitoring [4]. The glucose monitoring provides information to the physician to evaluate human body conditions and provide the proper treatment. Currently, glucose monitoring is achieved by fingertip blood sampling utilizing a self-monitoring blood glucometer or by the use of implantable continuous glucose monitoring (CGM) biosensors. The biomedical devices employ a miniaturized potentiostat and a glucose biosensor. In the biomedical field, the expansion of biosensors is the objective of several investigations; the main goal is the development of biosensors with high sensitivity, selectivity, repeatability, reproducibility, storage stability, and biocompatibility. To improve the current glucose biosensors, the use of different materials as transducers, redox mediators, and immobilization methods had been explored.
For the immobilization of recognition elements, different methods have been used. One of these methods is the use of polymers, which possess the capability of providing stable biosensing membranes that retain macromolecules, maintaining their biological properties [5]. The use of polymers for immobilization includes different techniques, such as deep coating, drop casting, and spin coating. Usually, once the polymer covers the electrode surface, the enzymes or biorecognition elements are immobilized by adsorption onto the polymeric membrane, covalent binding, encapsulation, or entrapment [6,7,8,9,10]. Another polymer formation and deposition technique is the electropolymerization of conductive or non-conductive polymers. Electropolymerization has the advantage of covering electrodes of any shape and size. The thickness of the polymer can be controlled either by the number of cycles at the proper scan rate or by the time of the suitable potential or proper current applied for the electropolymerization. In the case of conductive polymers, such as poly-pyrrole (PPy), poly-aniline (PANI), and poly (3,4-ethylenedioxythiophene) polystyrene sulfonate (PEDOT:PSS), the foundation of conductive membranes helps with the electron movements during the charge transfer in the oxidation or reduction of the analyte at the detection step [9,11,12,13,14]. In the case of non-conductive polymers, the polymeric films present high resistivity. The membranes are typically thinner due to the self-limited growth of these materials, compared to conductive polymeric membranes. Usually, the films based on non-conductive polymers are permselective, which is a useful property in the construction of biosensors, preventing interfering species that could contaminate biosensors’ response to a specific analyte [15]. The non-conductive polymers phenol and its derivates, as well as phenylenediamine and overoxidized polypyrrole, had been used for the development of biosensors [16,17,18,19,20]; due to their thickness, the analytes reach the electrode surface fast, producing a quick biosensor response, which is a requirement for the batch, as well as implantable biosensors (CGMs) [4,21]. The electropolymerization allows the incorporation of the recognition agent (enzymes) at the same time that the polymer layer is forming; thus, the biosensing membranes can be achieved in one step, maintaining the polymer properties [8,11,17,22,23].
In the development of polymeric membranes for biosensor construction, the evaluation of other monomers that comply with the biosensing requirements needs to be explored. In this context, the electropolymerization of natural phenolic antioxidants is currently being investigated [24,25,26,27]. Our research group explores the electropolymerization of 4-hydroxy-cinnamic acid, commonly known as p-coumaric acid (p-CA), in developing electrochemical sensors onto carbon paste electrodes [26].
The p-CA is a derivate of cinnamic acid, which can be found in fruits, vegetables, and cereals, and thus is regularly present in the human diet. The p-CA possesses anti-inflammatory, antibacterial, and antioxidant properties; hence, it has been used in the pharmaceutical, alimentary, and chemical industries [28,29,30,31]. It was found that p-CA can be electropolymerized, its oxidation is pH-dependent, and it can form a polymeric film covering the electrode surface [32]. The p-CA polymer has been used for electrode (glassy carbon and carbon paste) modification for heavy metals determination and the amino acid (L-cysteine) [25,26,33].
Considering the current requirements in the growth of the glucose biosensors field and the advantages of the use of non-conductive polymers, we present the construction and evaluation of glucose biosensors based on a polymeric membrane constructed in one step by electropolymerization through cyclic voltammetry of p-coumaric acid and glucose oxidase (GOx) onto a Pt electrode.
2. Materials and Methods
Mono-basic sodium phosphate, mono-acid potassium phosphate, sodium chloride, glucose oxidase (GOx) from Aspergillus Niger type X-S, protein standard (80 mg/mL), D-glucose, uric acid, acetaminophen, ascorbic acid, p-coumaric acid, bovine serum albumin (BSA), hydrogen peroxide 30%, sulfuric acid, and sodium hydroxide were purchased from Sigma-Aldrich (St. Louis, MO, USA). Absolute ethanol was acquired from J.T. Baker. Real samples (juice and milk samples) were purchased from a local supermarket. All chemicals were analytical grade, and all chemicals, as well as real samples, were used without further purification. Aqueous solutions throughout the experiments were prepared with ultra-pure deionized water (DI) 18.2 MΩ cm−1.
Electrochemical measurements were performed in a potentiostat BAS 100B employing a 3-electrode electrochemical cell. The working electrode was a Pt disk 1.6 mm in diameter, the used reference electrode was a saturated Ag/AgCl, and a Pt wire was used as an auxiliary electrode.
2.1. Biosensor Membrane Fabrication
Before bio-membrane electropolymerization, the Pt disk was electrochemically cleaned through cyclic voltammetry (CV), and the electrodes were cycled from −325 to 1250 mV vs. Ag/AgCl in H2SO4 100 mM until a stable and well-defined poly-crystalline Pt signal was obtained. The Pt electroactive area was calculated from the voltammogram signal according to [34,35].
Once the Pt electrode was electrochemically clean, it was washed with DI water. Subsequently, the biosensing membrane was fabricated in a 2.5 mM p-CA prepared in 97% phosphate buffer pH 7.0 and 3% of ethanol solution (PB/et) containing GOx (50 U/mL). Cyclic voltammetry was performed from −325 to 1250 mV vs. Ag/AgCl at a scan rate of 20 mV/s during 20 cycles. The following step was to wash the biosensor with DI water to remove the monomer and enzyme that were not attached to the biosensing membrane. To stabilize the biosensor membrane, a constant potential (600 mV vs. Ag/AgCl) for 15 min was applied to the glucose biosensor in PB solution. After biosensor stabilization, glucose calibrations were performed by amperometry at 600 mV, with glucose additions in the range from 1 to 30 mM covering the hypo- and hyperglycemia levels.
2.2. Biosensor Electro-Analytical Evaluation and Characterization
The potential for detecting the oxidation of H2O2 produced by the enzymatic reaction was the same used for additions of hydrogen peroxide employing an electrode coated only with a membrane of poly-p-coumaric acid electropolymerized under similar conditions to the biosensing membrane lacking the GOx enzyme.
The analytical parameters of the biosensors were obtained from glucose calibrations performed at the constant potential of 600 mV vs. Ag/AgCl.
Biosensor sensitivity was obtained from calibrations, glucose additions were carried out in the range from 1 to 30 mM, and the current density was obtained from the current and Pt area for each prepared biosensor. The Pt area for each prepared glucose biosensor was obtained as described by [34,35].
Selectivity was performed for ascorbic acid, uric acid, and acetaminophen at different concentrations, including the low, normal, and high levels of these analytes in blood. The electrochemical response was compared with the biosensor response to 5 mM glucose. The selectivity was calculated as the percentage of the current generated by 5 mM glucose plus the endogenous spice and compared to the glucose response.
The stability of the glucose biosensors was evaluated under four different criteria: (a) stability upon consecutive glucose calibration (stability of the biosensor sensitivity–repeatability), (b) stability of a glucose response for a given concentration during a given time, (c) stability of the biosensor sensitivity at different days, (d) stability of the biosensor membrane for a given storage period.
The glucose biosensors’ reproducibility was evaluated by preparing and testing biosensors under the same experimental conditions (independent experiments). The sensitivity of the glucose biosensors is estimated.
Glucose biosensors were calibrated in the presence of proteins at similar conditions in interstitial fluid (20 mg/mL) [36]. The biosensors also were employed to determine the glucose concentration in commercial juices and milk samples.
3. Results and Discussion
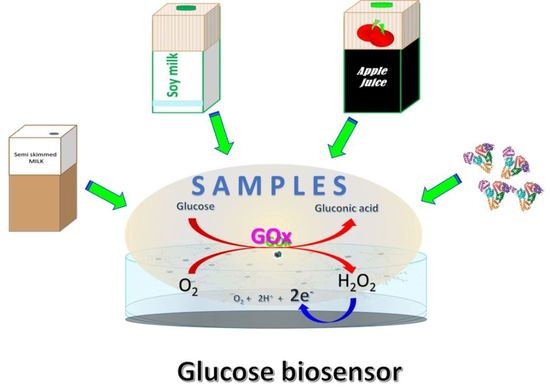
Before each biosensor preparation, the Pt disk electrode was electrochemically cleaned by cyclic voltammetry in a 100 mM H2SO4 solution; a typical voltammogram for Pt in H2SO4 is shown in Figure 1A. The Pt, real surface area, was determined as suggested by [34,35]. After the cleaning process, the electropolymerization of p-CA was performed in 2.5 mM p-coumaric acid prepared in a PB/et solution. The potential was cycled from −325 mV to 1250 mV vs. Ag/AgCl, during 20 cycles at a scan rate of 20 mV/s. Afterward, the electrode was thoroughly washed with DI water to remove the unattached monomer. To confirm the presence of the polymeric membrane on the top of the Pt electrode surface, cyclic voltammetry in PB at a scan rate of 50 mV/s (one cycle) was performed; a typical voltammogram for a Pt electrode before and after polymerization in PB solutions is shown in Figure 1B. Employing the same electrochemical system, cyclic voltammetry for H2O2 at different concentrations was carried out. The cyclic voltammograms showed that the H2O2 oxidation starts to take place at 350 mV, where the current starts to increase and remains constant from 400 mV and up to 900 mV; thus, the H2O2 can be detected at 350 mV. However, at this potential, the sensitivity, as well as linear range, is low. An option to extend the sensitivity and linear range is to apply a more positive potential. Under the experimental conditions, a potential from 500 to 800 mV could be applied. Nevertheless, endogenous species can easily be oxidized as the applied potential increases. Considering this, the electro-analytical evaluation of the biosensor was performed at 600 mV vs. Ag/AgCl. Figure 1C shows the voltammograms for different H2O2 concentrations. As is observed in Figure 1C, H2O2 can diffuse through the polymeric membrane, reach the Pt electrode surface, and be electrochemically oxidized. The glucose electrochemical detection at the biosensor is carried out by the H2O2 oxidation at the Pt electrode surface. The hydrogen peroxide is generated by the enzymatic reaction, as is shown in Scheme 1.
3.1. Biosensing Membrane Electropolymerization
The glucose biosensors were prepared by the electropolymerization of p-CA in the presence of GOx (poly(p-CA-GOx)) in PB/et, onto a Pt disk electrode. Under this experimental condition (pH = 7.00), the p-CA molecule (pKa1 = 4.65 and pKa2 = 9.92) [37] is partially protonated. The electropolymerization was performed through cyclic voltammetry. The process starts from cathodic to anodic potential, and the typical electropolymerization results are shown in Figure 2A. As can be observed, at the forward scan in the first cycle, an oxidation signal is detected at 750 mV (I OX). The signal is attributed to the oxidation of the phenolic group of the semi-protonated p-CA molecule, and at the backward scan, a reduction signal around 200 mV (II RED) is observed. The electrochemical signal can be attributed to the reduction of the olefinic group, which is favored by the presence of ethanol and the Pt surface, as is mentioned at [32,38]. At the second and successive scans, the first oxidation peak disappeared, while the reduction signal (II RED) was preserved. At the second cycle, 2 new oxidation signals appeared around 450 mV (II OX). The signal is due to the reversible redox process from the olefinic group in the p-CA, and 900 mV (I′ OX) of the signal is due to the shift to a more positive potential of the oxidation of the phenolic group in the p-CA, in which the molecule is partially protonated. The p-CA molecule is incorporated in the surface of the electrode to form the polymeric membrane. The phenolic oxidation originates phenolic free radicals that form the dimers, trimers, and tetramers that are coupled to form a structure as crown ether. As mentioned by Janeiro [32], the GOx can be incorporated into the polymeric membrane into the crown structure. The currents for both oxidation signals rise as the number of cycles increases. The behavior found is different from the performance described by [25,26]. In those cases, the first oxidation signal is maintained, with a decrease of the current; at the second cycle, two new oxidation signals were observed at a more negative potential. In those cases, the current increases until it remains constant after several cycles. The difference in the electropolymerization behavior could be due to the employed substrate (Pt electrode) and pH solutions, and the presence of ethanol in the supporting electrolyte (PB/et), but not due to the GOx presence. This is confirmed by the electropolymerization behavior found over the Pt electrode, which was similar with and without enzyme in the employed electropolymerization solution. Figure 2B shows the results described above. The fact of preparing the electropolymerization solution in 3% of ethanol could help with the incorporation of more monomer and GOx units into the biosensing membrane. Figure 2C shows the electropolymerization of p-CA in the presence of GOx in phosphate buffer media without ethanol. To verify the presence of the biosensing membrane on the surface of the Pt electrode (Pt/poly(p-CA-GOx)), cyclic voltammetry in phosphate buffer was recorded. The results in Figure 2D show the voltammogram for the Pt electrode before (bare) and after electropolymerization (Pt/poly(p-CA-GOx) of the biosensing membrane.
3.2. Glucose Biosensor Evaluation
After the electropolymerization step, the biosensor was carefully washed with DI water to remove the unattached enzyme and monomer. To stabilize the biosensing membrane, amperometry in PB solution at 600 mV was performed until a stable current was obtained (15 min approximately). Once the current remained constant, the buffer solution was replaced with new solutions, and amperometry was carried out under the same parameters (600 mV vs. Ag/AgCl). Once the current was stable, glucose was added into the electrochemical cell from the range from 1 to 30 mM; the rise in the current is due to electrochemical oxidation of H2O2 produced by the enzymatic reaction, and it is directly correlated to the glucose concentrations in the testing sample. Figure 3A shows the glucose calibration plot for five successive glucose calibrations at one glucose biosensor exhibiting stability of the sensitivity signal. From the data of the calibration plot, two linear zones can be observed, the first zone at low glucose concentrations from 1 to 5 mM and the second zone for 5 mM to 30 mM, covering most of the clinical range of interest in blood samples (2.2 to 38.9 mM) [39]. In this regard, the biosensors can be utilized for glucose detection in blood or interstitial fluid at normal glucose levels or samples in the hypo- and a wide range of hyperglycemic levels; they likewise could be used in other real samples. As can be observed, the sensitivity of the glucose biosensor remains constant for successive glucose calibrations, showing acceptable repeatability for the same biosensing system. The glucose biosensors sensitivity for concentrations lower than 5 mM exhibit a sensitivity of 54.06 mA/mMcm2 and 33.86 mA/mMcm2 in the linear range from 5 to 30 mM glucose. In both cases, the determination coefficient R2 is 0.99. If the whole tested glucose range is considered, the sensitivity is 36.96 mA/mMcm2 with an R2 = 0.986. The limit of detection (LOD) is 0.66 mM, and the limit of quantitation (LOQ) is 2.18 mM; these were calculated as and respectively. In Figure 3B, the current stability for continuous monitoring of two different glucose concentrations is presented. As can be seen, the current remains practically constant for about 10 min (100.21 ± 4.79 mA/cm2 concentration 1 and 168.51 ± 4.91 mA/cm2 glucose concentration 2). The current rises as the glucose concentration increases. The signal stability is one of the most important analytical parameters of implantable biosensing systems. Thus, the biosensing membrane shows potential applications in continuous monitoring electrochemical biosensors, such as CGM´s.
The selectivity of the glucose biosensors was tested for the electrochemical response at 5 mM glucose and 5 mM glucose in the presence of three different electroactive spices commonly present in real samples: ascorbic acid (AA), uric acid (UA), and acetaminophen (APAP) at low, middle, and high (pathological) levels of the analytes in human blood. The electrochemical response was compared to the current produced by only 5 mM glucose. The results showed that at the high AA level, the electrochemical response rises to 18% relative to the signal for 5 mM of glucose, which could provide a false glucose reading. For lower and middle ascorbic acid levels, the signal also rises; however, the signal increases just 3 and 7%, respectively, relative to the current for 5 mM of glucose. In the case of UA and APAP, the results showed similar behavior to AA, where at high UA and APAP, the signal increases significantly to the 5 mM glucose signal. The results are shown in Figure 4.
The reproducibility of the methodology for the glucose biosensors fabrication was tested by preparing and evaluating 10 independent biosensors under similar experimental conditions; the results showed a coefficient of variation (CV) of 5.05% in the sensitivity of the biosensors. Figure 5A shows the average calibration plot for the 10 independent sensors. Figure 5B represents the sensitivity of each of the 10 independent glucose biosensors (for this comparison, the sensitivity was calculated in the entire glucose range).
The stability of the biosensors was tested by performing glucose calibrations every day for 30 days; after carrying out the calibration, the biosensors were washed with DI water and kept dry at room temperature until their use the following day. Figure 6A shows the typical calibration plots every 5 days. It can be seen that in the first 10 days, the sensitivity remains at 95%. During the following 5 days, the sensitivity decreases to 85%, and at the end of 30 days, the sensitivity decreases to 57%; the results are shown in Figure 6B. Considering that there were any special storage conditions and that the average room temperature was 20 ± 2 °C, the lifetime could be improved by maintaining the sensor under a lower temperature.
Storage stability was tested for the sensitivity of the glucose biosensors at day 1 and at day 30; during this period, the biosensor was kept at room temperature 20 ± 2 °C. Considering the whole glucose range, at day 30, it was observed that the sensitivity decreased 28% relative to day 1. However, the major diminution in the sensitivity was at glucose higher than 5 mM, where the sensitivity decreased 67%, while at concentrations lower than 5 mM, the sensitivity decreased only 15% relative to day 1. The results are shown in Figure 7A,B.
3.3. Glucose Biosensors Applications
The glucose biosensors were used in a solution containing 20 mg/mL of proteins to emulate the conditions that can be found in blood or interstitial fluid. The results in Figure 8A,B show that the sensitivity of the sensor in the presence of proteins in the whole range decreases 12% relative to the sensitivity obtained before biosensor calibration in the presence of proteins. The following step was to calibrate the glucose biosensors in phosphate buffer. The sensitivity increases by 1% compared to the first calibration. Nevertheless, this increment could be only a regular variation between consecutive calibrations. As can be observed from data in Figure 8A, the calibration plot in the presence of proteins starts at a more positive current; this is attributed to the protein solution matrix, although the testing matrix, the sensors, preserve a good glucose sensitivity. By performing the second calibration in a phosphate buffer, where practically the same response as at first calibration was obtained, it is possible to conclude that the biosensing membrane could present an anti-fouling effect, which could be favorable for continuous monitoring, and the biosensors could be utilized in different sorts of testing media.
Glucose biosensors were utilized for glucose determination in beverage samples (semi-skimmed flavored milk, flavored soy milk, and pasteurized apple juice) purchased from a local supermarket. It should be mentioned that due to the amount of glucose in each sample, which is higher than the linear range of the biosensor, the glucose determination was carried out by multipoint standard addition, and the matrix effect of these samples was diminished by the phosphate buffer required for the test. The glucose determinations are summarized in Table 1. As can be seen, the glucose determinations provide acceptable results for each of the three samples, making the biosensor suitable for application in these kinds of liquid samples.
The analytical parameters of the glucose biosensors developed in this work were compared with some of the latest electrochemical glucose sensors, which include enzymatic and non-enzymatic sensors [40,41,42,43,44,45,46]; the results are summarized in Table 2.
As can be observed, the glucose biosensor developed in this work excels in sensitivity and linearity, besides the potential applications in the biomedical and food industries.
4. Conclusions
This study shows the possibility of using p-coumaric acid to prepare a polymeric biosensing membrane by cyclic voltammetry and, in one step, incorporate recognizing agents, such as enzymes, in the present research, glucose oxidase fabricating a glucose biosensor. The fabricated biosensors show good reproducibility, repeatability, stability, and sensitivity. The glucose biosensor exhibits 2 linear ranges, the first from 1 to 5 mM and the second from 5 to 30 mM, allowing it to be used for glucose detection in biofluids in the hypo- and hyperglycemic ranges and its potential applications in other liquid samples. The biosensors have been used in the presence of proteins, maintaining the biosensor sensitivity. The biosensors have also been employed in the glucose determinations in other complex matrices (milk and fruit juice), demonstrating that, in the case of proteins, the polymeric membrane presents an anti-biofouling effect. The polymeric membrane allows the H2O2 diffusion to the Pt electrode surface, followed by H2O2 electrochemical oxidation. However, other electroactive species, such as ascorbic acid, uric acid, and acetaminophen, cannot easily reach the electrode surface; thus, the polymeric membrane gives a grade of selectivity to the biosensor towards some electroactive compounds that can be present in real samples. The results show the potential applications of the biosensing membrane for biomedical applications (CGMs) and the food industry. The reproducibility of the methodology for glucose biosensor fabrication of 10 independent sensors prepared under similar conditions showed a coefficient of variation (CV) of 5.05%, making it a promising platform for mass production and for methodology applications with other recognition elements for different analytes.
Author Contributions
Conceptualization, methodology, formal analysis, investigation, G.V.-R.; resources, L.G. and G.V.-R.; writing—review and editing, G.V.-R. and L.G. All authors have read and agreed to the published version of the manuscript.
Funding
This research received no external funding.
Institutional Review Board Statement
Not applicable.
Informed Consent Statement
Not applicable.
Data Availability Statement
Not applicable.
Acknowledgments
G.V.-R. and L.G. acknowledge CBI-UAM for the economic support for the chemicals and materials purchased for the experiments.
Conflicts of Interest
The authors declare no conflict of interest.
References
- Harding, J.L.; Pavkov, M.E.; Magliano, D.J.; Shaw, J.E.; Gregg, E.W. Global trends in diabetes complications: A review of current evidence. Diabetologia 2019, 62, 3–16. [Google Scholar] [CrossRef] [PubMed] [Green Version]
- Entezari, M.; Hashemi, D.; Taheriazam, A.; Zabolian, A.; Mohammadi, S.; Fakhri, F.; Hashemi, M.; Hushmandi, H.; Ashrafizadeh, M.; Zarrabi, A.; et al. AMPK signaling in diabetes mellitus, insulin resistance and diabetic complications: A pre-clinical and clinical investigation. Biomed. Pharmacother. 2022, 146, 112563. [Google Scholar] [CrossRef] [PubMed]
- Sun, H.; Saeedi, P.; Karuranga, S.; Pinkepank, M.; Ogurtsova, K.; Duncan, B.B.; Stein, C.; Basit, A.; Chan, N.C.J.; Mbanya, C.J.; et al. IDF Diabetes Atlas: Global, regional and country-level diabetes prevalence estimates for 2021 and projection for 2045. Diabetes Res. Clin. Pract. 2021, 183, 109119. [Google Scholar] [CrossRef]
- Zou, Y.; Chu, Z.; Guo, J.; Liu, S.; Ma, X.; Guo, J. Minimally invasive electrochemical continuous glucose monitoring sensors: Recent progress and perspective. Biosens. Bioelectron. 2023, 225, 115103. [Google Scholar] [CrossRef]
- Cosnier, S. Biosensors based on electropolymerized films: New trends. Anal. Bioanal. Chem. 2003, 337, 507–520. [Google Scholar] [CrossRef] [PubMed]
- Lyu, X.; Gonzalez, R.; Horton, A.; Li, T. Immobilization of Enzymes by Polymeric Materials. Catalysts 2021, 11, 1211. [Google Scholar] [CrossRef]
- Asgher, M.; Shahid, M.; Kamal, S.; Iqbal, M.H.N. Recent trends and valorization of immobilization strategies and ligninolytic enzymes by industrial biotechnology. J. Mol. Catal. B Enzym. 2014, 101, 56–66. [Google Scholar] [CrossRef]
- Martinkova, P.; Kostelnik, A.; Valek, T.; Pohanka, M. Main streams in the construction of biosensors and their applications. Int. J. Electrochem. Sci. 2017, 12, 7386–7403. [Google Scholar] [CrossRef]
- Spychalska, K.; Zając, D.; Baluta, S.; Halicka, K.; Cabaj, J. Functional Polymers Structures for (Bio)Sensing Application—A Review. Polymers 2020, 12, 1154. [Google Scholar] [CrossRef]
- Çetin, Z.M.; Guven, N.; Apetrei, R.-M.; Camurlu, P. Highly sensitive detection of glucose via glucose oxidase immobilization onto conducting polymer-coated composite polyacrylonotrile nanofibers. Enzyme Microb. 2023, 164, 110178. [Google Scholar] [CrossRef]
- Teles, R.R.F.; Fonseca, P.L. Applications of polymers for biomolecule immobilization in electrochemical biosensors. Mater. Sci. Eng. C 2008, 28, 1530–1543. [Google Scholar] [CrossRef]
- Nambiar, S.; Yeow, T.W.J. Conductive polymer-based sensor for biomedical applications. Biosens. Bioelectron. 2011, 26, 1825–1832. [Google Scholar] [CrossRef]
- Lange, U.; Roznyatovskaya, V.N.; Mirsky, M.V. Conducting polymers in chemical sensors and arrays. Anal. Chim. Acta 2008, 614, 1–26. [Google Scholar] [CrossRef] [PubMed]
- Somasundrum, M.; Aoki, K. The steady-state current at microcylinder electrodes modified by enzymes immobilized in conducting or non-conducting material. J. Electroanal. Chem. 2002, 530, 40–46. [Google Scholar] [CrossRef]
- Yuqing, M.; Jianrong, C.; Xiaohua, W. Using electropolymerized non-conducting polymers to develop enzyme amperometric biosensors. Trends Biotechnol. 2004, 22, 227–231. [Google Scholar] [CrossRef] [PubMed]
- Stejskal, J. Polymers of phenylenediamines. Prog. Polym. Sci. 2015, 41, 1–31. [Google Scholar] [CrossRef]
- Wang, J.; Chen, L.; Hocevar, B.S.; Ogoreve, B. One-step electropolymeric co-immobilization of glucose oxidase end heparin for amperometric biosensing of glucose. Analyst 2000, 125, 1431–1434. [Google Scholar] [CrossRef]
- Malitesta, C.; Palmisano, F.; Torsi, L.; Zambonin, G.P. Glucose Fast-Response Amperometric Sensor Based on Glucose Oxidase Immobilized in an Electropolymerized Poly(o-phenylendiamine) Film. Anal. Chem. 1990, 62, 2735–2740. [Google Scholar] [CrossRef]
- Calia, G.; Monti, P.; Marceddu, S.; Dettori, A.M.; Fabbri, D.; Jaoua, S.; O’Neill, D.R.; Delogu, G.; Migheli, Q. Electropolymerized phenol derivates as permselective polymers for biosensor applications. Analyst 2015, 140, 3607–3615. [Google Scholar] [CrossRef]
- Guerriri, A.; De Benedetto, E.G.; Palmisano, F.; Zambonin, G.P. Electrosynthesized non-conductive polymers as permselective membranes in amperometric enzyme electrodes: A glucose biosensor based on a co-crosslinked glucose oxidase/overoxidized polypyrrole bilayer. Biosens. Bioelectron. 1998, 13, 103–112. [Google Scholar] [CrossRef]
- Liu, Y.; Yang, L.; Cui, Y. Transdermal amperometric biosensors for continuous glucose monitoring in diabetes. Talanta 2023, 253, 124033. [Google Scholar] [CrossRef]
- Windmiller, R.J.; Valdés-Ramírez, G.; Zhuo, N.; Zhuo, M.; Miller, R.P.; Jin, C.; Brozik, M.S.; Polsky, R.; Katz, E.; Narayan, R.; et al. Bicomponent Microneedle Array Biosensor for Minimally-Invasive Glutamate Monitoring. Electroanalysis 2011, 23, 2302–2309. [Google Scholar] [CrossRef]
- Maghraby, R.Y.; El-Shabasy, M.R.; Ibrahim, H.A.; Azzazy, E.-S.M.H. Enzyme Immobilization Technologies and Industrial Applications. ACS Omega 2023, 8, 5184–5196. [Google Scholar] [CrossRef]
- Ziyatdinova, G.; Guss, E.; Yakupova, E. Electrochemical Sensors Based on Electropolymerized Natural Phenolic Antioxidants and Their Analytical Application. Sensors 2021, 21, 8385. [Google Scholar] [CrossRef]
- Lima, M.T.; Soares, I.P.; do Nascimento, A.L.; Franco, L.D.; Pereira, C.A.; Ferreira, F.L. A novel electrochemical sensor for simultaneous determination of cadmium and lead using graphite electrodes modified with poly(p-coumaric acid). Microchem. J. 2021, 168, 106306. [Google Scholar] [CrossRef]
- Santiago-Luna, D.F.; Luis, G.L.; Valdés-Ramírez, G. Electrochemical Detection of Pb2+ and Cd2+ Ions in Aqueous Samples Employing Modified Carbon Paste electrode (β-cyclodextrin and p-coumaric Acid). ECS Trans. 2023, 110, 309. [Google Scholar] [CrossRef]
- Valdés-Ramírez, G.; Galicia, L. Biosensing membrane base on ferulic acid and glucose oxidase for an amperometric glucose biosensor. Molecules 2021, 26, 3757. [Google Scholar] [CrossRef]
- Boz, H. p-Coumaric acid in cereals: Presence, antioxidant and antimicrobial effects. Int. J. Food Sci. Technol. 2015, 50, 2323–2328. [Google Scholar] [CrossRef]
- Boo, C.Y. p-Coumaric Acid as AnActive Ingredient in Cosmetics: A Review Focusing on its Antimelanogenic effects. Antioxidants 2019, 8, 275. [Google Scholar] [CrossRef] [Green Version]
- Ferreira, S.P.; Victorelli, D.F.; Fonseca-Santos, B.; Chorilli, M. A Review of Analytical Methods for p-Coumaric Acid in Plant-Based Products, Beverages, and Biological Matrices. Crit. Rev. Anal. Chem. 2018, 49, 21–31. [Google Scholar] [CrossRef]
- Tümay, O.S.; Sanko, V.; Şenocak, A.; Orroji, Y.; Demirbas, E.; Yoon, Y.; Khataee, A. Direct and selective determination of p-coumaric acid in food samples via layered Nb4AlC3-MAX phase. Food Chem. 2023, 403, 134130. [Google Scholar] [CrossRef] [PubMed]
- Janeiro, P.; Novak, I.; Seruga, M.; Oliveira-Brett, A.M. Electroanalytical Oxidation of p-Coumaric Acid. Anal. Lett. 2007, 40, 3309–3321. [Google Scholar] [CrossRef]
- Ziyatdinova, G.; Kozlova, E.; Budnikov, H. Selective electrochemical sensor based on the electropolymerized p-coumaric acid for the direct determination of L-cysteine. Electrochim. Acta 2018, 270, 369–377. [Google Scholar] [CrossRef]
- Biegler, T.; Rand, D.A.J.; Woods, R.J. Limiting oxygen coverage on platinized platinum; Relevance to determination of real platinum area by hydrogen adsorption. J. Electroanal. Chem. Interfacial Electrochem. 1971, 29, 269–277. [Google Scholar] [CrossRef]
- Doña, R.J.M.; Herrera, M.J.A.; Pérez, P.J. Determination of the Real Surface Area of Pt Electrodes by Hydrogen Adsorption Using Cyclic Voltammetry. J. Chem. Ed. 2000, 77, 1195. [Google Scholar] [CrossRef]
- Fogh-Andersen, N.; Altura, B.; Altura, B.T.; Siggaard-Andersen, O. Composition of Interstitial Fluid. Clin. Chem. 1995, 41, 1522–1525. [Google Scholar] [CrossRef]
- Benvidi, A.; Dadras, A.; Abbasi, S.; Tezerjani, M.D.; Rezaeinasab, M.; Tabaraki, R.; Namazian, M. Experimental and computational study of the pKa of coumaric acid derivates. J. Chin. Chem. Soc. 2019, 66, 589–593. [Google Scholar] [CrossRef]
- Li, X.; Gao, Y.; Xiong, H.; Yang, Z. The electrochemical redox mechanism and antioxidant activity of polyphenolic compounds based on inlaid multi-walled carbon nanotubes.modified. Open Chem. 2021, 19, 961–973. [Google Scholar] [CrossRef]
- Updique, J.S.; Shults, C.M.; Gilligan, J.B.; Rhodes, K.R. A subcutaneous glucose sensor with improved longevity, dynamic range, and stability of calibration. Diabetes Care. 2000, 23, 208–214. [Google Scholar] [CrossRef] [Green Version]
- Li, B.; Wu, X.; Shi, C.; Dai, Y.; Zhang, J.; Liu, W.; Wu, C.; Zhang, Y.; Huang, X.; Zeng, W. Flexible enzymatic biosensor based on graphene sponge for glucose detection in human sweat. Surf 2023, 36, 102525. [Google Scholar] [CrossRef]
- Singh, A.; Sharma, A.; Sundramoorthy, A.K.; Arya, S. Synthesis and characterization of wearable cupros oxide /conductive fabric enable non-enzymatic electrochemical sensing of glucose. Ionics 2023, 29, 2501–2513. [Google Scholar] [CrossRef]
- Gao, N.; Cai, Z.; Chang, G.; He, Y. Non-invasive andwearable glucose biosensor based on gel electrolyte for detection of human sweat. J. Mater. Sci. 2023, 58, 890–901. [Google Scholar] [CrossRef]
- Bi, R.; Ma, X.; Miao, K.; Ma, P.; Wang, Q. Enzymatic biosensor based on dendritic gold nanostructure and enzyme precipitation coating for glucose sensing and detection. Enzyme Microb. Technol. 2023, 162, 110132. [Google Scholar] [CrossRef] [PubMed]
- Tan, B.; Baycan, F. Fabricating a new immobilization matrix based on a conjugated polymer and application as a glucose biosensor. J. Appl. Polym. Sci. 2023, 140, 53268. [Google Scholar] [CrossRef]
- Wang, Y.; Guo, H.; Yuan, M.; Yu, J.; Wang, Z.; Chen, X. One-step laser synthesis platinum nanostructures 3D porous graphene:A flexible dual-functional electrochemical biosensor for glucose and pH detection in humanperspiration. Talanta 2023, 257, 124362. [Google Scholar] [CrossRef]
- Promsuwan, K.; Soleh, A.; Samoson, K.; Sisahas, K.; Wangchuk, S.; Saichanapan, J.; Kanatharana, P.; Thavarungkul, P.; Limbut, W. Novel biosensor platform for glucose monitoring via smarthphone based on battery-less NFC potentiostat. Talanta 2023, 256, 124266. [Google Scholar] [CrossRef]
Scheme 1.
Enzymatic reaction of glucose by the generation of hydrogen peroxide.
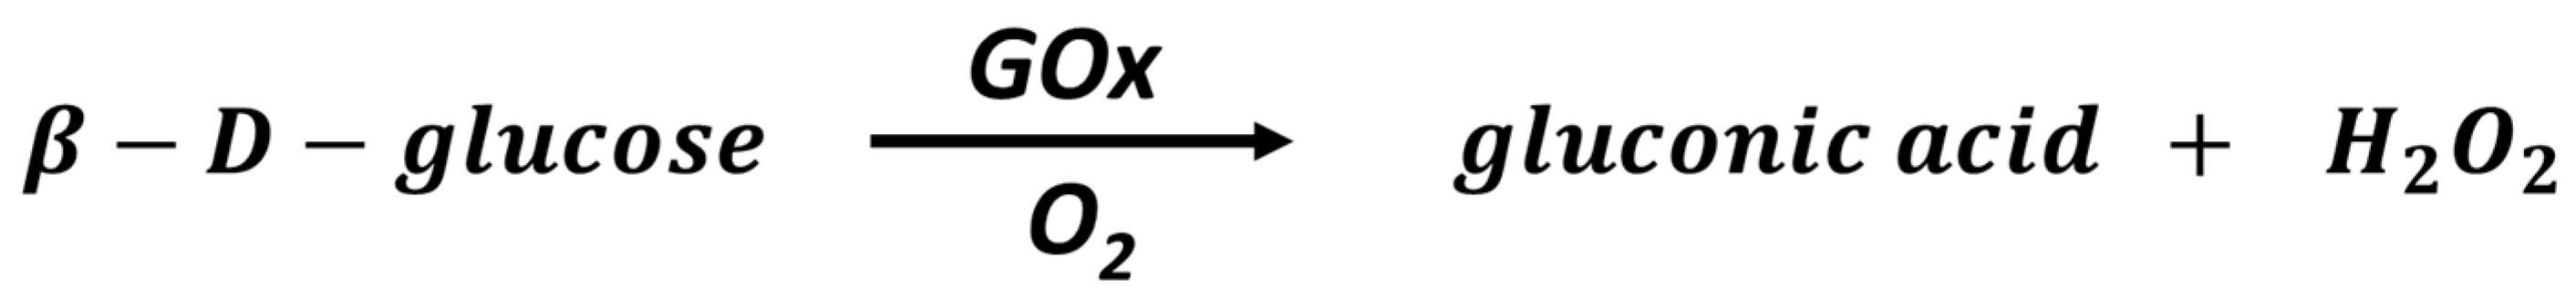
Figure 1.
(A) Typical cyclic voltammogram for Pt electrode cleaning process in H2SO4 (scan rate 100 mV/s). (B) Cyclic voltammogram of Pt electrode in PB before and after p-CA electropolymerization (scan rate 50 mV/s). (C) Voltammograms for different H2O2 concentrations, the inset shows a zoom of the mentioned signal (scan rate 50 mV/s).
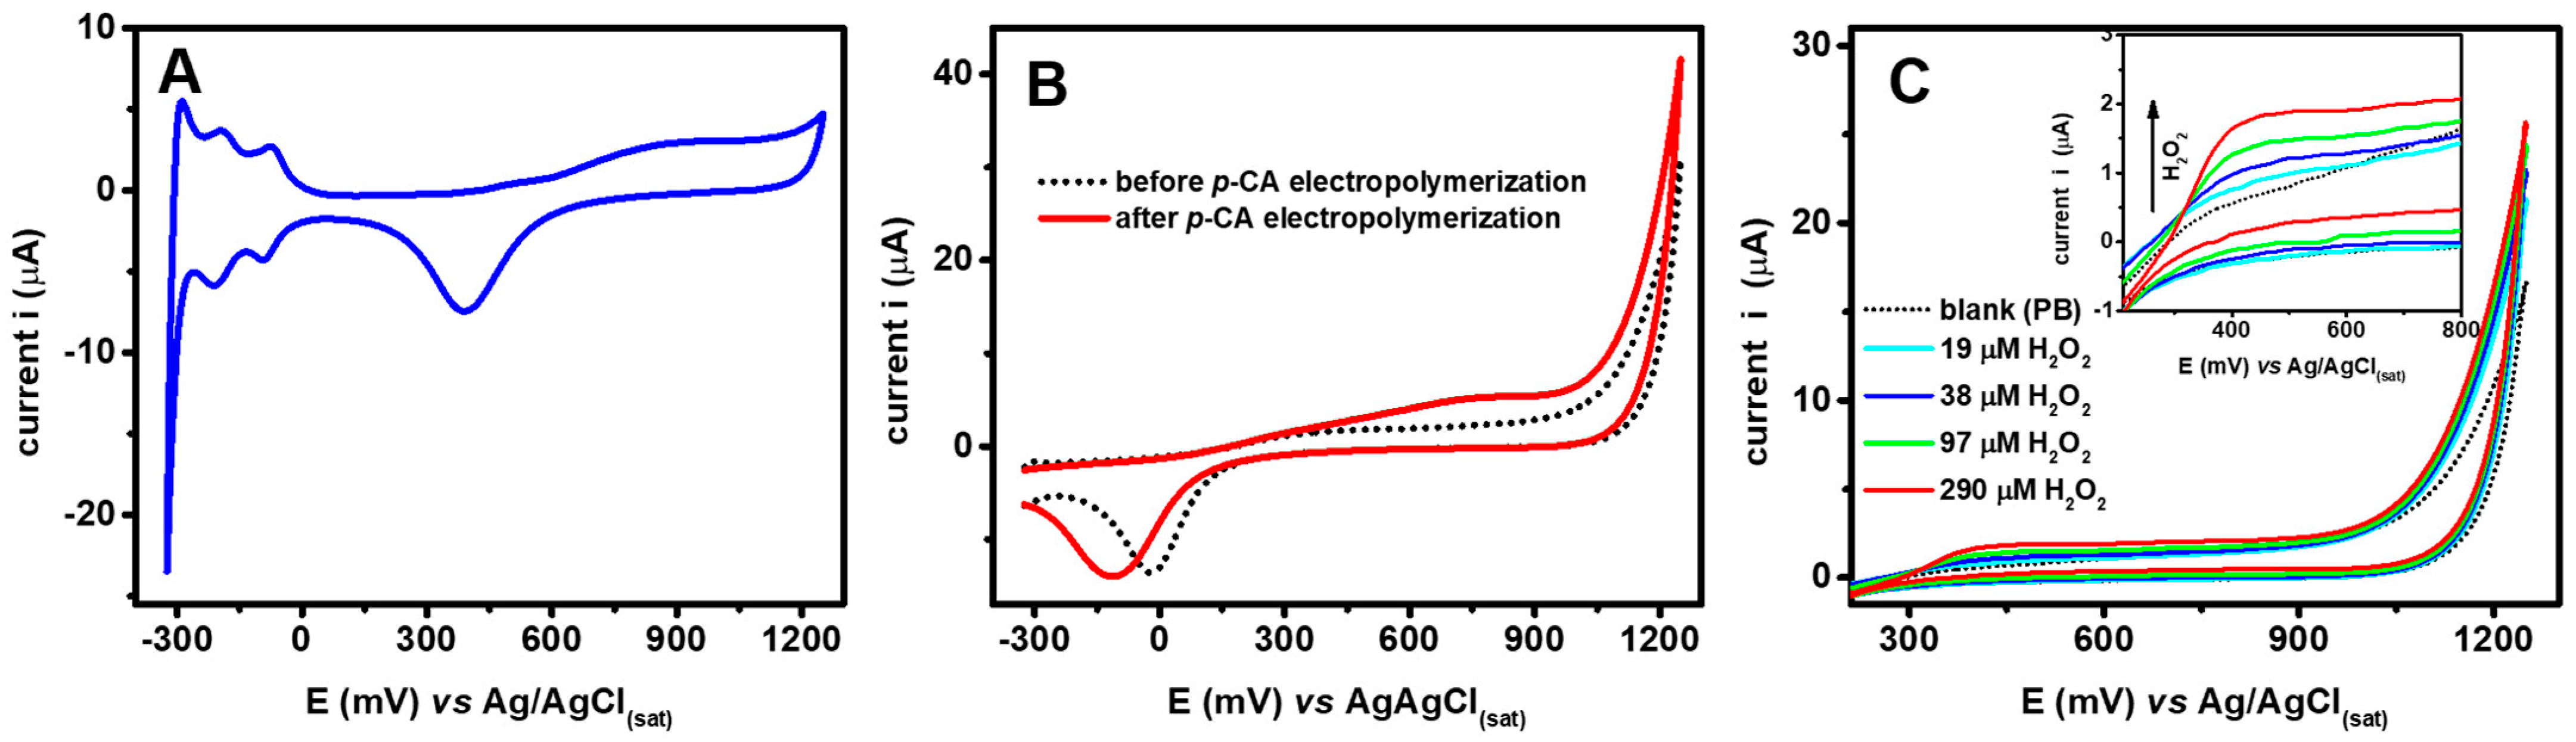
Figure 2.
(A) Cyclic voltammograms for the electropolymerization of p-CA and GOx onto a Pt disk electrode in PB/et solution. (B) Typical cyclic voltammogram for p-CA electropolymerization in phosphate buffer in 3% ethanol (PB/et) without GOx. (C) Cyclic voltammogram for p-CA and GOx electropolymerization in phosphate buffer (PB) without ethanol. (D) Cyclic voltammograms in phosphate buffer pH 7.0 for a bare Pt electrode and Pt/poly(p-CA-GOx) glucose biosensor. Electropolymerization experiments (A–C) were carried out at a scan rate of 20 mV/s; the biosensing membrane presence on the Pt electrode was confirmed by cyclic voltammetry in PB at a scan rate of 50 mV/s.
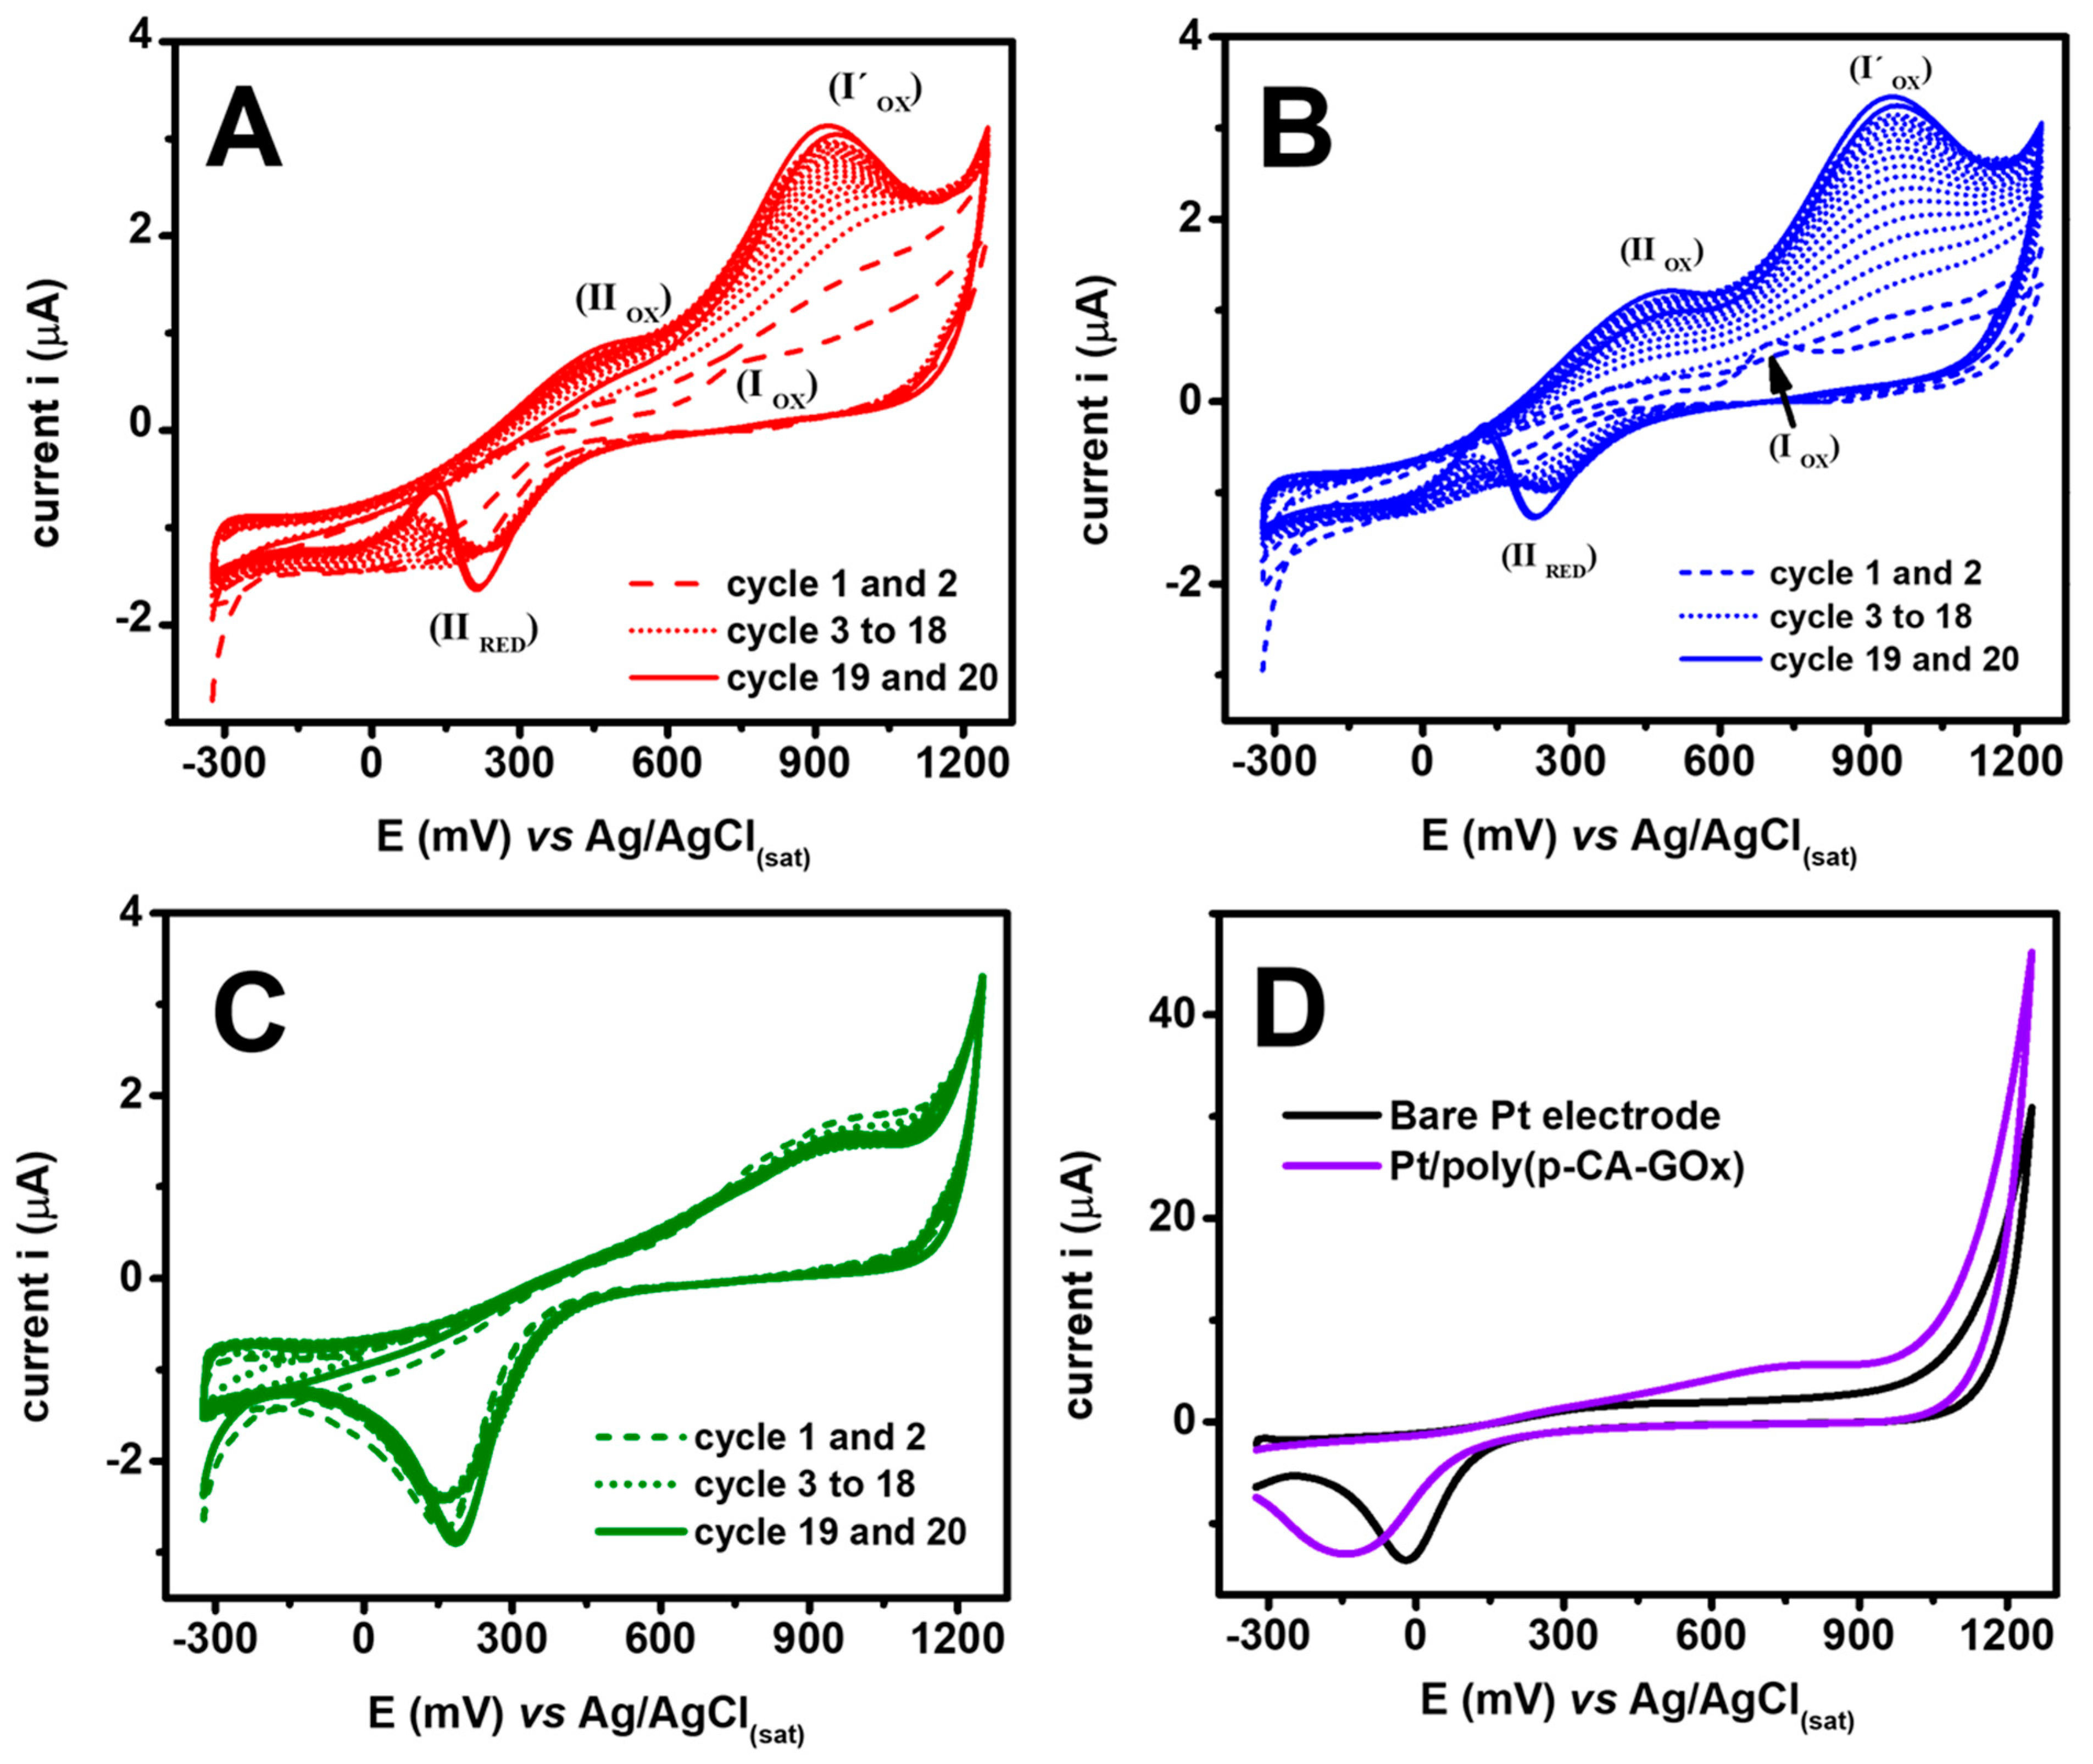
Figure 3.
(A) Typical glucose calibration for the developed biosensor (n = 5). (B) Stability for the amperometric signal (600 mV vs. Ag/AgCl) for 2 successive glucose concentrations.
Figure 3.
(A) Typical glucose calibration for the developed biosensor (n = 5). (B) Stability for the amperometric signal (600 mV vs. Ag/AgCl) for 2 successive glucose concentrations.
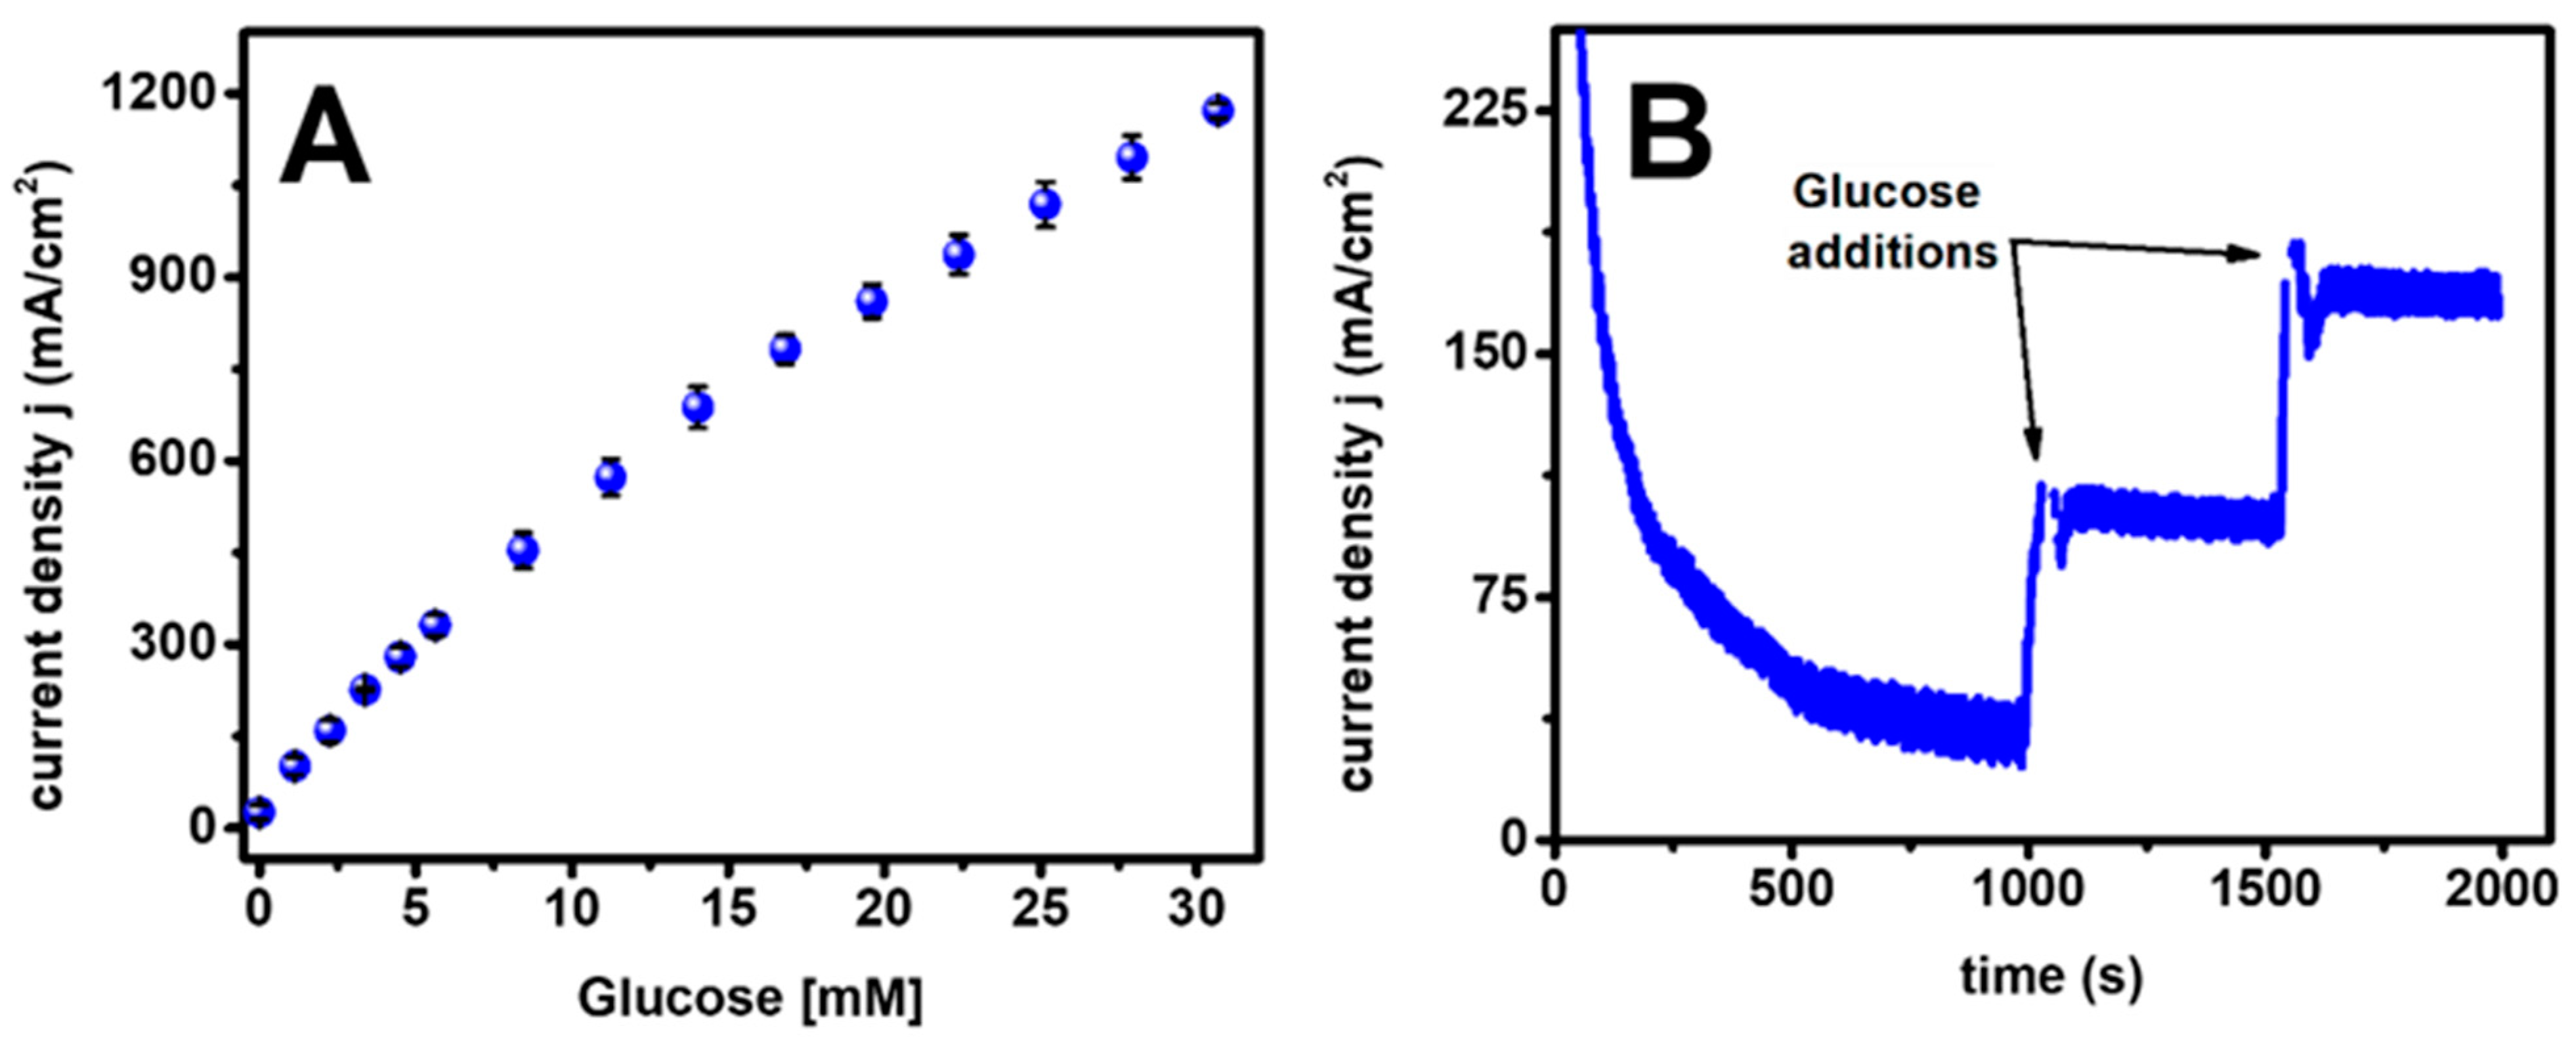
Figure 4.
Glucose biosensor selectivity. The signal percentage for glucose 5 mM; glucose 5 mM + ascorbic acid at 20, 45, and 83 µM; glucose 5 mM + uric acid at 150, 250, and 400 µM; and glucose 5 mM + acetaminophen 0.140, 1.150, and 1.710 mM.
Figure 4.
Glucose biosensor selectivity. The signal percentage for glucose 5 mM; glucose 5 mM + ascorbic acid at 20, 45, and 83 µM; glucose 5 mM + uric acid at 150, 250, and 400 µM; and glucose 5 mM + acetaminophen 0.140, 1.150, and 1.710 mM.
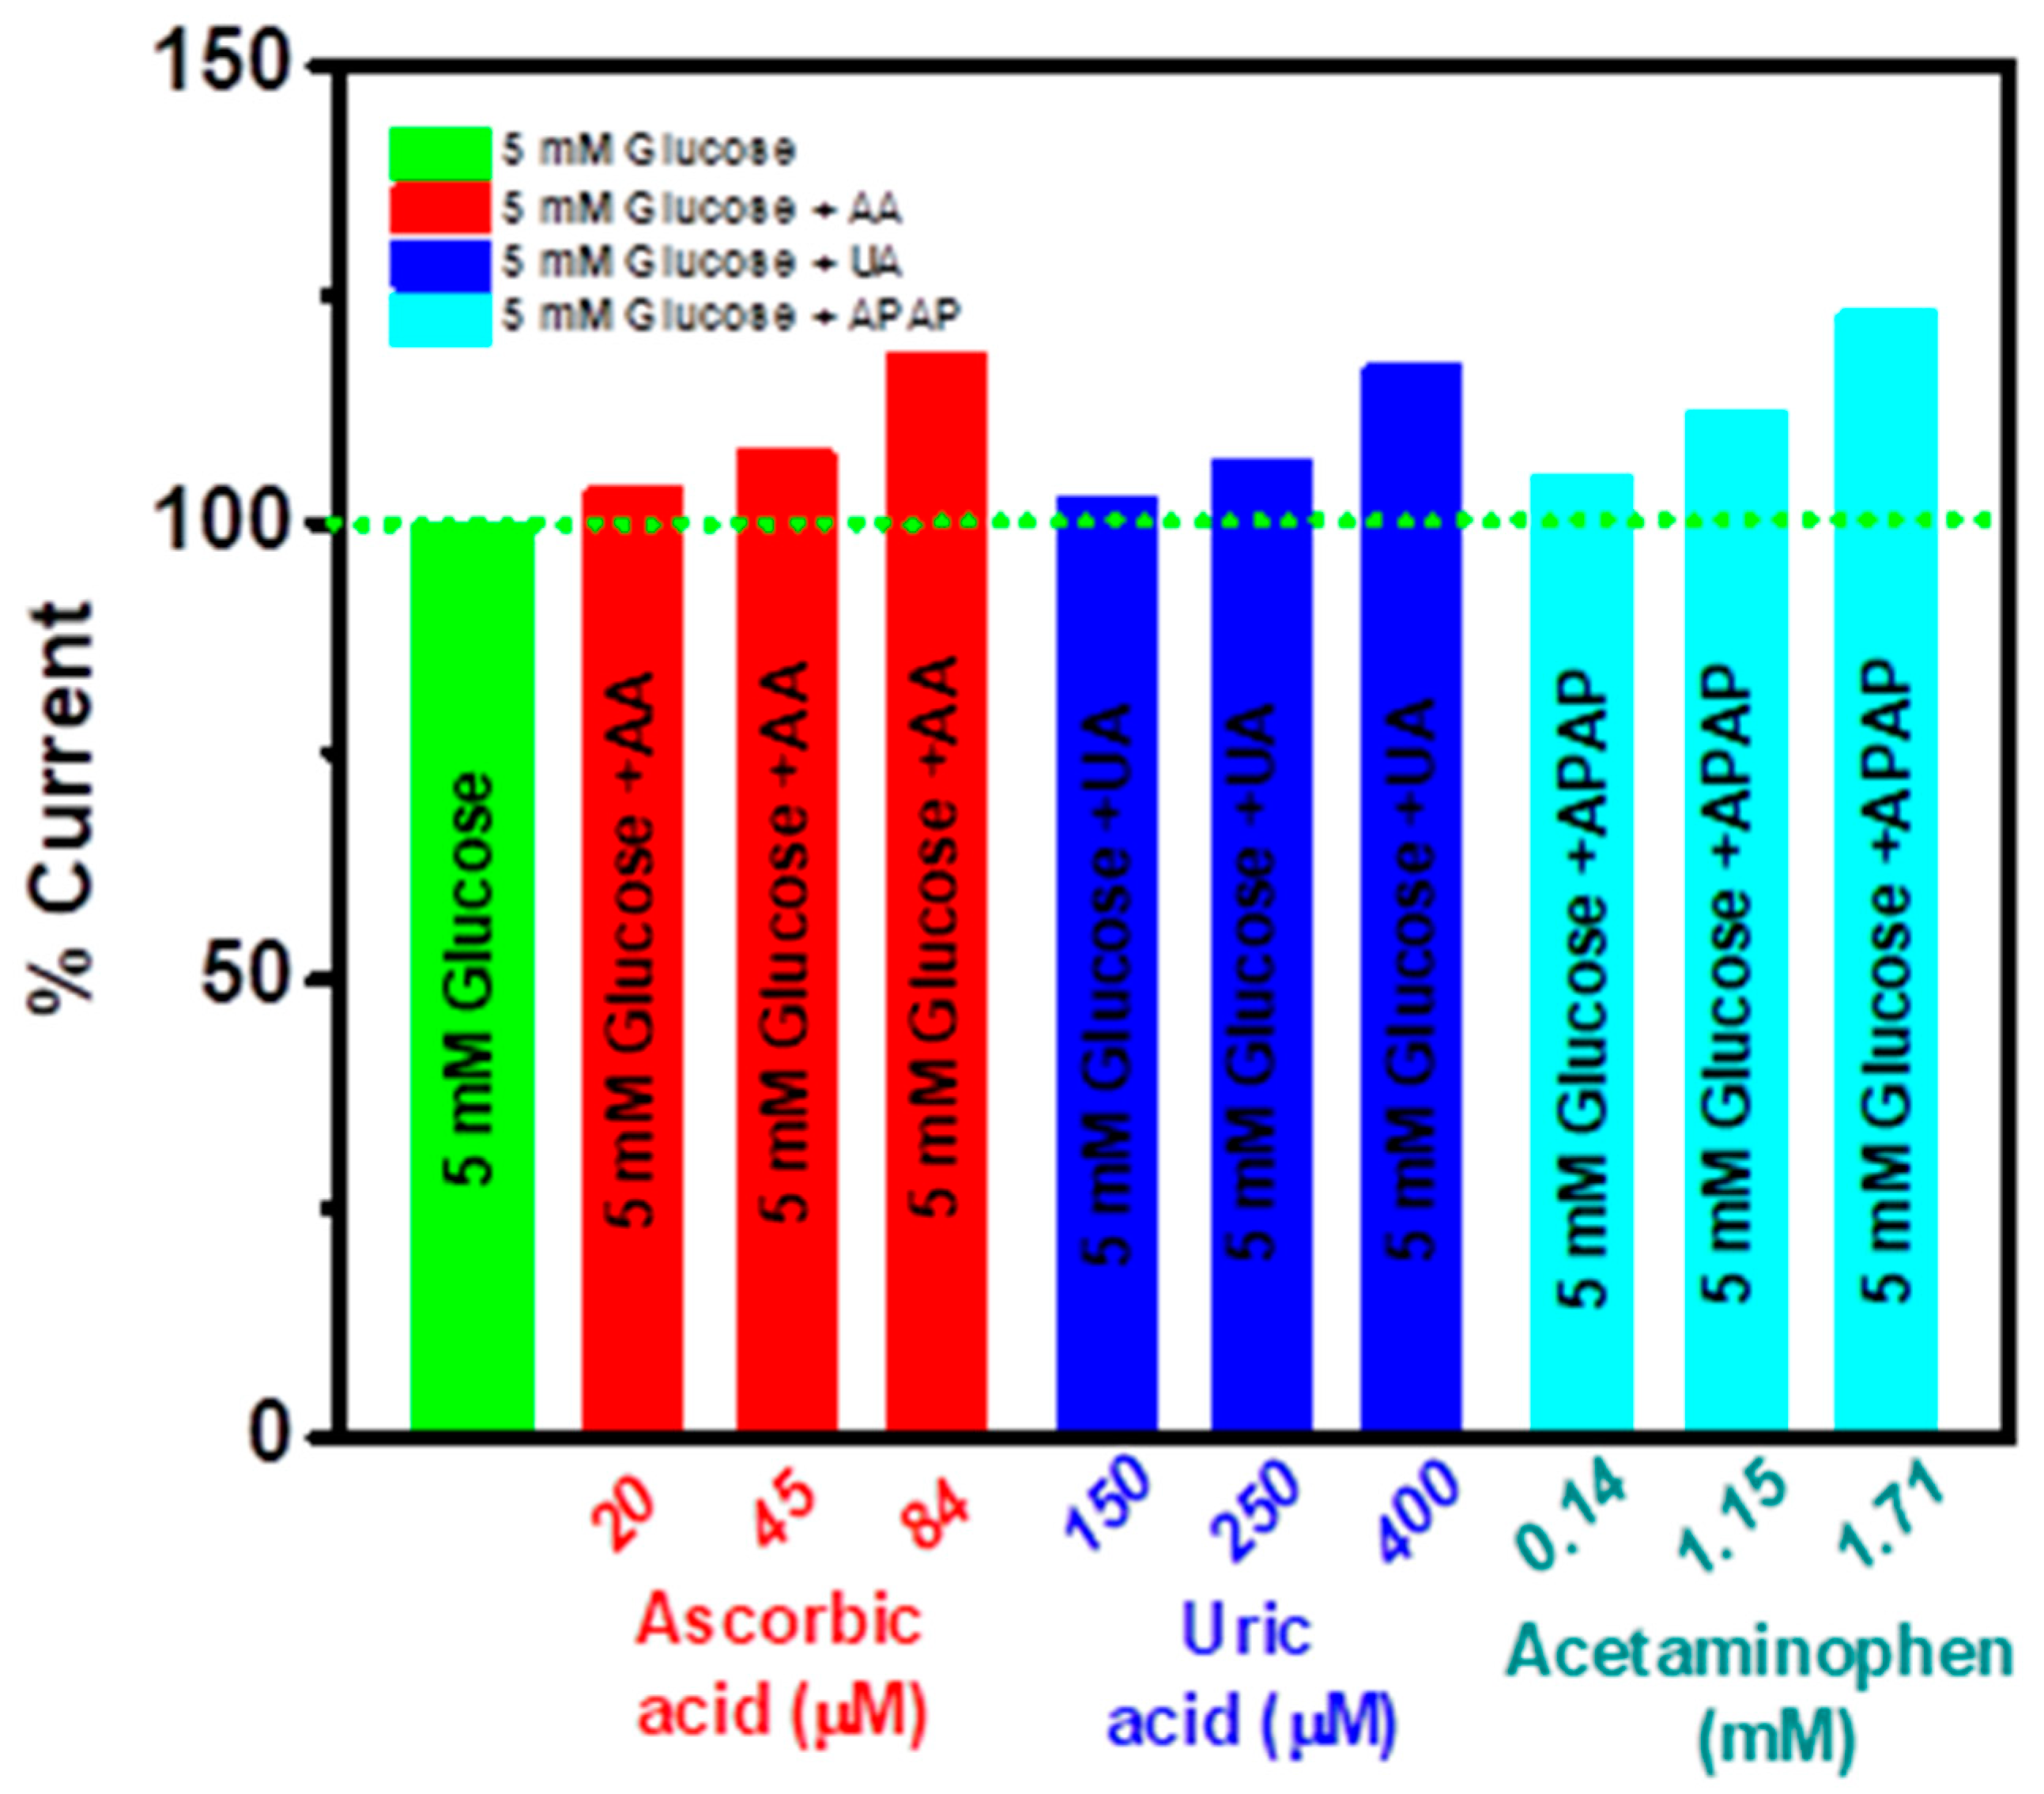
Figure 5.
(A) Average glucose calibration for 10 independent biosensors prepared under similar conditions. (B) Sensitivity for each of the 10 evaluated glucose biosensors (evaluation of the reproducibility of the methodology).
Figure 5.
(A) Average glucose calibration for 10 independent biosensors prepared under similar conditions. (B) Sensitivity for each of the 10 evaluated glucose biosensors (evaluation of the reproducibility of the methodology).

Figure 6.
Glucose biosensor stability evaluation. (A) Glucose biosensor calibrations performed on a different day. (B) Sensitivity percentage for glucose biosensors evaluation carried out on a different day; comparison of the sensitivity is relative to the sensitivity on the first day.
Figure 6.
Glucose biosensor stability evaluation. (A) Glucose biosensor calibrations performed on a different day. (B) Sensitivity percentage for glucose biosensors evaluation carried out on a different day; comparison of the sensitivity is relative to the sensitivity on the first day.

Figure 7.
Storage stability evaluation. (A) Glucose biosensor calibration for storage evaluation on day 1 and day 30. (B) Sensitivity percentage for glucose biosensor evaluation.
Figure 7.
Storage stability evaluation. (A) Glucose biosensor calibration for storage evaluation on day 1 and day 30. (B) Sensitivity percentage for glucose biosensor evaluation.
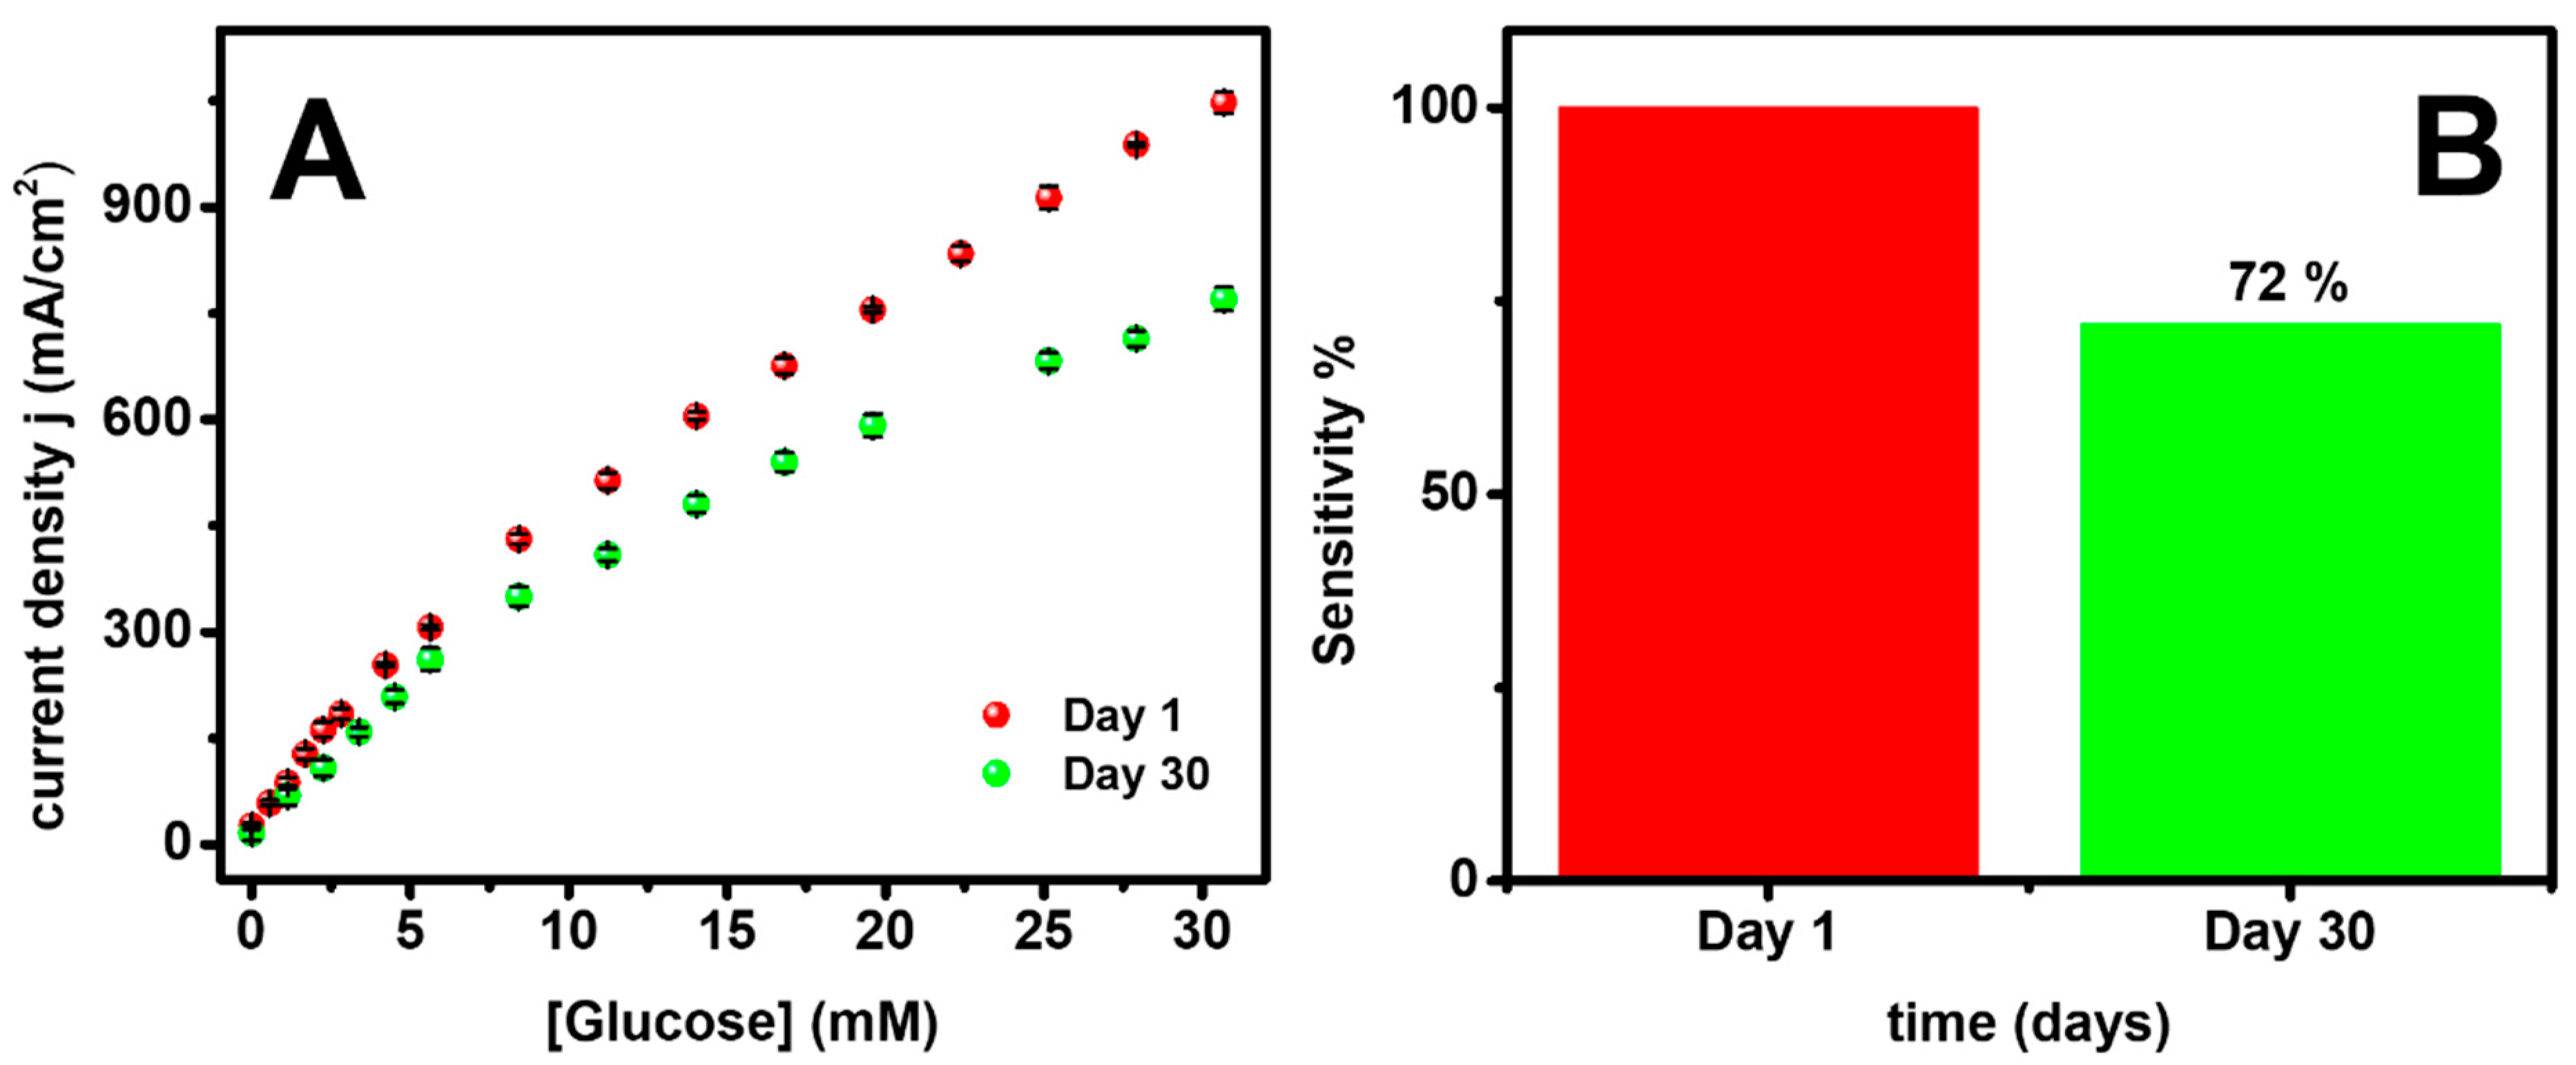
Figure 8.
Biofouling evaluation. (A) Biosensor glucose calibration in phosphate buffer and in the presence of 20 mg/mL proteins. (B) Sensitivity percentage for glucose biosensor, before proteins, in 20 mg/mL proteins and after proteins.
Figure 8.
Biofouling evaluation. (A) Biosensor glucose calibration in phosphate buffer and in the presence of 20 mg/mL proteins. (B) Sensitivity percentage for glucose biosensor, before proteins, in 20 mg/mL proteins and after proteins.


Table 1.
Glucose determination at three commercial beverages.
| Sample | Total Sugar g/100 mL Concentration (Label) * | Total Sugar g/100 mL Concentration Utilizing This Glucose Biosensor |
|---|---|---|
| Flavored soy milk | 4 | 3.92 ± 0.06 |
| Semi-skimmed flavored milk | 7.1 | 7.26 ± 0.33 |
| Fruit juice | 10.5 | 10.41 ± 0.30 |
* Information provided by the manufacturer.
Table 2.
Comparison of analytical parameters for the latest electrochemical glucose sensors.
| Sensor Structure | Application | Sensitivity | LOD | Linear Range | Applied Potential | Reference |
|---|---|---|---|---|---|---|
| GOx/CTs/GS/PB (GCGP) | sweat | 1.79 nA/mMcm2 | 2.45 μM | 8.17–100 μM | 0.075 V vs. Ag/AgCl | [40] |
| Cu2O—coated CF | 3739 mA/mMcm2 | 97.08 μM | 0–500 μM | 0.5 V vs. Ag/AgCl | [41] | |
| GOx—gel—rGO—Au/SPGE | sweat | 27.4 μA/mMcm2 53.7 μA/mMcm2 | 1.25 μM | 1.25–850 μM 0.85–7.72 mM | −0.3 V vs. Ag/AgCl | [42] |
| GOxEPC-DenAu/CC (FcOH) | serum | 72.45 μA/mMcm2 | 6.7 μM | 0.02–31.7 mM | 0.28 V vs. Ag/AgCl | [43] |
| GPE/PThBN/AuNPs/GOx | 0.1326 μA/mMcm2 | 0.034 mM | 2.97 μM–2.087 mM | −0.5 V vs. Ag/AgCl | [44] | |
| GOx/Pt-HEC/LSG | sweat | 69.64 μA/mMcm2 | 0.23 μM | 5–3000 μM | 0.60 V vs. Ag/AgCl | [45] |
| GOx-AuNPs-PEDOT:PSS/PB-G | 0.15 μM | 0.5–500 μM | 0.0 V vs. Ag/AgCl | [46] | ||
| Pt/poly(p-CA-GOx) | Proteins and commercial beverages | 54.06 mA/mMcm2 33.86 mA/mMcm2 | 0.66 mM | 1.5 mM 5–30 mM | 0.60 V vs. Ag/AgCl | This work |
Disclaimer/Publisher’s Note: The statements, opinions and data contained in all publications are solely those of the individual author(s) and contributor(s) and not of MDPI and/or the editor(s). MDPI and/or the editor(s) disclaim responsibility for any injury to people or property resulting from any ideas, methods, instructions or products referred to in the content. |
© 2023 by the authors. Licensee MDPI, Basel, Switzerland. This article is an open access article distributed under the terms and conditions of the Creative Commons Attribution (CC BY) license (https://creativecommons.org/licenses/by/4.0/).
Share and Cite
MDPI and ACS Style
Valdés-Ramírez, G.; Galicia, L. Glucose Oxidase Captured into Electropolymerized p-Coumaric Acid towards the Development of a Glucose Biosensor. Chemosensors 2023, 11, 345. https://doi.org/10.3390/chemosensors11060345
AMA Style
Valdés-Ramírez G, Galicia L. Glucose Oxidase Captured into Electropolymerized p-Coumaric Acid towards the Development of a Glucose Biosensor. Chemosensors. 2023; 11(6):345. https://doi.org/10.3390/chemosensors11060345
Chicago/Turabian StyleValdés-Ramírez, Gabriela, and Laura Galicia. 2023. "Glucose Oxidase Captured into Electropolymerized p-Coumaric Acid towards the Development of a Glucose Biosensor" Chemosensors 11, no. 6: 345. https://doi.org/10.3390/chemosensors11060345
Note that from the first issue of 2016, this journal uses article numbers instead of page numbers. See further details here.