
Prostate Cancer Detection in Colombian Patients through E-Senses Devices in Exhaled Breath and Urine Samples

 ,
,  , and
, and
Abstract
:1. Introduction
2. Materials and Methods
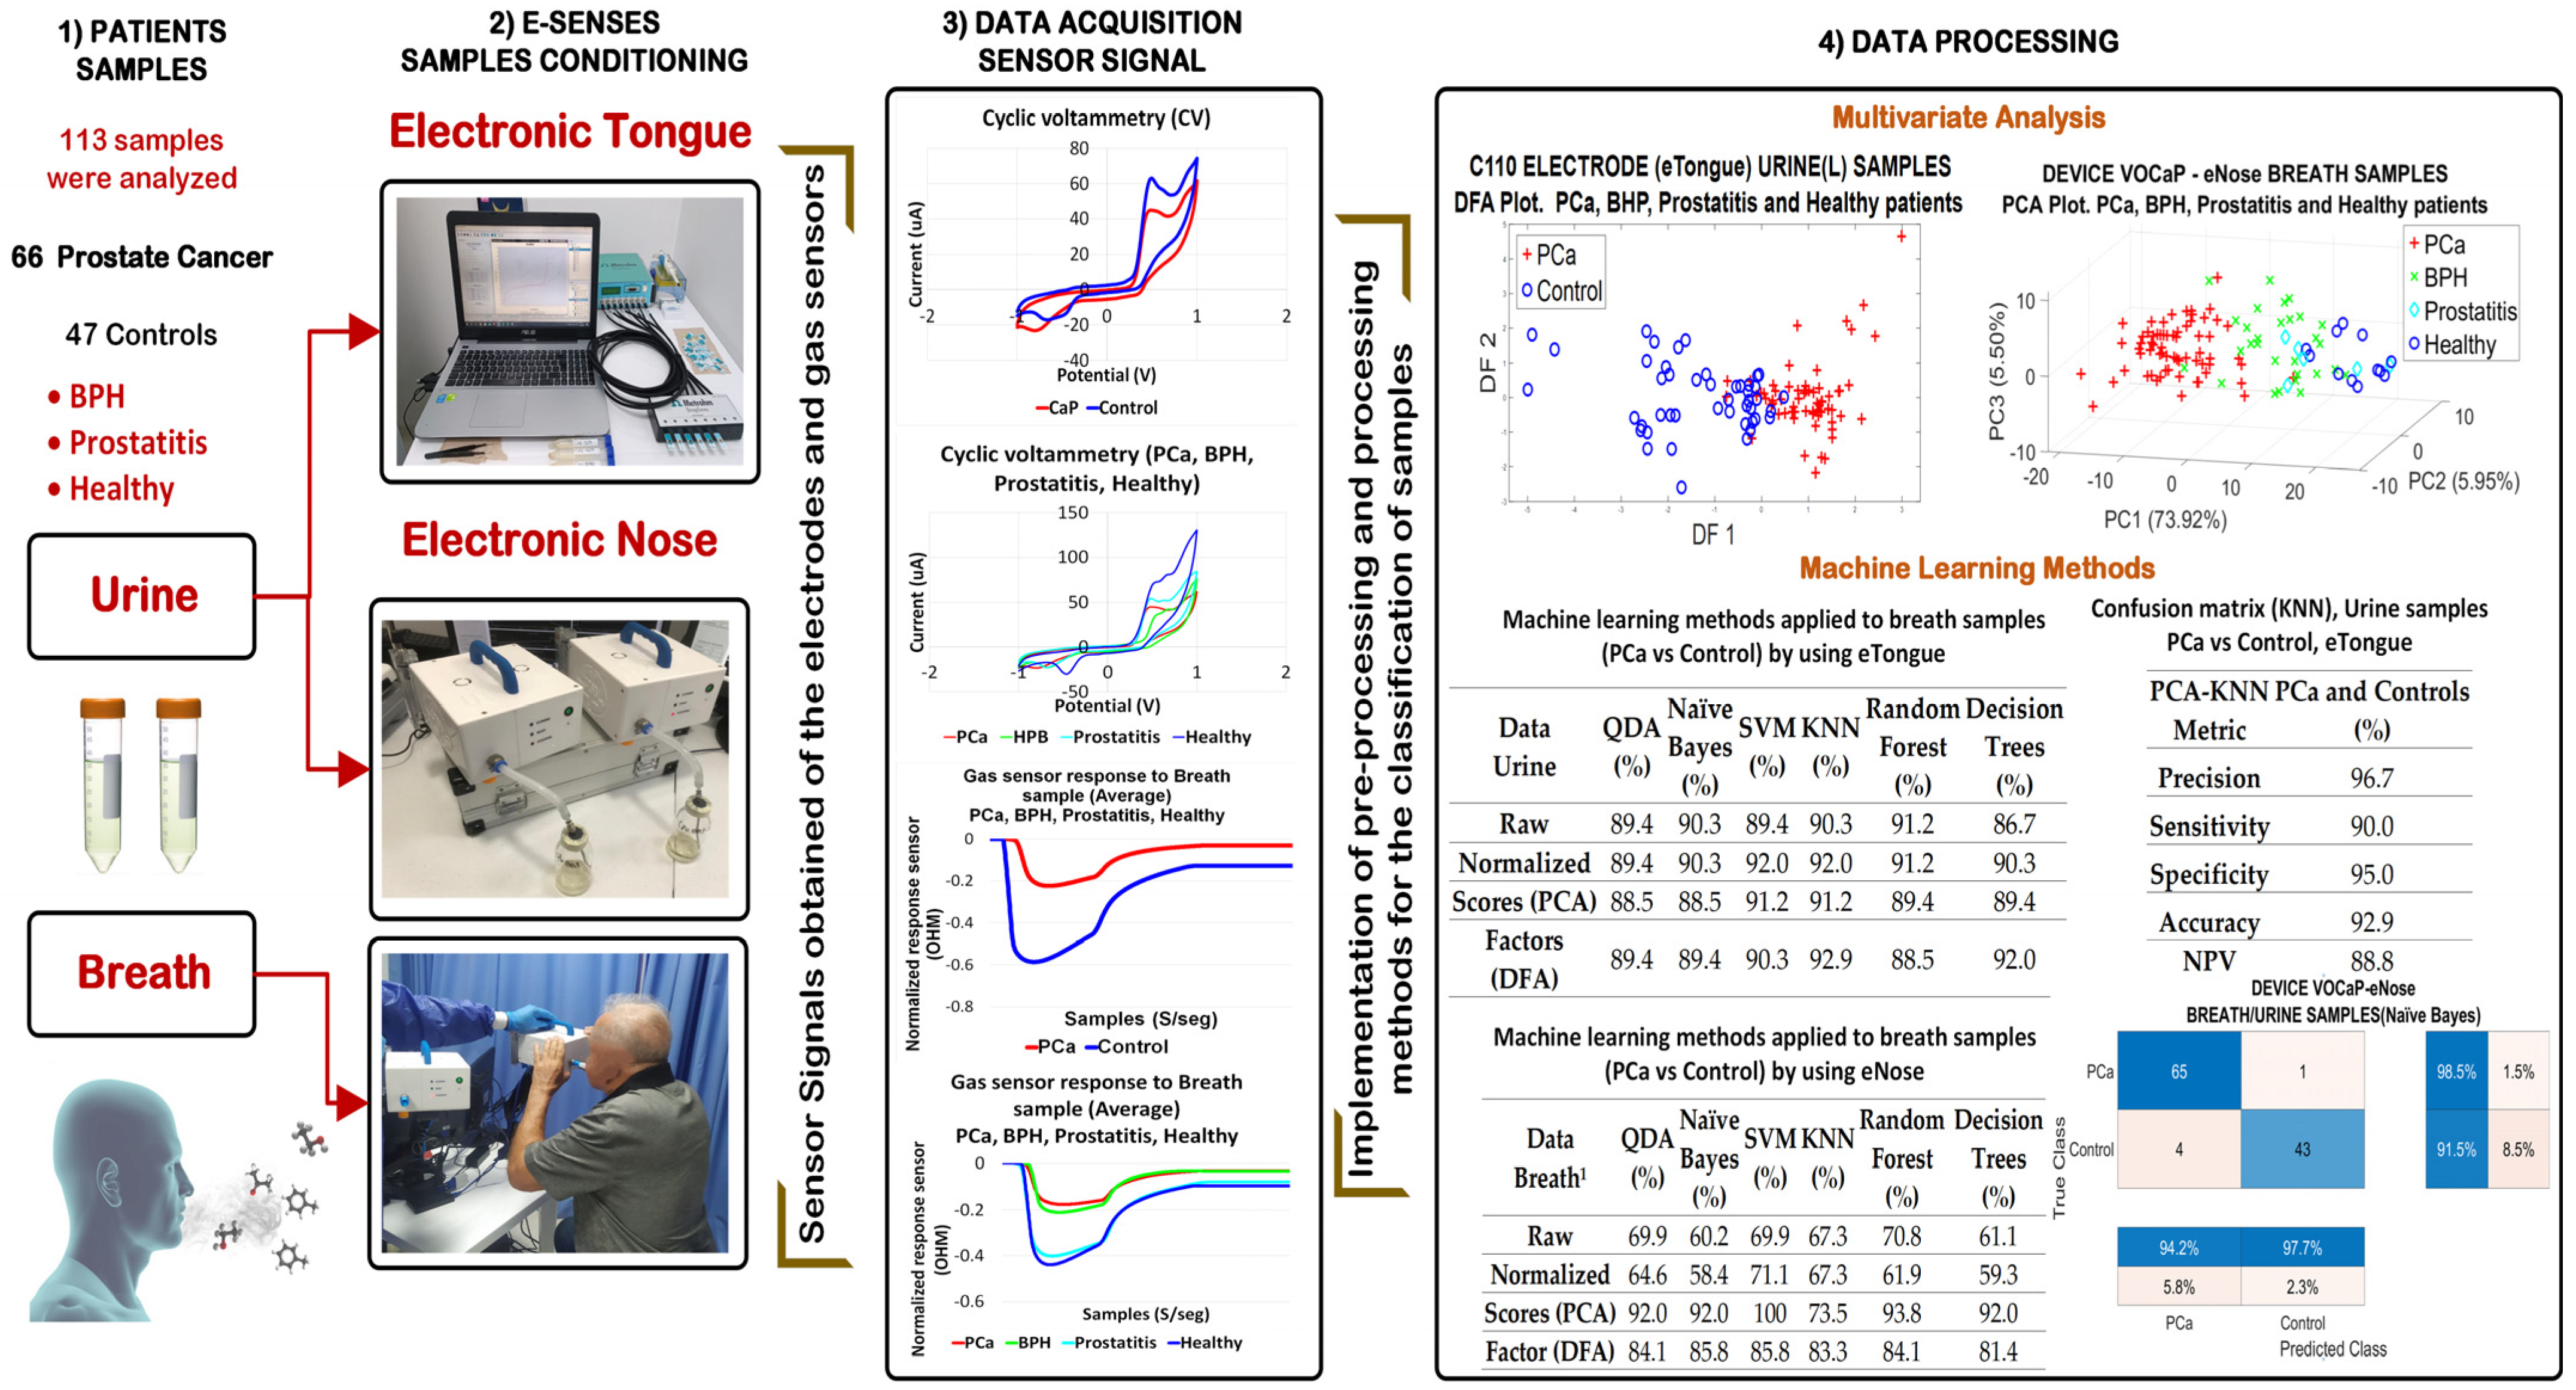
2.1. Measurement Protocol
2.1.1. Patient Selection
2.1.2. Collection and Storage of Samples
2.2. eNose-VOCaP
2.2.1. Measurement Protocol with eNose for Urine Samples
2.2.2. Measurement Protocol for Breath Samples Using the eNose
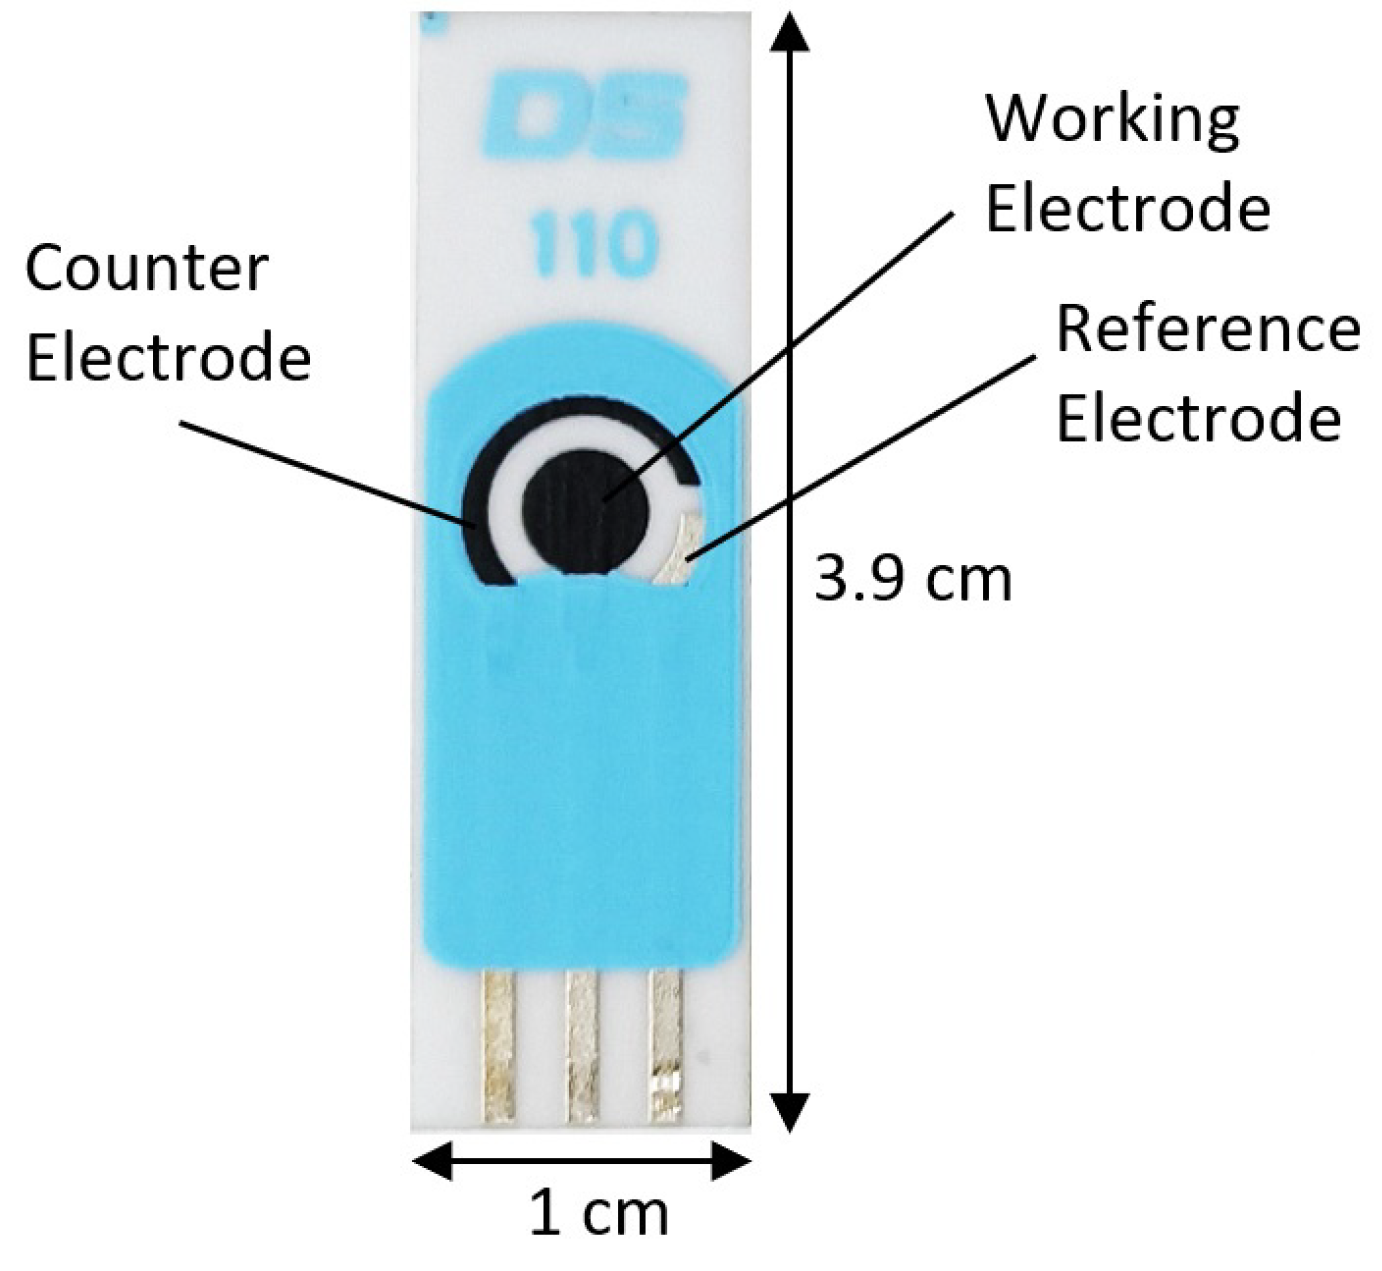
2.3. eTongue
2.4. Data Processing Methods
3. Results
3.1. Results with eNose (VOCaP)
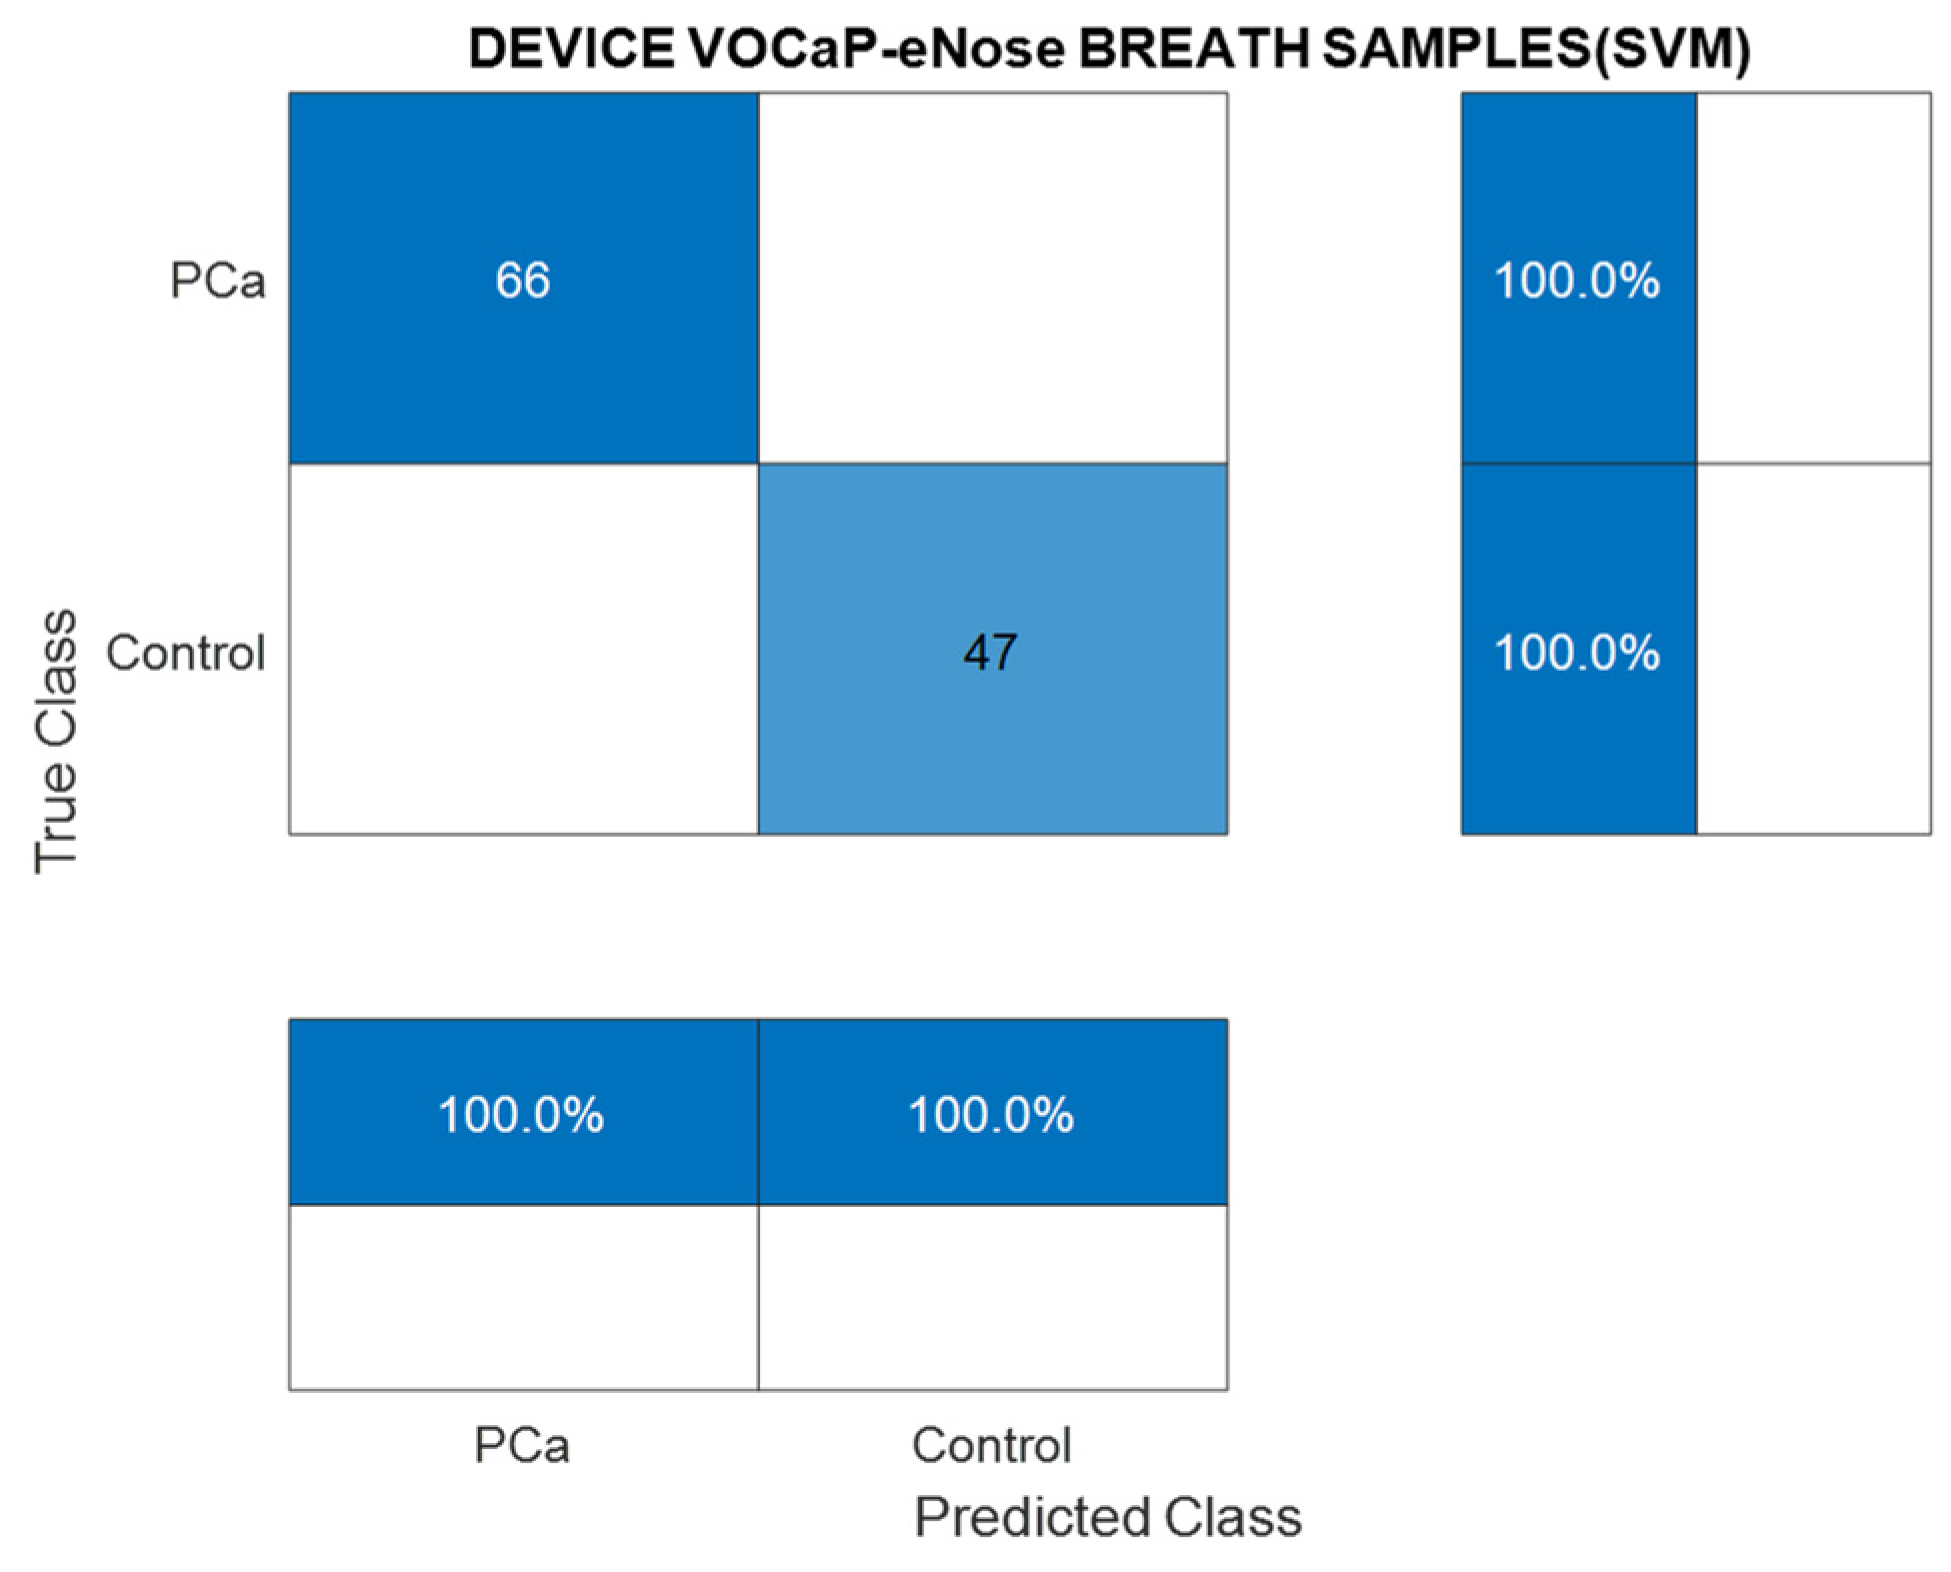
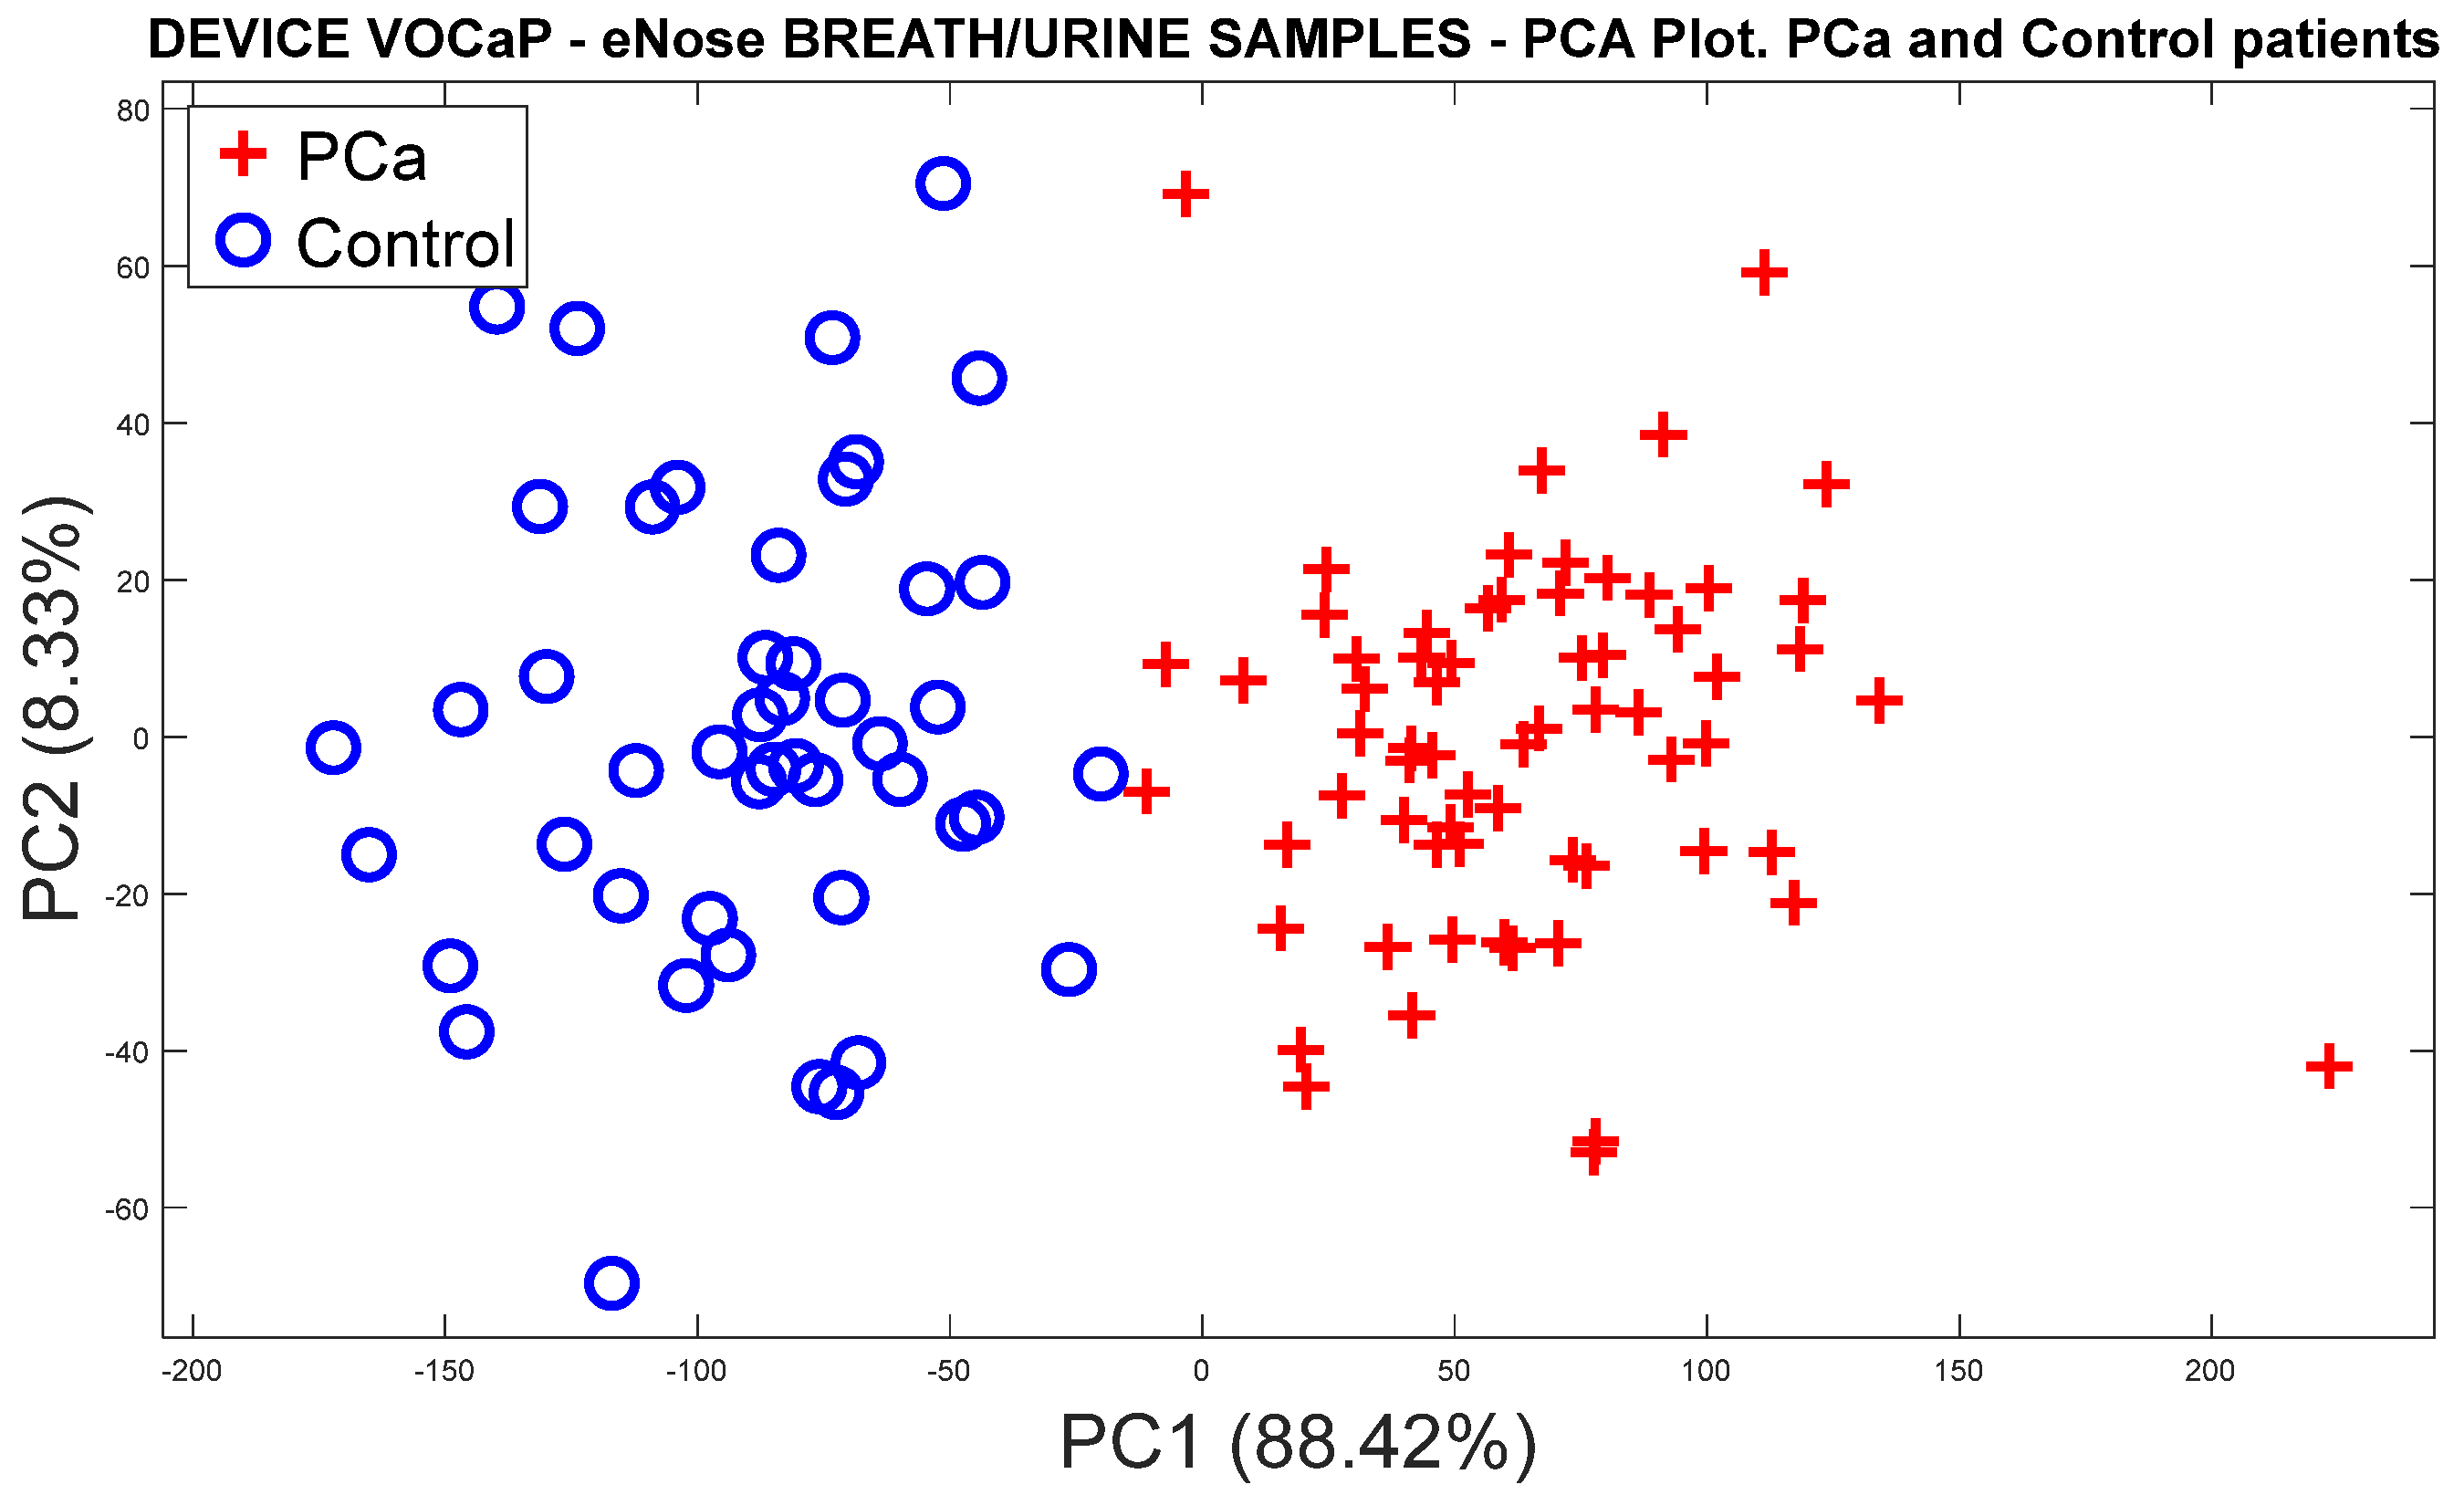
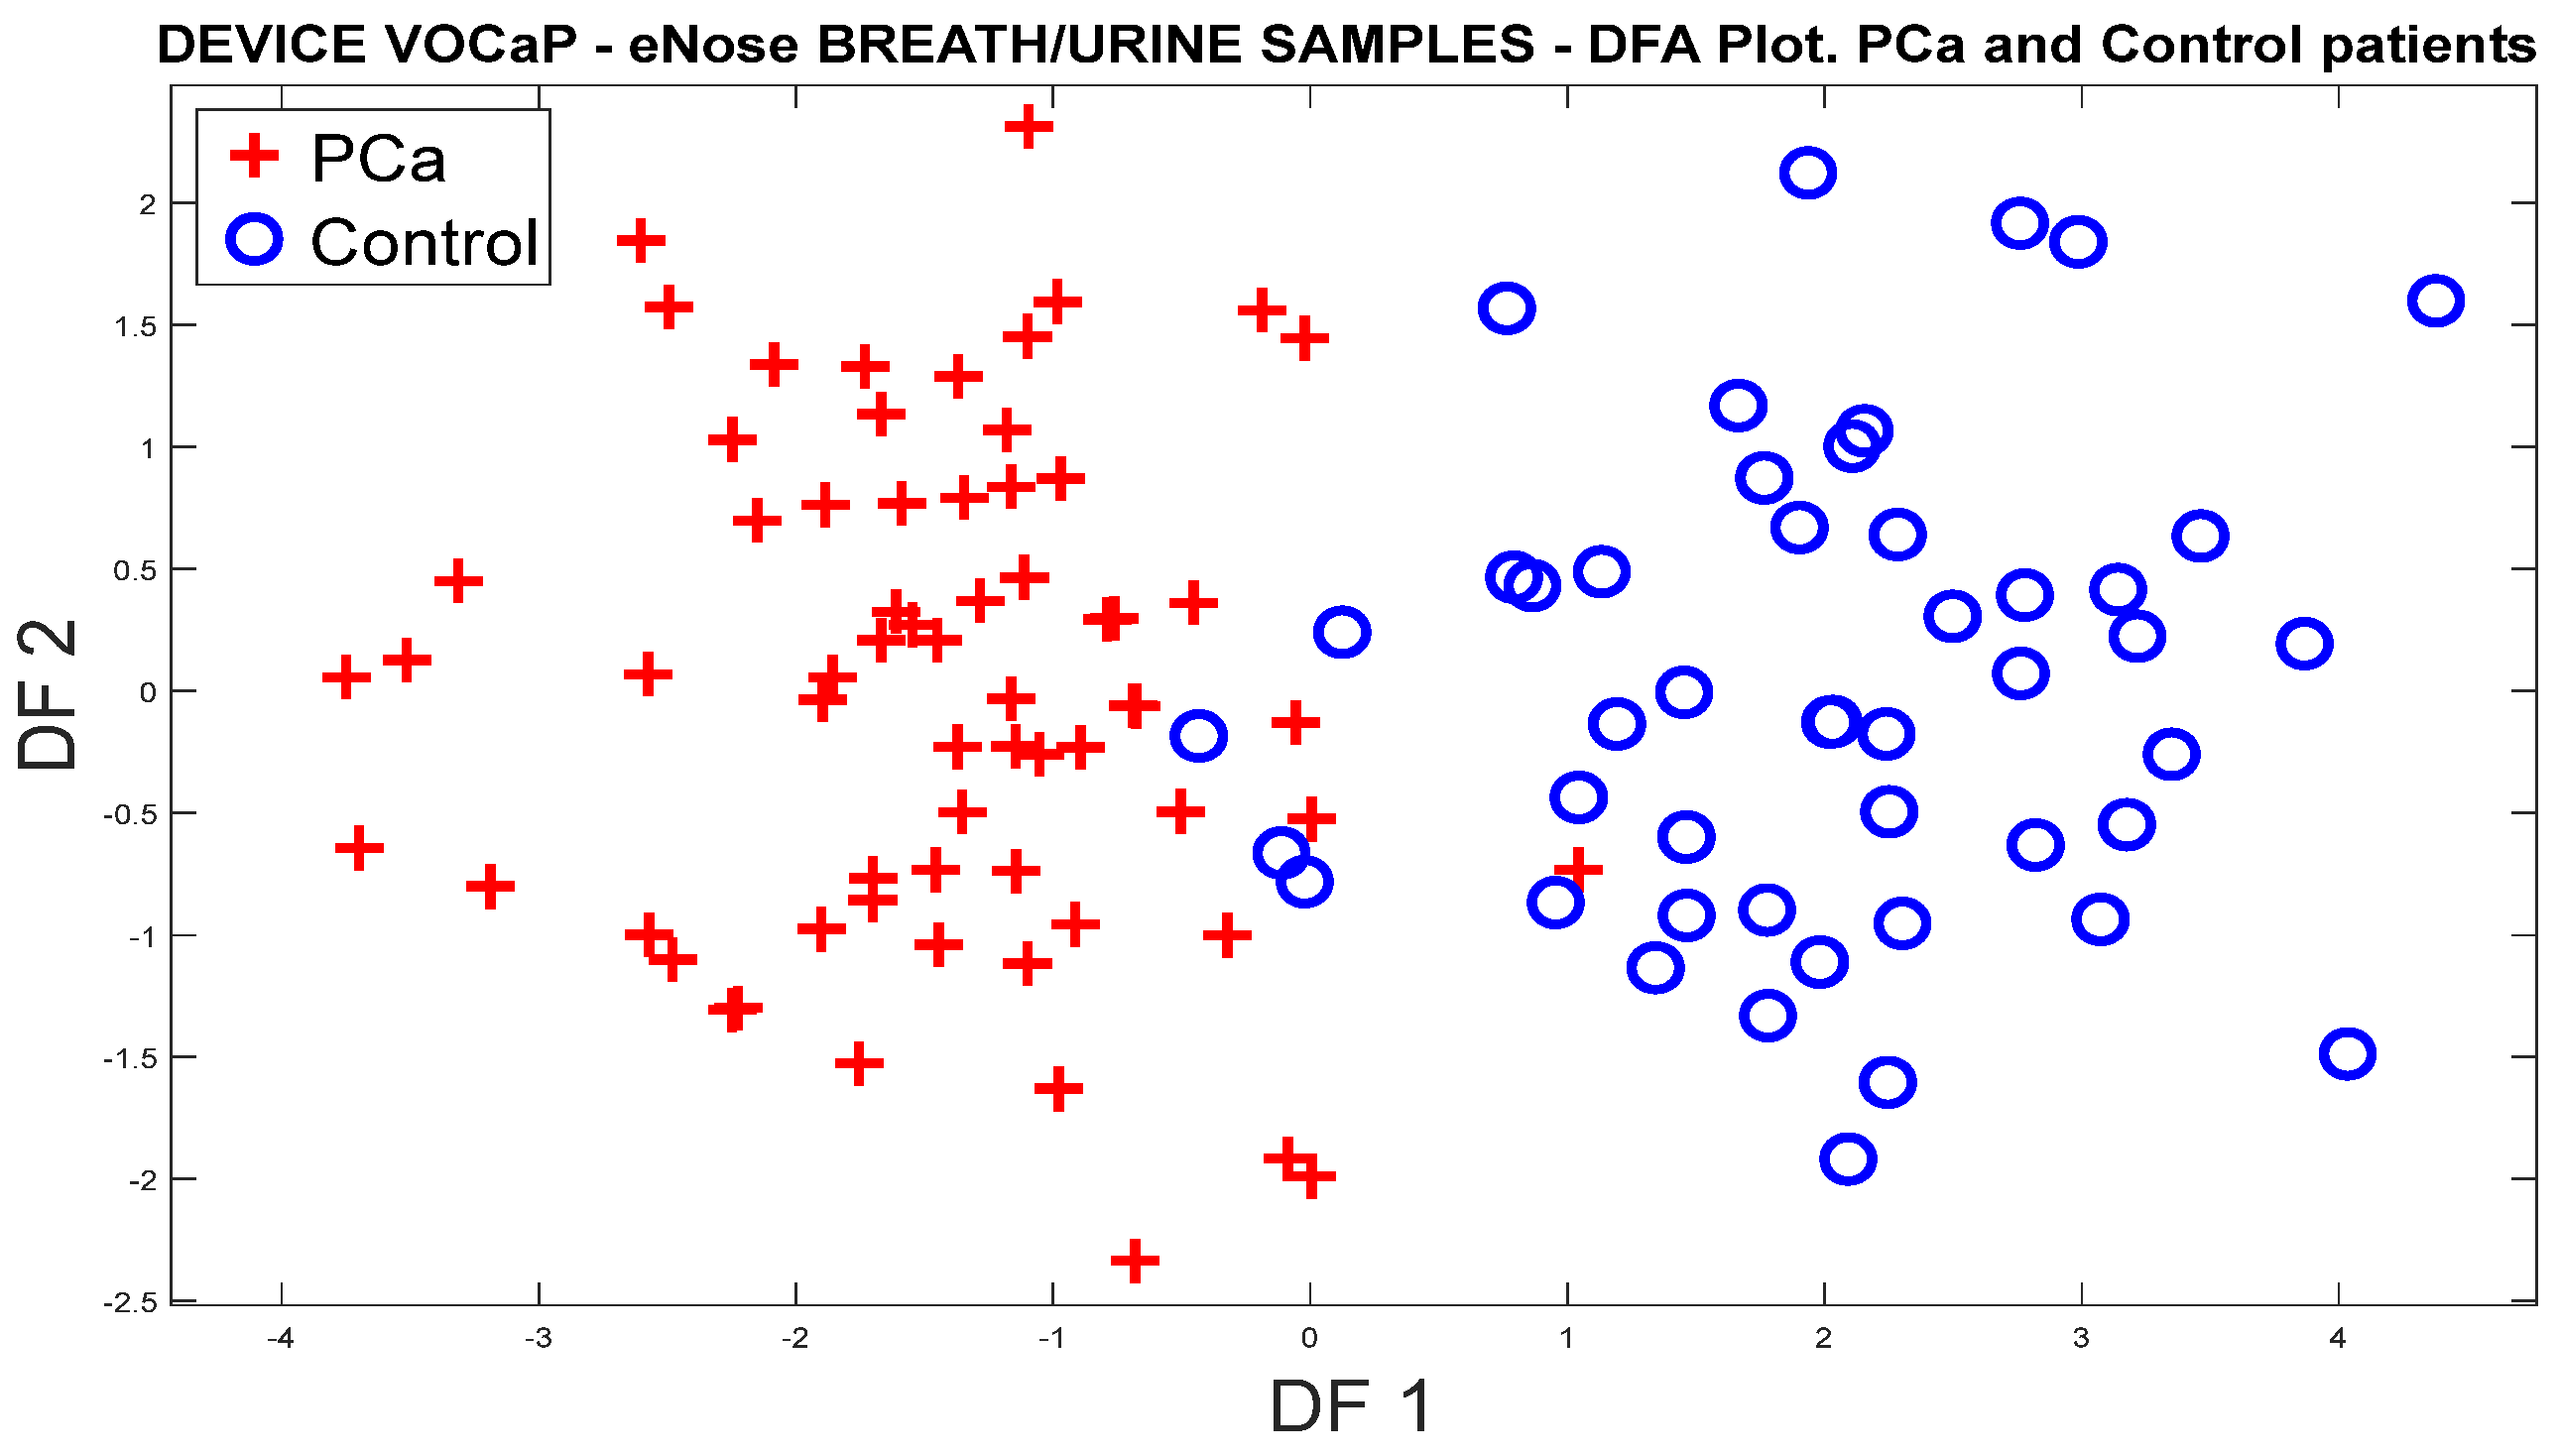
3.1.1. Analysis of Breath Samples with eNose (PCa vs. controls)
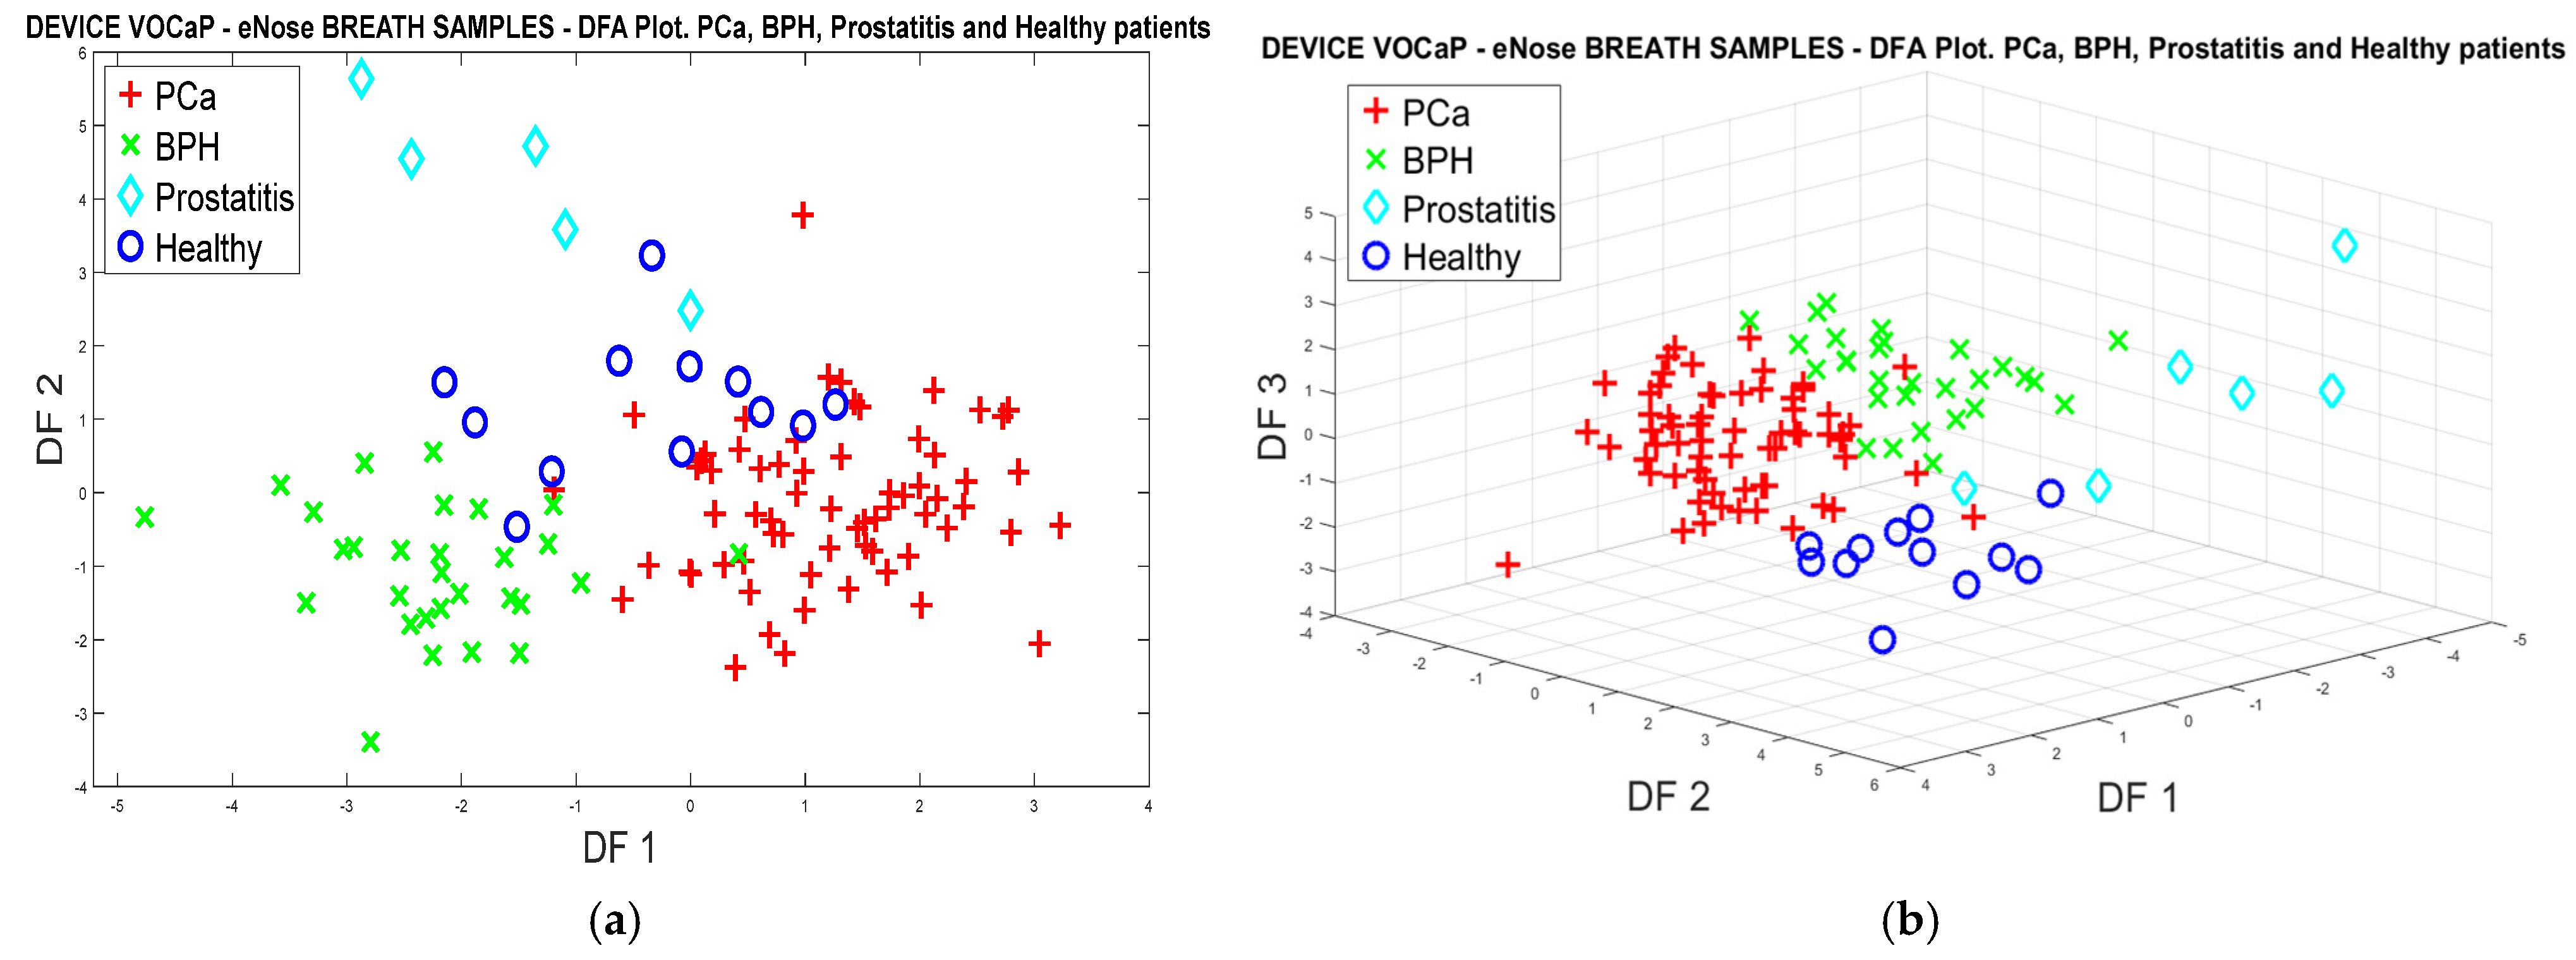
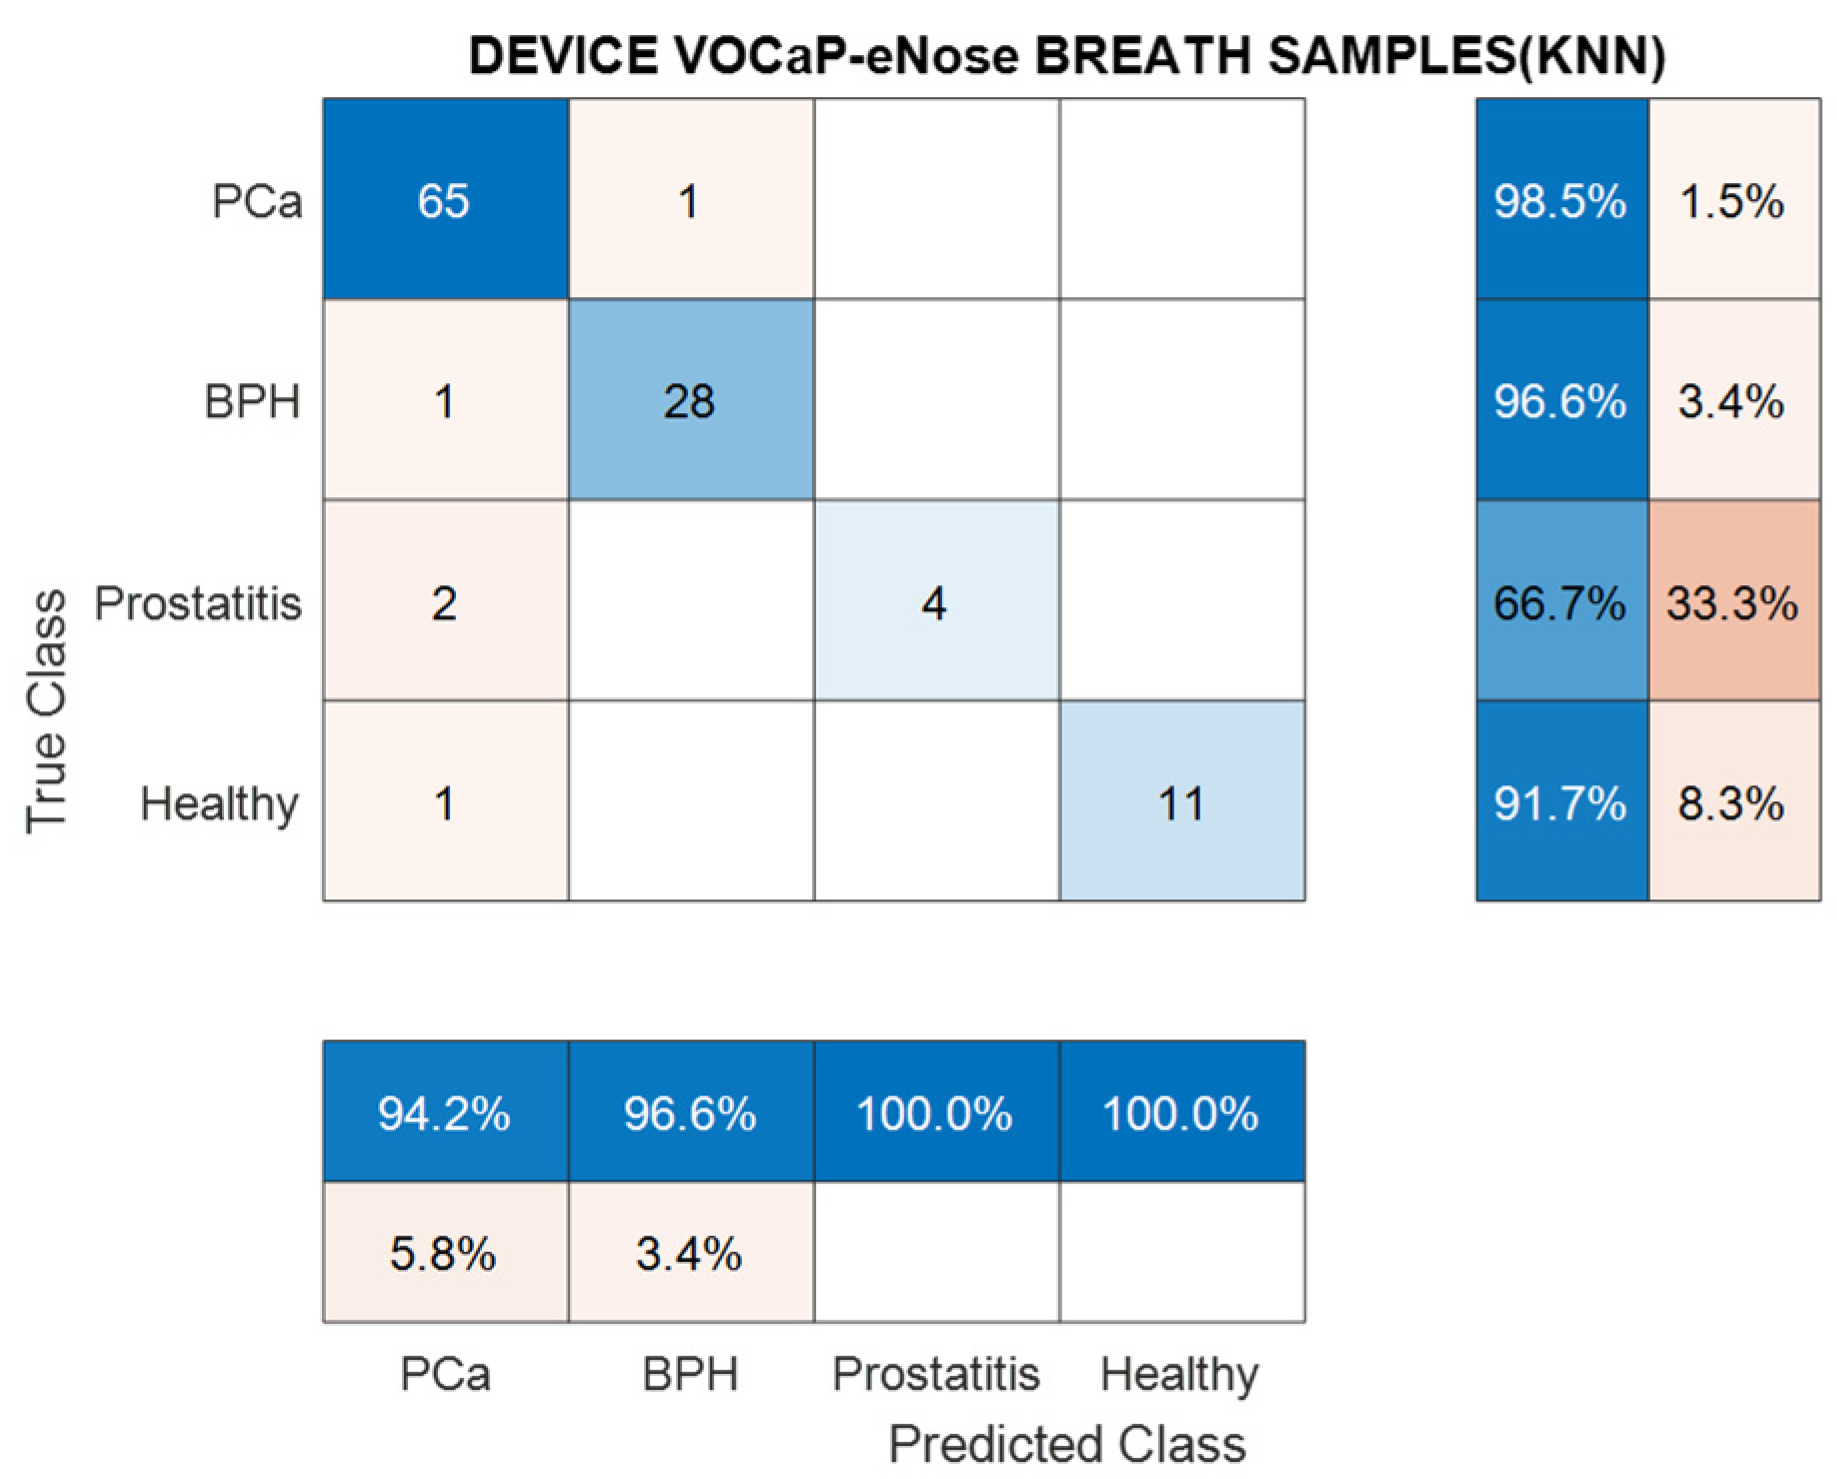
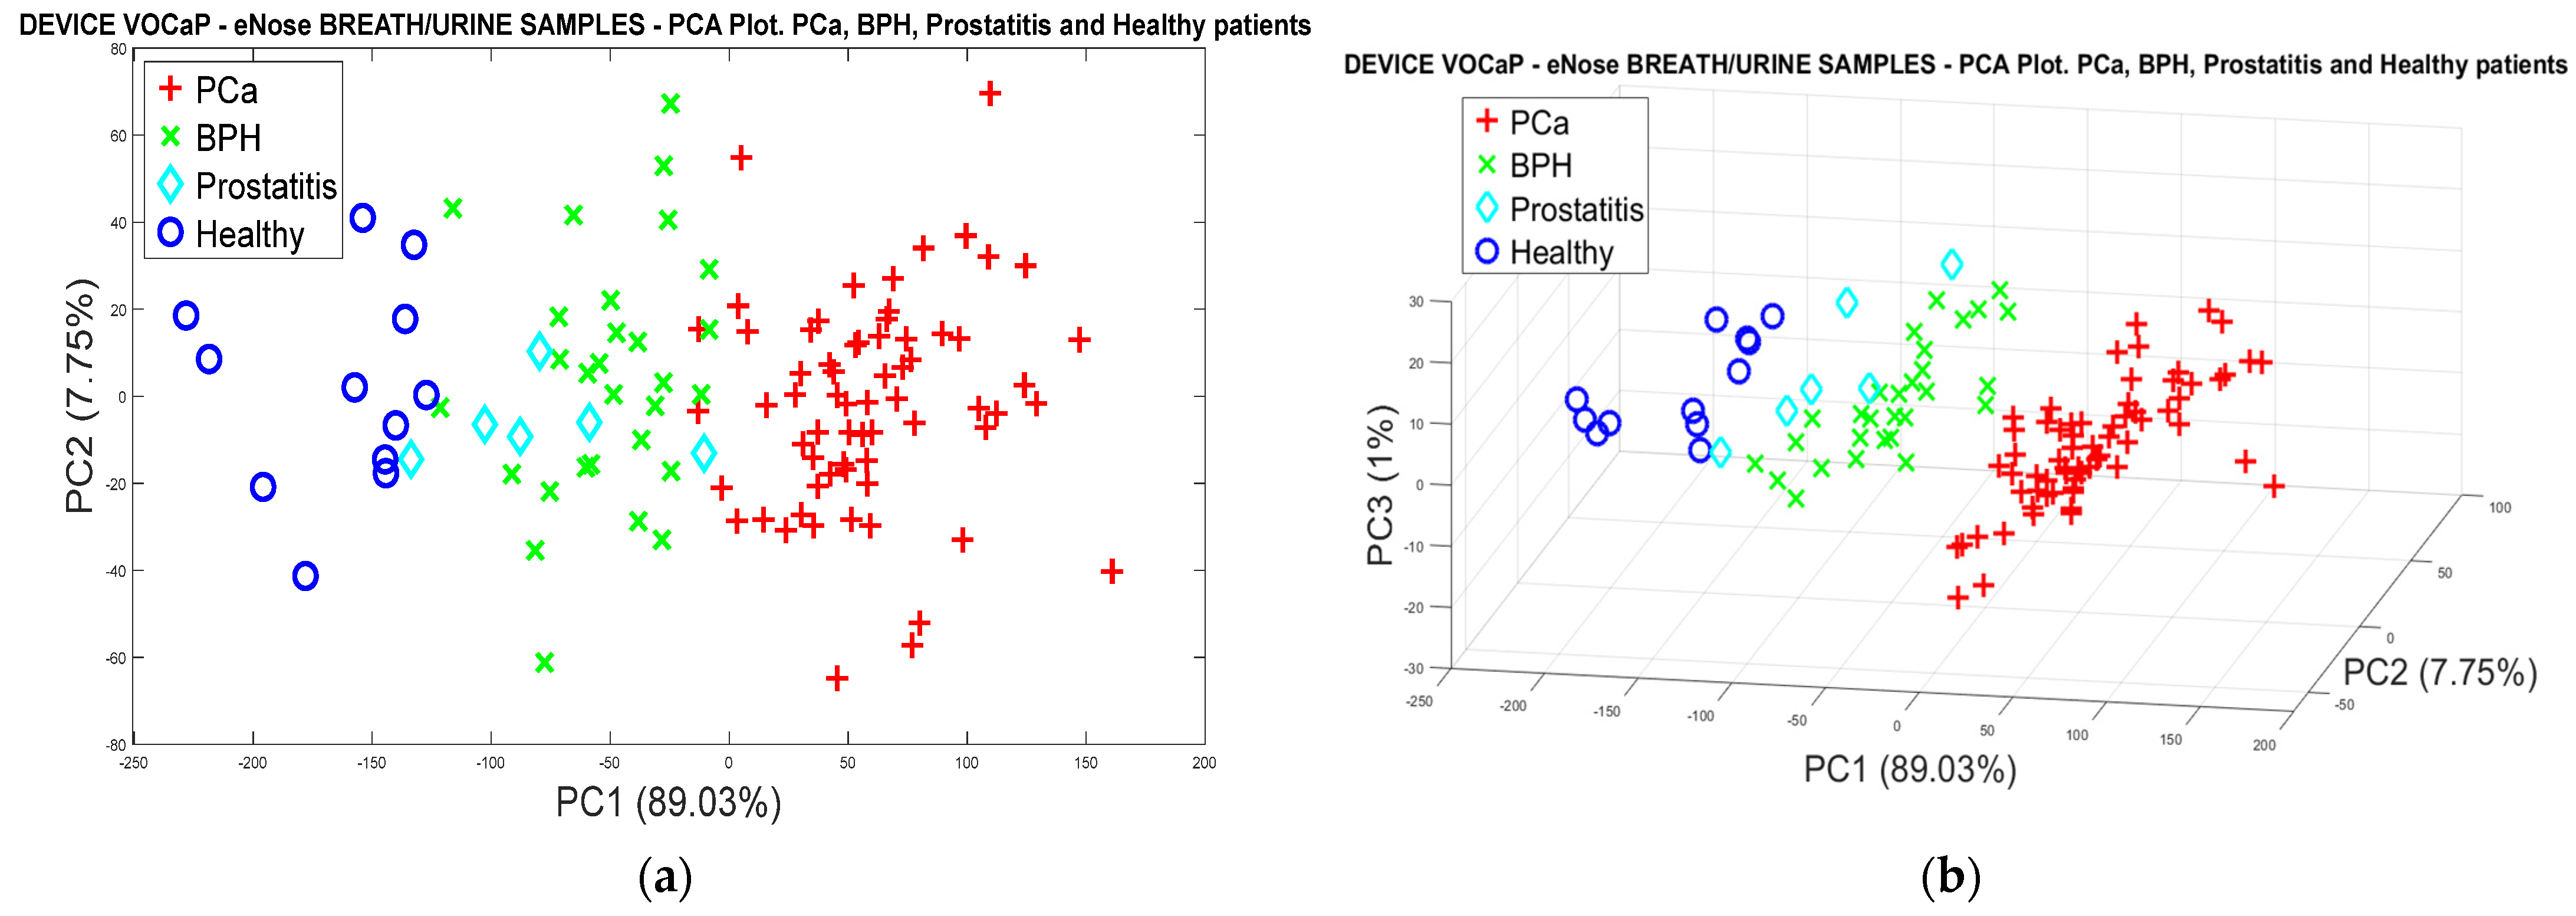
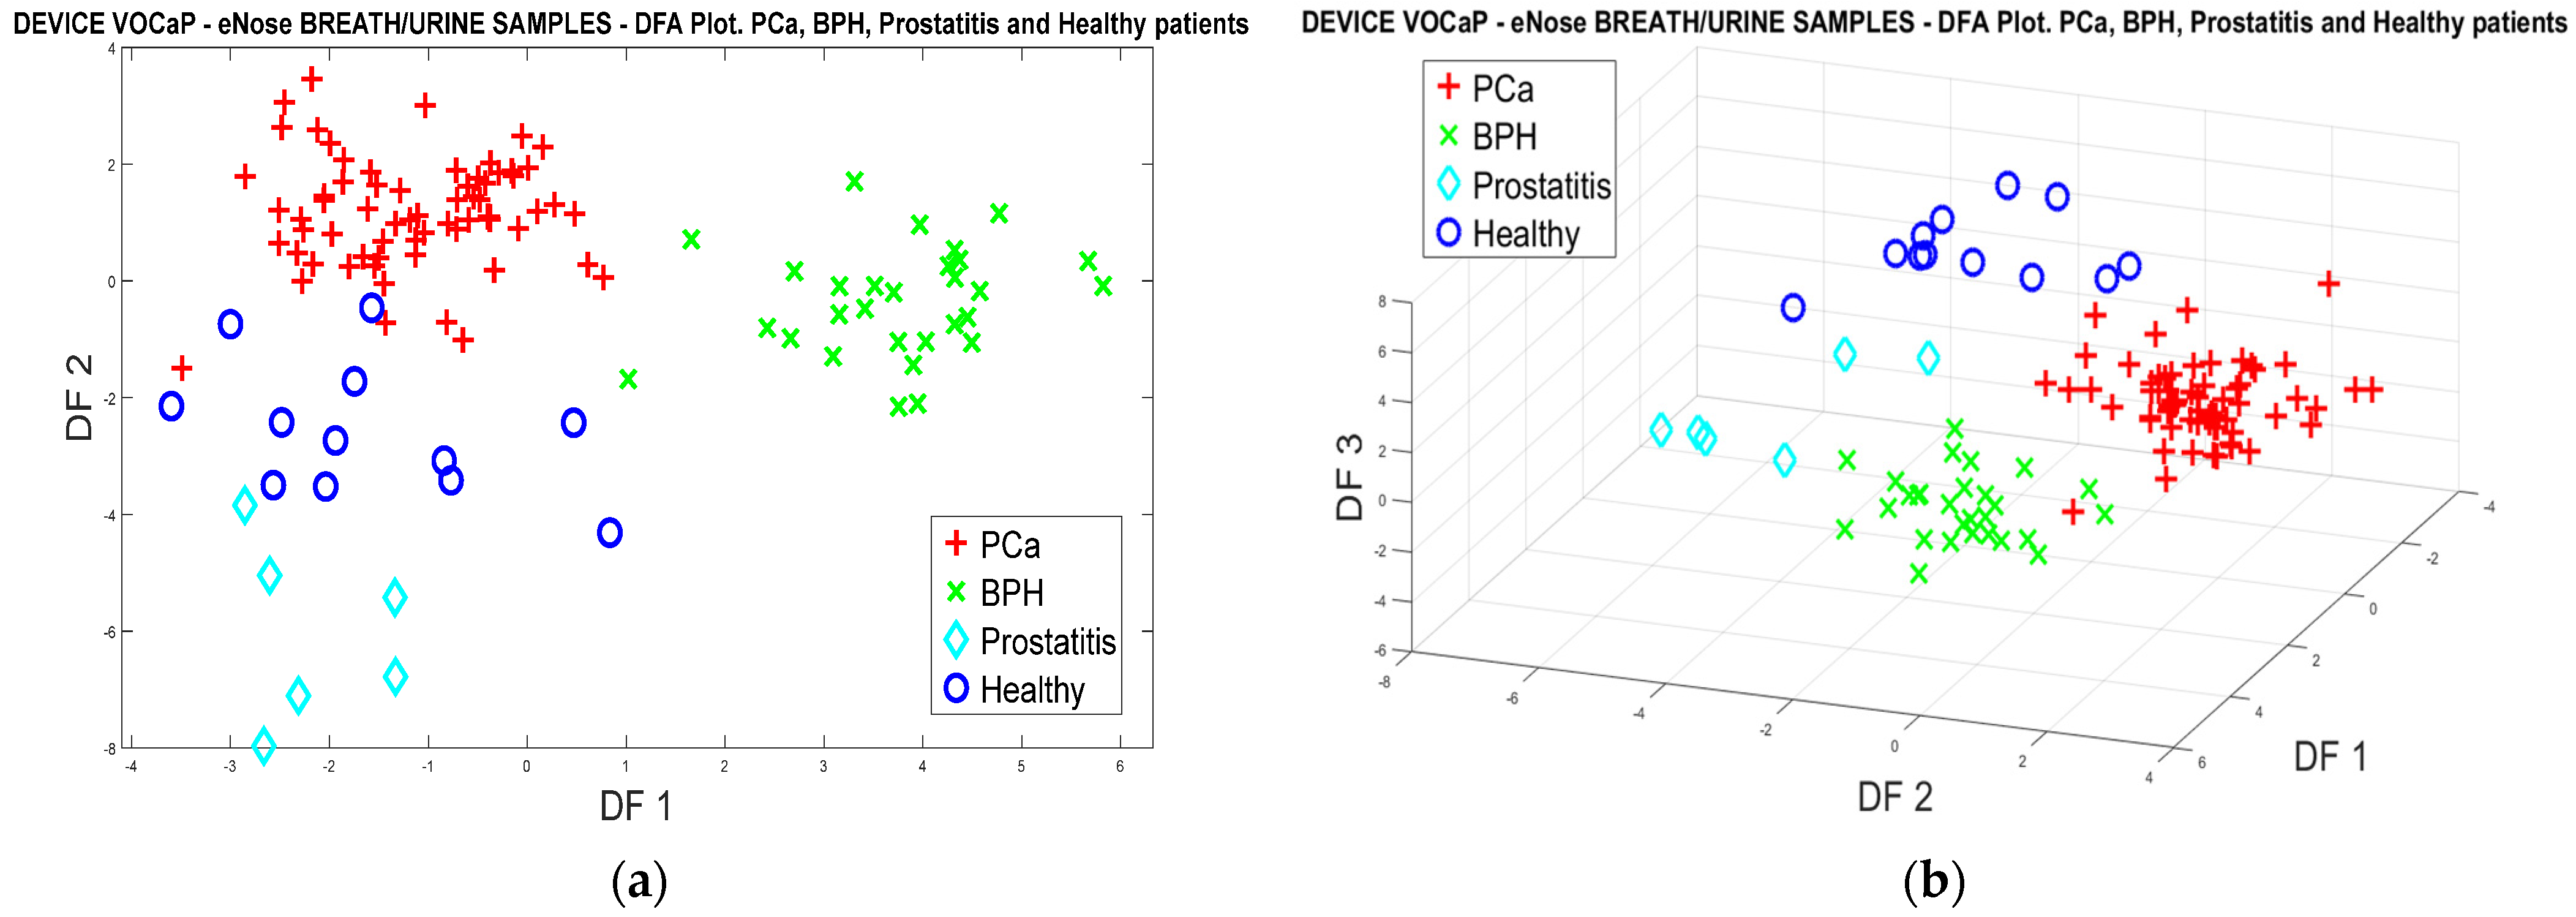
3.1.2. PCa vs. BPH, Prostatitis, and Healthy Patients
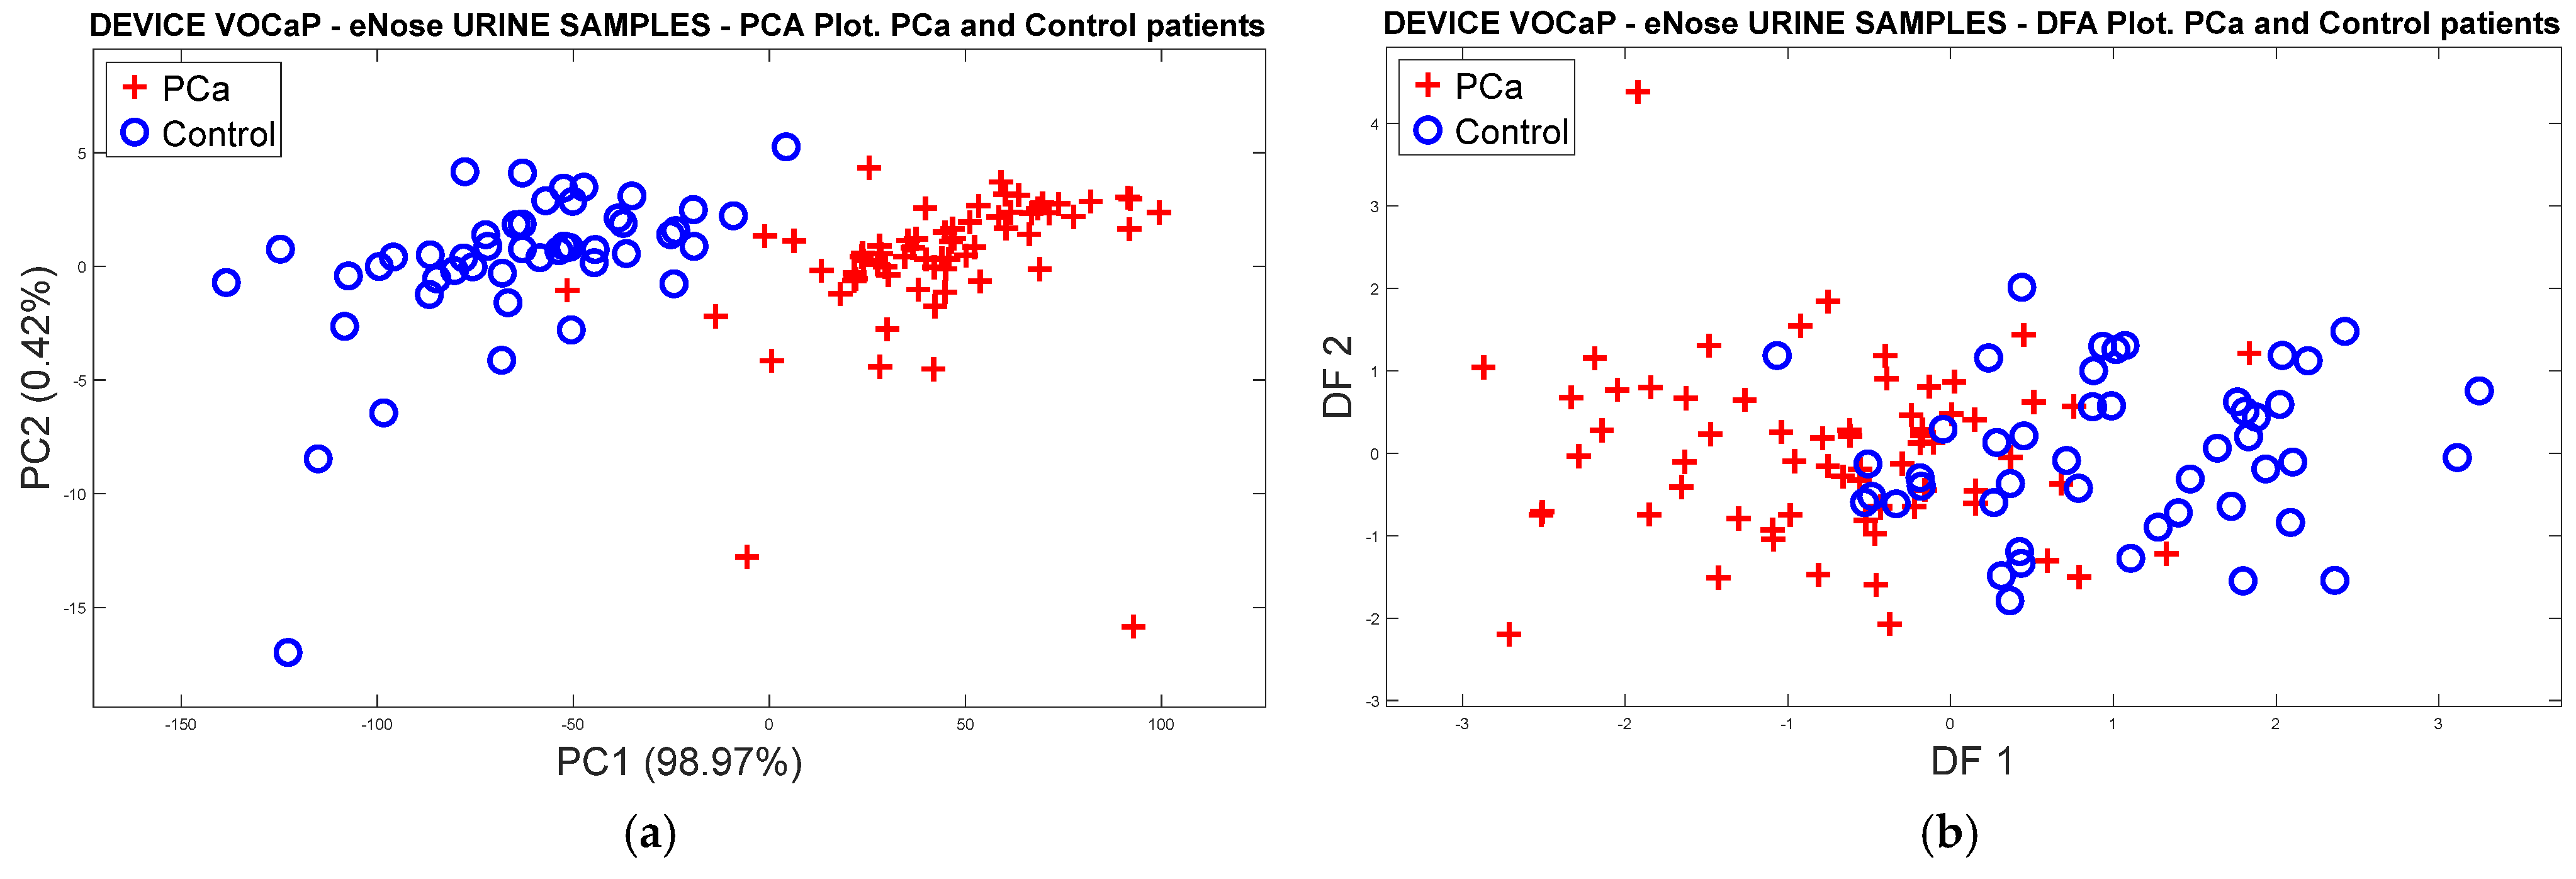
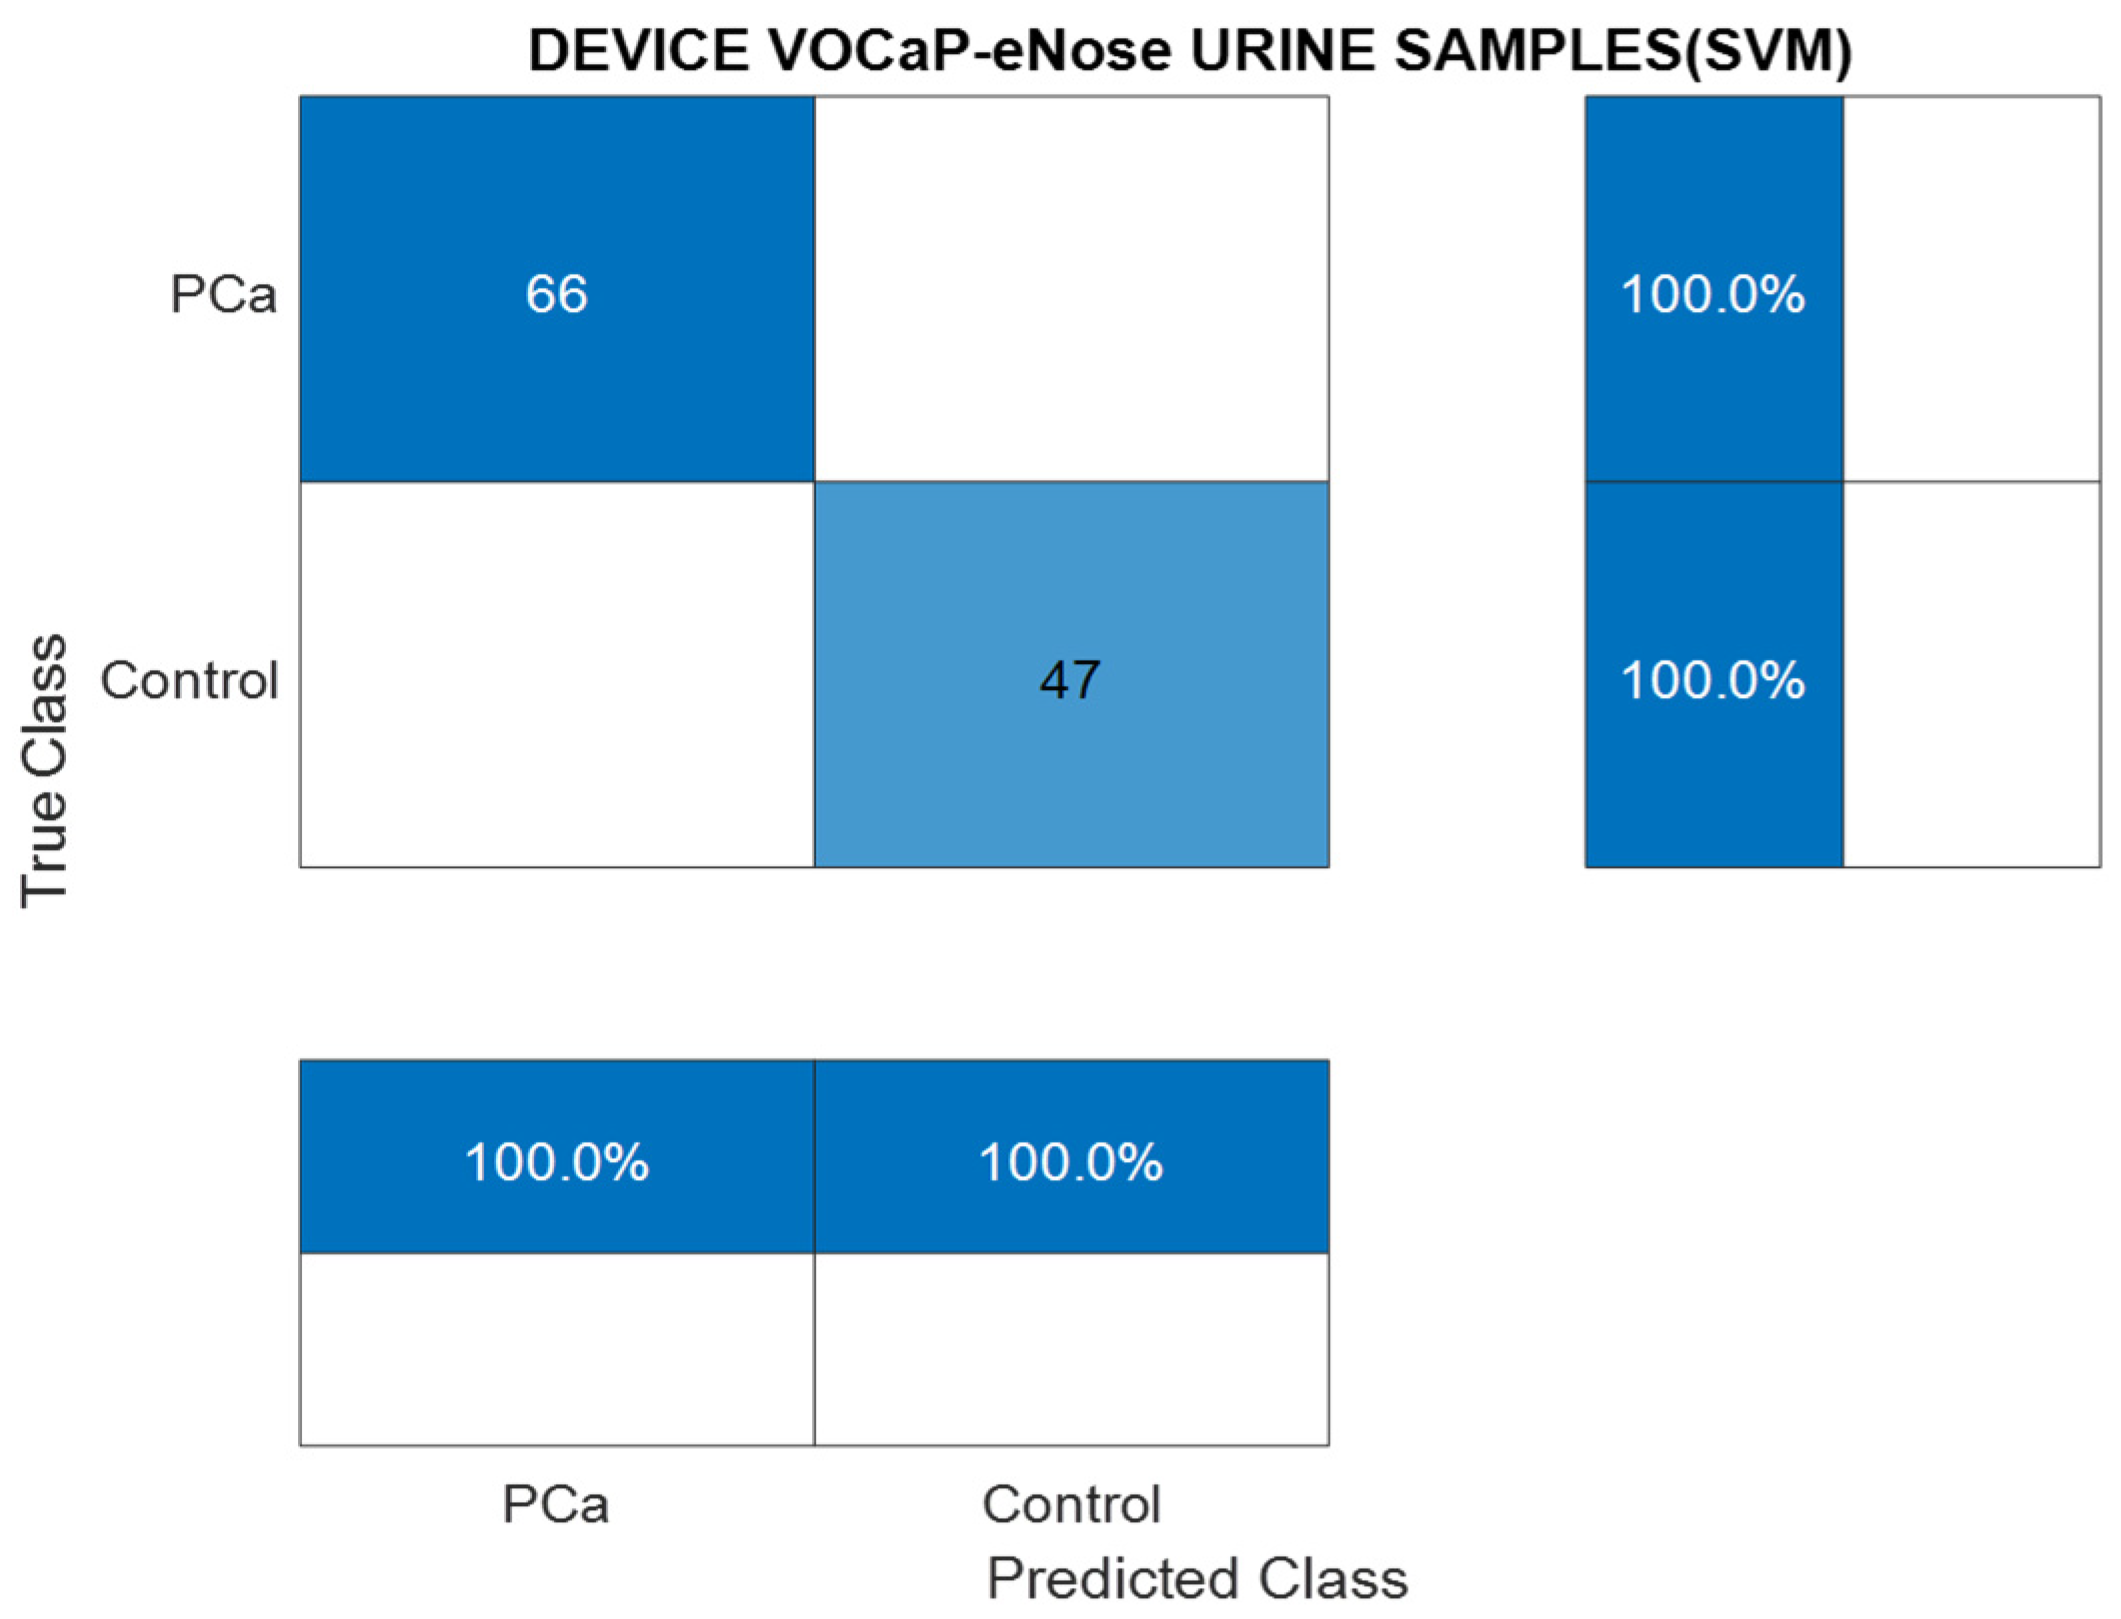
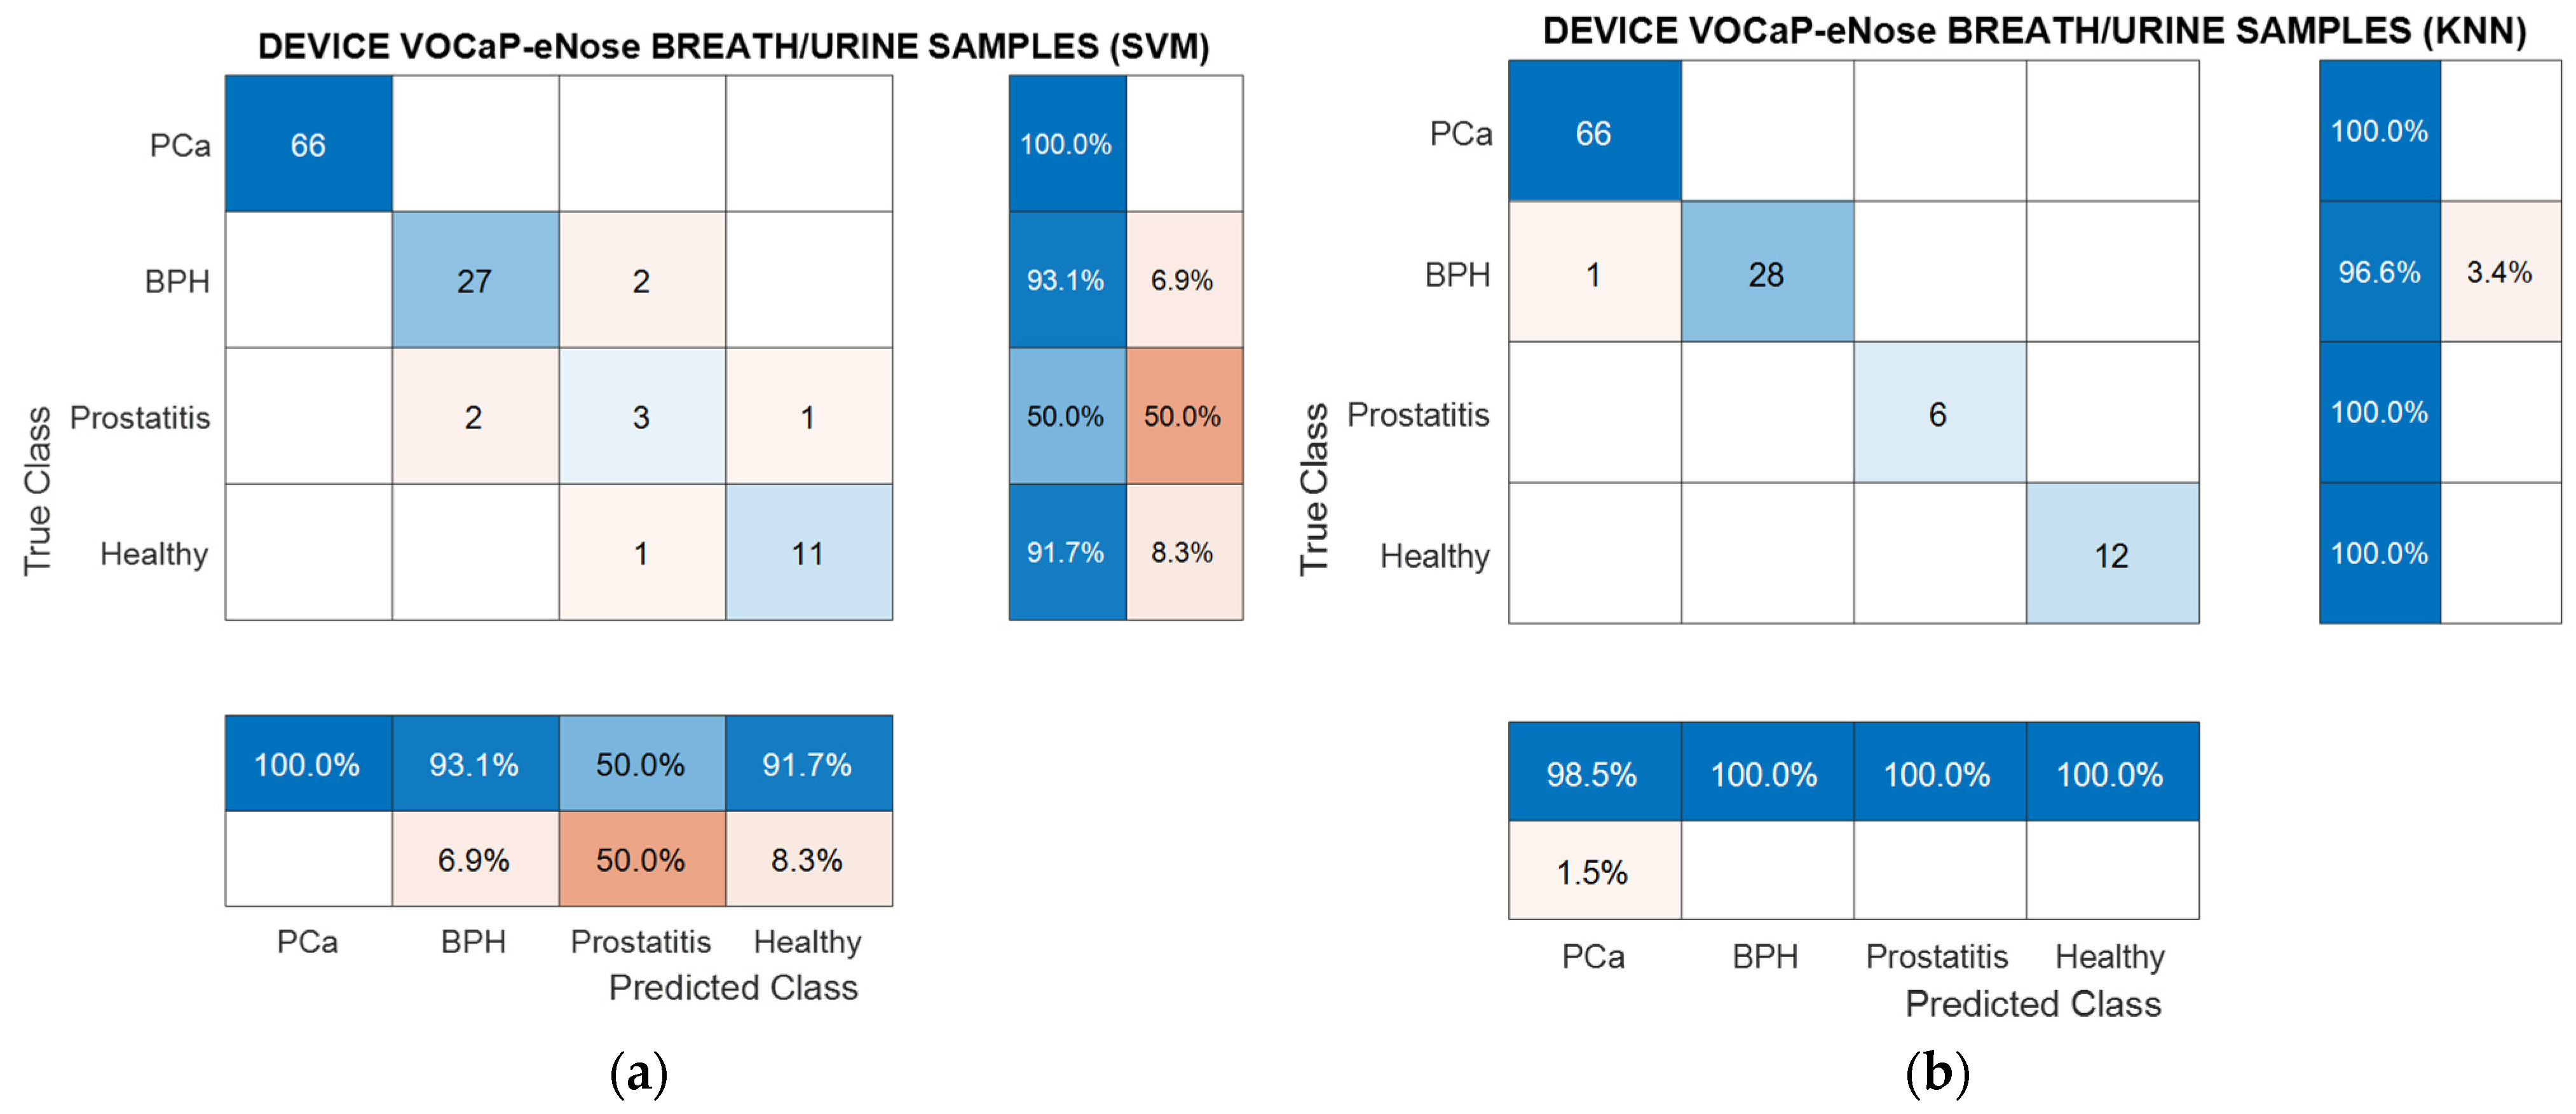
3.1.3. Analysis of Urine Samples with the eNose Device
PCa vs. Control
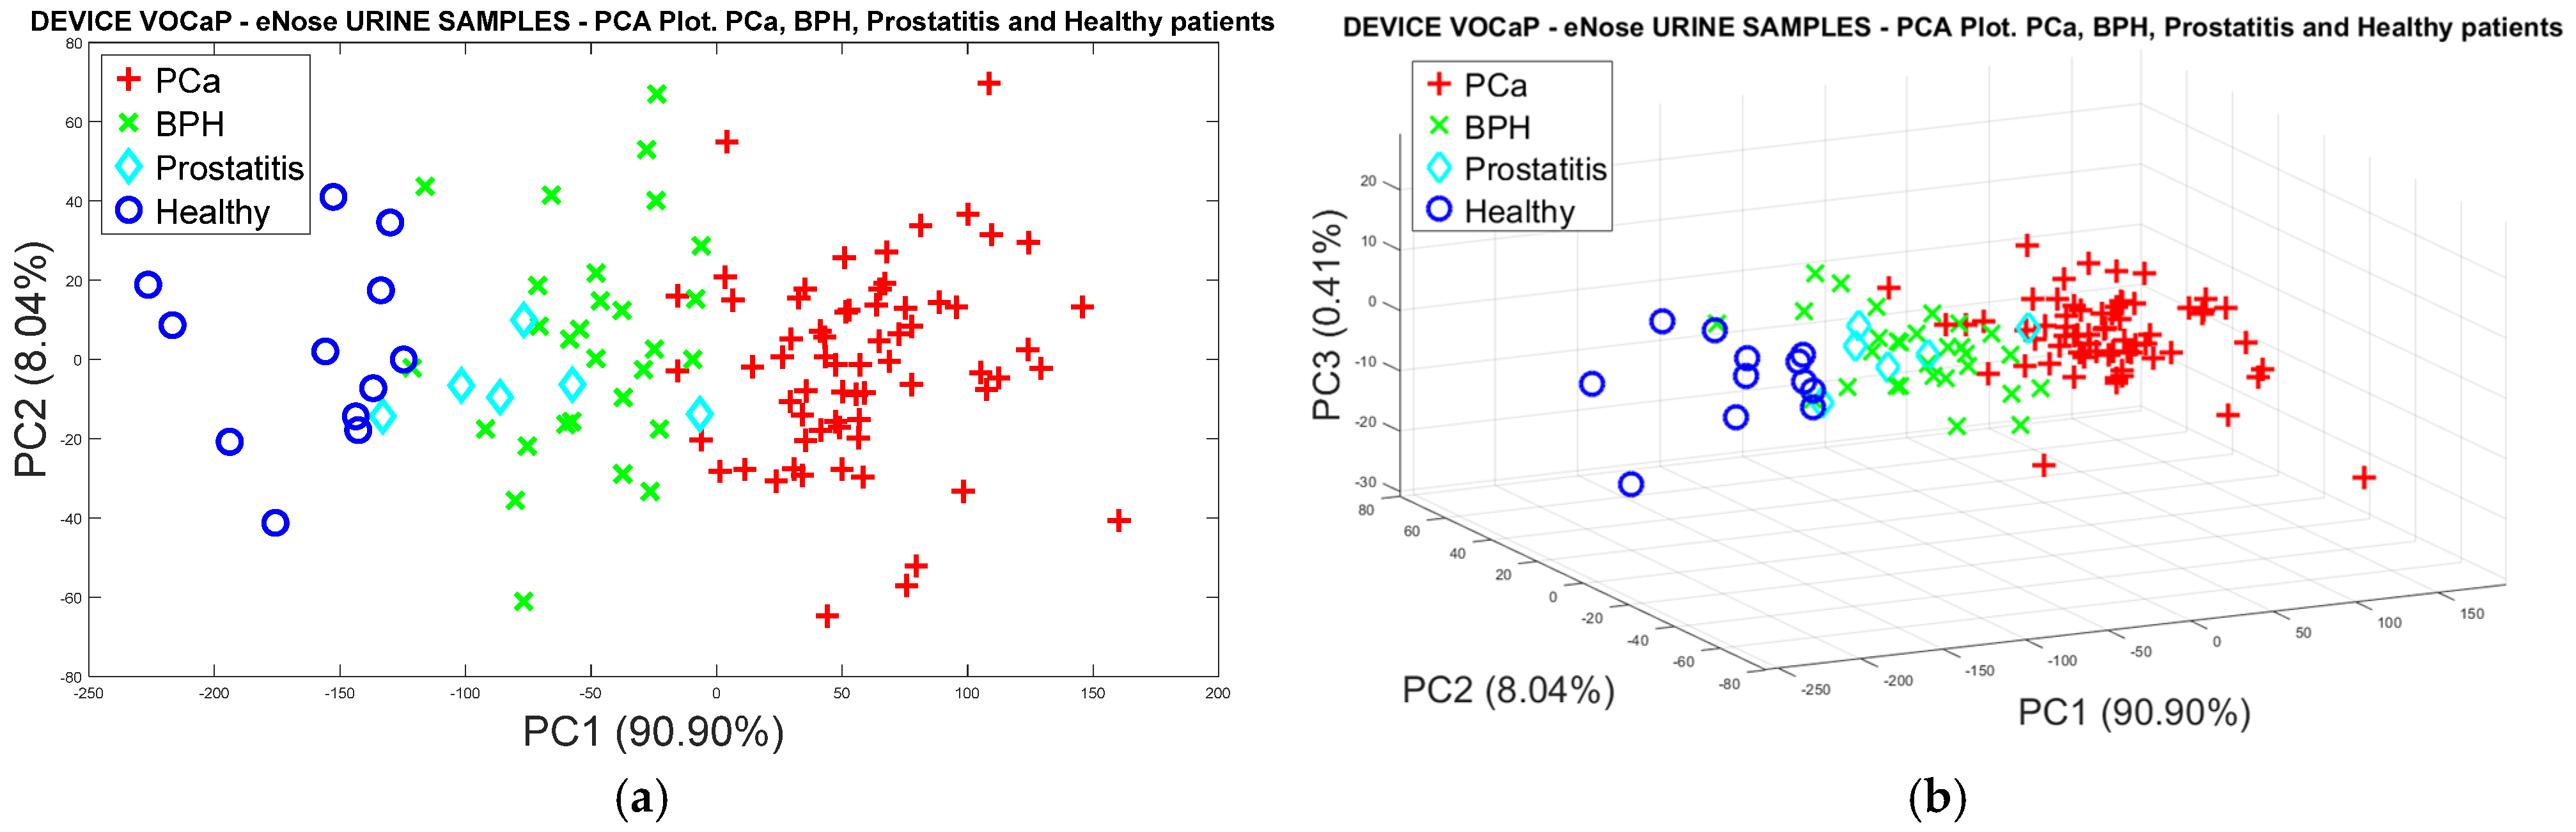
Pca vs. (BPH, Prostatitis, Healthy)
3.1.4. Data Fusion Analysis of Breath and Urine Samples Acquired with the eNose Device
PCa vs. Control
PCa vs. BPH, Prostatitis, and Healthy Patients
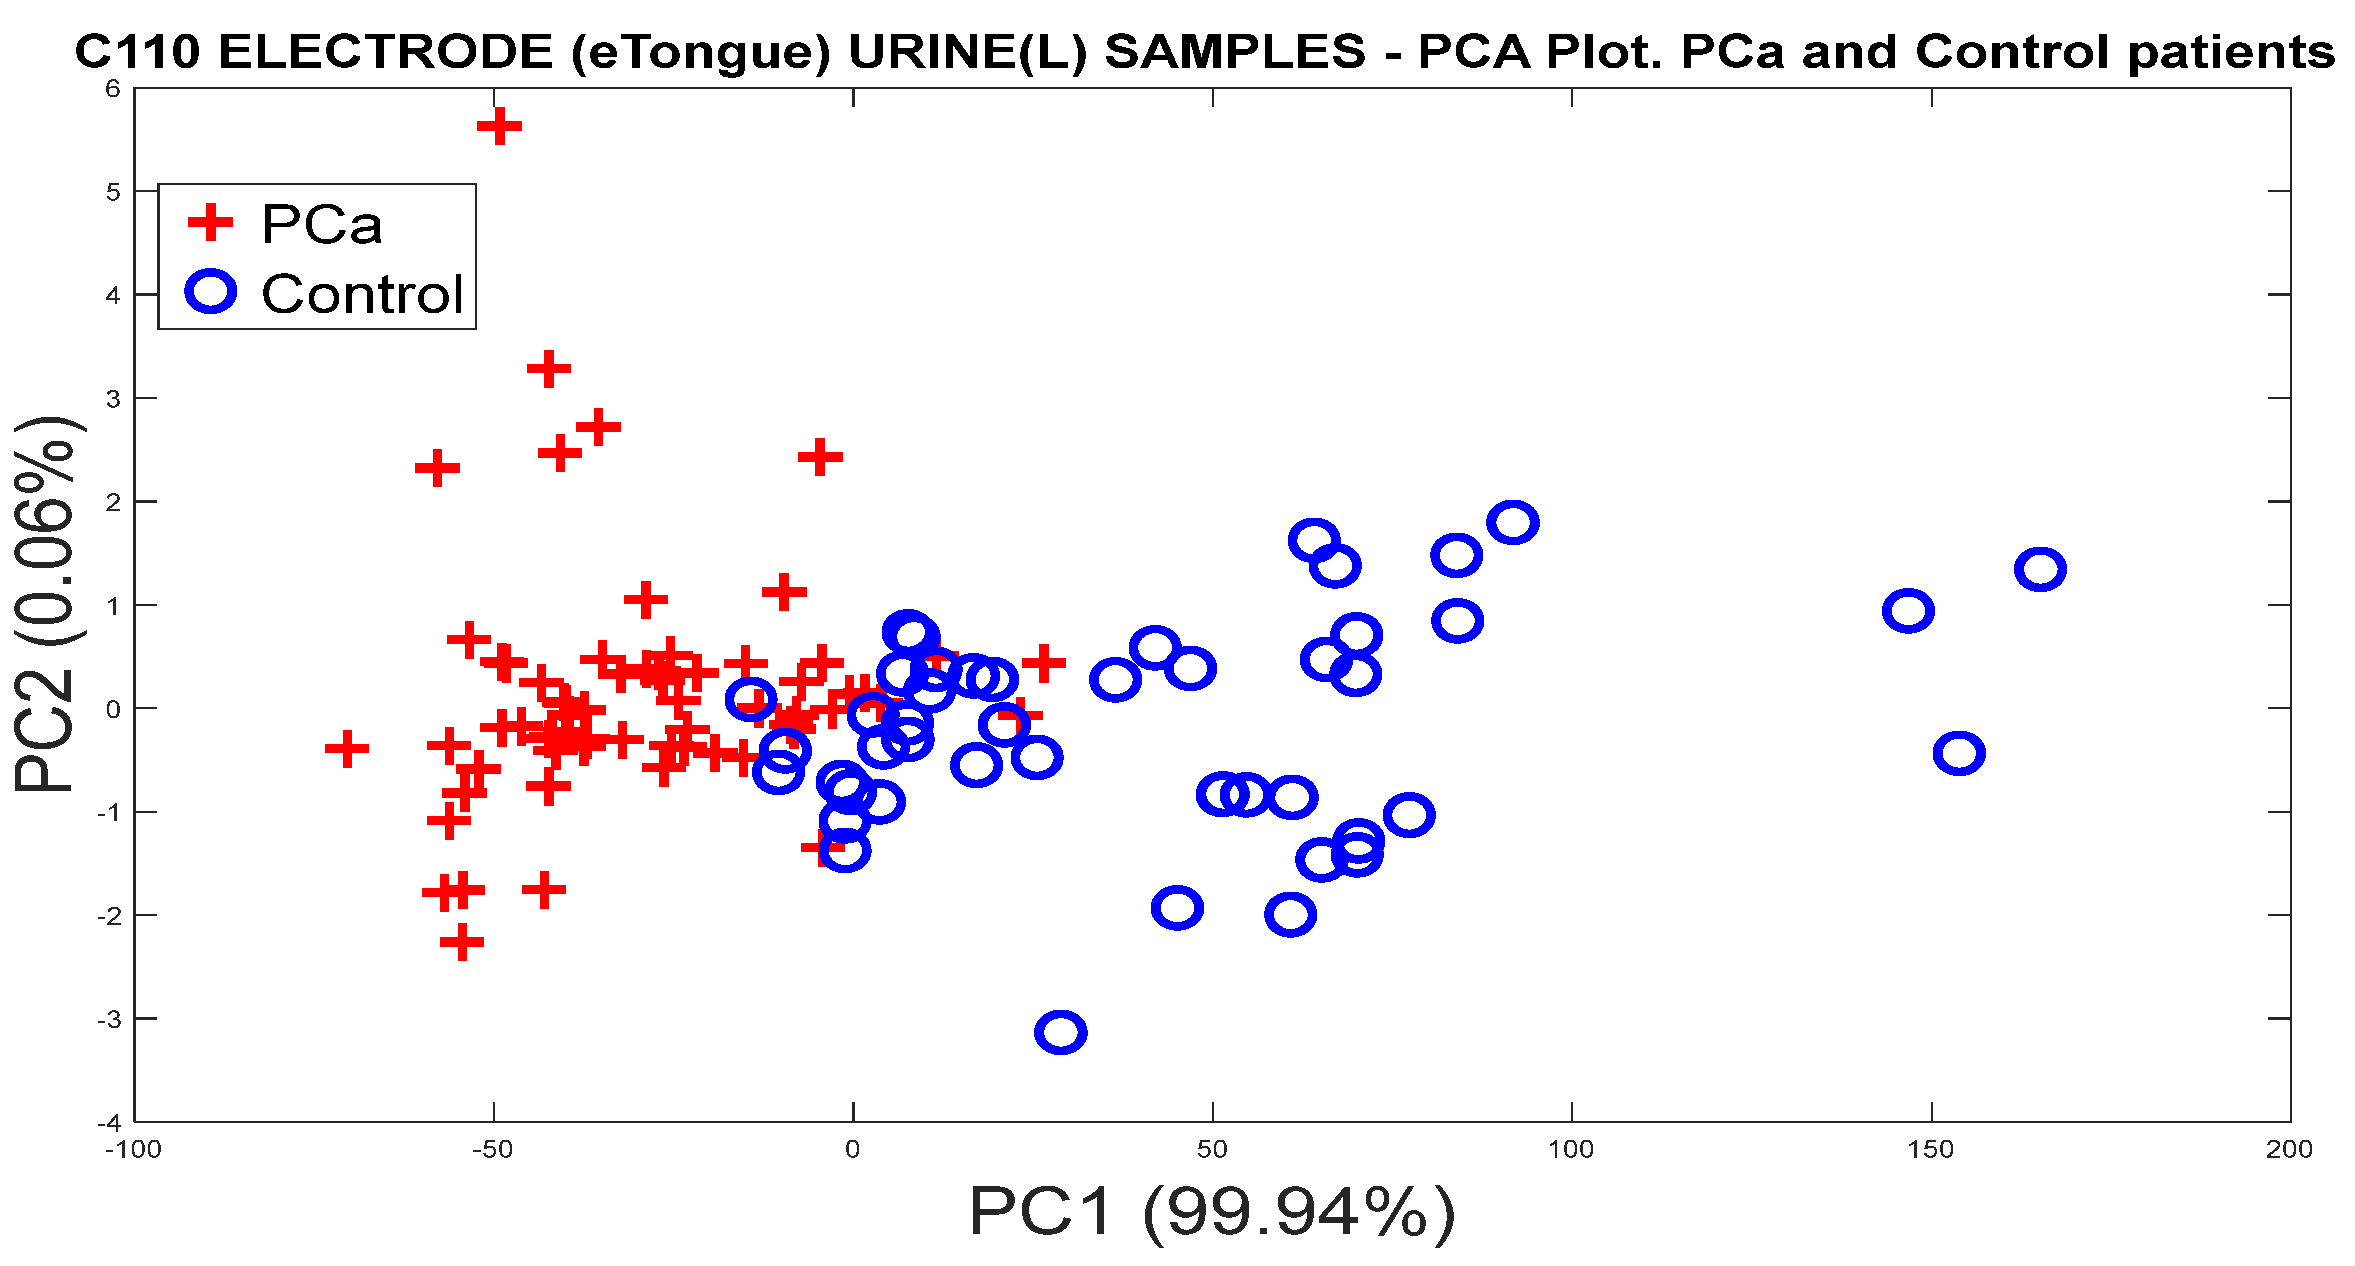
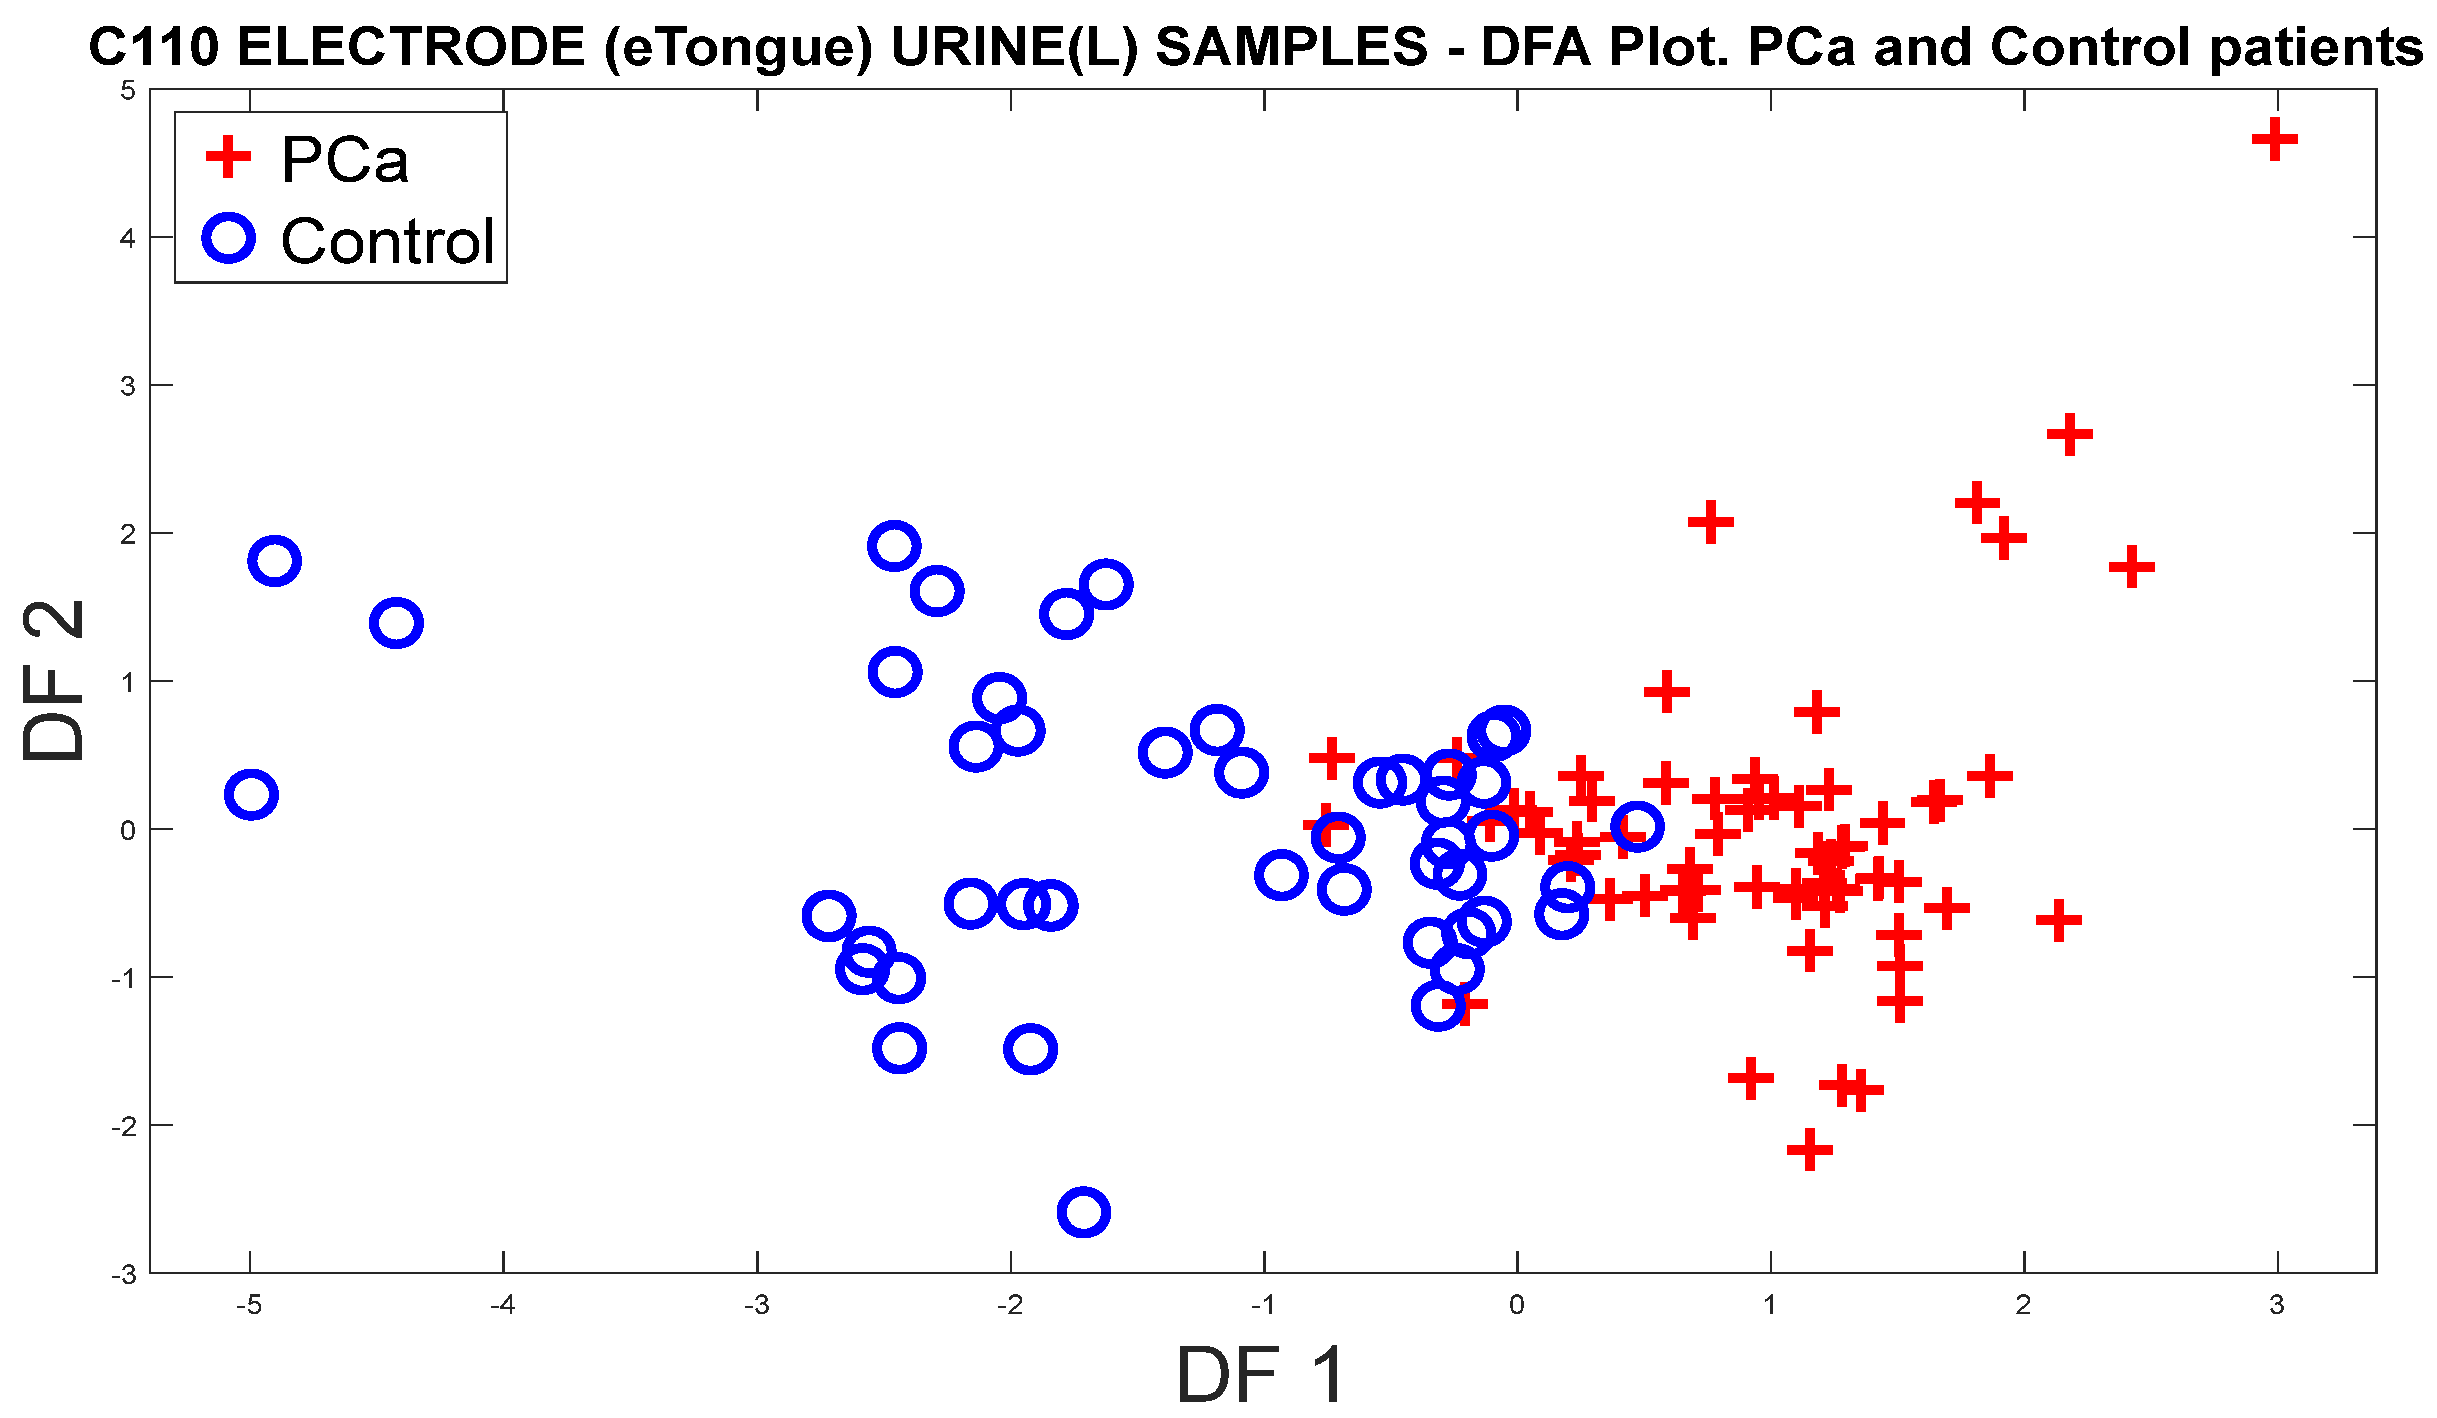
3.2. Analysis of Urine Samples through eTongue
3.2.1. PCa vs. Controls
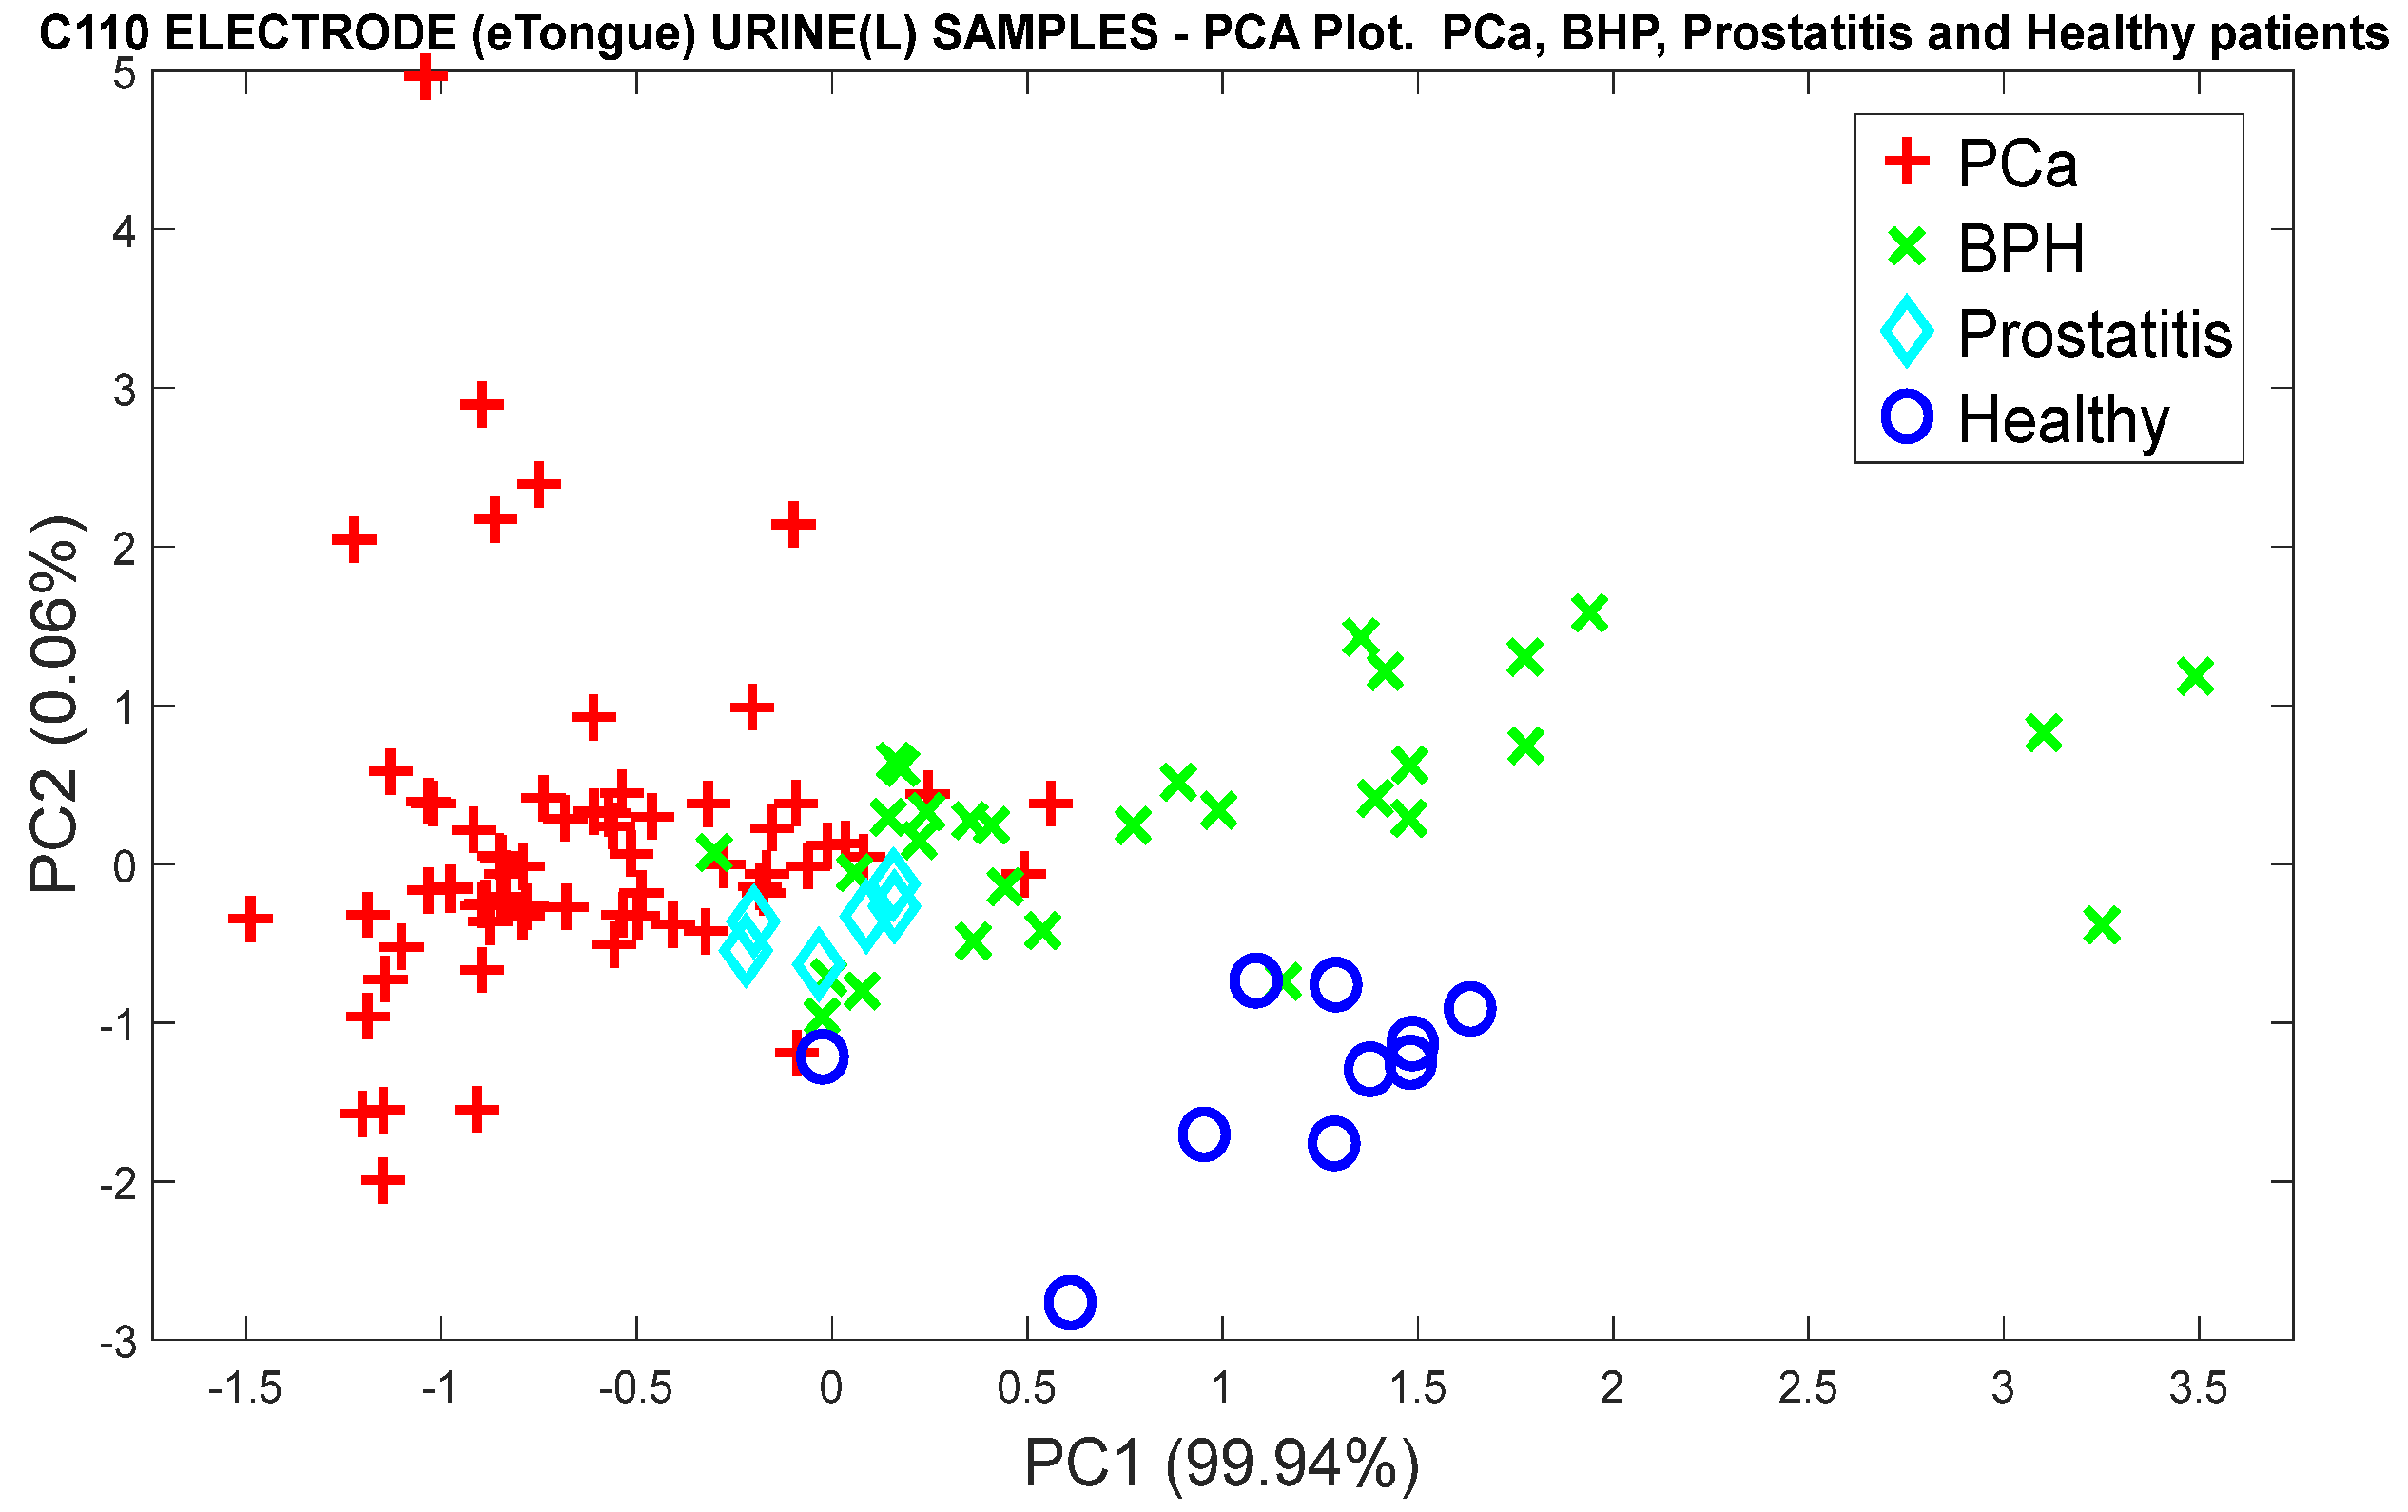
3.2.2. Analysis of the PCa Categories and Split of the Group of Control Patients into BPH, Prostatitis, and Healthy
3.2.3. Data Processing with Classification Methods
4. Discussion
5. Conclusions
Author Contributions
Funding
Institutional Review Board Statement
Informed Consent Statement
Data Availability Statement
Acknowledgments
Conflicts of Interest
References
- Sung, H.; Ferlay, J.; Siegel, R.; Soerjomataram, I.; Torre, L.; Jemal, A. Global Cancer Statistics 2020: GLOBOCAN Estimates of Incidence and Mortality Worldwide for 36 Cancers in 185 Countries. CA Cancer J. Clin. 2021, 71, 209–249. [Google Scholar] [CrossRef] [PubMed]
- Manisha, A.; Stephen, W.; Amit, S. Epidemiology of Prostate Cancer. World J. Oncol. 2019, 10, 63. [Google Scholar]
- Jain, M.; Leslie, S.; Sapra, A. Prostate Cancer Screening. StatPearls 2023. Available online: https://www.ncbi.nlm.nih.gov/books/NBK556081/ (accessed on 7 September 2023).
- Kachuri, L.; Hoffmann, T.; Jiang, Y.; Berndt, S.I.; Shelley, J.P.; Schaffer, K.R.; Machiela, M.J.; Freedman, N.D.; Huang, W.-Y.; Li, S.A.; et al. Genetically adjusted PSA levels for prostate cancer screening. Nat. Med. 2023, 29, 1412–1423. [Google Scholar] [CrossRef] [PubMed]
- Tourinho, R.R.; Lima, A.C.; Glina, S. Prostate cancer in Brazil and Latin America: Epidemiology and screening. Int. Braz. J. Urol. 2016, 42, 1081. [Google Scholar] [CrossRef] [PubMed]
- Mittal, R.D. Reference range of serum prostate-specific antigen levels in Indian men. Indian J. Med. Res. 2014, 140, 480. [Google Scholar] [PubMed]
- Sarwar, S.; Adil, M.A.; Nyamath, P.; Ishaq, M. Biomarkers of Prostatic Cancer: An Attempt to Categorize Patients into Prostatic Carcinoma, Benign Prostatic Hyperplasia, or Prostatitis Based on Serum Prostate Specific Antigen, Prostatic Acid Phosphatase, Calcium, and Phosphorus. Prostate Cancer 2017, 2017, 5687212. [Google Scholar] [CrossRef] [PubMed]
- Han, C.; Zhu, L.; Liu, X.; Ma, S.; Liu, Y.; Wang, X. Differential diagnosis of uncommon prostate diseases: Combining mpMRI and clinical information. Insights Imaging 2021, 12, 79. [Google Scholar] [CrossRef]
- Lumbreras, B.; Parker, L.A.; Caballero, J.P.; Gómez, L.; Puig, M.; López, M.; García, N.; Hernández, I. Variables Associated with False-Positive PSA Results: A Cohort Study with Real-World Data. Cancers 2022, 15, 261. [Google Scholar] [CrossRef]
- Sandhu, G.C.; Andriole, G.L. Overdiagnosis of Prostate Cancer. J. Natl. Cancer Inst. Monogr. 2012, 45, 146. [Google Scholar] [CrossRef]
- Palsdottir, T.; Nordstrom, T.; Karlsson, A.; Grönberg, H.; Clements, M.; Eklund, M. The impact of different prostate-specific antigen (PSA) testing intervals on Gleason score at diagnosis and the risk of experiencing false-positive biopsy recommendations: A population-based cohort study. BMJ Open 2019, 9, e027958. [Google Scholar] [CrossRef]
- Kim, H.; Park, S.; Jeong, I.G.; Song, S.H.; Jeong, Y.; Kim, C.S.; Lee, K.H. Noninvasive Precision Screening of Prostate Cancer by Urinary Multimarker Sensor and Artificial Intelligence Analysis. ACS Nano 2021, 15, 4054–4065. [Google Scholar] [CrossRef] [PubMed]
- Okpua, N.C.; Okekpa, S.I.; Njaka, S.; Emeh, A.N. Clinical diagnosis of prostate cancer using digital rectal examination and prostate-specific antigen tests: A systematic review and meta-analysis of sensitivity and specificity. Afr. J. Urol. 2021, 27, 32. [Google Scholar] [CrossRef]
- Gosselaar, C.; Kranse, R.; Roobol, M.J.; Roemeling, S.; Schröder, F.H. The interobserver variability of digital rectal examination in a large randomized trial for the screening of prostate cancer. Prostate 2008, 68, 985–993. [Google Scholar] [CrossRef] [PubMed]
- Irekpita, E.; Achor, G.O.; Alili, U. Assessment of the value of the different variants of abnormal digital rectal examination finding in predicting carcinoma of the prostate: A preliminary report of a two-center study. Afr. J. Urol. 2020, 26, 3. [Google Scholar] [CrossRef]
- Ilic, D.; Neuberger, M.M.; Djulbegovic, M.; Dahm, P. Screening for prostate cancer. Cochrane Database Syst. Rev. 2013, 2013, CD004720. [Google Scholar] [CrossRef] [PubMed]
- Gravestock, P.; Shaw, M.; Veeratterapillay, R.; Heer, R. Prostate Cancer Diagnosis: Biopsy Approaches. Urol. Cancers 2022, 12, 141–168. [Google Scholar]
- Shariat, S.F.; Roehrborn, C.G. Using Biopsy to Detect Prostate Cancer. Rev. Urol. 2008, 10, 262. [Google Scholar]
- Moe, A.; Hayne, D. Transrectal ultrasound biopsy of the prostate: Does it still have a role in prostate cancer diagnosis. Transl. Androl. Urol. 2020, 9, 3018. [Google Scholar] [CrossRef]
- López, E.; Ohori, M.; Wheeler, T.M.; Reuter, V.E.; Scardino, P.T.; Kattan, M.W.; Eastham, J.A. Prostate Cancer Diagnosed After Repeat Biopsies Have a Favorable Pathological Outcome but Similar Recurrence Rate. J. Urol. 2006, 175, 923–928. [Google Scholar] [CrossRef]
- Coyle, C.; Morgan, E.; Drummond, F.J.; Sharp, L.; Gavin, A. Do men regret prostate biopsy: Results from the PiCTure study. BMC Urol. 2017, 17, 11. [Google Scholar] [CrossRef]
- Loeb, S.; Vellekoop, A.; Ahmed, H.U.; Catto, J.; Emberton, M.; Nam, R.; Rosario, D.J.; Scattoni, V.; Lotan, Y. Systematic review of complications of prostate biopsy. Eur. Urol. 2013, 64, 876–892. [Google Scholar] [CrossRef] [PubMed]
- Detchokul, S.; Frauman, A.G. Recent developments in prostate cancer biomarker research: Therapeutic implications. Br. J. Clin. Pharmacol. 2011, 71, 157–174. [Google Scholar] [CrossRef] [PubMed]
- Manceau, C.; Fromont, G.; Beauval, J.B.; Barret, E.; Brureau, L.; Créhange, G.; Dariane, C.; Fiard, G.; Gauthé, M.; Mathieu, R.; et al. Biomarker in active surveillance for prostate cancer: A systematic review. Cancers 2021, 13, 4251. [Google Scholar] [CrossRef] [PubMed]
- Wu, D.; Ni, J.; Beretov, J.; Cozzi, P.; Willcox, M.; Wasinger, V.; Walsh, B.; Graham, P.; Li, Y. Urinary biomarkers in prostate cancer detection and monitoring progression. Crit. Rev. Oncol. Hematol. 2017, 118, 15–26. [Google Scholar] [CrossRef] [PubMed]
- Lima, A.R.; Pinto, J.; Carvalho, C.; Jerónimo, C.; Henrique, R.; Bastos, M.L.; Carvalho, M.; Guedes de Pinho, P. A Panel of Urinary Volatile Biomarkers for Differential Diagnosis of Prostate Cancer from Other Urological Cancers. Cancers 2020, 12, 2017. [Google Scholar] [CrossRef] [PubMed]
- De Visschere, P.J.; Briganti, A.; Fütterer, J.J.; Ghadjar, P.; Isbarn, H.; Massard, C.; Ost, P.; Sooriakumaran, P.; Surcel, C.I.; Valerio, M.; et al. Role of multiparametric magnetic resonance imaging in early detection of prostate cancer. Insights Imaging 2016, 7, 205–214. [Google Scholar] [CrossRef]
- Nematollahi, H.; Moslehi, M.; Aminolroayaei, F.; Maleki, M.; Shahbazi, D. Diagnostic Performance Evaluation of Multiparametric Magnetic Resonance Imaging in the Detection of Prostate Cancer with Supervised Machine Learning Methods. Diagnostics 2023, 13, 806. [Google Scholar] [CrossRef]
- Hua, X.; Wei, W.; Zhi, Y.; Jun, L.; Sheng, L.; Lin, W.; Qing, J.; Lin, J. Metabolomics studies of prostate cancer using gas chromatography-mass spectrometery. Transl. Cancer Res. 2016, 5, 302–314. [Google Scholar]
- Liu, Q.; Fan, Y.; Zeng, S.; Zhao, Y.; Yu, L.; Zhao, L.; Gao, J.; Zhang, X.; Zhang, Y. Volatile organic compounds for early detection of prostate cancer from urine. Heliyon 2023, 9, e16686. [Google Scholar] [CrossRef]
- Lima, A.R.; Araújo, A.M.; Pinto, J.; Jerónimo, C.; Henrique, R.; Bastos, M.L.; Carvalho, M.; Guedes de Pinho, P. GC-MS-Based Endometabolome Analysis Differentiates Prostate Cancer from Normal Prostate Cells. Metabolites 2018, 8, 23. [Google Scholar] [CrossRef]
- McDunn, J.E.; Li, Z.; Adam, K.P.; Neri, B.P.; Wolfert, R.L.; Milburn, M.V.; Lotan, Y.; Wheeler, T.M. Metabolomic signatures of aggressive prostate cancer. Prostate 2013, 73, 1547. [Google Scholar] [CrossRef] [PubMed]
- Pinto, F.G.; Mahmud, I.; Harmon, T.A.; Rubio, V.Y.; Garrett, T.J. Rapid Prostate Cancer Noninvasive Biomarker Screening Using Segmented Flow Mass Spectrometry-Based Untargeted Metabolomics. J. Proteome Res. 2020, 19, 2080–2091. [Google Scholar] [CrossRef] [PubMed]
- Markushin, Y.; Nilesh, G.; HZhang Paul, K.; Rogan, E.; Cavalieri, E.; Trock, B.; Pavlovich, C.; Ryszard, J. Potential biomarker for early risk assessment of prostate cancer. Prostate 2006, 66, 1565–1571. [Google Scholar] [CrossRef] [PubMed]
- Zhang, T.; Watson, D.G.; Wang, L.; Abbas, M.; Murdoch, L.; Bashford, L.; Ahmad, I.; Lam, N.Y.; Ng, A.C.; Leung, H.Y. Application of Holistic Liquid Chromatography-High Resolution Mass Spectrometry Based Urinary Metabolomics for Prostate Cancer Detection and Biomarker Discovery. PLoS ONE 2013, 8, e65880. [Google Scholar] [CrossRef] [PubMed]
- Ankerst, D.P.; Liss, M.; Zapata, D.; Hoefler, J.; Thompson, I.M.; Leach, R.J. A case control study of sarcosine as an early prostate cancer detection biomarker Urological oncology. BMC Urol. 2015, 15, 99. [Google Scholar] [CrossRef] [PubMed]
- Wilton, J.H.; Titus, M.A.; Efstathiou, E.; Fetterly, G.J.; Mohler, J.L. Androgenic biomarker profiling in human matrices and cell culture samples using high throughput, electrospray tandem mass spectrometry. Prostate 2014, 74, 722–731. [Google Scholar] [CrossRef]
- Jornet, N.; Moliner, Y.; Molins, C.; Campíns, P. Trends for the Development of In Situ Analysis Devices. In Encyclopedia of Analytical Chemistry; John Wiley & Sons, Ltd.: Hoboken, NJ, USA, 2017. [Google Scholar]
- Zaim, O.; Diou, A.; Bari, N.E.; Lagdali, N.; Benelbarhdadi, I.; Ajana, F.Z.; Liobet, E.; Bouchikhi, B. Comparative analysis of volatile organic compounds of breath and urine for distinguishing patients with liver cirrhosis from healthy controls by using electronic nose and voltammetric electronic tongue. Anal. Chim. Acta 2021, 1184, 339028. [Google Scholar] [CrossRef]
- Hidayat, S.; Triyana, K.; Fauzan, I.; Julian, T.; Lelono, D.; Yusuf, Y.; Ngadiman, N.; Veloso, A.C.; Peres, A.M. The Electronic Nose Coupled with Chemometric Tools for Discriminating the Quality of Black Tea Samples In Situ. Chemosensors 2019, 7, 29. [Google Scholar] [CrossRef]
- Dong, W.; Zhao, J.; Hu, R.; Dong, Y.; Tan, L. Differentiation of Chinese robusta coffees according to species, using a combined electronic nose and tongue, with the aid of chemometrics. Food Chem. 2017, 229, 743–751. [Google Scholar] [CrossRef]
- Xu, M.; Wang, J.; Zhu, L. The qualitative and quantitative assessment of tea quality based on E-nose, E-tongue and E-eye combined with chemometrics. Food Chem. 2019, 289, 482–489. [Google Scholar] [CrossRef]
- Fitzgerald, J.; Fenniri, H. Cutting Edge Methods for Non-Invasive Disease Diagnosis Using E-Tongue and E-Nose Devices. Biosensors 2017, 7, 59. [Google Scholar] [CrossRef] [PubMed]
- Christodoulides, N.; McRae, M.P.; Simmons, G.W.; Modak, S.S.; McDevitt, J.T. Sensors that Learn: The Evolution from Taste Fingerprints to Patterns of Early Disease Detection. Micromachines 2019, 10, 251. [Google Scholar] [CrossRef] [PubMed]
- Farraia, M.V.; Rufo, J.C.; Paciência, I.; Mendes, F.; Delgado, L.; Moreira, A. The electronic nose technology in clinical diagnosis: A systematic review. Porto Biomed. J. 2019, 4, e42. [Google Scholar] [CrossRef] [PubMed]
- Tonacci, A.; Scafile, A.; Billeci, L.; Sansone, F. Electronic Nose and Tongue for Assessing Human Microbiota. Chemosensors 2022, 10, 85. [Google Scholar] [CrossRef]
- Bax, C.; Taverna, G.; Eusebio, L.; Sironi, S.; Grizzi, F.; Guazzoni, G.; Capelli, L. Innovative Diagnostic Methods for Early Prostate Cancer Detection through Urine Analysis: A Review. Cancers 2018, 10, 123. [Google Scholar] [CrossRef]
- Jeong, S.; Kim, D.; Kim, W.J.; Kim, G. Detection of volatile organic compounds from human prostate cancer cell using canine olfaction. J. Vet. Behav. 2022, 49, 80–84. [Google Scholar] [CrossRef]
- Janfaza, S.; Khorsand, B.; Nikkhah, M.; Zahiri, J. Digging deeper into volatile organic compounds associated with cancer. Biol. Methods Protoc. 2019, 4, bpz014. [Google Scholar] [CrossRef]
- Taverna, G.; Tidu, L.; Grizzi, F.; Torri, V.; Mandressi, A.; Sardella, P.; La Torre, G.; Cocciolone, G.; Seveso, M.; Giusti, G.; et al. Olfactory system of highly trained dogs detects prostate cancer in urine samples. J. Urol. 2015, 193, 1382–1387. [Google Scholar] [CrossRef]
- Cornu, J.N.; Cancel-Tassin, G.; Ondet, V.; Girardet, C.; Cussenot, O. Olfactory Detection of Prostate Cancer by Dogs Sniffing Urine: A Step Forward in Early Diagnosis. Eur. Urol. 2011, 59, 197–201. [Google Scholar] [CrossRef]
- Park, G.; Kim, D.; Jeong, S.; Park, D.; Kim, G. Odor detection of cancer cell metabolites by scent-detection dogs. Thai J. Vet. Med. 2022, 52, 537–541. [Google Scholar] [CrossRef]
- Ryman-Tubb, T.; Lothion-Roy, J.H.; Metzler, V.M.; Harris, A.E.; Robinson, B.D.; Rizvanov, A.A.; Jeyapalan, J.N.; James, V.H.; England, G.; Rutland, C.S.; et al. Comparative pathology of dog and human prostate cancer. Vet. Med. Sci. 2022, 8, 110–120. [Google Scholar] [CrossRef] [PubMed]
- Liu, T.; Guo, L.; Wang, M.; Su, C.; Wang, D.; Dong, H.; Chen, J.; Wu, W. Review on Algorithm Design in Electronic Noses: Challenges, Status, and Trends. Intell. Comput. 2023, 2, 1–19. [Google Scholar] [CrossRef]
- Bernabei, M.; Pennazza, G.; Santonico, M.; Corsi, C.; Roscioni, C.; Paolesse, R.; Di Natale, N.; D’Amico, A. A preliminary study on the possibility to diagnose urinary tract cancers by an electronic nose. Sens. Actuators B Chem. 2008, 131, 1–4. [Google Scholar] [CrossRef]
- Arnaldo, D.; Marco, S.; Giorgio, P.; Rosamaria, C.; Giuseppe, V.; Dario Del, F.; Roberto, P.; Corrado Di, N.; Eugenio, M.; Enrico, F. A Novel Approach for Prostate Cancer Diagnosis using a Gas Sensor Array. Procedia Eng. 2012, 47, 1113–1116. [Google Scholar]
- Roine, A.; Veskimäe, E.; Tuokko, A.; Kumpulainen, P.; Koskimäki, J.; Keinänen, T.A.; Häkkinen, M.R.; Vepsäläinen, J.; Paavonen, T.; Lekkala, J.; et al. Detection of Prostate Cancer by an Electronic Nose: A Proof of Principle Study. J. Urol. 2014, 192, 230–235. [Google Scholar] [CrossRef] [PubMed]
- Filianoti, A.; Costantini, M.; Bove, A.M.; Anceschi, U.; Brassetti, A.; Ferriero, M.; Mastroianni, R.; Misuraca, L.; Tuderti, G.; Ciliberto, G.; et al. Volatilome Analysis in Prostate Cancer by Electronic Nose: A Pilot Monocentric Study. Cancers 2022, 14, 2927. [Google Scholar] [CrossRef]
- Bax, C.; Prudenza, S.; Gaspari, G.; Capelli, L.; Grizzi, F.; Taverna, G. Drift compensation on electronic nose data for non-invasive diagnosis of prostate cancer by urine analysis. iScience 2022, 25, 103622. [Google Scholar] [CrossRef]
- Bax, C.; Capelli, L.; Grizzi, F.; Prudenza, S.; Taverna, G. A novel approach for the non-invasive diagnosis of prostate cancer based on urine odour analysis. In Proceedings of the International Symposium on Olfaction and Electronic Nose, ISOEN 2022—Proceedings 2022, Aveiro, Portugal, 29 May–1 June 2022; pp. 1–4. [Google Scholar]
- Capelli, L.; Bax, C.; Grizzi, F.; Taverna, G. Optimization of training and measurement protocol for eNose analysis of urine headspace aimed at prostate cancer diagnosis. Sci. Rep. 2021, 11, 20898. [Google Scholar] [CrossRef]
- Taverna, G.; Grizzi, F.; Tidu, L.; Bax, C.; Zanoni, M.; Vota, P.; Lotesoriere, B.J.; Prudenza, S.; Magagnin, L.; Langfelder, G.; et al. Accuracy of a new electronic nose for prostate cancer diagnosis in urine samples. Int. J. Urol. 2022, 29, 890–896. [Google Scholar] [CrossRef]
- Scheepers, M.H.M.C.; Al-Difaie, Z.; Brandts, L.; Peeters, A.; van Grinsven, B.; Bouvy, N.D. Diagnostic Performance of Electronic Noses in Cancer Diagnoses Using Exhaled Breath: A Systematic Review and Meta-analysis. JAMA Netw. Open 2022, 5, E2219372. [Google Scholar] [CrossRef]
- Nakhleh, M.K.; Amal, H.; Jeries, R.; Broza, Y.Y.; Aboud, M.; Gharra, A.; Ivgi, H.; Khatib, S.; Badarneh, S.; Har-Shai, L.; et al. Diagnosis and Classification of 17 Diseases from 1404 Subjects via Pattern Analysis of Exhaled Molecules. ACS Nano 2017, 11, 112–125. [Google Scholar] [CrossRef] [PubMed]
- Peng, G.; Hakim, M.; Broza, Y.Y.; Billan, S.; Abdah-Bortnyak, R.; Kuten, A.; Tisch, U.; Haick, H. Detection of lung, breast, colorectal, and prostate cancers from exhaled breath using a single array of nanosensors. Br. J. Cancer 2010, 103, 542–551. [Google Scholar] [CrossRef] [PubMed]
- Waltman, C.G.; Marcelissen, T.A.T.; van Roermund, J.G.H. Exhaled-breath Testing for Prostate Cancer Based on Volatile Organic Compound Profiling Using an Electronic Nose Device (AeonoseTM): A Preliminary Report. Eur. Urol. Focus. 2020, 6, 1220–1225. [Google Scholar] [CrossRef] [PubMed]
- Zniber, M.; Vahdatiyekta, P.; Huynh, T.P. Analysis of urine using electronic tongue towards non-invasive cancer diagnosis. Biosens. Bioelectron. 2023, 219, 114810. [Google Scholar] [CrossRef] [PubMed]
- Pascual, L.; Campos, I.; Vivancos, J.L.; Quintás, G.; Loras, A.; Martínez-Bisbal, M.C.; Martínez-Máñez, R.; Boronat, F.; Ruiz-Cerdà, J.L. Detection of prostate cancer using a voltammetric electronic tongue. Analyst 2016, 141, 4562–4567. [Google Scholar] [CrossRef]
- Svetlana, S.; Mikhail, K.; Vitaly, P.; Evgeny, A.; Liudmila, K.; Elena, B.; Andrey, L.; Ping, W.; Hao, W.; Igor, J.; et al. Potentiometric multisensor system as a possible simple tool for non-invasive prostate cancer diagnostics through urine analysis. Sens. Actuators B Chem. 2019, 289, 42–47. [Google Scholar]
- Liu, H.; Zhang, L.; Li, K.H.H.; Tan, O.K. Microhotplates for Metal Oxide Semiconductor Gas Sensor Applications—Towards the CMOS-MEMS Monolithic Approach. Micromachines 2018, 9, 557. [Google Scholar] [CrossRef]
- Maddalone, M.G.; Oderda, M.; Mengozzi, G.; Gesmundo, I.; Novelli, F.; Giovarelli, M.; Gontero, P.; Occhipinti, S. Urinary Zinc Loss Identifies Prostate Cancer Patients. Cancers 2022, 14, 5316. [Google Scholar] [CrossRef]
- Sugimoto, R.; Lee, L.; Tanaka, Y.; Morita, Y.; Hijioka, M.; Hisano, T.; Furukawa, M. Zinc Deficiency as a General Feature of Cancer: A Review of the Literature. Biol. Trace Elem. Res. 2023. [Google Scholar] [CrossRef]
- Eskra, J.N.; Rabizadeh, D.; Pavlovich, C.P.; Catalona, W.J.; Luo, J. Approaches to urinary detection of prostate cancer. Prostate Cancer Prostatic Dis. 2019, 22, 362. [Google Scholar] [CrossRef]
- Medarova, Z.; Ghosh, S.K.; Vangel, M.; Drake, R.; Moore, A. Risk stratification of prostate cancer patients based on EPS-urine zinc content. Am. J. Cancer Res. 2014, 4, 385. [Google Scholar]
- Pierce, B.L. Why are diabetics at reduced risk for prostate cancer? A review of the epidemiologic evidence. Urol. Oncol. Semin. Orig. Investig. 2012, 30, 735–743. [Google Scholar] [CrossRef] [PubMed]
- Kasper, J.S.; Liu, V.; Giovannucci, E. Diabetes Mellitus and Risk of Prostate Cancer in the Health Professionals Follow-Up Study. Int. J. Cancer. J. Int. Du. Cancer 2009, 124, 1398. [Google Scholar] [CrossRef] [PubMed]
- Rodriguez, C.; Patel, A.V.; Mondul, A.M.; Jacobs, E.J.; Thun, M.J.; Calle, E.E. Diabetes and Risk of Prostate Cancer in a Prospective Cohort of US Men. Am. J. Epidemiol. 2005, 161, 147–152. [Google Scholar] [CrossRef] [PubMed]
- Calton, B.A.; Chang, S.C.; Wright, M.E.; Kipnis, V.; Lawson, K.; Thompson, F.E.; Subar, A.F.; Mouw, T.; Campbell, D.S.; Hurwitz, P.; et al. History of diabetes mellitus and subsequent prostate cancer risk in the NIH-AARP Diet and Health Study. Cancer Causes Control 2007, 18, 493–503. [Google Scholar] [CrossRef]
- Jiménez-Pacheco, a.; Salinero-Bachiller, M.; Iribar, M.; López-Luque, A.; Miján-Ortiz, J.; Peinado, J. Furan and p-xylene as candidate biomarkers for prostate cancer. Urol. Oncol. 2018, 36, e21–e243. [Google Scholar] [CrossRef]
- Lima, A.; Pinto, J.; Azevedo, A.I.; Barros-Silva, D.; Jeronimo, C.; Henrique, R.; de Lourdes Bastos, M.; de Pinho, P.G.; Carvalho, M. Identification of a biomarker panel for improvement of prostate cancer diagnosis by vola-tile metabolic profiling of urine. Br. J. Cancer 2019, 121, 857. [Google Scholar] [CrossRef]
- Khalid, T.; Aggio, R.; White, P.; De Lacy Costello, B.; Persad, R.; Alkateb, H.; Jones, P.; Probert, C.S.; Ratcliffe, N. Urinary Volatile Organic Compounds for the Detection of Prostate Cancer. PLoS ONE 2015, 10, e0143231. [Google Scholar] [CrossRef]


| Category | Number | Range (Years) | PSA (ng/mL) | Smokers | Comorbidities |
|---|---|---|---|---|---|
| PCa | 66 | 53–89 | 5–34 | 4 (3.5%) | Diabetes Hypertension Thyroid COPD |
| BPH | 30 | 53–78 | 3–5 | 0 (0.0%) | Diabetes |
| Prostatitis | 6 | 64–74 | 4–12 | 1 (0.88%) | Hypertension |
| Healthy | 11 | 50–81 | <1 | 1 (0.88%) | Thyroid, Glaucoma |
| Data Breath 1 | QDA (%) | Naïve Bayes (%) | SVM (%) | KNN (%) | Random Forest (%) | Decision Trees (%) |
|---|---|---|---|---|---|---|
| Raw | 69.9 | 60.2 | 69.9 | 67.3 | 70.8 | 61.1 |
| Normalized | 64.6 | 58.4 | 71.1 | 67.3 | 61.9 | 59.3 |
| Scores (PCA) | 92.0 | 92.0 | 100 | 73.5 | 93.8 | 92.0 |
| Factor (DFA) | 84.1 | 85.8 | 85.8 | 83.3 | 84.1 | 81.4 |
| PCA-SVM | PCa (100%) | Control (100%) |
|---|---|---|
| Precision | 100 | 100 |
| Sensitivity | 100 | 100 |
| Specificity | 100 | 100 |
| Accuracy | 100 | 100 |
| NPV | 100 | 100 |
| Data Breath 1 | QDA (%) | Naïve Bayes (%) | SVM (%) | KNN (%) | Random Forest (%) | Decision Trees (%) |
|---|---|---|---|---|---|---|
| Scores (PCA) | 73.5 | 73.5 | 69.9 | 59.3 | 70.8 | 74.3 |
| Factors (DFA) | 93.8 | 93.8 | 92.9 | 95.6 | 92.0 | 91.2 |
| Data DFA-KNN | Pca (%) | BPH (%) | Prostatitis (%) | Healthy (%) |
|---|---|---|---|---|
| Precision | 94.2 | 96.5 | 100 | 100 |
| Sensitivity | 98.4 | 96. 5 | 66.7 | 91.6 |
| Specificity | 91.4 | 98.8 | 100 | 100 |
| Accuracy | 95.5 | 95.5 | 95.5 | 95.5 |
| NPV | 97.7 | 98.8 | 98.1 | 99.1 |
| Data Urine 1 | QDA (%) | Naïve Bayes (%) | SVM (%) | KNN (%) | Random Forest (%) | Decision Trees (%) |
|---|---|---|---|---|---|---|
| Raw | 40.7 | 56.6 | 58.4 | 61.9 | 61.1 | 53.1 |
| Normalized | 40.7 | 56.6 | 58.4 | 59.3 | 58.4 | 54.9 |
| Scores (PCA) | 93.8 | 93.8 | 100 | 75.2 | 97.3 | 92.9 |
| Factor (DFA) | 77.9 | 82.3 | 80.5 | 77.0 | 79.6 | 83.2 |
| PCA-SVM | Pca (100%) | Control (100%) |
|---|---|---|
| Precision | 100 | 100 |
| Sensitivity | 100 | 100 |
| Specificity | 100 | 100 |
| Accuracy | 100 | 100 |
| NPV | 100 | 100 |
| Data Urine 1 | QDA (%) | Naïve Bayes (%) | SVM (%) | KNN (%) | Random Forest (%) | Decision Trees (%) |
|---|---|---|---|---|---|---|
| Raw | 30.1 | 50.4 | 61.1 | 58.4 | 63.7 | 54.0 |
| Normalized | 29.2 | 51.3 | 60.2 | 63.7 | 68.1 | 54.9 |
| Scores (PCA) | 69.9 | 69.9 | 61.9 | 58.4 | 77.0 | 85.0 |
| Factor (DFA) | 90.3 | 90.3 | 89.4 | 86.7 | 91.2 | 91.2 |
| DFA-Random Forest | Pca (%) | BPH (%) | Prostatitis (%) | Healthy (%) |
|---|---|---|---|---|
| Precision | 90.0 | 92.3 | 100 | 91.6 |
| Sensitivity | 95.5 | 82.8 | 83.3 | 91.7 |
| Specificity | 85.1 | 97.6 | 100 | 99.0 |
| Accuracy | 91.2 | 91.2 | 91.2 | 91.2 |
| NPV | 93.0 | 94.3 | 99.1 | 99.0 |
| Data Breath 1 and Urine 1 | QDA (%) | Naïve Bayes (%) | SVM (%) | KNN (%) | Random Forest (%) | Decision Trees (%) |
|---|---|---|---|---|---|---|
| Scores (PCA) | 92.9 | 94.7 | 99.1 | 100 | 92.9 | 100 |
| Factor (DFA) | 94.7 | 95.6 | 94.7 | 92.9 | 92.9 | 94.7 |
| Metrics | PCA–Decision Trees | DFA–Naïve Bayes | ||
|---|---|---|---|---|
| Pca (%) | Control (%) | Pca (%) | Control (%) | |
| Precision | 100 | 100 | 94.2 | 97.7 |
| Sensitivity | 100 | 100 | 98.5 | 91.5 |
| Specificity | 100 | 100 | 91.5 | 98.5 |
| Accuracy | 100 | 100 | 95.6 | 95.6 |
| NPV | 100 | 100 | 97.7 | 94.2 |
| Data Breath 1 and Urine 1 | QDA (%) | Naïve Bayes (%) | SVM (%) | KNN (%) | Random Forest (%) | Decision Trees (%) |
|---|---|---|---|---|---|---|
| Scores (PCA) | 78.8 | 81.4 | 94.5 | 92.9 | 69.0 | 88.5 |
| Factor (DFA) | 95.6 | 97.3 | 97.3 | 99.1 | 96.5 | 93.8 |
| PCA–SVM Metrics | PCa (%) | BPH (%) | Prostatitis (%) | Healthy (%) |
|---|---|---|---|---|
| Precision | 100 | 93.3 | 60.0 | 91.7 |
| Sensitivity | 100 | 96.5 | 50.0 | 91.7 |
| Specificity | 100 | 97.6 | 98.1 | 99.0 |
| Accuracy | 95.6 | 95.6 | 95.6 | 95.6 |
| NPV | 100 | 98.8 | 97.2 | 99.0 |
| DFA–KNN Metrics | PCa (%) | BPH (%) | Prostatitis (%) | Healthy (%) |
|---|---|---|---|---|
| Precision | 98.5 | 100 | 100 | 100 |
| Sensitivity | 100 | 96.5 | 100 | 100 |
| Specificity | 97.9 | 100 | 100 | 100 |
| Accuracy | 99.1 | 99.1 | 99.1 | 99.1 |
| NPV | 100 | 98.8 | 100 | 100 |
| Data Urine 1 | QDA (%) | Naïve Bayes (%) | SVM (%) | KNN (%) | Random Forest (%) | Decision Trees (%) |
|---|---|---|---|---|---|---|
| Raw | 89.4 | 90.3 | 89.4 | 90.3 | 91.2 | 86.7 |
| Normalized | 89.4 | 90.3 | 92.0 | 92.0 | 91.2 | 90.3 |
| Scores (PCA) | 88.5 | 88.5 | 91.2 | 91.2 | 89.4 | 89.4 |
| Factors (DFA) | 89.4 | 89.4 | 90.3 | 92.9 | 88.5 | 92.0 |
| Data Urine 1 | QDA (%) | Naïve Bayes (%) | SVM (%) | KNN (%) | Random Forest (%) | Decision Trees (%) |
|---|---|---|---|---|---|---|
| Raw | 84.1 | 84.1 | 81.4 | 87.6 | 81.4 | 81.4 |
| Normalized | 84.1 | 83.2 | 84.1 | 86.7 | 85.8 | 85.0 |
| Scores PCA | 88.5 | 84.1 | 85.0 | 89.4 | 82.3 | 82.3 |
| Factors DFA | 85.8 | 85.8 | 83.2 | 86.7 | 82.3 | 85.0 |
| PCA-KNN Metric | PCa and Controls (%) |
|---|---|
| Precision | 96.7 |
| Sensitivity | 90.0 |
| Specificity | 95.0 |
| Accuracy | 92.9 |
| NPV | 88.8 |
Disclaimer/Publisher’s Note: The statements, opinions and data contained in all publications are solely those of the individual author(s) and contributor(s) and not of MDPI and/or the editor(s). MDPI and/or the editor(s) disclaim responsibility for any injury to people or property resulting from any ideas, methods, instructions or products referred to in the content. |
© 2024 by the authors. Licensee MDPI, Basel, Switzerland. This article is an open access article distributed under the terms and conditions of the Creative Commons Attribution (CC BY) license (https://creativecommons.org/licenses/by/4.0/).
Share and Cite
Durán Acevedo, C.M.; Carrillo Gómez, J.K.; Cuastumal Vasquez, C.A.; Ramos, J. Prostate Cancer Detection in Colombian Patients through E-Senses Devices in Exhaled Breath and Urine Samples. Chemosensors 2024, 12, 11. https://doi.org/10.3390/chemosensors12010011
Durán Acevedo CM, Carrillo Gómez JK, Cuastumal Vasquez CA, Ramos J. Prostate Cancer Detection in Colombian Patients through E-Senses Devices in Exhaled Breath and Urine Samples. Chemosensors. 2024; 12(1):11. https://doi.org/10.3390/chemosensors12010011
Chicago/Turabian StyleDurán Acevedo, Cristhian Manuel, Jeniffer Katerine Carrillo Gómez, Carlos Alberto Cuastumal Vasquez, and José Ramos. 2024. "Prostate Cancer Detection in Colombian Patients through E-Senses Devices in Exhaled Breath and Urine Samples" Chemosensors 12, no. 1: 11. https://doi.org/10.3390/chemosensors12010011