

Factors Influencing the Total Functional Capacity Score as a Critical Endpoint in Huntington’s Disease Research


1
Department of Neurology, Huntington Center North Rhine-Westphalia, St. Josef-Hospital Bochum, Ruhr-University Bochum, Gudrunstraße 56, 44791 Bochum, Germany
2
Leibniz Research Center for Working Environment and Human Factors at the Technical University of Dortmund (IfADo), Ardeystraße 67, 44139 Dortmund, Germany
*
Author to whom correspondence should be addressed.
Biomedicines 2023, 11(12), 3336; https://doi.org/10.3390/biomedicines11123336
Submission received: 16 November 2023
/
Revised: 12 December 2023
/
Accepted: 13 December 2023
/
Published: 17 December 2023
(This article belongs to the Special Issue Neurodegenerative Diseases: Recent Advances and Future Perspectives)
Abstract
:Background: The Total Functional Capacity (TFC) score is commonly used in Huntington’s disease (HD) research. The classification separates each disease stage (1–5), e.g., as an inclusion criterion or endpoint in clinical trials accepted by the Food and Drug Administration (FDA). In addition to the quantification of age- and CAG-repeat-dependent effects as well as interacting effects of both on the TFC, we aimed to investigate factors influencing the TFC, such as neuropsychiatric, educational, and cognitive disease burden using data from the largest HD observational study to date. In addition, we analyzed data from pre-manifest stages to investigate the influence of the above-mentioned factors on the TFC in that stage. Methods: A moderated regression analysis was conducted to analyze the interaction effects of age and CAG-repeat length on the TFC in HD patients. A simple slope analysis was calculated to illustrate the effects. Depending on TFC results, motor-manifest patients were grouped into five stages. Data from pre-manifest participants were analyzed with regard to years to onset and CAP scores. Results: We identified N = 10,314 participants as manifest HD. A significant part of variance on the TFC was explained by age (R2 = 0.029, F (1;10,281) = 308.02, p < 0.001), CAG-repeat length (∆R2 = 0.132, ∆F (1;10,280) = 1611.22, p < 0.001), and their interaction (∆R2 = 0.049, ∆F (1;10,279) = 634.12, p < 0.001). The model explained altogether 20.9% of the TFC score’s variance (F = 907.60, p < 0.001). Variance of psychiatric and cognitive symptoms significantly differed between stages. Exploratory analysis of median data in pre-manifest participants revealed the highest scores for neuropsychiatric changes between 5 to <20 years from the disease onset. Conclusions: TFC is mainly explained by the neurobiological factors, CAG-repeat length, and age, with subjects having more CAG-repeats showing a faster decline in function. Our study confirms TFC as a robust measure of progression in manifest HD.
1. Introduction
The fatal autosomal-dominant inherited Huntington’s Disease (HD) is accompanied by manifold motor, cognitive, behavioral-psychiatric, and functional impairments [1,2,3]. To objectify psychiatric symptoms and disease-specific functional impairments, various research approaches have been followed to gain insights into underlying genetic and pathophysiological changes [4,5,6,7,8]. The distinct cause of disease with a cytosine-adenine-guanin (CAG)-trinucleotide expansion on chromosome 4 in the Huntingtin gene (HTT) results in misfolded Huntingtin proteins. Longer CAGs result in an earlier age of the motor onset (AAO) [1,9]. But the psychiatric onset of the disease, too, is partly associated with CAG-repeat length as revealed by Vassos et al. and McAllister et al [10,11]. Research suggests that the expanded CAG length explains about 50% to 70% of the variance in the AAO [12,13,14]. Langbehn et al. developed predicting models based on repeat length and validated findings in large real-world cohorts [15,16]. CAG-length-dependent effects negatively influencing morphological changes and correlates of the course of disease were investigated using different approaches in smaller cohorts [17,18,19,20]. With regard to neuropathological changes investigated in brain tissues with striatal atrophy, Penney et al. identified correlations between pathologic CAG-polyglutamine lengths and the age of affected HD patients, postulating linear pathologic changes from birth [21]. To quantify an index of the cumulative toxicity of the genetic burden and age, the CAG-age product (CAP)-score was developed as a data-driven approach [22].
The main focus has been on function and neuropsychological (cognitive) disabilities in HD across different stages and the longitudinal disease manifestation [23,24]. To assess motor, cognitive, neuropsychiatric, and functional symptoms, helpful rating scales are validated for HD using the Unified Huntington’s Disease Rating Scale (UHDRS) [4,25]. As part of the UHDRS, the Total Functional Capacity (TFC) score is used to evaluate functional impairments in the domains of occupation, finance, domestic chores, daily living activities, and care level. Depending on the TFC, motor-manifest participants are grouped according to stage 1 (TFC Score 131), 2 (TFC Score 10-7), 3 (TFC Score 6-3), 4 (TFC Score 2-1), and 5 (TFC Score 0). These disease stages are relevant, for example, as inclusion criteria for clinical trials, and the TFC score is investigated as a relevant endpoint.
However, earlier research showed that cognitive impairments and different motor phenotypes may also have an influence on functional capacities in manifest HD [26,27,28]. In particular, dystonia and hypokinetic rigidity have a stronger influence on functional impairments than chorea [2,27]. After reviewing 14 PubMed-published articles, Sellers et al. found some evidence for depression and apathy being associated with decreased functional capacities in Huntington’s disease [29]. As a conflicting result, the influence of cognitive burden and neuropsychiatric symptoms was not confirmed by a study by Gibson et al. in early-stage HD [30]. A more recently published review concluded that further investigations are necessary to gain a better understanding of the mechanisms caused by CAG-repeat-dependent changes occurring alongside different HD phenotypes and symptoms [31]. Neuropsychiatric symptoms have a high prevalence of 33–76% for depression, anxiety, irritability, and apathy in HD [32,33]. The influence of these symptoms on disease progression and, especially, on functional impairments in pre-manifest stages of the disease, however, remains unclear.
In the following sections, we set out to investigate the ENROLL-HD database with regard to the severity of neuropsychiatric, cognitive, and stage-dependent impairments in motor- and pre-manifest HD participants with different functional impairments.
2. Methods
2.1. ENROLL-HD Database with Regard to Functional Classification
ENROLL-HD is a global clinical research platform designed to facilitate clinical research in HD [34]. Core datasets are collected annually from all research participants as part of this global multicenter longitudinal observational study. Data are monitored for quality and accuracy using a risk-based monitoring approach. All sites are required to obtain and maintain local ethics approval. We investigated the periodic dataset 5 (PDS5) and identified 21,116 individual participants [35,36]. The analyzed data were collected as part of the global clinical research platform with participants from North America, Europe, Australasia, and Latin America, starting in 2012 and actively recruiting. The assessed periodic dataset 5 was created before the year 2020.
Ethics approval was obtained from the local ethics committee of Ruhr-University Bochum (No. 4941-14).
To compare disease stages of HD patients with symptoms of different severity with regard to individual functional impairments, we analyzed TFC subscales of the UHDRS functional assessment as defined for stages 1–5 [37,38]. Pre-manifest participants were grouped into five groups according to the predicted onset of <5, 5 to <10, 10 to <15, 15 to <20, and >20 years (with a desired onset probability of 0.6) using the onset calculator developed by Langbehn et al [15].
As inclusion criteria for motor-manifest participants, we set age (≥18 years), a diagnostic confidence level (DCL) of 4 (having unequivocal signs of clinical manifest HD: >99% confidence), a total motor score (TMS) ≥ 5, and a genetically confirmed report with ≥36 cytosine-adenine-guanine (CAG) repeats in the Huntingtin gene (HTT), resulting in a total sample of n = 10,314 participants. As fundamental demographic and genetic parameters, we analyzed age, CAG-repeat length, sex, disease duration, HD diagnosis, motor onset, and total motor score (UHDRS). We additionally calculated CAP scores [22].
With regard to neuropsychiatric symptoms, we investigated the standardized Problem Behaviours Assessment-short (PBA-s) questionnaire, as reported by the clinical rater, analyzing sub-scores for depression, irritability/aggression, psychosis, apathy, and executive functions, as well as self-reported assessments using the Hospital Anxiety and Depression Scale/Snaith Irritability Scale (HADS-SIS) with sub-scores for anxiety, depression, irritability, and outward/inward irritability implemented within the ENROLL-HD clinical visits. Neuropsychiatric sub-scores were calculated based on the frequency and severity of observed symptoms. In terms of cognitive symptoms, we compared performances in the Symbol Digit Modalities, verbal fluency (category), Stroop color naming, Stroop word reading, and Stroop interference test.
2.2. Statistical Analysis
Differences between TFC subgroups were analyzed using multigroup ANOVA analyses. Subsequently, post hoc Tukey HSD was performed to analyze pairwise differences with regard to neuropsychiatric symptoms between disease stages and pre-manifest participants according to calculated years to onset. Chi-square tests were used for analyses of categorical variables. Further, we calculated a moderated regression analysis to identify the influence of age, CAG-repeat length, and their interaction on the functional capacity of motor-manifest HD patients. A simple slope analysis was calculated to illustrate the identified interaction effects. All analyses were calculated using IBM SPSS Statistics V.28.
3. Results
3.1. Motor-Manifest Participants from ENROLL-HD According to Individual Disease Stages
After analyzing the functional status (TFC) of all participants matching the aforementioned criteria, n = 3319 appeared to be classified as stage 1, n = 3580 as stage 2, n = 2296 as stage 3, n = 809 as stage 4, and n = 310 as stage 5, respectively (Figure 1).
We found significant group differences in demographic, genetic, onset, and motor parameters between disease stages of HD participants affected to varying degrees (all p < 0.001). Additionally, the calculated CAP scores showed age-adjusted genetic differences between stages (p < 0.001; Table 1).
3.2. Neuropsychiatric Symptoms According to Different Disease Stages
Neuropsychiatric parameters were analyzed within the PBA-s as the assessment of the clinical rater and within the HADS-SIS as self-reported psychiatric burdens. Significant group differences within baseline neuropsychiatric data revealed mean group differences for all analyzed sub-domain scores within the PBA-s (all p < 0.001) and the HADS-SIS (all p < 0.050).
Highest group domain scores within the PBA for depression were observed in stages 2 and 3, whereby sub-domains for irritability/aggression, psychosis, apathy, and executive functions revealed higher mean sub-scores (more impairment) in disease stages with more functional impairments (stages 4 and 5). Remarkably, self-reported neuropsychiatric impairments in the HADS-SIS scored highest for depression in stages 4 and 5 as well as for irritability, outward and inward irritability in stages 2 and 3 (Table 2).
The subsequent post hoc analyses showed higher group domain scores for depression (PBA) in stage 2 and 3 patients than in stage 1 patients (all p < 0.001). No significant differences were observed for the PBA-depression sub-score in all other group comparisons. Further pairwise comparisons within the domains of irritability/aggression, apathy, and executive functions indicated that groups suffering from higher functional impairments had more impairments within most neuropsychiatric sub-scores. Less pronounced differences between stages were observed within the HADS-SIS anxiety sub-score, with no significant differences between stages, except for the comparison of stage 1 and higher sub-scores in stage 2. The sub-score for depression indicated more impairments in stages with more functional impairments. Irritability and outward irritability revealed—similar to the anxiety sub-score—no differences in post hoc comparisons except for stage 1 vs. stage 2 with more impairments in the latter (Table 3).
3.3. Interaction Effect between Age and CAG-Repeat Length in Motor-Manifest HD
In addition to the comparison of different functional impairment stages with special regard to neuropsychiatric symptoms, we calculated a moderated regression analysis to identify the influence of age and CAG-repeat length on the functional capacity of HD patients with motor manifestations and to illustrate possible interaction effects. Here, we identified that age accounted for a significant amount of variance in the TFC score (R2 = 0.029, F (1;10,281) = 308.02, p < 0.001). Furthermore, CAG-repeat length (∆R2 = 0.132, ∆F (1;10,280) = 1611.22, p < 0.001), and the interaction of both variables explained an additional significant part of variance (∆R2 = 0.049, ∆F (1;10,279) = 634.12, p < 0.001), resulting in an overall explanation of altogether 20.9% within the TFC score´s variance (F (3;10,278) = 907.60, p < 0.001). Additionally, a simple slope analysis was calculated to illustrate the identified interaction effect. Both slopes, for low CAG score (b = −0.16, t = 36.97, p < 0.001) as well as for high CAG score (b = −0.29, t = 49.32, p < 0.001), were significantly different from zero (Figure 2).
3.4. Neuropsychiatric Symptoms in Pre-Manifest HD According to Calculated Years to Onset
Further, we compared neuropsychiatric symptoms in pre-manifest HD participants according to predicted years to onset [15]. Out of n = 5149 pre-manifest HD participants, we identified n = 138 with a predicted onset of <5 years; n = 1242 predicted 5–<10; n = 1215, 10–<15; n = 920, 15–<20 and n = 1634 predicted >20 years to onset (Table 4).
Group comparisons and post hoc analysis regarding the PBA-s in pre-manifest participants revealed increased tendencies toward depressive symptoms in those with a predicted onset between 5 to <10 years and 10 to <15 years compared with participants with a predicted onset further than 20 years. The same differences were found for apathy (all p < 0.010). No distinct group differences were observed for irritability, psychosis, and executive functions. Analysis of the HADS-SIS sub-scores revealed no differences between stages with regard to anxiety. Participants with 5–<10, 10–<15, and 15–<20 years to onset revealed significantly more depression than those with a predicted onset >20 years. Irritability sub-scores showed no differences except for higher scores in participants with 5–<10 if compared with those with >20 years to the predicted onset (Table 5).
4. Discussion
In this study, we analyzed the ENROLL-HD dataset with more than ten thousand participants with motor manifestations according to disease stages based on the TFC and potential influencing factors. We identified more than three thousand patients in disease stages 1 and 2 and more than two thousand in stage 3. Thus, the majority of ENROLL-HD participants were early-manifestation patients. Nevertheless, more than 800 participants were integrated as stage 4 and more than 300 as stage 5, which allowed group comparisons with regard to the functional, motor, neuropsychiatric, and cognitive manifestations. Additionally, we investigated more than five thousand pre-manifest participants with regard to their predicted onset and potential influencing factors on the TFC.
4.1. TFC as a Robust Criterion in Manifest HD: Quantifying Neurobiological Effects
In manifest HD, the TFC was significantly explained by the neurobiological factors of CAG-repeat length, age, and the interaction of both. We analyzed effects in one model, whereby the moderated regression analysis revealed that age, CAG repeats, and their interaction account for 20.9% of the TFC score´s variance—a significant part. Less distinct influences were observed for other factors, such as neuropsychiatric, educational, and cognitive influences. The hypothesis of age-related and CAG-dependent effects having a negative influence on the clinical course was postulated in an earlier approach of Rosenblatt et al., longitudinally assessing clinical data of n = 569 HD subjects, congruent with our findings in a large cohort [39,40]. This objectified classification of age- and genetic-dependent effects on functional impairments helps to assess to what extent interventional strategies or other genetic and epigenetic modifiers might improve disease-dependent dysfunctions. It helps furthermore to classify to what extent biomarkers are present other than age- and CAG-dependent findings [41,42]. Our analysis in the simple-slope model is even more relevant since earlier preclinical approaches in mice investigated the effects of the HD mutation on age-dependent pathways [43]. Additionally, a significant amount of an illustrated CAG impact on the TFC, which can be confirmed in our modeling approach, reveals that targeting CAG-repeat-dependent mechanisms as a therapeutic approach might explain a significant amount of beneficial effects on functional impairments [44]. Other influencing factors on the genetic cause of the disease, such as DNA repair mechanisms earlier investigated in HD, and their role in modulating the age of onset need to be discussed further [45,46].
The underlying neurobiological effect of age and CAG-repeat length on function is supported by a faster functional decline in subjects with higher CAGs and older patients in the simple slope analysis (Figure 2). This is presented here in one model based on a large clinical dataset. As a relevant factor and potential explanation of the faster decline in function and thus disease progression, one might assume somatic expansion as another relevant factor. Somatic expansion is known to increase with age and CAG-repeat length and has also been discussed to be responsible for a faster disease progression in juvenile or pediatric HD [40,47,48]. This might be a potential explanation for different progress in phenotypes with choreatic, akinetic-rigid, or hypokinetic symptoms [2].
4.2. Psychiatric and Cognitive Manifestation in Manifest HD and Its Influence on TFC-Based Stages
In our analyses, there was no independent significant impact of neuropsychiatric, cognitive, or educational aspects on disease stages according to the TFC (stages 1–5). Of course, there was a stage-dependent decline in cognition and behavioral changes with higher scores for depression in stages 2 and 3 and more irritability, psychosis, apathy, and less executive function (PBA-s) in higher stages as well as the highest scores for depression in stages 4, 5 and for irritability in stages 2 and 3 in the HADS-SIS.
All these changes, however, could not significantly explain the TFC-stage classification independently in manifest HD. Hence, our analysis does not support an influence of distinct cognitive and motor aspects on the TFC. Thus, we cannot confirm the independent effects of depression and apathy or cognitive impairments on the TFC as earlier described [29,30].
4.3. Analyzing Different “Pre-Manifesting Aspects” in Pre-Manifest HD
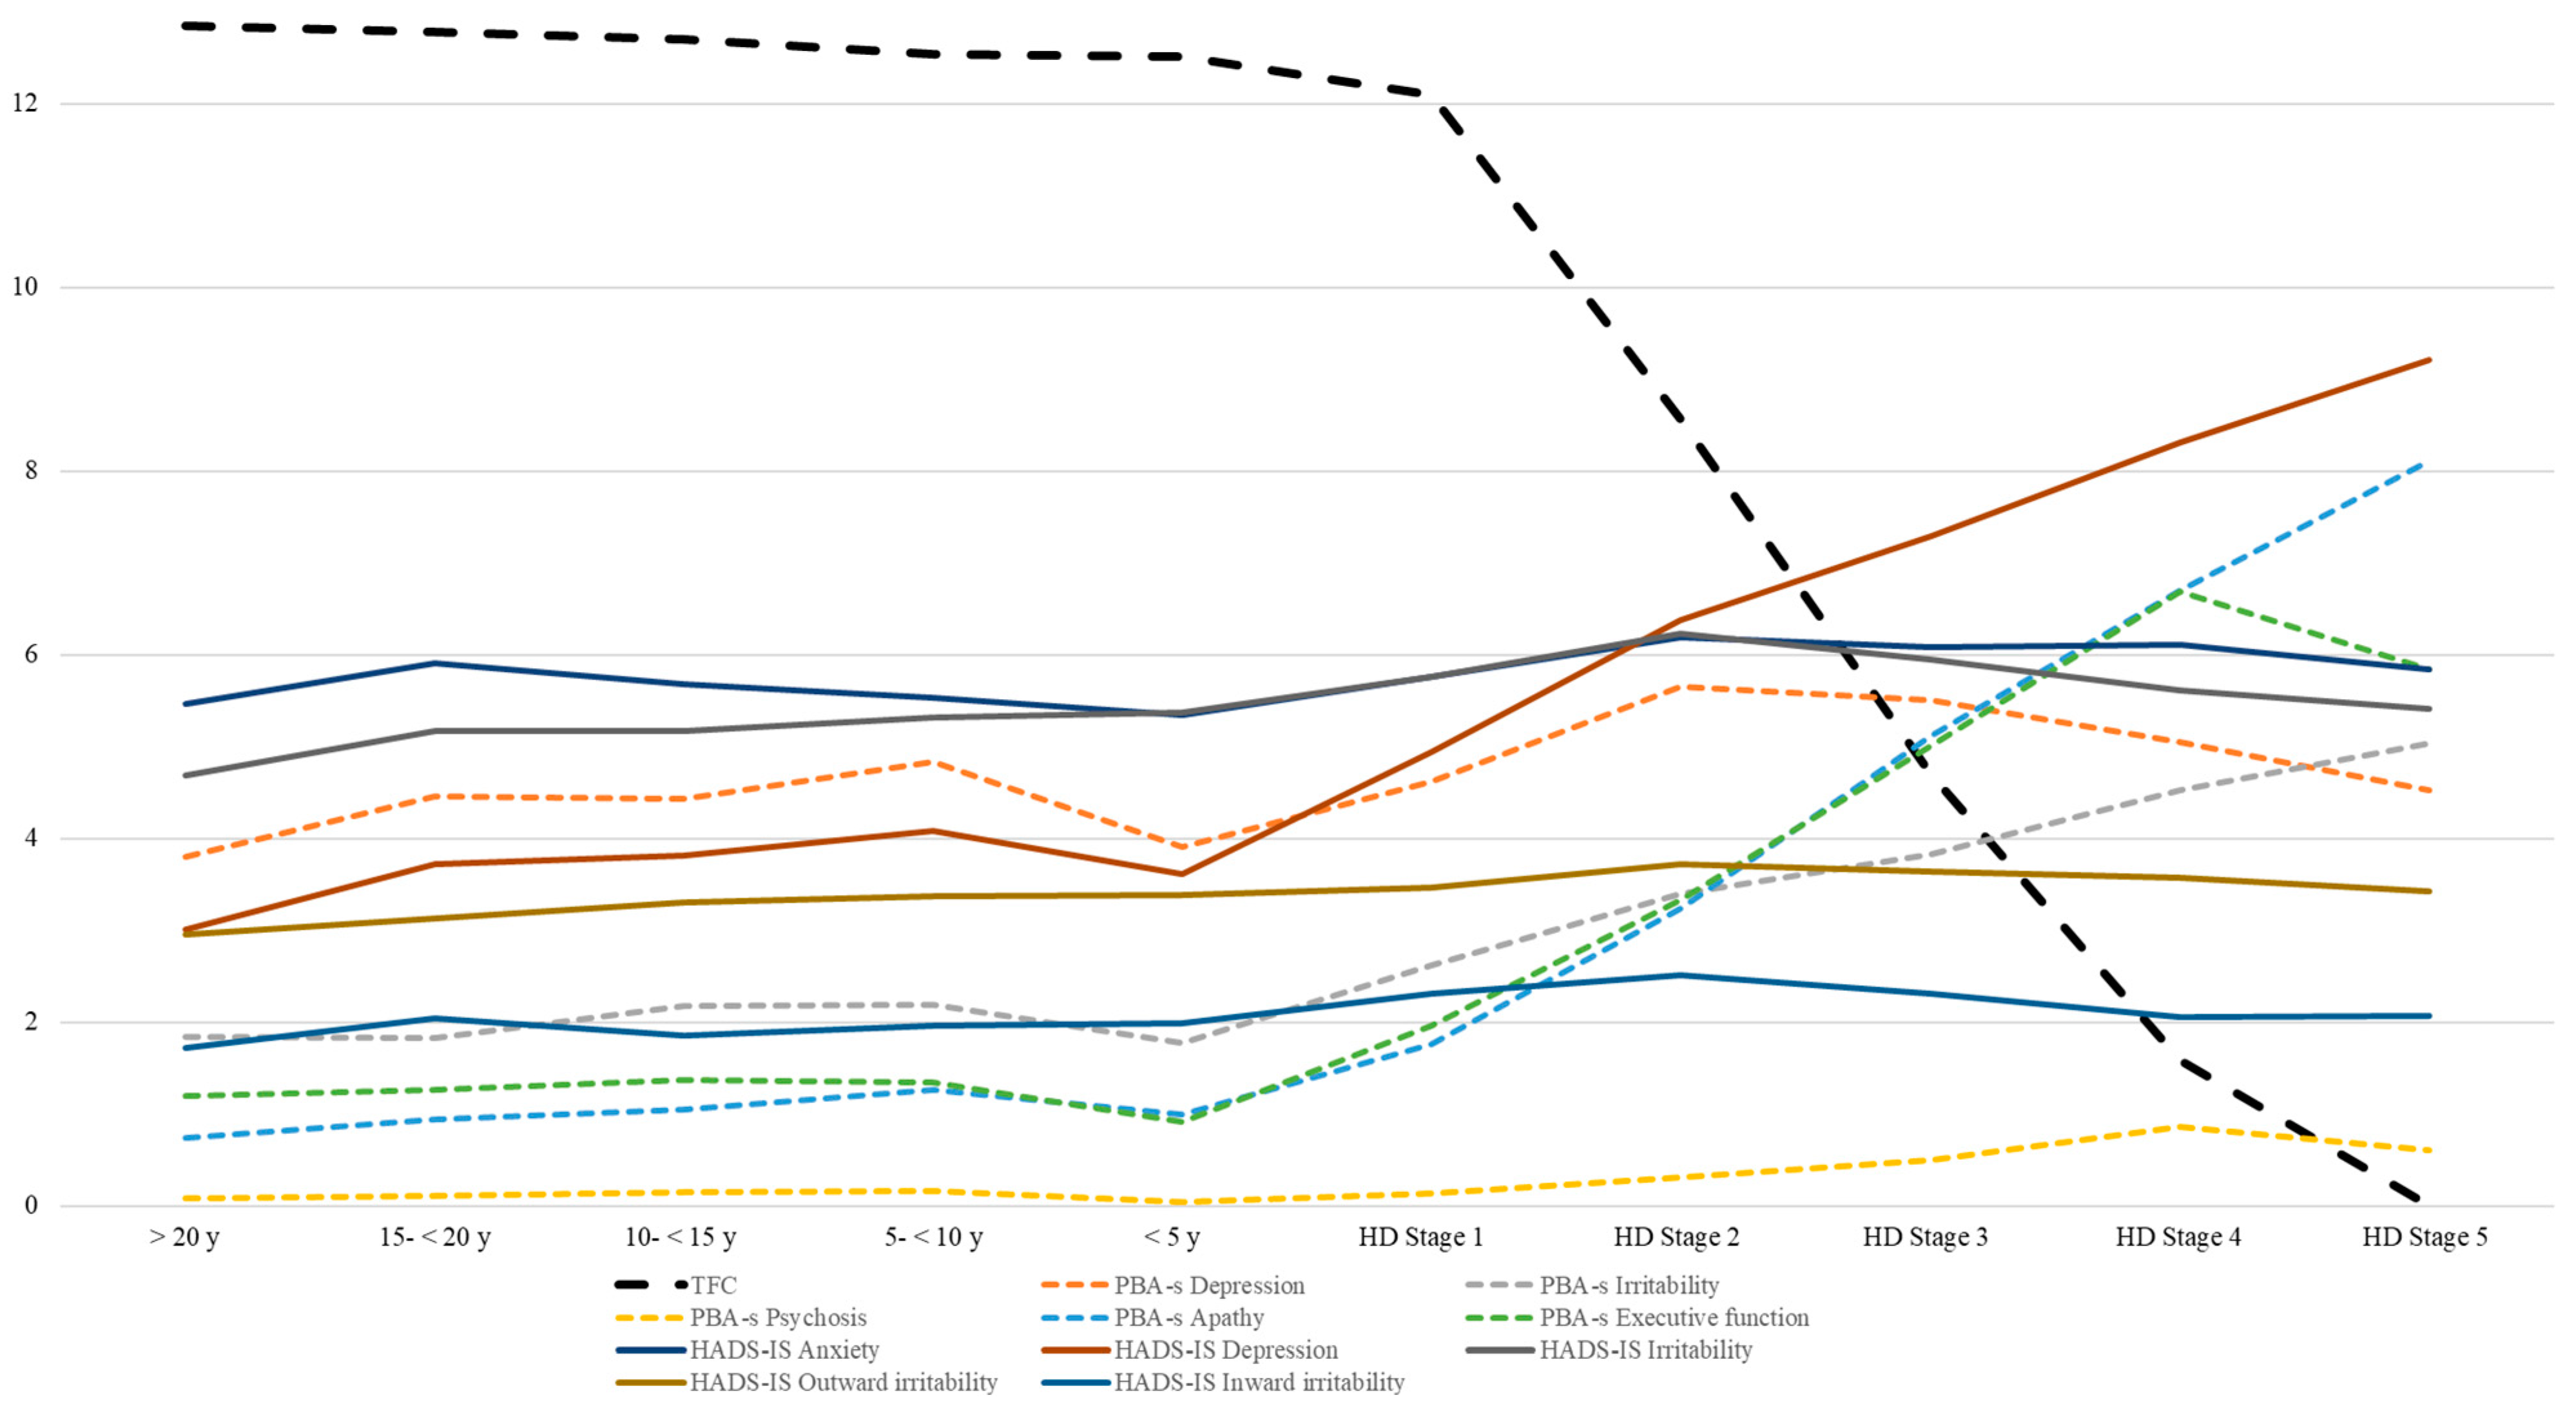
Analysis of neuropsychiatric changes in pre-manifest HD showed the highest impairments in those patients who were 5–15 years away from the predicted onset (Table 4 and Table 5). This is in line with earlier findings of psychiatric changes in prodromal HD [49]. As depicted in our illustrations (Figure 3 and Figure 4), there is a decline in cognitive test results and an increased rate of neuropsychiatric impairment in the prodromal stage of HD accompanied by a slight decline in TFC (<5 y up to <15 y to onset). However, these cognitive or neuropsychiatric aspects do not independently explain TFC changes. Thus, we confirm that the adequate use of the TFC score is limited to the manifest stages but less to the pre-manifest stage. Remarkably, the median data of the PBA-s revealed higher scores in the timeframe between 5 to <10, 10 to <15, and 15 to <20 than <5 years to the predicted onset, which confirms the hypothesis of psychiatric symptoms as frequently observed as early changes prior to the motor onset [1].
As a limitation, the prediction model and ENROLL-HD dataset revealed a comparatively low number of n = 138 pre-manifest participants in the <5 years to the predicted onset timeframe. This may be explained by the probability score, which is frequently used for the calculation of years to onset [16]. Nevertheless, this clinically orientated subdivision allows for a more precise assessment in pre-manifest HD [50]. As another limitation, neuropsychiatric symptoms were categorized as self-assessments without asking for other mental diseases, so, e.g., anxiety and depression could be misinterpreted. To minimize a potential bias, assessments by the clinical rater (PBA-s) were additionally analyzed.
Since these psychiatric and cognitive changes before the motor onset are difficult to interpret on an individual level and these changes are inconsistent (e.g., depression decreases in stage 5), it justifies the introduction of a biomarker stage in the pre-manifest stages as recently suggested by Tabrizi et al [51].
In summary, the moderated regression model and simple slope analysis appeared to be useful statistical approaches for analyzing the largest cohort of more than 10,000 motor- and pre-manifest HD participants according to influences on the TFC. We found that TFC was mainly explained by the neurobiological factors of CAG-repeat length and age. The TFC was confirmed as a robust measure of progression in manifest HD. There was some decline in cognitive test results and an increased rate of depression and apathy in the prodromal stage of HD, without independently influencing the TFC.
Author Contributions
J.A.: Research project: Conception, Organization, Execution; Statistical Analysis: Design, Execution; Manuscript Preparation: Writing of the first draft; B.S.: Statistical Analysis: Design, Execution, Review and Critique; Manuscript Preparation: Review and Critique; C.S.: Research project: Conception, Organization; Statistical Analysis: Design, Execution, Review and Critique; Manuscript Preparation: Review and Critique. All authors have read and agreed to the published version of the manuscript.
Funding
This research received no external funding.
Institutional Review Board Statement
The study was conducted in accordance with the Declaration of Helsinki, and the protocol was approved by the ethics committees of all parties of the global multicenter longitudinal observational study ENROLL-HD. They are required to obtain and maintain local ethical approval (ClinicalTrials.gov Identifier: NCT01574053).
Informed Consent Statement
All subjects gave their informed consent for inclusion before they participated in the study.
Data Availability Statement
The data that support the findings of this study are available from the authors. Upon a reasonable request, the data can be provided with permission given by the Cure Huntington’s Disease Initiative (CHDI).
Acknowledgments
ENROLL-HD is a clinical research platform and longitudinal observational study for families affected by Huntington’s disease intended to accelerate progress toward therapeutics; it is sponsored by the CHDI Foundation, a nonprofit biomedical research organization exclusively dedicated to collaboratively developing therapeutics for HD. ENROLL-HD would not be possible without the vital contribution of the research participants and their families. We acknowledge the individuals (https://enroll-hd.org/enrollhd_documents/ENROLL-HD_AcknowledgementsListPDS6_v1.0_20230119.pdf, accessed on 12 December 2022) who contributed to the collection of the ENROLL-HD data.
Conflicts of Interest
The authors declare no conflict of interest relevant to the content of this manuscript. JA and BS declare no conflicts of interest. CS reports personal fees/honoraria from Teva Pharma GmbH; he is a member of the advisory board of NOVARTIS and VICO, and he also acknowledges nonfinancial support and other support from ENROLL-HD study (CHDI), PRIDE-HD (TEVA, Neurosearch), PROOF-HD (Prilenia), LEGATO (TEVA), Amaryllis (Pfizer), AFQ056 (Novartis), ASO (IONIS Pharmaceuticals, Roche AG, WAVE), and PTC Therapeutics for the conducting of studies and grants from Biogen, the German Huntington Foundation, and CHDI all outside the submitted work and without relevance to the manuscript.
References
- Roos, R.A.C. Huntington’s disease: A clinical review. Orphanet. J. Rare Dis. 2010, 5, 40. [Google Scholar] [CrossRef] [PubMed]
- Achenbach, J.; von Hein, S.M.; Saft, C. Functional and cognitive capacity differ in dystonic motor subtypes when compared to choreatic and hypokinetic-rigid motor subtypes in Huntington’s disease. Brain Behav. 2020, 10, e01704. [Google Scholar] [CrossRef] [PubMed]
- Walker, F.O. Huntington’s disease. Lancet 2007, 369, 218–228. [Google Scholar] [CrossRef] [PubMed]
- Mestre, T.A.; van Duijn, E.; Davis, A.M.; Bachoud-Lévi, A.-C.; Busse, M.; Anderson, K.E.; Ferreira, J.J.; Mahlknecht, P.; Tumas, V.; Sampaio, C.; et al. Rating scales for behavioral symptoms in Huntington’s disease: Critique and recommendations. Mov. Disord. 2016, 31, 1466–1478. [Google Scholar] [CrossRef]
- Ellis, N.; Tee, A.; McAllister, B.; Massey, T.; McLauchlan, D.; Stone, T.; Correia, K.; Loupe, J.; Kim, K.-H.; Barker, D.; et al. Genetic Risk Underlying Psychiatric and Cognitive Symptoms in Huntington’s Disease. Biol. Psychiatry 2020, 87, 857–865. [Google Scholar] [CrossRef]
- Paulsen, J.S.; Ready, R.E.; Hamilton, J.M.; Mega, M.S.; Cummings, J.L. Neuropsychiatric aspects of Huntington’s disease. J. Neurol. Neurosurg. Psychiatry 2001, 71, 310–314. [Google Scholar] [CrossRef]
- Goh, A.M.; Wibawa, P.; Loi, S.M.; Walterfang, M.; Velakoulis, D.; Looi, J.C. Huntington’s disease: Neuropsychiatric manifestations of Huntington’s disease. Australas. Psychiatry 2018, 26, 366–375. [Google Scholar] [CrossRef]
- Gregory, S.; Scahill, R.I.; Seunarine, K.K.; Stopford, C.; Zhang, H.; Zhang, J.; Orth, M.; Durr, A.; Roos, R.A.C.; Langbehn, D.R.; et al. Neuropsychiatry and White Matter Microstructure in Huntington’s Disease. J. Huntingt. Dis. 2015, 4, 239–249. [Google Scholar] [CrossRef]
- Bordelon, Y.M. Clinical neurogenetics: Huntington disease. Neurol. Clin. 2013, 31, 1085–1094. [Google Scholar] [CrossRef]
- Vassos, E.; Panas, M.; Kladi, A.; Vassilopoulos, D. Effect of CAG repeat length on psychiatric disorders in Huntington’s disease. J. Psychiatr. Res. 2008, 42, 544–549. [Google Scholar] [CrossRef]
- McAllister, B.; Gusella, J.F.; Landwehrmeyer, G.B.; Lee, J.-M.; MacDonald, M.E.; Orth, M.; Rosser, A.E.; Williams, N.M.; Holmans, P.; Jones, L.; et al. Timing and Impact of Psychiatric, Cognitive, and Motor Abnormalities in Huntington Disease. Neurology 2021, 96, e2395–e2406. [Google Scholar] [CrossRef] [PubMed]
- Goold, R.; Flower, M.; Moss, D.H.; Medway, C.; Wood-Kaczmar, A.; Andre, R.; Farshim, P.; Bates, G.P.; Holmans, P.; Jones, L.; et al. FAN1 modifies Huntington’s disease progression by stabilizing the expanded HTT CAG repeat. Hum. Mol. Genet. 2019, 28, 650–661. [Google Scholar] [CrossRef] [PubMed]
- Sun, Y.-M.; Zhang, Y.-B.; Wu, Z.-Y. Huntington’s Disease: Relationship Between Phenotype and Genotype. Mol. Neurobiol. 2017, 54, 342–348. [Google Scholar] [CrossRef] [PubMed]
- Wexler, N.S.; Lorimer, J.; Porter, J.; Gomez, F.; Moskowitz, C.; Shackell, E.; Marder, K.; Penchaszadeh, G.; Roberts, S.A.; Gayán, J.; et al. Venezuelan kindreds reveal that genetic and environmental factors modulate Huntington’s disease age of onset. Proc. Natl. Acad. Sci. USA 2004, 101, 3498–3503. [Google Scholar] [PubMed]
- Langbehn, D.R.; Hayden, M.R.; Paulsen, J.S. CAG-repeat length and the age of onset in Huntington disease (HD): A review and validation study of statistical approaches. Am. J. Med. Genet. B Neuropsychiatr. Genet. 2010, 153, 397–408. [Google Scholar] [CrossRef] [PubMed]
- Langbehn, D.R.; Paulsen, J.S. Predictors of diagnosis in Huntington disease. Neurology 2007, 68, 1710–1717. [Google Scholar] [CrossRef]
- Furtado, S.; Suchowersky, O.; Rewcastle, B.; Graham, L.; Klimek, M.L.; Garber, A. Relationship between trinucleotide repeats and neuropathological changes in Huntington’s disease. Ann. Neurol. 1996, 39, 132–136. [Google Scholar] [CrossRef]
- Vojvodić, N.; Culjković, B.; Romac, S.; Stojković, O.; Sternić, N.; Sokić, D.; Kostić, V.S. Znacaj povećanja broja trinukleotidnih ponovaka za klinicka ispoljavanja Hantigtonove horeje. Srp. Arh. Celok. Lek. 1998, 126, 77–82. [Google Scholar]
- Sieradzan, K.; Mann, D.M.; Dodge, A. Clinical presentation and patterns of regional cerebral atrophy related to the length of trinucleotide repeat expansion in patients with adult onset Huntington’s disease. Neurosci. Lett. 1997, 225, 45–48. [Google Scholar] [CrossRef]
- Andrew, S.E.; Goldberg, Y.P.; Kremer, B.; Telenius, H.; Theilmann, J.; Adam, S.; Starr, E.; Squitieri, F.; Lin, B.; Kalchman, M.A. The relationship between trinucleotide (CAG) repeat length and clinical features of Huntington’s disease. Nat. Genet. 1993, 4, 398–403. [Google Scholar] [CrossRef]
- Penney, J.B.; Vonsattel, J.P.; MacDonald, M.E.; Gusella, J.F.; Myers, R.H. CAG repeat number governs the development rate of pathology in Huntington’s disease. Ann. Neurol. 1997, 41, 689–692. [Google Scholar] [CrossRef] [PubMed]
- Zhang, Y.; Long, J.D.; Mills, J.A.; Warner, J.H.; Lu, W.; Paulsen, J.S. Indexing disease progression at study entry with individuals at-risk for Huntington disease. Am. J. Med. Genet. B Neuropsychiatr. Genet. 2011, 156B, 751–763. [Google Scholar] [CrossRef] [PubMed]
- Ross, C.A.; Pantelyat, A.; Kogan, J.; Brandt, J. Determinants of functional disability in Huntington’s disease: Role of cognitive and motor dysfunction. Mov. Disord. 2014, 29, 1351–1358. [Google Scholar] [CrossRef] [PubMed]
- Paulsen, J.S.; Nehl, C.; Hoth, K.F.; Kanz, J.E.; Benjamin, M.; Conybeare, R.; McDowell, B.; Turner, B. Depression and stages of Huntington’s disease. J. Neuropsychiatry Clin. Neurosci. 2005, 17, 496–502. [Google Scholar] [CrossRef] [PubMed]
- de Souza, J.; Jones, L.A.; Rickards, H. Validation of self-report depression rating scales in Huntington’s disease. Mov. Disord. 2010, 25, 91–96. [Google Scholar] [CrossRef] [PubMed]
- Horta-Barba, A.; Martínez-Horta, S.; Pérez-Pérez, J.; Sampedro, F.; Puig-Davi, A.; Pagonabarraga, J.; Kulisevsky, J. Measuring the functional impact of cognitive impairment in Huntington’s disease. J. Neurol. 2022, 269, 3541–3549. [Google Scholar] [CrossRef] [PubMed]
- Carlozzi, N.E.; Schilling, S.G.; Boileau, N.R.; Chou, K.L.; Perlmutter, J.S.; Frank, S.; McCormack, M.K.; Stout, J.C.; Paulsen, J.S.; Lai, J.-S.; et al. How different aspects of motor dysfunction influence day-to-day function in huntington’s disease. Mov. Disord. 2019, 34, 1910–1914. [Google Scholar] [CrossRef]
- Marder, K.; Zhao, H.; Myers, R.H.; Cudkowicz, M.; Kayson, E.; Kieburtz, K.; Orme, C.; Paulsen, J.; Penney, J.B.; Siemers, E.; et al. Rate of functional decline in Huntington’s disease. Huntington Study Group. Neurology 2000, 54, 452–458. [Google Scholar] [CrossRef]
- Sellers, J.; Ridner, S.H.; Claassen, D.O. A Systematic Review of Neuropsychiatric Symptoms and Functional Capacity in Huntington’s Disease. J. Neuropsychiatry Clin. Neurosci. 2020, 32, 109–124. [Google Scholar] [CrossRef]
- Gibson, J.S.; Ridner, S.H.; Dietrich, M.S.; Sohn, M.B.; Rhoten, B.A.; Claassen, D.O. Measuring Functional Status in Huntington’s Disease. Mov. Disord. 2021, 36, 757–761. [Google Scholar] [CrossRef]
- Podvin, S.; Reardon, H.T.; Yin, K.; Mosier, C.; Hook, V. Multiple clinical features of Huntington’s disease correlate with mutant HTT gene CAG repeat lengths and neurodegeneration. J. Neurol. 2019, 266, 551–564. [Google Scholar] [CrossRef] [PubMed]
- van Duijn, E.; Kingma, E.M.; van der Mast, R.C. Psychopathology in verified Huntington’s disease gene carriers. J. Neuropsychiatry Clin. Neurosci. 2007, 19, 441–448. [Google Scholar] [CrossRef] [PubMed]
- Thompson, J.C.; Harris, J.; Sollom, A.C.; Stopford, C.L.; Howard, E.; Snowden, J.S.; Craufurd, D. Longitudinal evaluation of neuropsychiatric symptoms in Huntington’s disease. J. Neuropsychiatry Clin. Neurosci. 2012, 24, 53–60. [Google Scholar] [CrossRef] [PubMed]
- Landwehrmeyer, G.B.; Fitzer-Attas, C.J.; Giuliano, J.D.; Gonçalves, N.; Anderson, K.E.; Cardoso, F.; Ferreira, J.J.; Mestre, T.A.; Stout, J.C.; Sampaio, C. Data Analytics from Enroll-HD, a Global Clinical Research Platform for Huntington’s Disease. Mov. Disord. Clin. Pract. 2017, 4, 212–224. [Google Scholar] [CrossRef] [PubMed]
- Achenbach, J.; Saft, C.; Faissner, S. Longitudinal Evaluation of the Effect of Tricyclic Antidepressants and Neuroleptics on the Course of Huntington’s Disease—Data from a Real World Cohort. Brain Sci. 2021, 11, 413. [Google Scholar] [CrossRef] [PubMed]
- Achenbach, J.; Saft, C. Data from ENROLL-HD: Is the prevalence of juvenile and pediatric Huntington’s disease overestimated? Park. Relat. Disord. 2021, 88, 1–2. [Google Scholar] [CrossRef]
- Huntington Study Group. Unified Huntington’s Disease Rating Scale: Reliability and consistency. Mov. Disord. 1996, 11, 136–142. [Google Scholar] [CrossRef]
- Shoulson, I.; Fahn, S. Huntington disease: Clinical care and evaluation. Neurology 1979, 29, 1–3. [Google Scholar] [CrossRef]
- Rosenblatt, A.; Kumar, B.V.; Mo, A.; Welsh, C.S.; Margolis, R.L.; Ross, C.A. Age, CAG repeat length, and clinical progression in Huntington’s disease. Mov. Disord. 2012, 27, 272–276. [Google Scholar] [CrossRef]
- Swami, M.; Hendricks, A.E.; Gillis, T.; Massood, T.; Mysore, J.; Myers, R.H.; Wheeler, V.C. Somatic expansion of the Huntington’s disease CAG repeat in the brain is associated with an earlier age of disease onset. Hum. Mol. Genet. 2009, 18, 3039–3047. [Google Scholar] [CrossRef]
- Bassi, S.; Tripathi, T.; Monziani, A.; Di Leva, F.; Biagioli, M. Epigenetics of Huntington’s Disease. Adv. Exp. Med. Biol. 2017, 978, 277–299. [Google Scholar] [PubMed]
- Lee, J.; Hwang, Y.J.; Kim, K.Y.; Kowall, N.W.; Ryu, H. Epigenetic mechanisms of neurodegeneration in Huntington’s disease. Neurotherapeutics 2013, 10, 664–676. [Google Scholar] [CrossRef] [PubMed]
- Alcalá-Vida, R.; Seguin, J.; Lotz, C.; Molitor, A.M.; Irastorza-Azcarate, I.; Awada, A.; Karasu, N.; Bombardier, A.; Cosquer, B.; Skarmeta, J.L.G.; et al. Age-related and disease locus-specific mechanisms contribute to early remodelling of chromatin structure in Huntington’s disease mice. Nat. Commun. 2021, 12, 364. [Google Scholar] [CrossRef] [PubMed]
- Aziz, N.A.; van der Burg, J.M.M.; Tabrizi, S.J.; Landwehrmeyer, G.B. Overlap between age-at-onset and disease-progression determinants in Huntington disease. Neurology 2018, 90, e2099–e2106. [Google Scholar] [CrossRef] [PubMed]
- Jones, L.; Houlden, H.; Tabrizi, S.J. DNA repair in the trinucleotide repeat disorders. Lancet Neurol. 2017, 16, 88–96. [Google Scholar] [CrossRef] [PubMed]
- Jonson, I.; Ougland, R.; Larsen, E. DNA Repair Mechanisms in Huntington’s Disease. Mol. Neurobiol. 2013, 47, 1093–1102. [Google Scholar] [CrossRef] [PubMed]
- Pinto, R.M.; Arning, L.; Giordano, J.V.; Razghandi, P.; Andrew, M.A.; Gillis, T.; Correia, K.; Mysore, J.S.; Urtubey, D.-M.G.; Parwez, C.R.; et al. Patterns of CAG repeat instability in the central nervous system and periphery in Huntington’s disease and in spinocerebellar ataxia type 1. Hum. Mol. Genet. 2020, 29, 2551–2567. [Google Scholar] [CrossRef]
- Fusilli, C.; Migliore, S.; Mazza, T.; Consoli, F.; de Luca, A.; Barbagallo, G.; Ciammola, A.; Gatto, E.M.; Cesarini, M.; Etcheverry, J.L.; et al. Biological and clinical manifestations of juvenile Huntington’s disease: A retrospective analysis. Lancet Neurol. 2018, 17, 986–993. [Google Scholar] [CrossRef]
- Epping, E.A.; Kim, J.-I.; Craufurd, D.; Brashers-Krug, T.M.; Anderson, K.E.; McCusker, E.; Luther, J.; Long, J.D.; Paulsen, J.S. Longitudinal Psychiatric Symptoms in Prodromal Huntington’s Disease: A Decade of Data. Am. J. Psychiatry 2016, 173, 184–192. [Google Scholar] [CrossRef]
- Achenbach, J.; Saft, C. Another Perspective on Huntington’s Disease: Disease Burden in Family Members and Pre-Manifest HD When Compared to Genotype-Negative Participants from ENROLL-HD. Brain Sci. 2021, 11, 1621. [Google Scholar] [CrossRef]
- Tabrizi, S.J.; Schobel, S.; Gantman, E.C.; Mansbach, A.; Borowsky, B.; Konstantinova, P.; Mestre, T.A.; Panagoulias, J.; Ross, C.A.; Zauderer, M.; et al. A biological classification of Huntington’s disease: The Integrated Staging System. Lancet Neurol. 2022, 21, 632–644. [Google Scholar] [CrossRef] [PubMed]
Figure 1.
Data analysis of motor-manifest participants from ENROLL-HD according to disease stages. Abbreviations: PDS-5: Periodic dataset 5; HD: Huntington´s Disease; TFC: Total Functional Capacity.
Figure 1.
Data analysis of motor-manifest participants from ENROLL-HD according to disease stages. Abbreviations: PDS-5: Periodic dataset 5; HD: Huntington´s Disease; TFC: Total Functional Capacity.
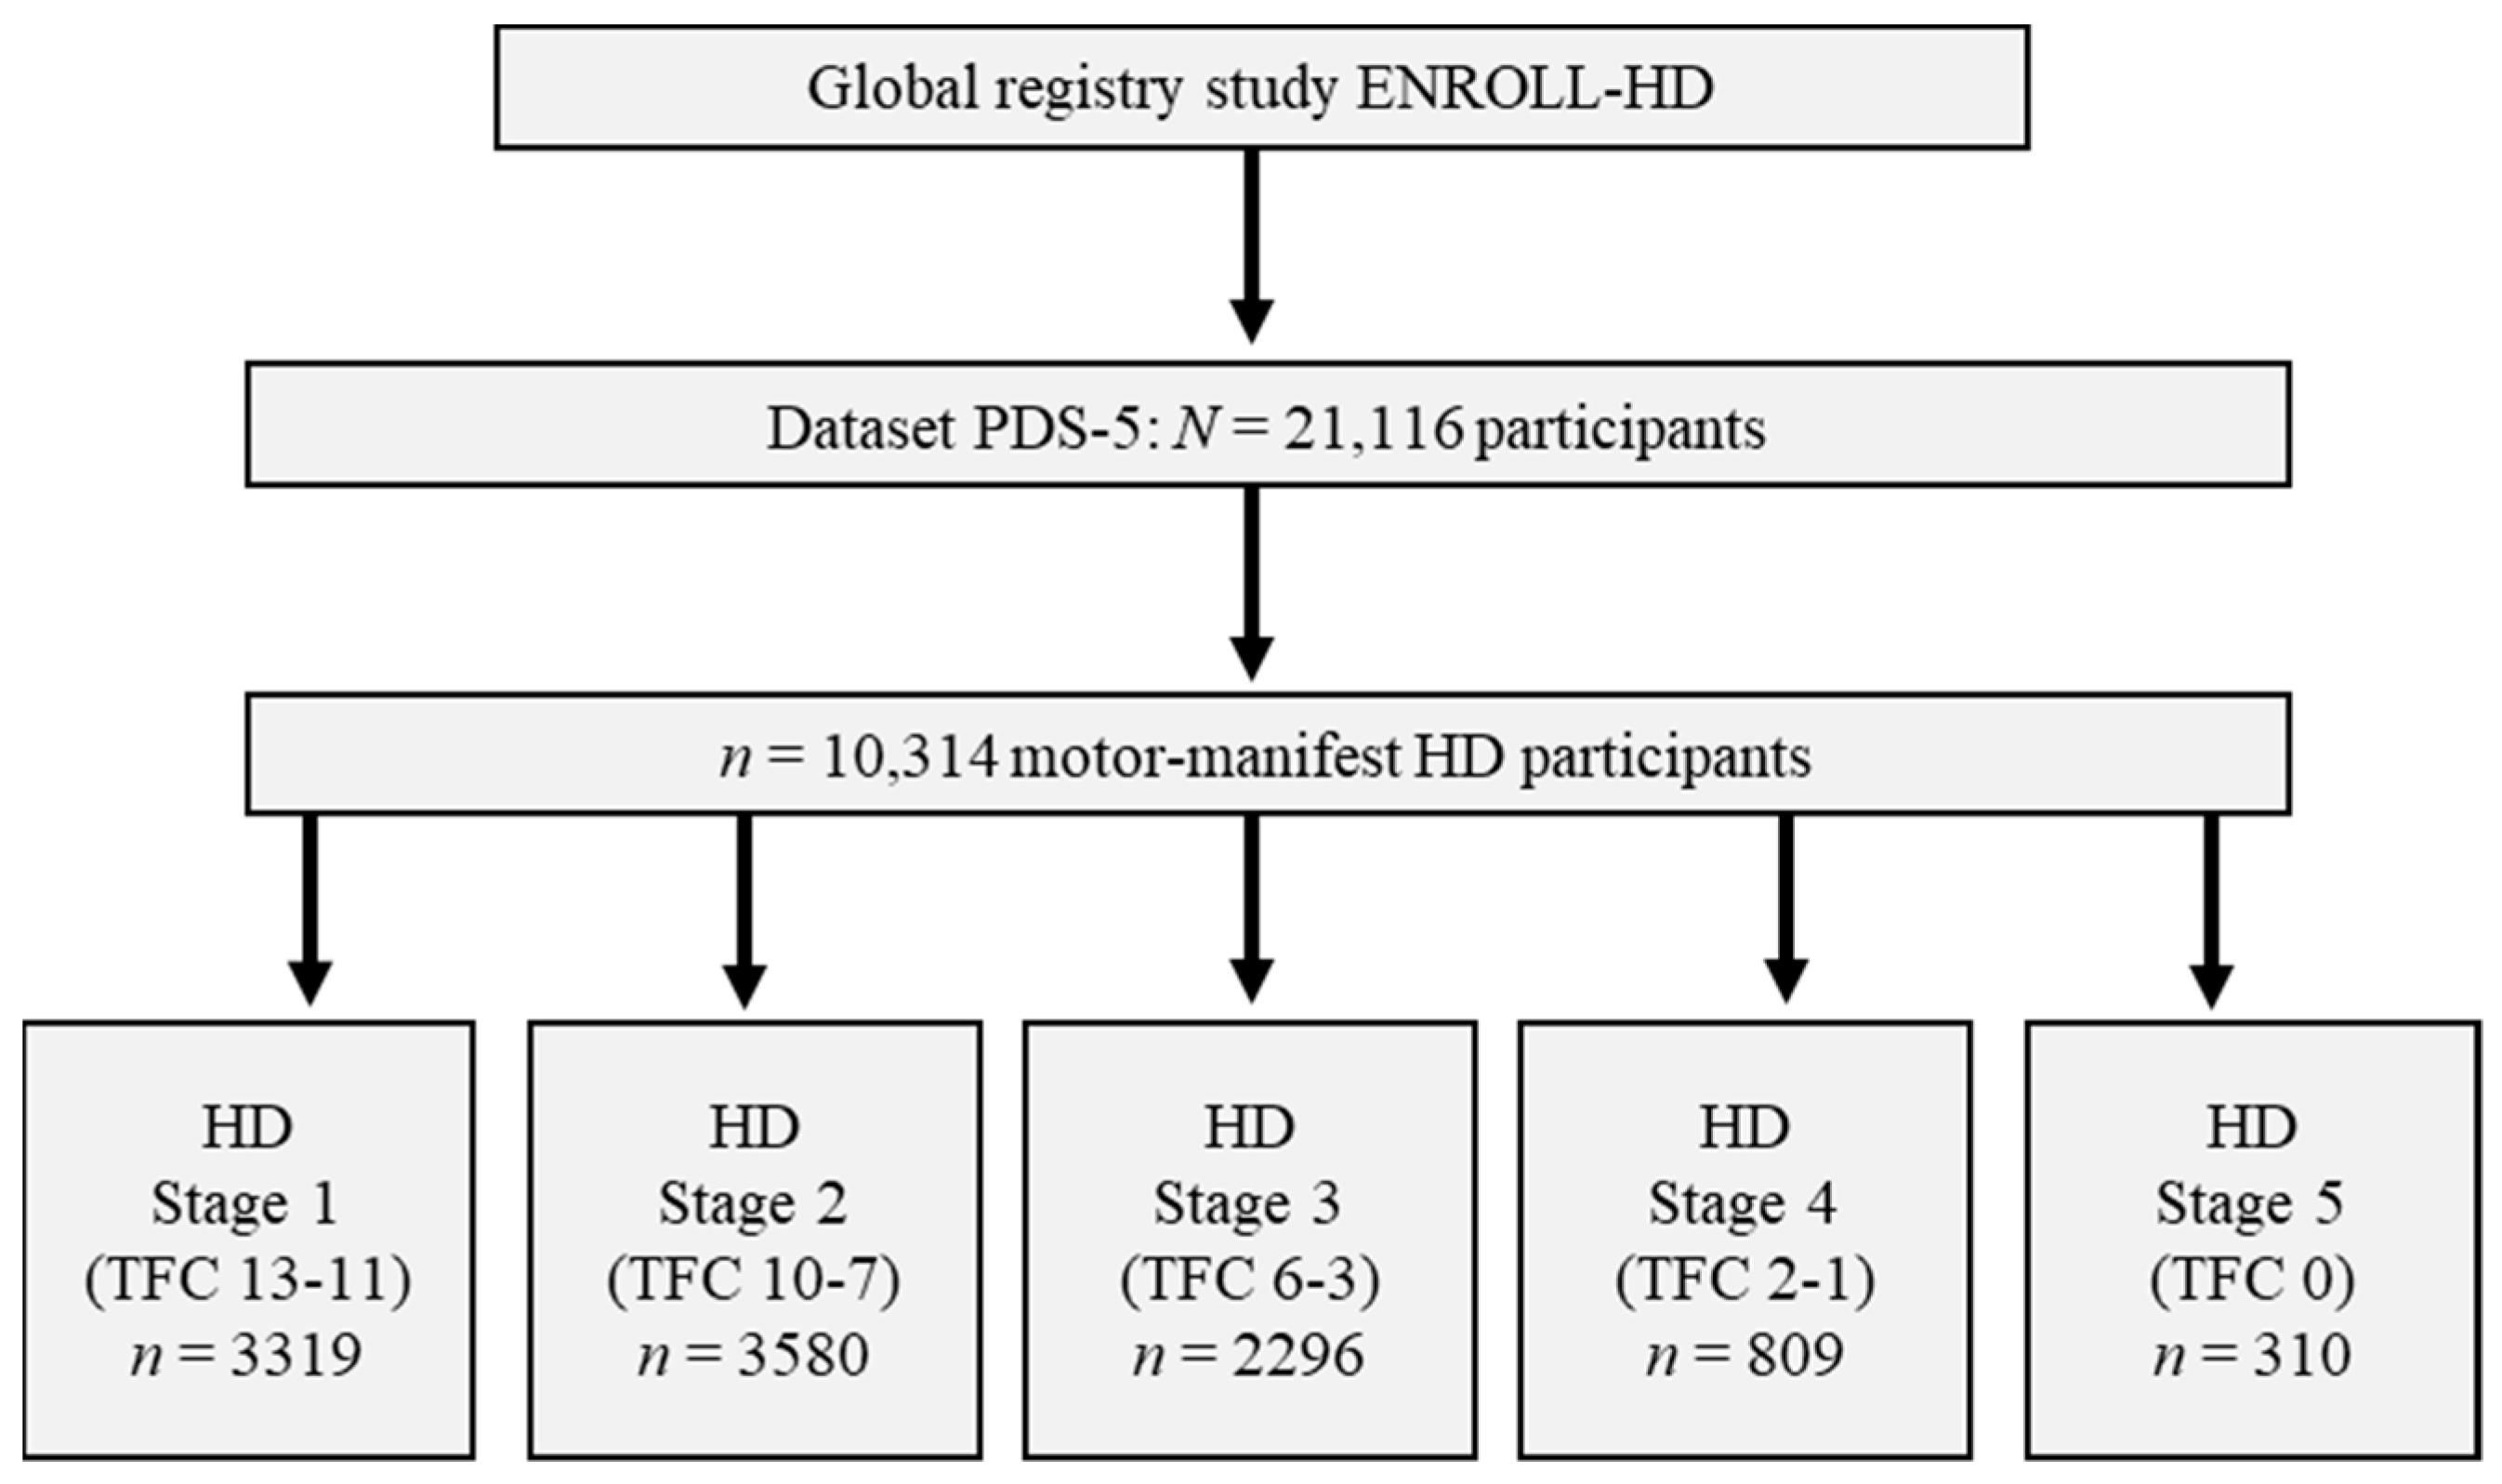
Figure 2.
Interaction effect illustrated as simple slopes. Abbreviations: CAG: cytosine-adenine-guanine repeat length; TFC: Total Functional Capacity. * p < 0.001.
Figure 2.
Interaction effect illustrated as simple slopes. Abbreviations: CAG: cytosine-adenine-guanine repeat length; TFC: Total Functional Capacity. * p < 0.001.
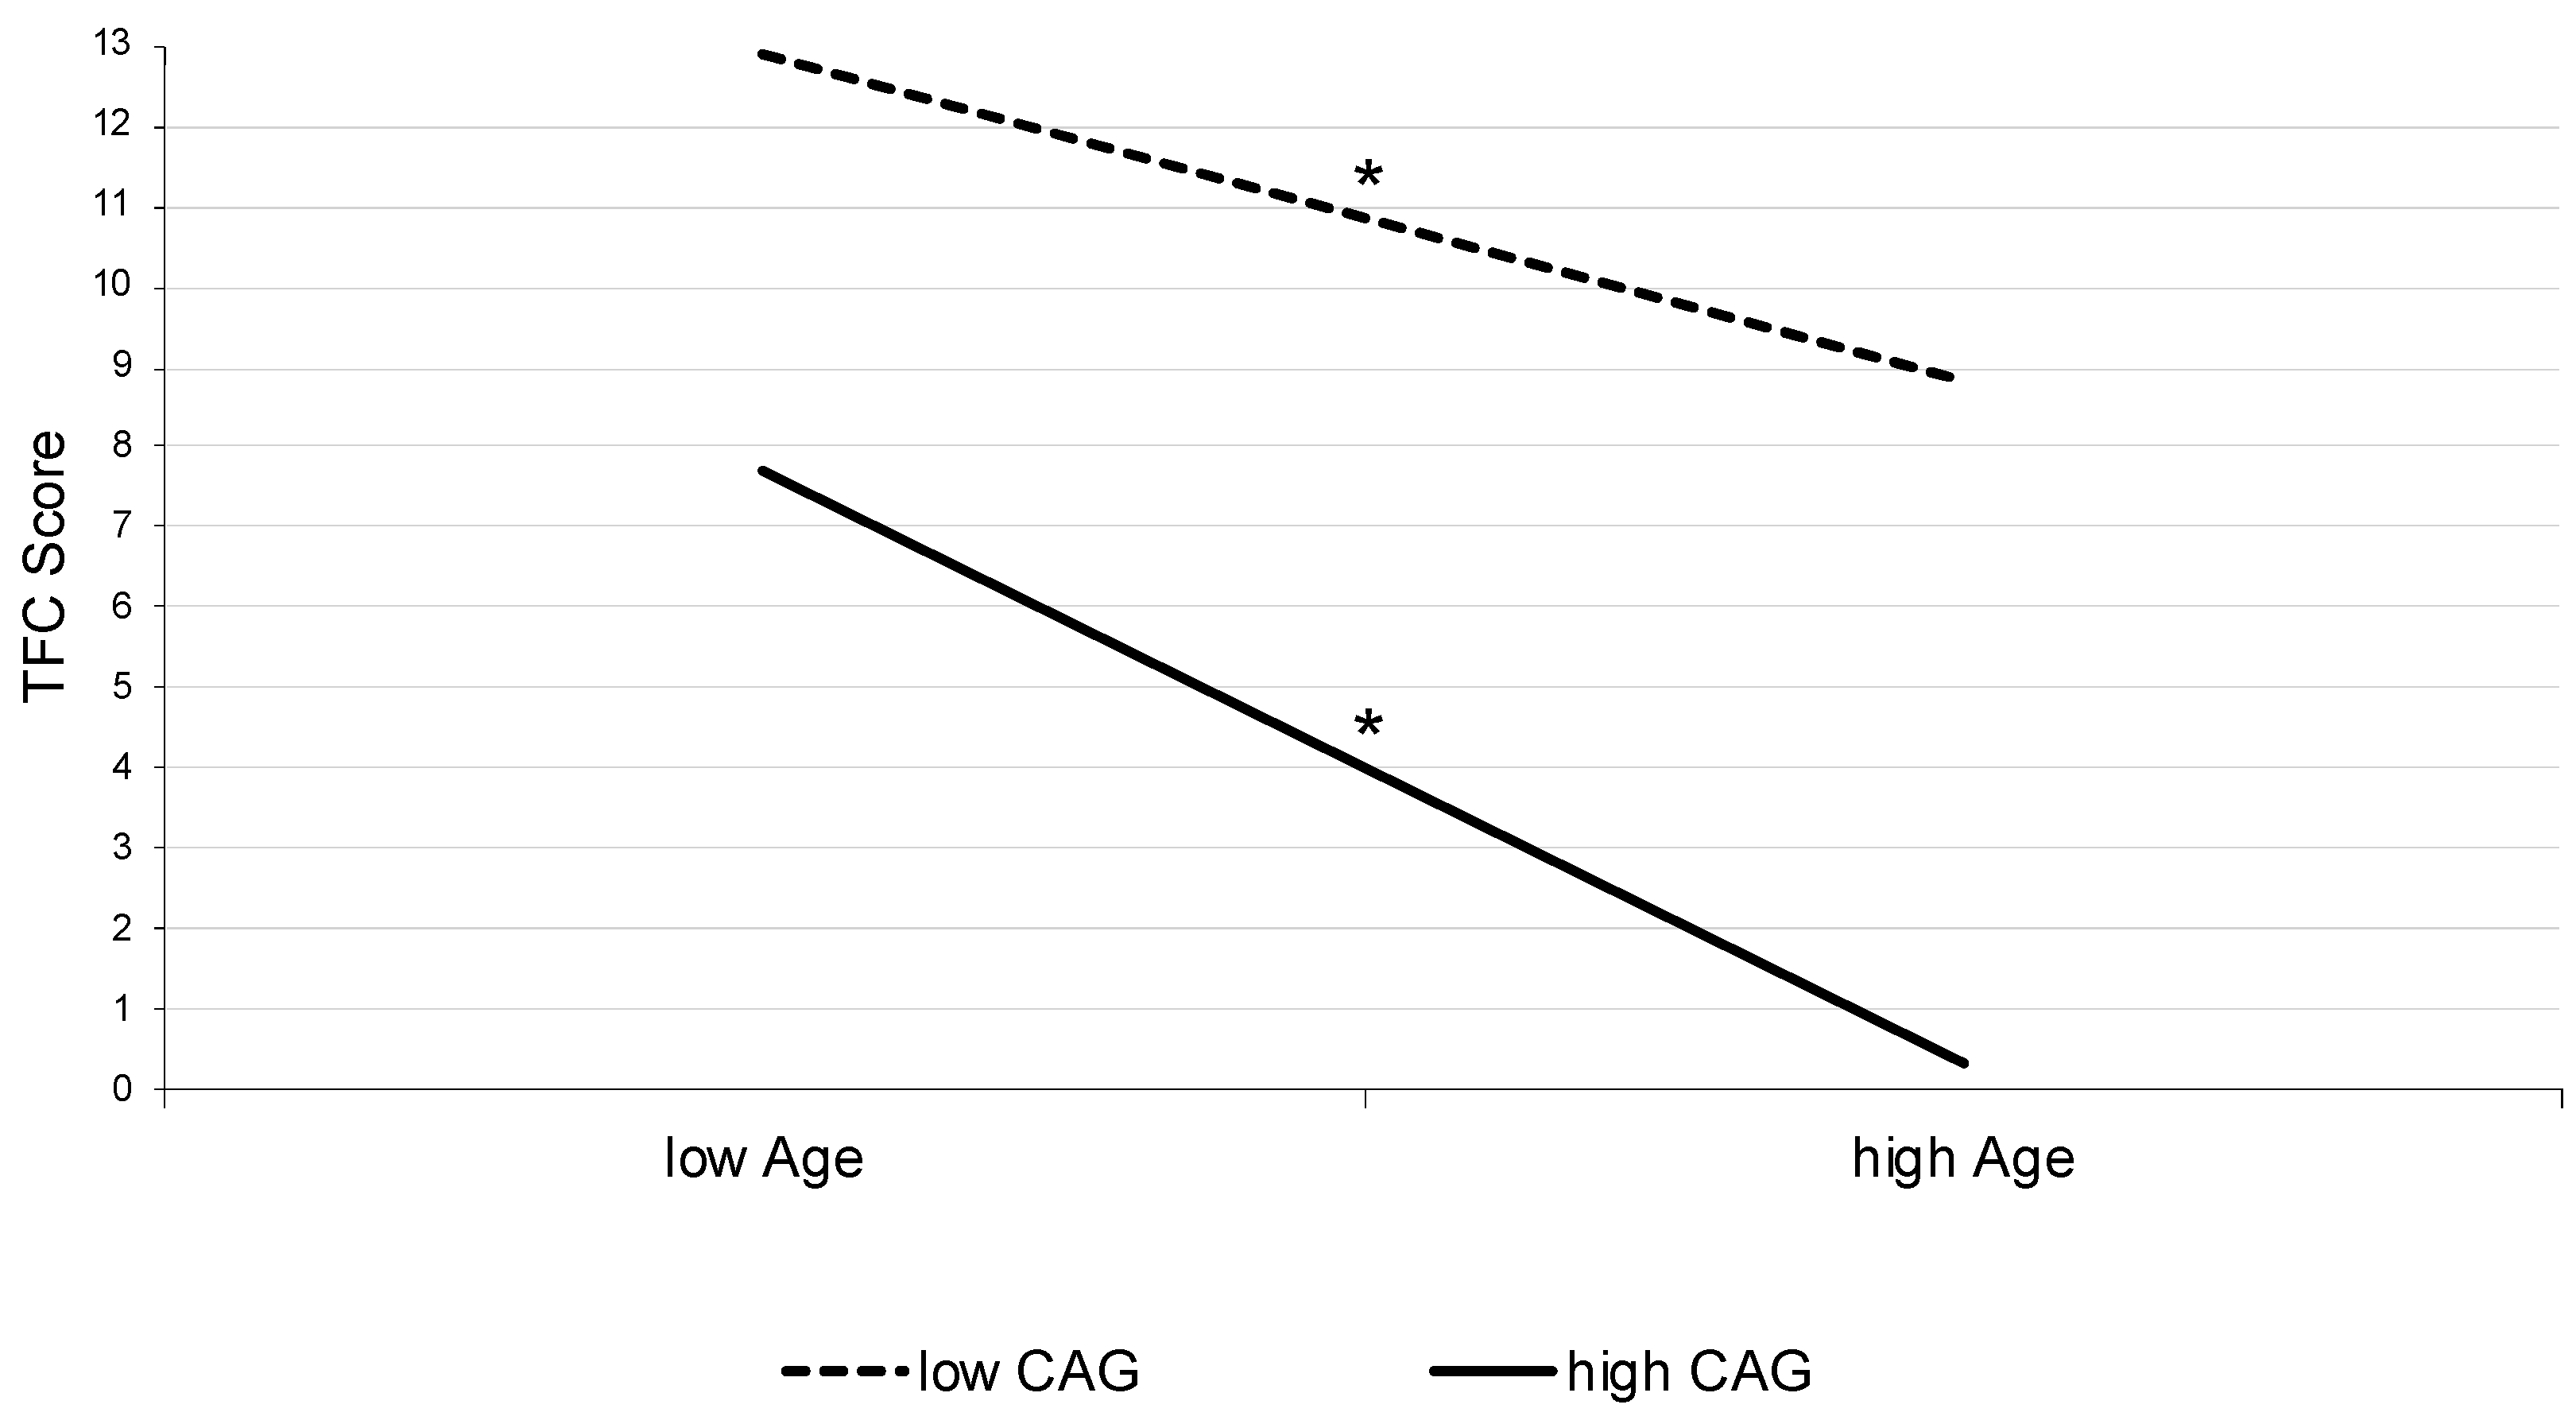
Figure 3.
TFC and neuropsychiatric symptoms in HD according to stage.

Figure 4.
TFC, motor, and cognitive performance in HD according to stage. +: higher scores = better performance.
Figure 4.
TFC, motor, and cognitive performance in HD according to stage. +: higher scores = better performance.


Table 1.
Demographic, motor, and functional data within HD stages: +: higher scores = better performance; #: higher scores = more impairment. Abbreviations: CAG: cytosine-adenine-guanine repeat length; ISCED, International Standard Classification of Education—educational level; CAP score: CAG-age product—index; HD: Huntington’s disease; TMS: Total Motor Score; TFC: Total Functional Capacity; y: years. SDMT, Symbol Digit Modalities test; VFc, verbal fluency test (category); SCNT, Stroop color naming test; SWRT, Stroop word reading test; SIT, Stroop interference test.
| HD Stage 1 n = 3319 | HD Stage 2 n = 3580 | HD Stage 3 n = 2296 | HD Stage 4 n = 809 | HD Stage 5 n = 310 | F | p | Part. Eta2 | |
|---|---|---|---|---|---|---|---|---|
| Age (y); M (SD) | 50.30 (11.95) | 52.86 (12.49) | 54.48 (12.82) | 56.53 (12.85) | 58.17 (13.95) | 68.93 | <0.001 | 0.026 |
| CAG; M(SD) | 43.73 (3.43) | 43.92 (3.87) | 44.40 (4.31) | 44.69 (4.37) | 45.63 (4.55) | 33.27 | <0.001 | 0.013 |
| Sex (f/m) (%f) | 1513/1806 (45.6) | 1891/1689 (52.8) | 1249/1047 (54.4) | 465/344 (57.5) | 183/127 (59.0) | 75.27 | <0.001 | 0.004 |
| ISCED; M (SD) | 3.67 (1.19) | 3.43 (1.20) | 3.21 (1.25) | 2.97 (1.24) | 2.84 (1.29) | 93.97 | <0.001 | 0.035 |
| CAP-Score; M (SD) | 475.53 (78.31) | 507.03 (87.63) | 548.37 (92.99) | 587.65 (98.79) | 632.34 (128.66) | 523.96 | <0.001 | 0.169 |
| Disease duration (y); M (SD) | 4.90 (6.33) | 6.75 (5.62) | 9.18 (6.69) | 12.87 (8.76) | 19.19 (14.45) | 522.51 | <0.001 | 0.169 |
| HD Diagnosis (y); M (SD) | 48.68 (12.09) | 49.63 (12.75) | 49.41 (13.22) | 48.39 (13.77) | 46.14 (13.17) | 6.97 | <0.001 | 0.003 |
| Motor Onset (y); M (SD) | 46.29 (11.79) | 46.77 (12.27) | 46.31 (12.78) | 45.15 (13.43) | 42.10 (12.94) | 10.91 | <0.001 | 0.004 |
| TMS; M (SD) # | 23.84 (11.31) | 35.62 (14.00) | 50.51 (17.10) | 69.54 (17.33) | 85.82 (16.24) | 3056.04 | <0.001 | 0.544 |
| SDMT + | 30.49 (11.01) (n = 3278) | 22.19 (9.5) (n = 3470) | 14.32 (8.91) (n = 1959) | 5.45 (6.60) (n = 510) | 0.97 (3.16) (n = 156) | 1458.27 | <0.001 | 0.384 |
| VFc + | 15.29 (5.20) (n = 3286) | 12.12 (4.66) (n = 3537) | 8.73 (4.31) (n = 2225) | 5.32 (3.57) (n = 680) | 1.77 (2.65) (n = 189) | 124.97 | <0.001 | 0.334 |
| SCNT + | 51.93 (14.10) (n = 3272) | 42.02 (13.67) (n = 3512) | 30.96 (13.37) (n = 2172) | 18.82 (12.85) (n = 638) | 5.94 (9.92) (n = 184) | 1549.98 | <0.001 | 0.388 |
| SWRT + | 69.91 (18.30) (n = 3281) | 55.51 (17.61) (n = 3497) | 41.27 (17.92) (n = 2140) | 24.39 (17.44) (n = 626) | 6.79 (12.31) (n = 181) | 1682.56 | <0.001 | 0.409 |
| SIT + | 28.92 (10.04) (n = 3038) | 22.82 (9.70) (n = 3128) | 15.96 (9.10) (n = 1721) | 9.29 (7.76) (n = 423) | 4.07 (6.65) (n = 74) | 808.67 | <0.001 | 0.279 |
Table 2.
Comparison of neuropsychiatric data between different HD stages: #: higher scores = more impairment.
Table 2.
Comparison of neuropsychiatric data between different HD stages: #: higher scores = more impairment.
| HD Stage 1 n = 3319 | HD Stage 2 n = 3580 | HD Stage 3 n = 2296 | HD Stage 4 n = 809 | HD Stage 5 n = 310 | F | p | Part. Eta2 | |
|---|---|---|---|---|---|---|---|---|
| Clinical rater (PBA-s) | ||||||||
| Depression; M (SD) # | 4.63 (5.81) (n = 3315) | 5.66 (6.65) (n = 3571) | 5.51 (6.90) (n = 2278) | 5.05 (6.30) (n = 775) | 4.53 (5.77) (n = 205) | 13.241 | <0.001 | 0.005 |
| Irritability; M (SD) # | 2.62 (3.99) | 3.40 (4.82) | 3.83 (5.63) | 4.53 (6.42) | 5.04 (6.65) | 42.44 | <0.001 | 0.016 |
| Psychosis; M (SD) # | 0.14 (1.10) | 0.31 (1.61) | 0.50 (2.22) | 0.86 (3.21) | 0.61 (2.03) | 31.74 | <0.001 | 0.012 |
| Apathy; M (SD) # | 1.76 (3.03) | 3.24 (3.93) | 5.12 (4.96) | 6.71 (5.86) | 8.11 (6.47) | 411.00 | <0.001 | 0.139 |
| Executive function; M (SD) # | 1.97 (3.76) | 3.33 (5.04) | 5.01 (6.25) | 6.69 (7.41) | 5.84 (7.04) | 199.82 | <0.001 | 0.073 |
| Self-report (HADS-IS) | ||||||||
| Anxiety; M (SD) # | 5.76 (4.08) (n = 2055) | 6.20 (4.31) (n = 2116) | 6.09 (4.31) (n = 1093) | 6.12 (4.34) (n = 269) | 5.84 (4.54) (n = 46) | 3.00 | 0.018 | 0.002 |
| Depression; M (SD) # | 4.95 (3.78) | 6.38 (4.05) | 7.30 (4.39) | 8.32 (4.92) | 9.22 (4.75) | 93.28 | <0.001 | 0.063 |
| Irritability; M (SD) # | 5.77 (4.39) | 6.24 (4.76) | 5.95 (4.73) | 5.62 (4.62) | 5.42 (4.01) | 3.31 | <0.001 | 0.002 |
| Outward irritability; M (SD) # | 3.47 (2.64) | 3.73 (2.88) | 3.65 (2.94) | 3.58 (3.08) | 3.43 (2.60) | 2.45 | 0.044 | 0.002 |
| Inward irritability; M (SD) # | 2.31 (2.35) | 2.51 (2.54) | 2.31 (2.58) | 2.06 (2.39) | 2.07 (2.24) | 3.30 | 0.011 | 0.002 |
Table 3.
Significant group differences in post hoc Tukey-HSD tests for neuropsychiatric parameters in pairwise stage comparisons: #: higher scores = more impairment (stage comparisons without significant differences are not depicted).
Table 3.
Significant group differences in post hoc Tukey-HSD tests for neuropsychiatric parameters in pairwise stage comparisons: #: higher scores = more impairment (stage comparisons without significant differences are not depicted).
| Post Hoc Tukey-HSD | HD Stage Comparison | p | |
|---|---|---|---|
| PBA-Depression # | Stage 1 | Stage 2 | <0.001 |
| Stage 3 | <0.001 | ||
| PBA-Irritability # | Stage 1 | Stage 2 | <0.001 |
| Stage 3 | <0.001 | ||
| Stage 4 | <0.001 | ||
| Stage 5 | <0.001 | ||
| Stage 2 | Stage 3 | 0.009 | |
| Stage 4 | <0.001 | ||
| Stage 5 | <0.001 | ||
| Stage 3 | Stage 4 | <0.001 | |
| Stage 5 | <0.005 | ||
| PBA-Psychosis # | Stage 1 | Stage 2 | <0.005 |
| Stage 3 | <0.001 | ||
| Stage 4 | <0.001 | ||
| Stage 5 | <0.005 | ||
| Stage 2 | Stage 3 | <0.005 | |
| Stage 4 | <0.001 | ||
| Stage 3 | Stage 4 | <0.001 | |
| PBA-Apathy # | Stage 1 | Stage 2 | <0.001 |
| Stage 3 | <0.001 | ||
| Stage 4 | <0.001 | ||
| Stage 5 | <0.001 | ||
| Stage 2 | Stage 3 | <0.001 | |
| Stage 4 | <0.001 | ||
| Stage 5 | <0.001 | ||
| Stage 3 | Stage 4 | <0.001 | |
| Stage 5 | <0.001 | ||
| Stage 4 | Stage 5 | <0.001 | |
| PBA-Executive function # | Stage 1 | Stage 2 | <0.001 |
| Stage 3 | <0.001 | ||
| Stage 4 | <0.001 | ||
| Stage 5 | <0.001 | ||
| Stage 2 | Stage 3 | <0.001 | |
| Stage 4 | <0.001 | ||
| Stage 5 | <0.001 | ||
| Stage 3 | Stage 4 | <0.001 | |
| HADS-Anxiety # | Stage 1 | Stage 2 | <0.050 |
| HADS-Depression # | Stage 1 | Stage 2 | <0.001 |
| Stage 3 | <0.001 | ||
| Stage 4 | <0.001 | ||
| Stage 5 | <0.001 | ||
| Stage 2 | Stage 3 | <0.001 | |
| Stage 4 | <0.001 | ||
| Stage 5 | <0.001 | ||
| Stage 3 | Stage 4 | <0.005 | |
| Stage 5 | <0.050 | ||
| HADS-Irritability # | Stage 1 | Stage 2 | <0.050 |
| HADS-Outward irritability # | Stage 1 | Stage 2 | <0.050 |
| Stage 4 | <0.050 | ||
Table 4.
Comparison of demographic, cognitive, and neuropsychiatric data in pre-manifest HD participants according to calculated years to onset: +: higher scores = better performance; #: higher scores = more impairment.
Table 4.
Comparison of demographic, cognitive, and neuropsychiatric data in pre-manifest HD participants according to calculated years to onset: +: higher scores = better performance; #: higher scores = more impairment.
| Years to Calculated Onset | <5 y n = 138 | 5–<10 y n = 1242 | 10–<15 y n = 1215 | 15–<20 y n = 920 | >20 y n = 1634 | F | p | Part. Eta2 |
|---|---|---|---|---|---|---|---|---|
| Years to onset M (SD) | 4.43 (0.47) | 7.71 (1.40) | 12.44 (1.43) | 17.33 (1.43) | 29.00 (8.60) | 3938.84 | <0.001 | 0.754 |
| TFC; M (SD) + | 12.51 (0.97) | 12.54 (1.01) | 12.70 (0.97) | 12.78 (0.90) | 12.85 (0.74) | 22.01 | <0.001 | 0.017 |
| Age (y); M (SD) | 44.61 (9.35) | 46.78 (12.17) | 41.54 (11.98) | 32.22 (10.30) | 33.76 (9.73) | 267.16 | <0.001 | 0.172 |
| CAG; M(SD) | 46.38 (2.94) | 43.55 (2.95) | 42.96 (2.73) | 42.24 (2.11) | 40.76 (1.94) | 256.36 | <0.001 | 0.217 |
| Sex (f/m) (%f) | 70/68 (50.7) | 177/509 (59.0) | 705/510 (58.0) | 591/329 (64.2) | 987/647 (60.4) | 14.40 | <0.010 | 0.006 |
| ISCED | 3.93 (1.16) | 3.83 (1.16) | 3.91 (1.13) | 4.01 (1.09) | 4.06 (1.08) | 8.68 | <0.001 | 0.007 |
| CAP-Score; M (SD) | 544.19 (55.02) | 430.22 (32.56) | 355.67 (18.36) | 306.94 (16.73) | 226.57 (46.43) | 8164.42 | <0.001 | 0.864 |
| TMS; M (SD) # | 8.52 (8.14) | 5.19 (5.72) | 3.12 (3.83) | 1.92 (3.33) | 1.53 (2.65) | 212.15 | <0.001 | 0.142 |
| SDMT + | 38.67 (11.40) (n = 135) | 43.03 (11.79) (n = 1232) | 48.08 (11.07) (n = 1204) | 51.86 (10.96) (n = 917) | 54.36 (10.83) (n = 1627) | 226.91 | <0.001 | 0.151 |
| VFc + | 17.86 (5.39) (n = 134) | 19.44 (5.69) (n = 1235) | 21.00 (5.51) (n = 1201) | 22.08 (5.64) (n = 914) | 22.38 (5.65) (n = 1625) | 66.045 | <0.001 | 0.049 |
| SCNT + | 60.49 (15.00) (n = 136) | 66.50 (14.52) (n = 1230) | 71.84 (14.21) (n = 1199) | 74.29 (14.02) (n = 912) | 77.09 (13.96) (n = 1625) | 125.97 | <0.001 | 0.090 |
| SWRT + | 77.78 (16.96) (n = 135) | 85.84 (19.05) (n = 1232) | 92.44 (17.14) (n = 1200) | 95.59 (17.67) (n = 913) | 97.76 (17.16) (n = 1626) | 108.47 | <0.001 | 0.078 |
| SIT + | 35.88 (11.18) (n = 128) | 38.26 (10.92) (n = 1161) | 42.64 (10.88) (n = 1133) | 44.84 (10.65) (n = 856) | 46.32 (10.68) (n = 1547) | 113.06 | <0.001 | 0.086 |
| Clinical rater (PBA-s) | ||||||||
| Depression; M (SD) # | 3.91 (5.90) (n = 137) | 4.84 (6.40) (n = 1238) | 4.44 (5.87) (n = 1213) | 4.46 (5.85) (n = 917) | 3.80 (5.27) (n = 1627) | 6.148 | <0.001 | 0.005 |
| Irritability; M (SD) # | 1.78 (3.65) | 2.20 (4.03) | 2.18 (3.75) | 1.83 (3.25) | 1.84 (3.25) | 3.18 | <0.050 | 0.002 |
| Psychosis; M (SD) # | 0.04 (0.38) | 0.17 (1.51) | 0.15 (1.05) | 0.11 (0.88) | 0.09 (0.78) | 1.58 | 0.177 | 0.001 |
| Apathy; M (SD) # | 1.00 (2.28) | 1.27 (2.74) | 1.05 (2.47) | 0.94 (2.39) | 0.74 (1.96) | 9.05 | <0.001 | 0.007 |
| Executive function; M (SD) # | 0.92 (2.46) | 1.35 (3.28) | 1.37 3.18) | 1.27 (3.25) | 1.20 (3.00) | 1.11 | 0.350 | 0.001 |
| Self-report (HADS-IS) | ||||||||
| Anxiety; M (SD) # | 5.35 (3.90) (n = 82) | 5.54 (3.94) (n = 804) | 5.68 (4.00) (n = 837) | 5.91 (4.22) (n = 641) | 5.47 (3.94) (n = 1179) | 1.47 | 0.208 | 0.002 |
| Depression; M (SD) # | 3.61 (3.65) | 4.09 (3.66) | 3.82 (3.60) | 3.72 (3.71) | 3.01 (3.12) | 13.48 | <0.001 | 0.015 |
| Irritability; M (SD) # | 5.38 (4.11) | 5.32 (4.15) | 5.18 (4.02) | 5.17 (4.10) | 4.69 (3.88) | 3.74 | <0.010 | 0.004 |
| Outward irritability; M (SD) # | 3.39 (2.69) | 3.37 (2.52) | 3.31 (2.56) | 3.13 (2.43) | 2.96 (2.43) | 4.17 | <0.010 | 0.005 |
| Inward irritability; M (SD) # | 1.99 (2.02) | 1.96 (2.20) | 1.86 (2.06) | 2.05 (2.35) | 1.73 (2.05) | 2.80 | <0.050 | 0.003 |
Table 5.
Significant group differences of post hoc Tukey-HSD tests in pre-manifest HD for neuropsychiatric parameters in pairwise comparisons: #: higher scores = more impairment (comparisons without significant differences are not depicted).
Table 5.
Significant group differences of post hoc Tukey-HSD tests in pre-manifest HD for neuropsychiatric parameters in pairwise comparisons: #: higher scores = more impairment (comparisons without significant differences are not depicted).
| Post Hoc Tukey-HSD | Pre-Manifest HD Comparisons | p | |
|---|---|---|---|
| <5 y | 15–<20 y | <0.050 | |
| >20 y | <0.001 | ||
| 5–<10 y | 10–<15 y | <0.001 | |
| 15–<20 y | <0.001 | ||
| >20 y | <0.001 | ||
| 10–<15 y | >20 y | <0.001 | |
| PBA-Depression # | 5–<10 y | >20 y | <0.001 |
| 10–<15 y | >20 y | <0.050 | |
| 15–<20 y | >20 y | <0.050 | |
| PBA-Apathy # | 5–<10 y | 15–<20 y | <0.050 |
| >20 y | <0.001 | ||
| 10–<15 y | >20 y | <0.010 | |
| HADS-Depression # | 5–<10 y | >20 y | <0.001 |
| 10–<15 y | >20 y | <0.001 | |
| 15–<20 y | >20 y | <0.001 | |
| HADS-Irritability # | 5–<10 y | >20 y | <0.010 |
| HADS-Outward irritability # | 5–<10 y | >20 y | <0.005 |
| 10–<15 y | >20 y | <0.050 | |
| HADS-Inward irritability # | 15–<20 y | >20 y | <0.050 |
Disclaimer/Publisher’s Note: The statements, opinions and data contained in all publications are solely those of the individual author(s) and contributor(s) and not of MDPI and/or the editor(s). MDPI and/or the editor(s) disclaim responsibility for any injury to people or property resulting from any ideas, methods, instructions or products referred to in the content. |
© 2023 by the authors. Licensee MDPI, Basel, Switzerland. This article is an open access article distributed under the terms and conditions of the Creative Commons Attribution (CC BY) license (https://creativecommons.org/licenses/by/4.0/).
Share and Cite
MDPI and ACS Style
Achenbach, J.; Stodt, B.; Saft, C. Factors Influencing the Total Functional Capacity Score as a Critical Endpoint in Huntington’s Disease Research. Biomedicines 2023, 11, 3336. https://doi.org/10.3390/biomedicines11123336
AMA Style
Achenbach J, Stodt B, Saft C. Factors Influencing the Total Functional Capacity Score as a Critical Endpoint in Huntington’s Disease Research. Biomedicines. 2023; 11(12):3336. https://doi.org/10.3390/biomedicines11123336
Chicago/Turabian StyleAchenbach, Jannis, Benjamin Stodt, and Carsten Saft. 2023. "Factors Influencing the Total Functional Capacity Score as a Critical Endpoint in Huntington’s Disease Research" Biomedicines 11, no. 12: 3336. https://doi.org/10.3390/biomedicines11123336
Note that from the first issue of 2016, this journal uses article numbers instead of page numbers. See further details here.