Article

Classifying Crowdsourced Citizen Complaints through Data Mining: Accuracy Testing of k-Nearest Neighbors, Random Forest, Support Vector Machine, and AdaBoost

by
Evaristus D. Madyatmadja
1,*,†,
Corinthias P. M. Sianipar
2,3,*,†,
Cristofer Wijaya
1 and
David J. M. Sembiring
4
1
Information Systems Department, Bina Nusantara University, Jakarta 11530, Indonesia
2
Department of Global Ecology, Kyoto University, Kyoto 606-8501, Japan
3
Division of Environmental Science and Technology, Kyoto University, Kyoto 606-8502, Japan
4
Indonesian Institute of Technology and Business (ITBI), Deli Serdang 20374, Indonesia
*
Authors to whom correspondence should be addressed.
These authors contributed equally to this work.
Informatics 2023, 10(4), 84; https://doi.org/10.3390/informatics10040084
Submission received: 1 July 2023 / Revised: 15 October 2023 / Accepted: 23 October 2023 / Published: 1 November 2023
(This article belongs to the Special Issue Feature Papers in Big Data)

Abstract

:
Crowdsourcing has gradually become an effective e-government process to gather citizen complaints over the implementation of various public services. In practice, the collected complaints form a massive dataset, making it difficult for government officers to analyze the big data effectively. It is consequently vital to use data mining algorithms to classify the citizen complaint data for efficient follow-up actions. However, different classification algorithms produce varied classification accuracies. Thus, this study aimed to compare the accuracy of several classification algorithms on crowdsourced citizen complaint data. Taking the case of the LAKSA app in Tangerang City, Indonesia, this study included k-Nearest Neighbors, Random Forest, Support Vector Machine, and AdaBoost for the accuracy assessment. The data were taken from crowdsourced citizen complaints submitted to the LAKSA app, including those aggregated from official social media channels, from May 2021 to April 2022. The results showed SVM with a linear kernel as the most accurate among the assessed algorithms (89.2%). In contrast, AdaBoost (base learner: Decision Trees) produced the lowest accuracy. Still, the accuracy levels of all algorithms varied in parallel to the amount of training data available for the actual classification categories. Overall, the assessments on all algorithms indicated that their accuracies were insignificantly different, with an overall variation of 4.3%. The AdaBoost-based classification, in particular, showed its large dependence on the choice of base learners. Looking at the method and results, this study contributes to e-government, data mining, and big data discourses. This research recommends that governments continuously conduct supervised training of classification algorithms over their crowdsourced citizen complaints to seek the highest accuracy possible, paving the way for smart and sustainable governance.

1. Introduction

Governments are mandated to deliver services to the public through a wide range of responsibilities in diverse sectors, including but not limited to health care [1], waste management [2], roadworks [3], land affairs [4], emergency services [5], and energy [6]. These services are intended to improve welfare and security by targeting various societal levels. Nevertheless, at times, the quality of these services falls short of public expectations, hence generating a series of complaints from members of the public. In traditional governance, it is common for citizens to express their complaints through physical channels, often through visits to relevant government offices or by sending formal letters to the respective government agencies [7]. Another way is through elected representatives, whom constituents can approach to relay their concerns [8]. These conventional modes, however, have demonstrated significant inefficiencies, primarily attributed to the extensive administrative processes involved. It often causes a substantial number of complaints to be lost in the long chain of procedures before reaching the decision-making ranks [9]. Another issue is the inadequate workforce to handle these complaints [10], making complaints, albeit received, sidelined due to insufficient resources to carry out follow-up actions. These problems inevitably make governments fail to translate citizen feedback into tangible improvements in public service delivery.
In today’s information era, e-government, or digital government services, emerges as a contemporary way to provide more effective provision and management of public services, by bringing in digital transformation. This revolution towards the digitization of government services is, in fact, a necessity to streamline administrative processes [11], hence reducing the need for paperwork [12] and, consequently, the associated costs and time [13]. The public is also provided with access to information about ongoing governmental activities, policymaking, and policy implementation [14]. These digital services are accessible from any location and at any time of the day, augmenting the overall experience of the public. Consequently, e-government promises an expedited, cost-effective, and efficient means of registering citizen complaints over public services. The better accessibility and efficiency offered by e-government means citizens can express their complaints through a broader array of accessible channels and significantly shortened procedural chains [15]. Besides this, better transparency provides a more direct look into the management and follow-up actions associated with these complaints. In the end, the enhanced accessibility and efficiency, combined with increased transparency, foster a sense of accountability within governmental institutions [16], improving the public’s confidence in the ability of their government to address their needs effectively.
Indeed, e-government has allowed a crowdsourced process of citizen complaints facilitated by multiple channels for complaint submission. While crowdsourcing improves public engagement [17], it, however, makes the government unable to process the much-increased influx of complaints efficiently [18]. It raises the need for a more capable mechanism to classify these complaints, thereby expediting their routing to appropriate governmental bodies. Recently, Large Language Models (LLM) have triggered the rise of Generative Artificial Intelligence (GenAI) [19], including GPT-4 (OpenAI), Bard (Google), and Claude 2 (Anthropic). LLM and GenAI promise huge potential for automated classification. However, they are prone to hallucinations [20], which increases the risk of delivering seemingly plausible but improper solutions to citizen complaints. They also require relatively extensive data and a huge amount of energy to train and run the models [21], making it impractical to classify crowdsourced citizen complaints at different scales of applications with highly fluctuating amounts of input. Another promising solution is Transfer Learning, which applies pre-trained models on new problems [22]. However, it remains impractical when no pre-trained models are available locally. Using pre-trained models from other regions is highly risky since the characteristics of citizens and their complaints are tightly related to the socio-cultural and physical features of an area.
In that sense, basic data mining remains more practical to facilitate a low-cost classification of crowdsourced citizen complaints with less energy required at various scales of applications. In the literature [23], commonly used data mining algorithms for classification purposes include k-Nearest Neighbors (kNN) [24], Random Forest (RF) [25], Support Vector Machine (SVM) [26], and AdaBoost [27]. Still, each algorithm interacts with large datasets differently, which influences the behavior of the classification process, potentially resulting in less-than-optimal outcomes [28,29,30]. Their application thus demands a cautious understanding of these behaviors, effectively leveraging their capabilities while being aware of their constraints. Therefore, this research aimed to discover the accuracy of these prominent algorithms in classifying crowdsourced citizen complaints. Practically, this study attempted to run the algorithms alternately over the same large dataset of citizen complaints, perform accuracy testing for each algorithm, and conduct comparative testing to discover the best algorithm for the given dataset. Consequently, the dataset should contain raw complaint data gathered through multiple e-government channels, through which this study can observe the behavior of each algorithm over the real-world problem in question: the massive influx of citizen complaints induced by digitized government services. This study went on to answer the following research questions:
  • RQ1 How accurate are k-Nearest Neighbors, Random Forest, Support Vector Machine, and AdaBoost in classifying crowdsourced citizen complaints?
  • RQ2 What is the most accurate data mining algorithm for the purpose?
  • RQ3 How do their accuracies differ for the classification process?

2. Literature Review

2.1. Data and Text Mining: An Overview

In the era of big data, data analytics has taken central significance in various sectors. At the core of data analytics, data mining and text mining are the two most essential terminologies [31]. The first one, data mining, enables individuals and institutions to extract valuable information from unstructured textual data [32]. The versatile applications of data mining manifest across various domains. For instance, data mining has been applied to analyze working skills [33]. Meanwhile, in the transportation sector, it is used to calculate the risks of road accidents [34]. In short, the extensive impact of the data mining process resonates across numerous sectors, reinforcing its significance. Technically, central to the data mining process are its fundamental functions: classification, clustering, association, sequencing, and forecasting [35,36]. Each plays a key role in shaping the analytics, hence determining the nature and utility of the information extracted. Particularly, classification groups data by portraying a class or target attribute, thus attributing distinct characteristics to the separated data [37,38]. The division allows for the discovery of patterns within the data and the identification of relations among different datasets.
Furthermore, data analytics is inherently dependent on data representativeness, as it significantly affects the performance of machine learning algorithms [39]. During data processing, numerous issues come into consideration, with two of the most important being data selection and the functions used [40,41]. They require a balance between the desired effectiveness of analytics and the feasibility of running the analysis using the computational hardware available. In terms of functions, both clustering and classification perform the grouping of data. In clustering, however, there is no immediate need to display class or target attributes. Instead, clustering focuses on structure and relationships within data, grouping together data points that exhibit a high degree of similarity [42]. The distinction often significantly affects the outcome of the data analysis. Next, association discovers the relationships between concurrent events within a specific period. It unveils patterns that may not be immediately apparent, hence enhancing the understanding of interactions within the data [43]. Meanwhile, sequencing, often seen as an extension of association, serves to represent the plural form of association. Technically, it identifies different relationships within a specified period from the obtained data [44].
Moreover, text mining is part of data mining with a specific focus on text data [45]. It generally involves several processes, e.g., tokenization, filtering, stemming, tagging, and analyzing. Tokenization splits the input text into individual word-like units, so-called tokens, breaking the raw text into manageable units [46]. Meanwhile, filtering sifts the tokens by eliminating irrelevant words (“stop words”) that do not contribute meaningful information for analysis (e.g., prepositions and conjunctions) [47]. It helps subsequent stages focus solely on words with semantic weight within the text. Furthermore, stemming identifies root forms from the filtered words [48]. It helps reduce dimensionality by grouping words with the same root, even if they appear in different grammatical forms in the text. In addition, tagging is primarily used in English language documents. It involves finding the base form of each word, which further refines the text for the final stage of text mining [49]. Moreover, analyzing discovers relationships between documents. It considers the frequency of occurrence of each word within the text [50]. As a result, text mining can extract meaningful patterns and associations from unstructured textual data, hence transforming raw textual data into actionable insights.

2.2. Classification in Data Mining

In data mining, classification helps organize massive datasets into smaller, manageable subsets [35,37]. In that sense, classification proves useful for text mining, where it works as text classification. Technically, it categorizes natural language or textual data into specific classes or categories, giving order and structure to the otherwise unstructured textual data [36,38]. In practice, text classification helps data analytics with the capability to understand inherent details in the data. It is particularly beneficial when dealing with natural language, which has complex syntax, diverse grammatical forms, and numerous semantic details [51]. Text classification renders them analyzable, facilitating the extraction of meaningful insights from the textual data. It is also applicable in different situations, including sentiment analysis, language detection, product classification, and topic classification. In sentiment analysis, for example, text classification detects sentiments, whether positive or negative, expressed by users or customers. By classifying text based on the sentiments they convey, businesses, for instance, can gain valuable insights into consumer sentiment toward their products or services, enabling them to identify areas of success or potential improvement [35]. In other words, these potential applications leverage the capability of text classification to discover and classify patterns within textual data, thus underscoring the versatility and utility of text classification.
Of the four observed algorithms, none offer perfect technical characteristics for classification purposes. kNN has high transparency from its direct use of training data points for prediction [52]. In contrast, SVM, RF, and AdaBoost are often considered black box models. However, techniques like variable importance measures in RF provide some model explanation [53]. In addition, SVM permits the extraction of support vectors to aid interpretation. In terms of computational efficiency, kNN has a low training cost but a high prediction cost, as each new data point requires distance calculations against the entire training set [54]. SVM also has a high prediction cost, along with intensive memory requirements. In comparison, ensemble methods like RF and AdaBoost have higher training costs, due to the building of multiple models, but relatively fast predictions [55]. Again, factors like dataset size affect the practical application of each algorithm. In terms of accuracy, SVM might outperform kNN, especially with kernels, on nonlinear data or smaller samples [56]. For high-dimensional data, RF might exceed kNN and SVM in some cases, by mitigating the curse of dimensionality. Both RF and AdaBoost demonstrate higher accuracy than single decision trees, underscoring the power of ensembles [57].
In practice, the accuracy of classification algorithms is dependent on their capacity to accurately assign data points to predefined categories or classes. The four observed algorithms exhibit unique strengths and weaknesses attributable to their underlying methodologies. kNN adapts to changing data distributions through dynamic neighbor selection [58,59]. It provides transparent, flexible predictions but faces difficulties in high dimensions. Meanwhile, RF utilizes the crowd effect from aggregating many trees to enable precise predictions [60,61]. It could hence enhance accuracy through ensembles but scales poorly. Furthermore, SVM has a high computational complexity that scales significantly with dataset size [62,63], limiting its applicability for large-scale problems without advances like parallelization. In a highly critical classification, it thus expects superior margins between classes given sufficient data and resources. In addition, AdaBoost directs attention to errors [64], allowing more accurate subsequent models. This gradient boosting technique enhances the overall performance. Still, it boosts weak learners iteratively but remains prone to overfitting. In general, ensemble methods trade training time for robust predictions by combining diverse models. Looking at these explanations, no perfect algorithm exists for all applications, but understanding the strengths and weaknesses of these approaches allows selection tailored to the problem at hand.

2.3. Observed Algorithms

2.3.1. k-Nearest Neighbors (kNN)

Basically, k-Nearest Neighbors is a classification algorithm recognized for its efficacy in both textual and numerical data classification [52]. Conceptually, kNN is a supervised learning algorithm, deriving its ability to classify new data instances by leveraging both sample and testing data. Technically, kNN classifies data instances based on the proximity to their nearest neighbors or closest class [65]. The underlying thought is that items with similar characteristics tend to exhibit proximity to each other. Thus, new data instances are assigned to the class that is most frequently represented among its nearest neighbors. In practice, the measure of “closeness” or “distance” in kNN algorithm is typically calculated using the Euclidean distance (Equation (1)) [66]. The distance between two data instances in this multidimensional space reflects the degree of similarity between them, providing a quantitative basis for assigning a new data point to a particular class. However, this focus on proximity does not imply a deterministic characteristic. Indeed, the ability of kNN to adjust to changes in data distribution through its selection of the “k” parameter, which dictates the number of nearest neighbors to be considered, gives flexibility that leads to robust performance across diverse applications [58,59].
d i j = k = 1 m X i k X j k 2
where:
  • d     : Euclidian distance from data object to i and data object to j ;
  • m    : number of variables/parameters;
  • X i k  : data object i on data k variable; and
  • X j k  : data object j on data k variable.

2.3.2. Random Forest (RF)

Particularly effective in classification, regression, and unsupervised learning [67], Random Forest [25] relies on three key aspects: (a) bootstrap sampling for building a prediction tree; (b) random predictions generated by each decision tree; and (c) a prediction algorithm that merges the results of each decision tree by leveraging a voting system for classification [60,61]. RF works by merging decision trees, forming a so-called “forest.” RF generates an array of trees, which together form a robust predictive model. The forest, once built, undergoes analysis. It involves gathering predictions from a certain number of trees, with the prediction outcomes selected according to the simple majority rule. Consequently, categories or classes that frequently appear as prediction results, based on the classification of k trees, are selected. In this sense, Random Forest offers built-in robustness against overfitting [68]. The low correlation between models is the key, as the trees protect each other from their individual errors. If the predictions from individual trees are not perfectly correlated, some trees will be wrong, but many will be right; thus, as a group, the trees are able to move in the correct direction.

2.3.3. Support Vector Machine (SVM)

SVM is especially recognized for its better precision among classification algorithms [69]. It was first developed as a linear classifier but now allows non-linear applications by deploying kernels, hence enhancing its flexibility and adaptability to varied data structures [70]. SVM works by constructing a hyperplane to segregate classes optimally. This hyperplane is not arbitrarily determined; instead, it is established through a process involving vectors and support margins. It is a particular characteristic of SVM that underscores its robustness as a classification tool [71]. Technically, the hyperplane serves as the distinguishing barrier between classes. In a two-dimensional SVM, the class separator manifests as a line. The complexity increases in a three-dimensional SVM, where the separator is a plane. When the dimensionality exceeds three, the separator is viewed as a hyperplane. Thus, SVM ensures an accurate mapping regardless of the dimensionality of the dataset. Despite the merits, SVM is known to work better with smaller to medium-scale datasets [62], since the computational complexity grows quadratically with the size of the input data. Nevertheless, the rapid advance of computational power and parallel computing techniques could allow SVM to manage larger-scale data in the future.

2.3.4. AdaBoost

AdaBoost, also referred to as Adaptive Boosting, is a prominent example of ensemble learning methodologies in machine learning [72,73]. It has been widely recognized for its capacity to substantially enhance the accuracy of the prediction of base learners [64]. Basically, AdaBoost generates various classifiers to seek an optimal one. Besides this, it offers the ability to transform a weak or simple classifier into a strong or more complex one. This capability is what classifies it as a boosting algorithm: it achieves improved accuracy for the base learner by minimizing errors attributed to weak classifiers. Each iteration of the AdaBoost algorithm is designed to emphasize the data instances misclassified during the previous iteration. Practically, it generates subsequent classifiers that are better at predicting these difficult instances correctly, hence fostering an improved overall prediction accuracy. One example pointed to its usage in conjunction with the Radial Basis Function–Support Vector Machine (RBF–SVM) classifier [74]. Under the application of AdaBoost, the RBF–SVM classifier is directed to paying particular attention to samples that were incorrectly classified in prior attempts. In that sense, AdaBoost helps to iteratively reduce the overall error rate of the model [75].

3. Case Study: Crowdsourced Citizen Complaints in Tangerang City, Indonesia

Asia, home to over 60% of the world’s population, has seen tremendous growth in digital transformation [76]. Its expansion in technological and innovation capabilities, supported by a sizeable market, has given it a crucial role in the global digital revolution. In fact, Asia is one of the world’s largest producers and markets for digital products and services [77]. Besides countries in Eastern Asia (e.g., China, South Korea, Japan, and Taiwan), which have become major global players, Southeast Asian countries have emerged as a new frontrunner in digital transformation. In terms of innovation, Southeast Asia is home to a growing number of tech startups and unicorns, with the region’s vibrant startup ecosystem contributing to global digital innovation [78]. In areas such as fintech, e-commerce, and other digital services, Southeast Asia is at the forefront of modernization, offering unique solutions tailored to local needs and contexts.
In Southeast Asia, Indonesia has captured most of the region’s digital transformation. The rapid growth of digitalization in Indonesia has been driven by the growing Internet penetration, not only in terms of user base [79] but also Internet-based digitalization in numerous sectors [80], including governmental affairs. In Indonesia, the shifting to e-government is undergoing in various public sectors, with urban areas in Java Island being the leading region of digital innovations in the delivery of public services [81,82]. The sheer growth of e-government in Indonesia is, in fact, fostered by its supporting regulations. The Presidential Regulation (Perpres) of the Republic of Indonesia no. 95 of 2018 [83] governs all matters related to e-government in the country. It states that, to realize a clean, effective, transparent, and accountable government, an electronic-based government system is a necessity. It has become a regulatory framework for every region in Indonesia to provide quality and reliable public services to all subsets of the population.
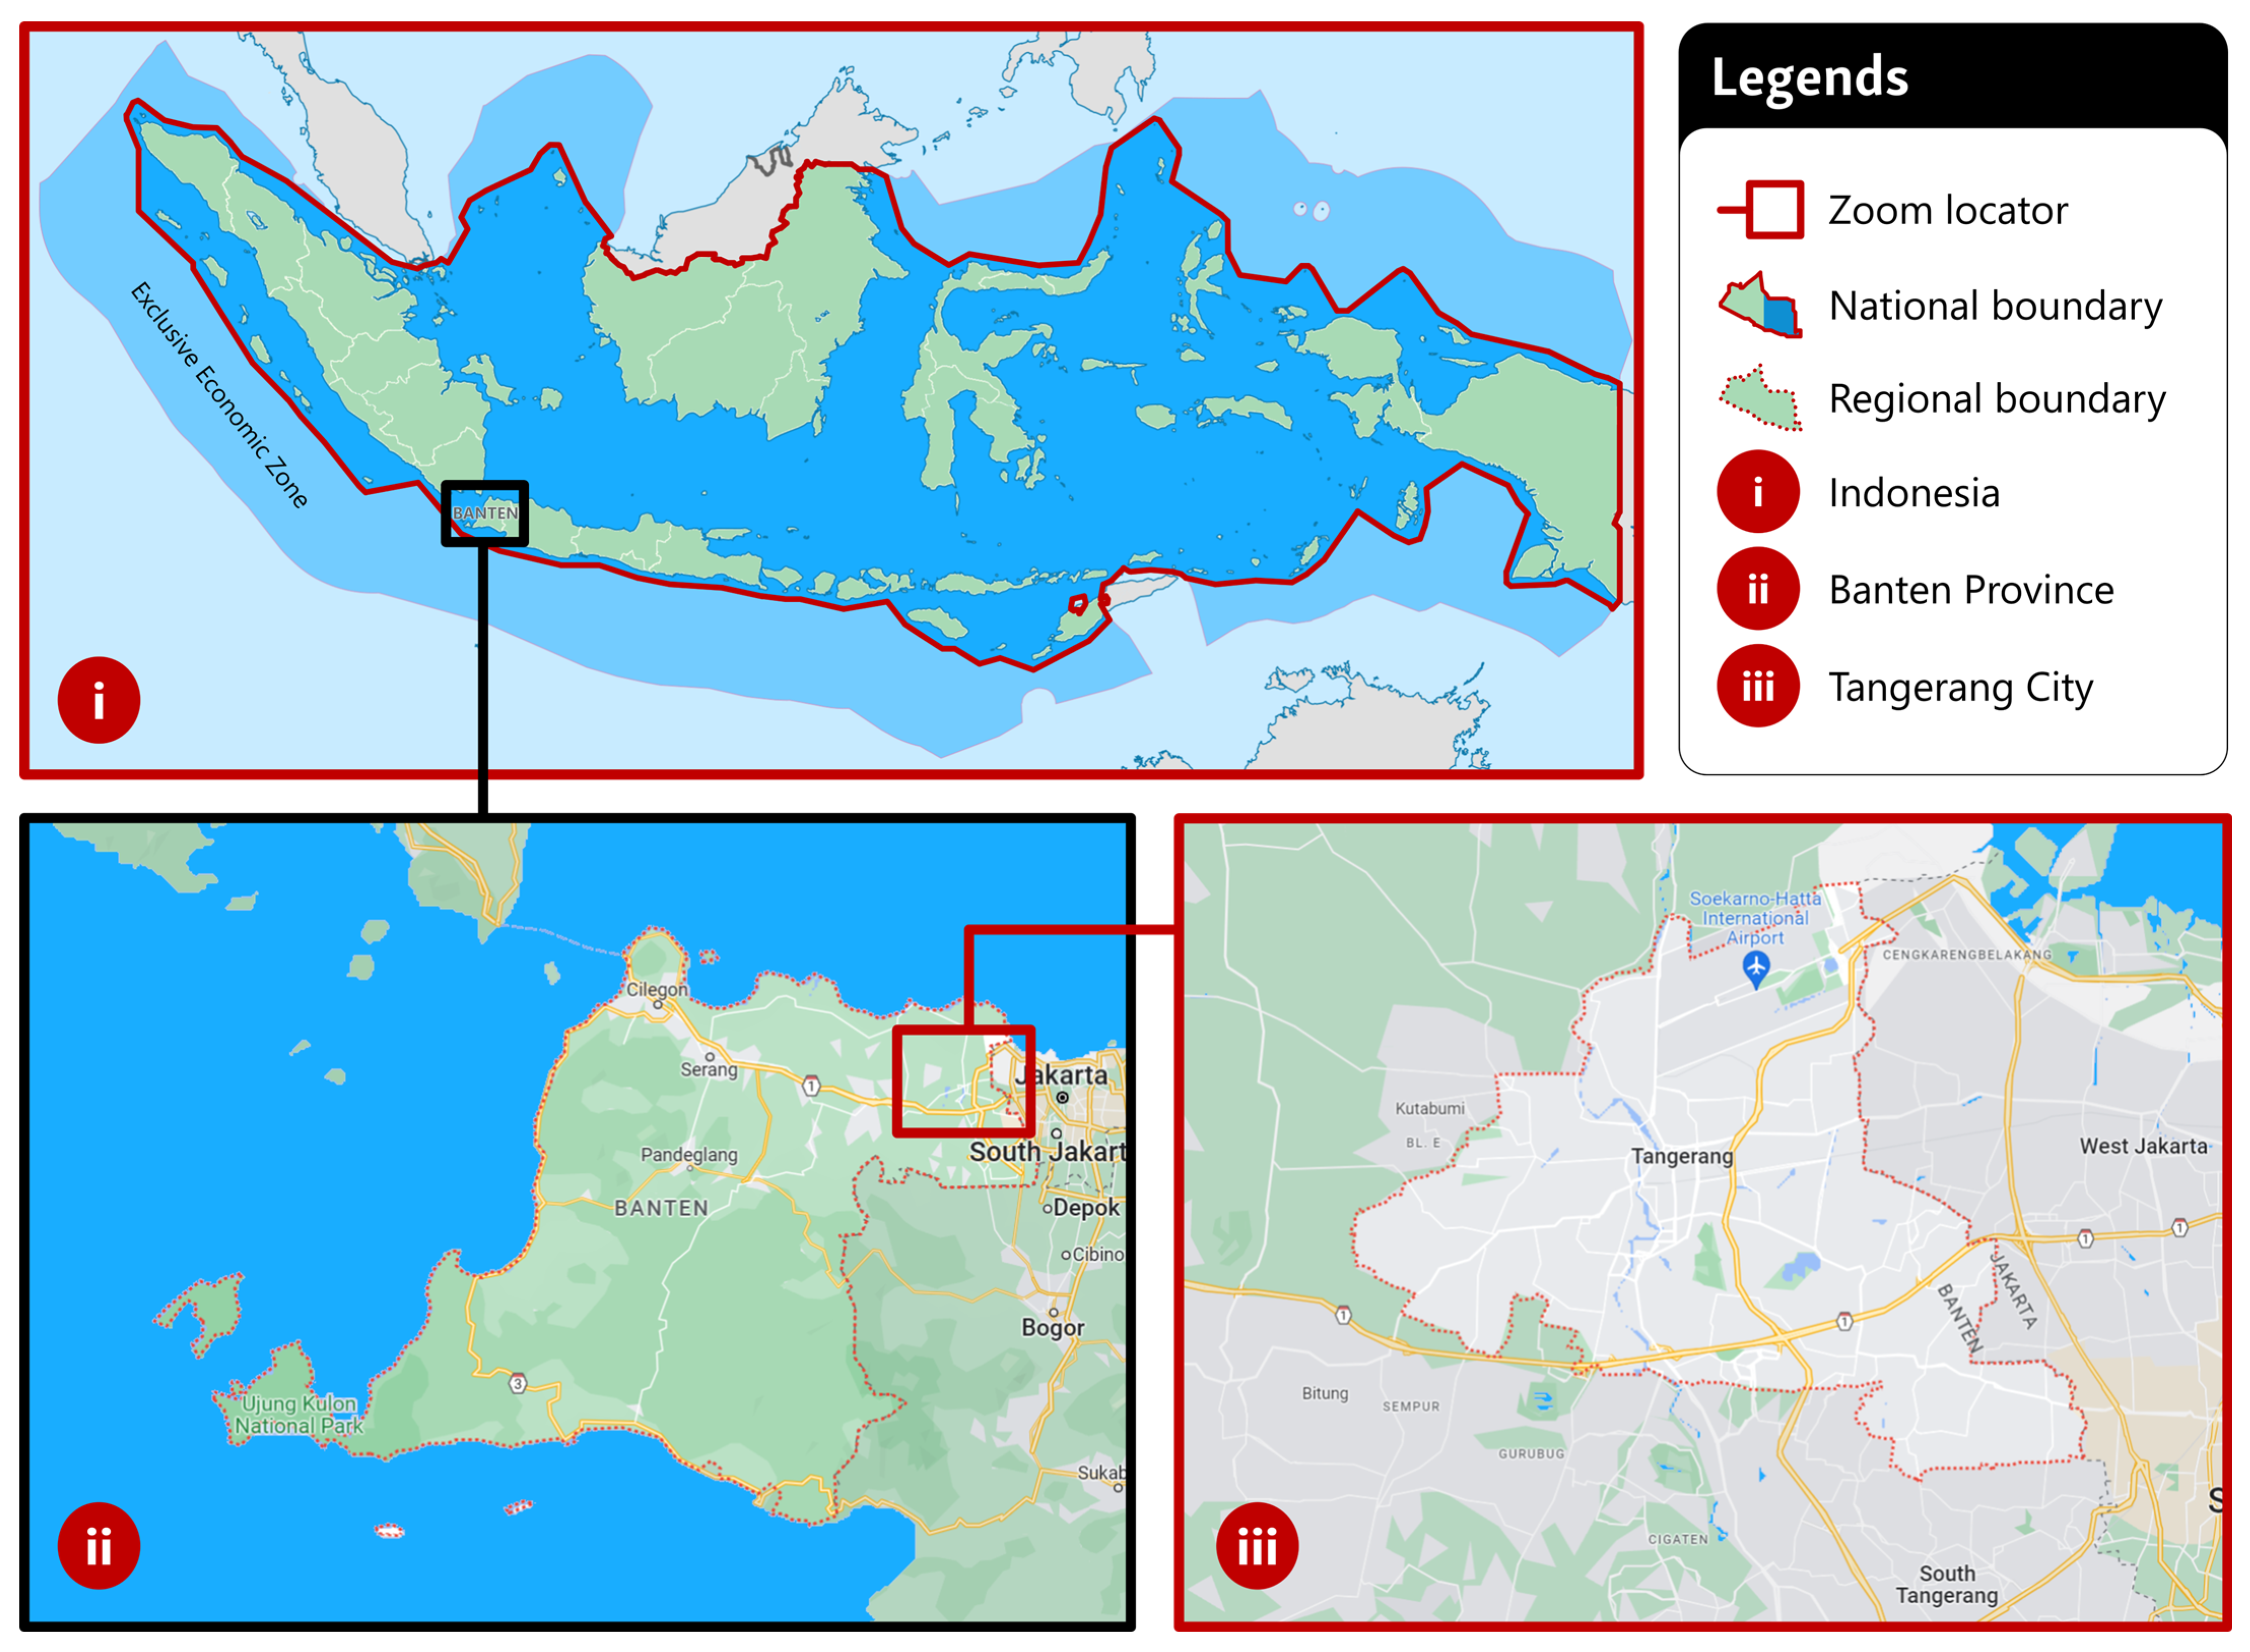
Since Indonesia’s population is concentrated on Java Island, it is typical to see more significant progress in the implementation of e-government in regions within the island [81]. In the western part of Java, Tangerang City (Figure 1) has shown a rather notable example of e-government [84], mainly because it is part of Jabodetabekpunjur [85], Indonesia’s main urban agglomeration, and home to many commuters working in Jakarta [86], the epicenter of economic activities in the country. In terms of international significance, Tangerang City hosts the Soekarno–Hatta International Airport, one of Asia’s busiest airports [
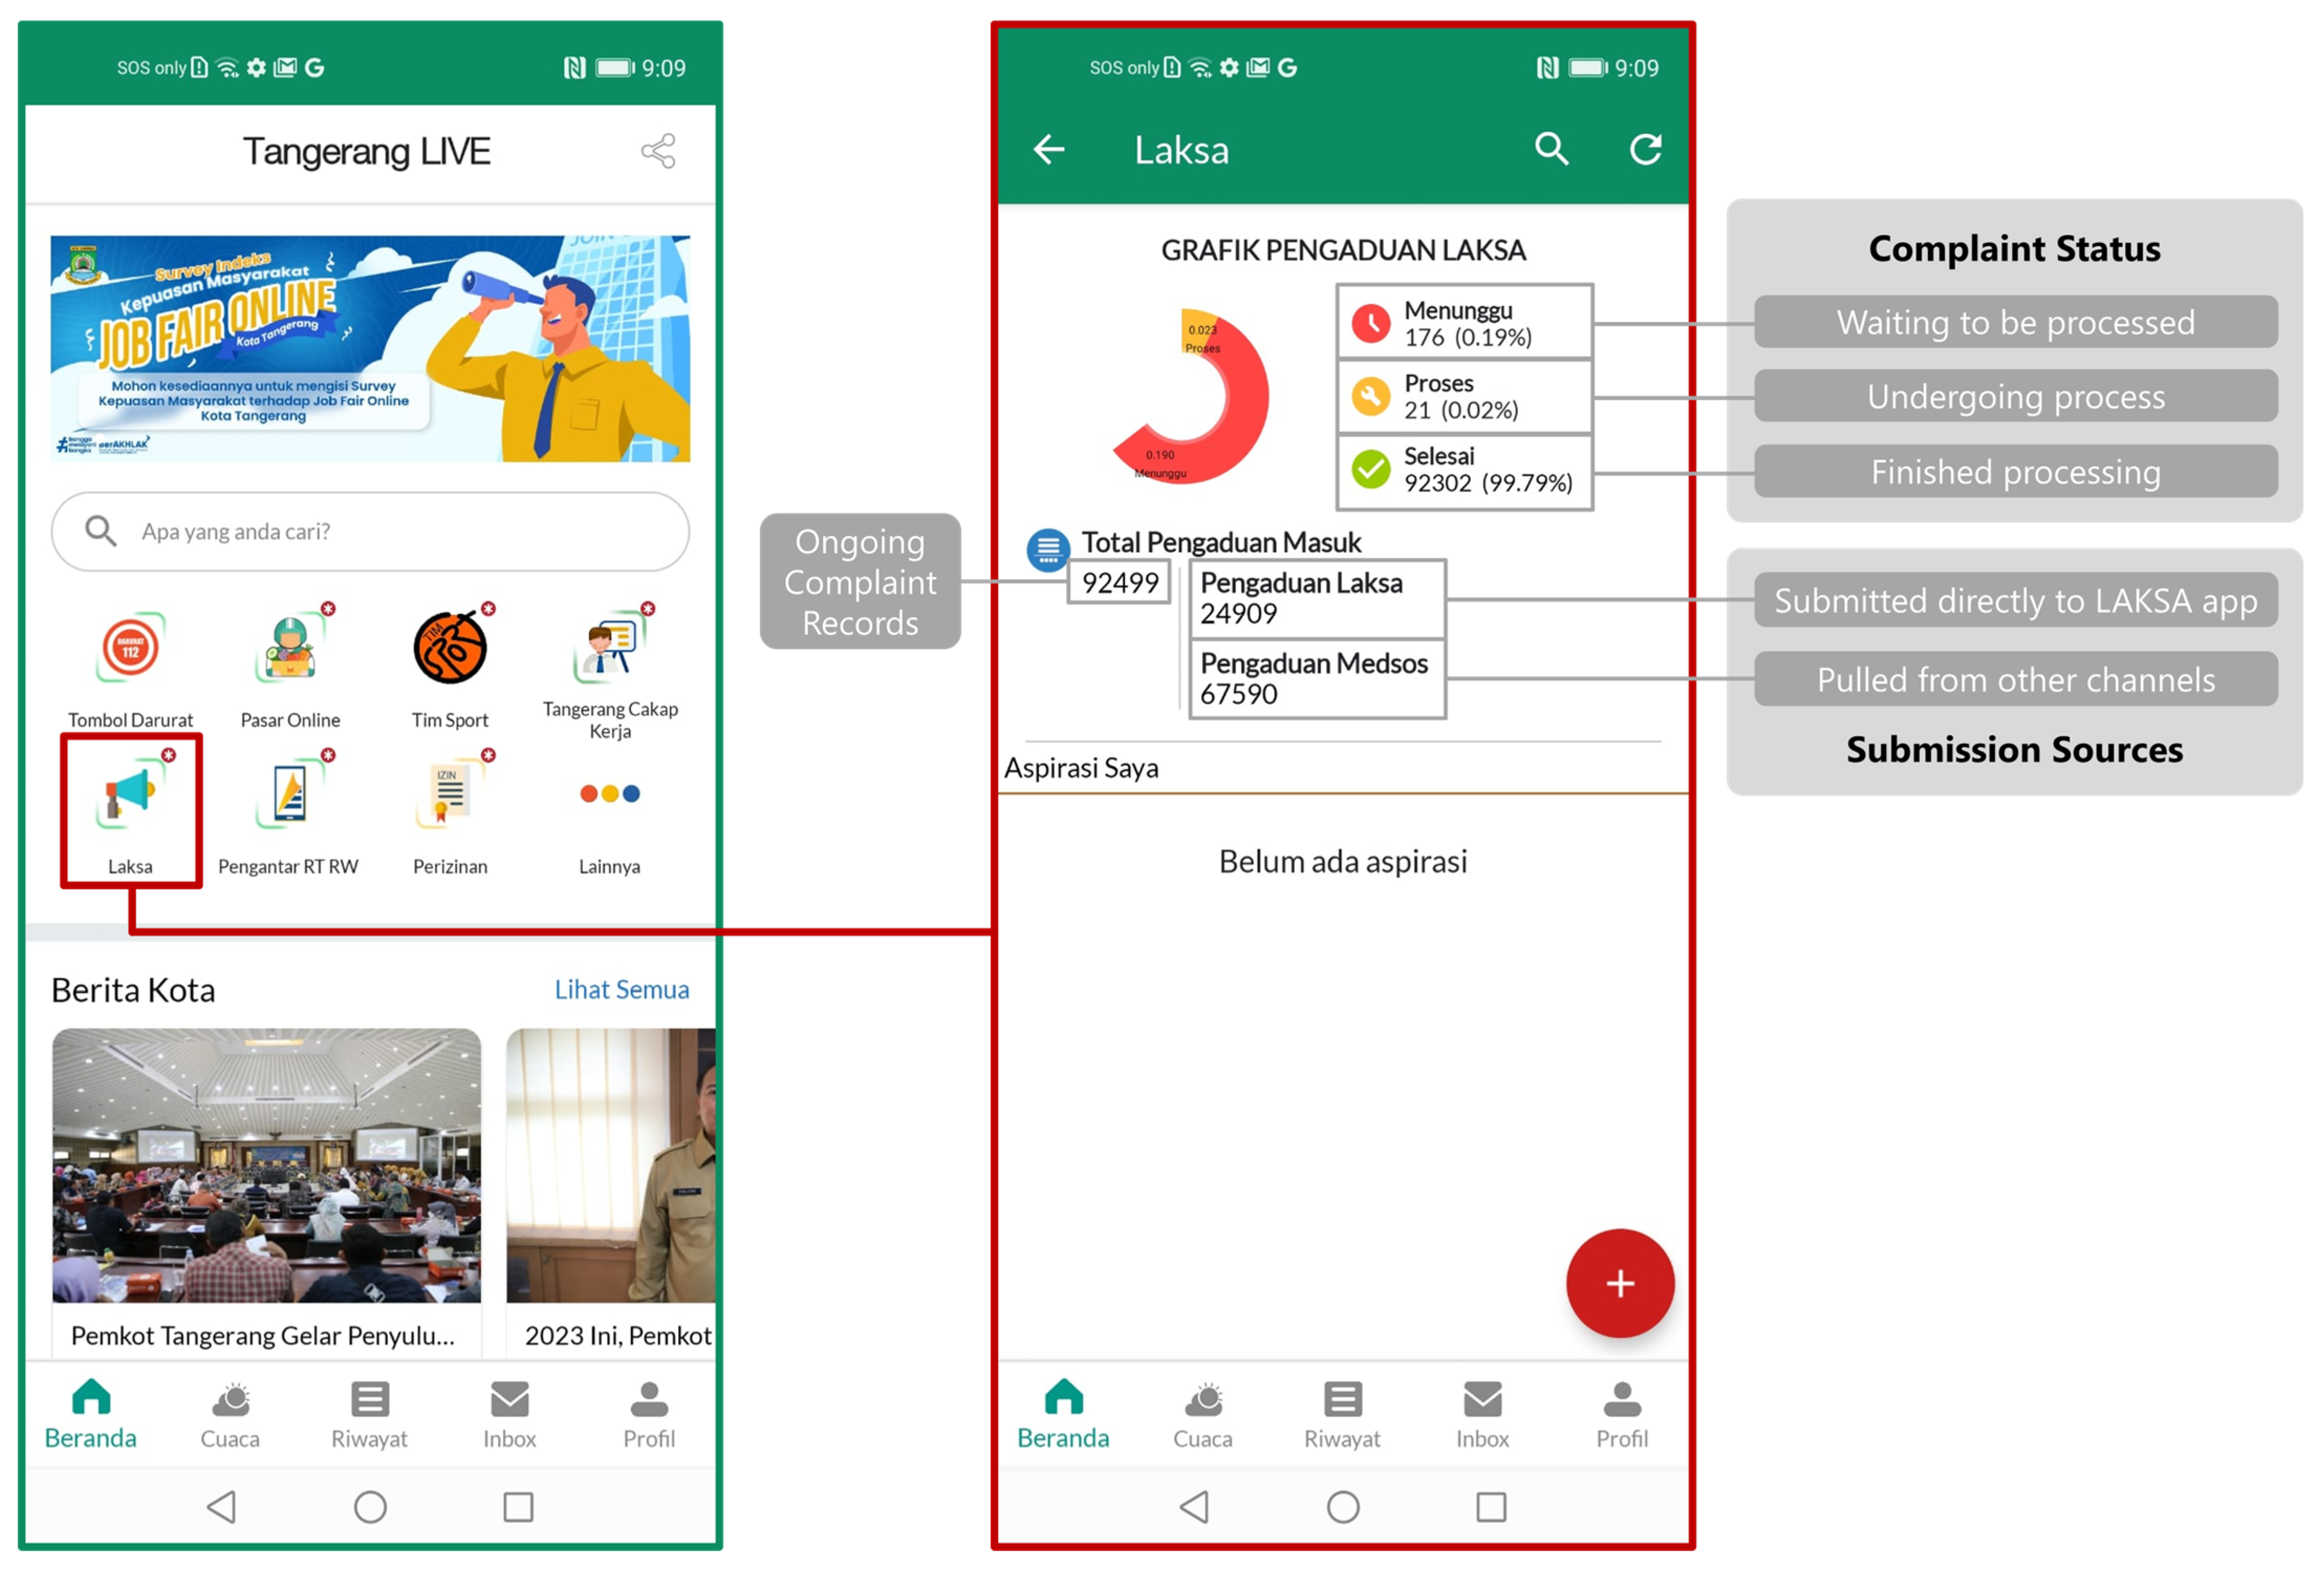
87]. In 2016, the City Government of Tangerang released a super app called Tangerang LIVE [88] (Figure 2, left side). The city government developed the super app to provide various services and information to citizens in one platform, integrating issue-specific apps on e-commerce, license and permits, emergency services, sports, and many others [89]. Citizens can access these services digitally, making it easier and more convenient for them to access information and services from the government.
In the super app, the city government includes LAKSA (Figure 2, right side). The LAKSA app (Layanan Aspirasi Kotak Saran Anda) gives the citizens of Tangerang City a direct digital channel to crowdsource suggestions and criticisms over public services to the government [90]. For security and legal purposes, the LAKSA app is only accessible for the residents of Tangerang City. They are distinguished by detecting residential region-identifying numbers in national identity cards (Kartu Tanda Penduduk, or KTP) used during user registration. In its back-end operations, LAKSA also aggregates complaints crowdsourced through other digital channels. Currently, the city government pulls complaints submitted initially to its official Facebook and Instagram accounts and complaint-related comments from its online news sites [91]. However, multi-channel crowdsourcing has made it difficult for the government to manage the massive datasets, thereby requiring an accurate classification algorithm to ensure an agile and correct routing of the complaints to relevant governmental bodies. Thus, this study used the LAKSA app as the case study to find the most accurate algorithms to classify crowdsourced citizen complaints.

4. Materials and Method

4.1. Research Design

This study, to answer the research questions, followed a 6-stage research design (Figure 3). The first stage, data collection, focused on gathering a dataset of crowdsourced public complaints, which were aggregated from multiple submission channels. The raw complaints, to deliver comparable characteristics, were submitted by the same population (i.e., citizens) toward various public services of the same government. In the second stage, data annotations, the raw training dataset was processed with the help of domain experts to build a structured baseline for the classification patterns. Furthermore, stages III–VI were performed by using Python programming language on top of Jupyter Notebook installed in Anaconda Navigator. The third stage, text preprocessing, which was the beginning of text mining [92], processed the datasets through 6 steps to prepare an analyzable dataset for pattern training and implementation [93]. In the pattern training stage, the dataset was divided into training and testing datasets. The algorithms were first trained using the training dataset with varied parameters. After they learned the classification pattern, they were tested using the testing dataset. Their performances were assessed using Confusion Matrix in the fifth stage. Then, the pattern implementation stage tested them again under varying parameters to increase confidence in their accuracy.

4.2. Data Collection and Annotation

The LAKSA app aggregates complaints submitted through multiple channels. However, public comments on social media and online news sites require manual collection. This consumes the most time and money for the government, making it desirable to use classification algorithms for an automated process. Since they needed considerable time to manually monitor, decide on the collection, and record the metadata, using a dataset with the most recent citizen complaints was impossible. Thus, this study used a dataset containing aggregated complaints crowdsourced from May 2021 to April 2022. The complaint data from that period have been classified (annotated) by the domain experts, i.e., officials from the City Government of Tangerang. The complaints have also been handed over to relevant governmental bodies, where most of them have been followed up, proving that the manual classification has been validated. They could therefore be utilized as the training and testing datasets for this research.

4.3. Text Preprocessing

The first step, case folding, removed varieties in the original letter cases, which, in this study, were all changed to lowercase. The second step, filtering, removed non-alphabetic characters, including dots, commas, colons, and other punctuations, to ensure a clean letter-only text. Next, this study tokenized the cleaned text by dividing the sentences into word-like units (tokens). In the stemming step, the tokenized dataset was further cleaned by removing unnecessary parts of the tokens. Since the complaint data used were in Indonesian, with many affixes, this study decomposed every word into its root form by removing the prefixes, suffixes, infixes, and confixes. This step also eliminated stop words, using the Sastrawi library [94], to let the algorithm understand the structure and meaning of the sentences. In the fifth step, splitting, this study used simple random sampling [95], since it offers a low bias in model performance. The splitting applied an 80:20 split ratio [96], in which 80% of the complaint data were taken as the training data, and the rest were the testing data. Then, the sixth step, vectorization, converted the training and testing datasets into a format understandable by the classification algorithms using the TF–IDF method (Term Frequency–Inverse Document Frequency; Equation (2)). Technically, it is a numerical statistical method that determines the weights for each term in a text [97].
t f i d f t , d , D = t f t , d   ×   log n d f t
where:
  • t f   : text frequency;
  • d f  : frequency of documents; and
  • n    : number of documents.

4.4. Pattern Training

In this stage, the observed algorithms underwent their training with the designated training dataset. The pattern training produced predicted categories of complaint data, the credibility of which was then cross-verified by comparing it with the actual categories presented in the testing data [98]. The cross-verification acted as empirical proof to assess the accuracy of the algorithm’s predictions and its capability for categorizing previously unnoticed data correctly [65]. Besides this, to ensure the optimal performance of these classification algorithms, they were subjected to iterative testing with various parameters. It aimed to fine-tune the algorithms and exploit their full potential in discovering and classifying patterns accurately. In a real-world application as such, it is critical to note that different algorithms might yield optimal performances with varying parameter settings, reflecting their underlying computational characteristics.

4.5. Confusion Matrix

This stage assessed the performance of the algorithms by employing a confusion matrix [99], which formed tabulated data indicating the amount of correct or incorrect classifications, according to the decision by the algorithm. Technically, the confusion matrix captured critical information on the binary comparison between the actual categorizations and those predicted by the classification algorithms [100]. It could manifest as instances where data belonging to category “a” were incorrectly predicted as category “b”. The confusion matrix enabled the identification and quantification of the misclassifications by specifying the number of “a” category data points that were incorrectly classified as “b”, or vice versa. In this study, the main parameter for contrasting classification algorithms was accuracy. Accuracy, in this context, was determined by comparing the quantity of correctly predicted data against the aggregate number of testing data.

4.6. Pattern Implementation

Moreover, this study conducted pattern implementation for the algorithms by varying parameters or mixing algorithms with potential kernels or base learners. The rationale was that varying parameters of the mix would produce more diverse results, hence offering a more comprehensive assessment of the accuracy testing [51]. Technically, this stage bolsters the overall robustness of the research, since the findings were not exclusively dependent on a single algorithm or a fixed critical parameter. The aggregation also mitigated the inherent biases and potential weaknesses of individual algorithms, allowing for a more reliable and comprehensive analysis [101]. In the end, the results of pattern implementation strengthened the level of confidence in the validity and reliability of the results by mimicking possibilities in real-world applications.

5. Results

5.1. Data Collection and Annotation

When gathering complaint data for the observed period (May 2021–April 2022) from the LAKSA app, a dataset of 9865 complaints was initially considered. This collection had been classified (annotated) by officers from the City Government of Tangerang into a massive array of 320 categories. During the preliminary observation, there was a significant amount of uncategorized data present in the dataset. This might be caused by practical opportunities to conduct direct follow-up actions to certain complaints, making it unnecessary for the officers to classify the data in the first place. However, for this study, unclassified data as such brought uncertainty in the accuracy testing, as the absence of annotations by the domain experts rendered these data useless for either pattern training or confusion matrix. Thus, the decision was to eliminate the uncategorized data from the dataset to ensure the reliability of text mining and data analysis. The data removed totaled 3544, returning a dataset of 6321 categorized complaints. Despite the decreased dataset size, this significantly enhanced the utility of the remaining data.
Following the removal of uncategorized data, the only issue present was the remarkably large array of categories (320). This resulted in a considerably low average of complaints per category. Since patterns typically emerge from an adequate number of data points, it would be difficult for the algorithms to learn the patterns of complaints included in any of the categories. Given the difficulty introduced by this issue, the categories underwent a simplification process. The simplified categories had to be general but still representative enough to let the algorithms recognize the pattern of each category. They had to also allow the algorithms to distinguish differences among the patterns. After careful consideration, this operation condensed the 320 categories into four broad but distinct ones, i.e., disasters, infrastructure, social, and nation-related affairs (Table 1). “Disaster” included complaints related to floods, fire, or other emergencies. “Infrastructure” covered those relevant to public works, energies, roads, and similar issues. “Social” included complaints related to intra- and inter-community issues. Then, “nation-related affairs” covered issues relevant to ideological and political affairs at regional and national levels.

5.2. Text Preprocessing

Following the data collection and annotation, the dataset was taken into the text processing stage. This was performed on all remaining 6321 complaint records that were not removed in the initial data cleaning process. Thus, the text processing conducted a 6-step procedure on the refined dataset. Table 2 depicts an example string of preprocessed complaint data resulting from the first four stages of text preprocessing, i.e., case folding, filtering, tokenizing, and stemming. In the example, the case folding changed all capitals to lower case (e.g., G → g), while filtering removed the punctuation (dots, commas). After that, tokenizing converted the text into smaller pieces (tokens), producing the simplest form of human-readable units that were understandable for machine learning algorithms. Then, the stemming process returned the words to their original forms without affixes (e.g., menindaktindak). Looking at the example, the transformation from original into preprocessed text was significant, making the data more manageable for the algorithms.
Furthermore, the last two steps in text processing were data splitting and vectorization. In the data splitting, the folded, filtered, tokenized, and stemmed data were divided into the training and testing datasets. As aforementioned, the splitting followed an 80:20 ratio through simple random sampling, a conventionally accepted balance providing sufficient data for training while reserving an adequate amount for unbiased testing. As a result, there were 5056 training data entries and 1265 testing data entries. After the data splitting (Table 3), the vectorization was conducted using the TF–IDF method. Figure 4 provides an example of the vectorization process by showing the transformation of 10 sample data points into vectors using the TF–IDF method. Basically, it demonstrates the fundamental transition from qualitative (text) data to quantitative (numerical) representations, facilitating the application of machine learning algorithms to the text data.

5.3. Pattern Training and Confusion Matrix

After all the data had been preprocessed, each of the algorithms underwent separate pattern training using the training dataset (5056 datapoints). For each algorithm, the pattern learned was tested for its accuracy over the testing dataset (1265 datapoints). The assessment compares the number of the testing datapoints correctly or incorrectly classified into the four predictive categories (disaster, infrastructure, social, and nation-related affairs). The results of the accuracy assessment for each algorithm were tabulated into a confusion matrix, which allows a comparative assessment between all predictive and actual classification categories. In a confusion matrix, categories on the horizontal axis (top row) show the actual classification of the complaint data, while categories on the vertical axis (left column) show the predictive classification.
In the matrix, numbers at the intersection of predictive and actual categories refer to the number of datapoints that were assigned in the respective pairing of actual and predicted categories. Each number should be read in the column direction and corresponds to the respective pairing of an actual category and a predicted one. Values at the intersection of identical actual and predictive categories show the successful classifications by the algorithm. This indicates instances where the actual and predicted categories are perfectly aligned, demonstrating the ability of an algorithm to categorize the complaints correctly. In contrast, numbers at the intersection of different actual and predicted categories represent instances where the algorithm incorrectly assigned complaint datapoints from their actual categories to inappropriate predicted categories.
The first algorithm deployed was the kNN algorithm. After the pattern training, patterns learned by the kNN algorithm were tested using the testing dataset. Table 4 shows the confusion matrix for the kNN algorithm, implying the classification capabilities of the algorithm for complaint data in the four simplified categories. For instance, 17 complaints originally in the “disaster” category were correctly classified. However, there were 36 instances of incorrect classification, with 27 misclassified into the “infrastructure” category and nine being falsely categorized as “social” complaints. Then, to aggregate the accuracy, total datapoints, classified into identical pairings of actual and predictive categories (correct classifications), were divided by total datapoints in the testing data (Table 3). Based on Equation (3), the accuracy of k-NN was found to be 85%.
A z = X C X E
where:
  • A Z  : accuracy ( A ) for algorithm Z ;
  • X C  : total data ( X ) classified correctly ( C ) in the predictive categories;
  • X E  : total data ( X ) in all actual categories of the testing dataset ( E ) → 1265.
Table 4. Confusion matrix for the k-Nearest Neighbors algorithm.
Actual CategoryDisasterInfrastructureSocialNation-Related Affairs
Predicted Category
Disaster17000
Infrastructure27433592
Social94861141
Nation-Related Affairs00117
Accuracy85.2%
The second classification algorithm tested was the Random Forest. Table 5 is the confusion matrix for the RF algorithm, which is also crucial to discover the effectiveness of the RF algorithm in comparison to other classification techniques. In the confusion matrix, the “disaster” category indicated a total of 23 correct predictions, while 30 instances were misclassified. In contrast, the “infrastructure” category exhibited a substantially higher number of correct predictions, amounting to 437, with only 44 instances being incorrectly classified. Similarly, the “social” category displayed a robust performance with 608 correct predictions and 63 incorrect predictions. However, the “nation-related affairs” category showed a relatively weaker performance, with 27 correct predictions and 33 incorrect predictions. By using Equation (3), the RF-based classification outperforms the classification using the kNN algorithm with a higher accuracy of 86.6%.
The third pattern training was conducted using the SVM algorithm. For the “disaster” category, SVM with a linear kernel produced 31 correct predictions, whereas 22 instances were misclassified. In the “infrastructure” category, the algorithm exhibited a strong performance with 433 correct predictions and 48 incorrect predictions. Moreover, the “social” category revealed another impressive performance by the SVM algorithm, with 628 correct predictions and a mere 43 incorrect predictions. However, the “nation-related affairs” category presented a somewhat balanced outcome, with 30 correct predictions and an equal number of incorrect predictions. Based on Equation (3), the SVM algorithm with a linear kernel surpasses the performances of both the Random Forest and kNN algorithms with a higher accuracy of 89.2%. Table 6 presents the confusion matrix for SVM with a linear kernel, forming a parametric model.
The next pattern training was conducted using the AdaBoost algorithm, which was deployed over SVM–linear kernel as the base learner. Table 7 provides the confusion matrix for the AdaBoost algorithm. In the “disaster” category, the algorithm produced 23 correct predictions and 30 incorrect predictions. Meanwhile, the “infrastructure” category demonstrated a robust performance, with 449 correct predictions and only 32 incorrect predictions. Additionally, the “social” category displayed an impressive performance, with 607 correct and 64 incorrect predictions. Still, the “nation-related affairs” category presented a relatively weaker performance, with 29 correct predictions and 31 incorrect predictions. By using Equation (3), deploying AdaBoost with SVM–linear kernel as the base learner produces a classification accuracy of 87.5%. In other words, AdaBoost with SVM–linear kernel as the base learner offers higher accuracy than Random Forest and kNN. However, its accuracy is lower than the original SVM algorithm with the same kernel.

5.4. Pattern Implementation

Furthermore, this study conducted pattern implementation by deploying the same algorithms over the same training and testing datasets but under varying parameters. This is crucial to see how the algorithms would perform in real-world applications. For the kNN algorithm, this study assumed that the selection of an optimal “k” value was crucial for the algorithm. The pattern implementation for kNN, therefore, probed into the role of the “k” parameter toward its performance. Table 8 presents the performance of the algorithm at the varying “k” values. In the table, the first row shows the “k” values, which marked the varying numbers of nearest neighbors that the algorithm referenced in the classification process. The second row shows the corresponding accuracy achieved by the kNN algorithm, indicating how often the algorithm correctly classified the complaint data, providing a snapshot of its predictive capability. Looking at the table, the performance of kNN indeed fluctuated along with different “k” values. Particularly, the “k” value of 40 produced the highest accuracy (85%). This highlights that the kNN algorithm delivers an optimal performance when the “k” parameter is set to 40 within this particular dataset.
The second pattern implementation focused on the Random Forest algorithm. The assumption was regarding the significance of tuning the number of trees in the algorithm to optimize its classification performance. Consequently, the primary parameter for comparison was the number of trees employed in the settings. Table 9 offers an overview of the classification performance of the RF algorithm under varying numbers of trees. Looking at the results, the settings with 50 trees produced the highest accuracy compared to other configurations. Usually, increasing the number of trees is expected to enhance accuracy, albeit at the expense of slower learning. This trend consistently occurred when the number of trees ranged from 1 to 50. Interestingly, a continuous decrease in accuracy occurred when the number of trees increased beyond 50, which, in this study, was 60 or 70. This suggested a curve-like performance of the RF algorithm under varying numbers of trees.
The third pattern implementation deployed SVM as the classification algorithm. A crucial aspect of SVM classification involves the selection of kernels, which thus served as the primary parameter for comparison in this study. Four kernels, i.e., linear, radial basis function (RBF), polynomial, and sigmoid kernels, were employed separately in the analysis. Table 10 presents the results of the pattern implementation using SVM with the four separate kernels, revealing generally satisfactory accuracy results. Looking at the results, SVM with a linear kernel produced the highest accuracy at 89.2%, closely followed by SVM with sigmoid and polynomial kernels, which exhibited accuracies of 88.7% and 88.6%, respectively. SVM with the RBF kernel returned the lowest performance, with an accuracy of 88.1%. However, the discrepancy in accuracy between the highest and lowest-performing configurations was a mere 1.1%, indicating relatively minor variations in performance across the different kernel configurations.
The fourth pattern implementation examined the performance of the AdaBoost algorithm. As a boosting algorithm, AdaBoost requires a base learner, for which the algorithm works as a booster. In this study, three base learners, i.e., RF, Decision Trees, and SVM–linear kernel, were separately deployed. Table 11 provides detailed results of the accuracy assessment for AdaBoost employing the three separate base learners. Looking at the table, the classification using AdaBoost with SVM–linear kernel as the base learner achieved an accuracy of 87.5%. In contrast, implementing AdaBoost with Decision Trees as the base learner produced a considerably lower accuracy of 73.7%. Meanwhile, the performance of AdaBoost with RF as the base learner exhibited a moderate result of 84.9%. The results highlight substantial differences in the use of different base learners, with a striking 13.8% gap between the highest- and lowest-performing configurations.
Moreover, Table 12 lists the accuracy of classifying the crowdsourced textual data of citizen complaints using the four observed algorithms, i.e., kNN, RF, SVM, and AdaBoost, under different configurations. Looking at the table, the SVM algorithm with a linear kernel produced the highest accuracy (89.2%) compared to other algorithms and settings. This exceptional performance was closely followed by the same algorithm employing two different kernels, i.e., sigmoid (88.7%) and polynomial kernels (88.6%). In stark contrast, the classification process using AdaBoost with Decision Trees as the base learner exhibited the lowest accuracy, with a considerable margin from the second-lowest configuration, i.e., AdaBoost with RF as the base learner, which achieved an accuracy of 84.9%. Despite the notable differences in accuracy between the highest- and lowest-performing configurations, the results indicate that the overall variation in accuracy levels was insignificant. Excluding the lowest-performing configuration, which appears to be an outlier, the remaining settings exhibit only a 4.3% difference in accuracy. In other words, apart from the outlier, the classification algorithms demonstrated relatively consistent performance across various configurations.

6. Discussion

In the observed case of Tangerang City, West Java, Indonesia, the city government, as has also been reported by Nindito et al. [102] and Madyatmadja et al. [103], has implemented pioneering crowdsourcing of public complaints in the country through its LAKSA app, official social media accounts, and government-run online news sites. Despite these innovative initiatives, the local government struggles to efficiently redirect public complaints to the relevant government bodies. Confirming similar problems noted by Almira et al. [104], Nyansiro et al. [105], and Bakunzibake et al. [106], manual monitoring, decision-making, and metadata recording processes consume a considerable amount of time and resources. In a more extended period, it has proven, as also stated by Sunindyo et al. [107] and Goel et al. [108], to be a significant bottleneck in the management and resolution of citizen complaints. Since the availability of officially annotated datasets was constrained by manual processes, it was consequently challenging for this study to obtain a dataset containing the most recent citizen complaints. This supports the pressing need to develop and implement more sophisticated and automated solutions that can classify public complaints, to make it easier for government officials to redirect the complaints to the appropriate government bodies [109,110,111].
In responses to the first (RQ1) and second research questions (RQ2), separately employing four classification algorithms, i.e., k-Nearest Neighbors, Random Forest, Support Vector Machine, and AdaBoost, produced different levels of accuracy. Looking at Table 12, the SVM algorithm performed well above the other three in classifying citizen complaints. This is particularly evident since its combination with four separate kernels resulted in slightly varied classification accuracies, with an accuracy range between 88.1% and 89.2%, which still remained higher than the results of other algorithms under different configurations. The results further demonstrated the versatility of SVM for classification purposes, which have been proven in various fields [112,113,114]. Meanwhile, RF and kNN followed in the second and third places, respectively. Still, their small margin to the performance of SVM implied the possibility of utilizing them for different datasets of crowdsourced citizen complaints, as also demonstrated by Sano et al. [115] for RF and Tjandra et al. [116] for kNN. In last place, AdaBoost gave more varied results depending on the base learners used. Interestingly, AdaBoost produced lower performances than the independent accuracy of RF and SVM. This confirms Reyzin and Schapire [117], who found that, in certain conditions, boosting algorithms could deliver a worse performance, despite a higher margin distribution.
Furthermore, as data mining techniques, the four classification algorithms being observed could perform differently under different configurations. For kNN (Table 8), this study found significant increases in accuracy along with a rise in “k” values under 40. However, after reaching the maximum accuracy at k = 40, its accuracy decreased consistently, albeit with smaller margins for the same incremental increases or decreases. This confirms that the behavior of the kNN algorithm significantly depends on the number of “k” [58,118], with larger “k” values increasing the accuracy significantly, until the configuration reaches an optimum value. Meanwhile, the RF algorithm performed variably under different numbers of trees, with the optimum value being 50 trees (Table 9). Confirming previous studies [119,120], it implies the typical behavior of the Random Forest algorithm, which produces a threshold for an optimal number of trees. However, there were no significant differences in accuracy for the same incremental changes in the number of trees below and above the optimum value. In parallel to other studies [121,122,123], the diminishing returns in the classification accuracy of RF, as the number of trees increases beyond an optimal point, may be attributed to overfitting or increased model complexity, which could negatively impact the generalizability of the algorithm.
For the SVM algorithm, the configurations focused on the use of separate kernels. In general, the levels of accuracy, when employing different kernels (Table 10), did not produce significant results for the given dataset. The best-performing configuration, i.e., SVM with a linear kernel, confirms the findings of Raghavendra and Deka [124] regarding its predictive ability. Meanwhile, the polynomial and sigmoid kernels performed somewhat equally. The worst performing kernel, i.e., radial basis function, although it insignificantly differed from the other three kernels, implied a dataset-specific capability of the kernel in learning, but not in predicting [125]. Still, the insignificant differences in performance across the various kernel types highlight the importance of selecting an appropriate kernel to achieve optimal classification results for a given dataset. On the other hand, the accuracy levels of classification using the AdaBoost algorithm with three separate base learners, i.e., RF, Decision Trees, and SVM, show relatively different results (Table 11), with SVM (with a linear kernel) as the base learner performing the best. This makes sense, since SVM also produced the best accuracy among the four observed algorithms in this study. Despite not being conventionally preferable for AdaBoost [126,127], SVM was proven to be a highly performing base learner for AdaBoost, especially for the given dataset of crowdsourced citizen complaints.
Moreover, all the observed algorithms, despite having different levels of accuracy for overall classification (Table 12), exhibited similar trends when predicting complaint data in individual categories. Table 13 showed the raw data of predictions correctly classified by each algorithm into the categories, which were compared to the original amount of data for the respective categories in the initial training dataset (Table 3). Looking at the percentage of correct predictions, all the algorithms performed well in the “infrastructure” and “social” categories with levels of accuracy above 90%. In contrast, the average accuracy of their predictions for “disaster” and “nation-related affairs” did not even reach half of the amount of original data for the categories. This may have occurred because there was a smaller amount of data available for the “disaster” and “nation-related affairs” in the original dataset, making the algorithms unable to grasp adequate knowledge from the pattern training. Considering the amount of training data available for each category and the levels of accuracy that came with it, the results confirm the findings of Kale and Patil [128] and Bzdok et al. [129], who stated that the accuracy of text mining increases logarithmically when the amount of training data increases. This implies that further training remains necessary to improve the accuracy of predictive classification in any given dataset.

7. Conclusions

E-government systems aim to streamline and enhance government–citizen interactions. Tangerang is a prime example of a city that has embraced e-government, with its administration developing an electronic system (LAKSA) for receiving public complaints through various channels. However, the actual implementation of this e-government system has encountered challenges, particularly in the management of massive complaint data sourced from less-moderated platforms, such as social media and online news sites. These data often appear unstructured, lacking categories or classes that would facilitate efficient channeling to the appropriate government agencies. This research, to overcome this obstacle, proposed the application of data mining techniques, specifically classification algorithms, as a practical solution for categorizing and organizing vast amounts of unstructured complaint data. For the given dataset from the Government of Tangerang City, this study assessed four algorithms, i.e., kNN, RF, SVM, and AdaBoost, to discover one with the best accuracy for classification. It would allow the government to better manage the challenges posed by unstructured complaint data and ensure the timely and appropriate handling of public complaints. This proactive approach would not only improve the overall efficiency of e-government systems but also strengthen the relationship between governments and their constituents in an increasingly digital world.
This study measured the accuracy of each algorithm in classifying the citizen complaint data of Tangerang City that was aggregated by the LAKSA app. The primary measure involved a confusion matrix over four classification categories, which compared the amount of correct prediction data with the testing data. The results showed that, according to accuracy level, the best classification algorithm to classify the complaint data was the Support Vector Machine algorithm using the linear kernel, with an accuracy rate of 89.2%. SVM, in fact, remained the best-performing algorithm under different configurations with any of the observed kernels. Practically, other classification algorithms with a minimum accuracy threshold of 85%, i.e., k-Nearest Neighbors and Random Forest, could also be used for the dataset. However, AdaBoost, for the given dataset, was prone to low levels of accuracy, except when paired with SVM as its base learner. Besides, this study found that categories with a lower amount of training data (“disaster” and “nation-related affairs”) demonstrated lower accuracy levels. In contrast, those with a higher volume of training data (“infrastructure” and “social”) exhibited considerably higher accuracy levels. This observation underscores the need for continuous supervised training with a larger volume of training data to enhance accuracy across all categories.
In addition, the findings hold significant potential for informing the decision-making process within the Government of Tangerang City. Insights from the accuracy testing of classification algorithms allow authorities to make informed choices on the most effective methods for categorizing and managing the massive amount of unstructured citizen complaint data. Besides, the results offer broader relevance beyond the case study, as they can serve as valuable references for other administrative regions across Indonesia. Particularly, these findings can guide the implementation of data classification strategies, specifically in the context of public complaints, enhancing e-government systems on a national scale. Beyond its practical applications, this study also provides a foundation for further research in the field of data classification. The performance assessment of various algorithms enables researchers to explore alternative word weighting methods, such as Bag-of-Words and Word2Vec, to further optimize the classification process. Moreover, future research needs to develop an Indonesian text mining library. The extremely rare availability of such resources presents a challenge for researchers and practitioners, as it limits the accessibility of localized tools and techniques. Thus, future studies can contribute to the body of knowledge of Indonesian text mining resources, ultimately benefiting the broader scientific community and the country’s e-government efforts.

Author Contributions

Conceptualization, E.D.M. and C.P.M.S.; methodology, E.D.M., C.P.M.S. and D.J.M.S.; software, C.P.M.S. and C.W.; validation, E.D.M., C.P.M.S. and D.J.M.S.; formal analysis, E.D.M. and C.P.M.S.; investigation, E.D.M., C.P.M.S., C.W. and D.J.M.S.; resources, E.D.M. and C.P.M.S.; data curation, E.D.M. and C.W.; writing—original draft preparation, C.P.M.S.; writing—review and editing, E.D.M., C.W. and D.J.M.S.; visualization, C.P.M.S. and C.W.; project administration, E.D.M. and C.P.M.S.; funding acquisition, E.D.M. and C.P.M.S. All authors have read and agreed to the published version of the manuscript.

Funding

This research was funded by the Research and Technology Transfer Office (RTTO), Bina Nusantara University, grant period 2022–2023.

Institutional Review Board Statement

Not applicable.

Informed Consent Statement

Not applicable.

Data Availability Statement

Datasets used in this study are available on request.

Acknowledgments

The authors would like to thank the government officers of Tangerang City for their help in the acquisition of the crowdsourced citizen complaint data used in this research.

Conflicts of Interest

The authors declare no conflict of interest. The funder had no role in the design of the study; in the collection, analyses, or interpretation of data; in the writing of the manuscript; or in the decision to publish the results.

References

  1. Blumenthal, D.; Fowler, E.J.; Abrams, M.; Collins, S.R. Covid-19—Implications for the Health Care System. N. Engl. J. Med. 2020, 383, 1483–1488. [Google Scholar] [CrossRef] [PubMed]
  2. Mian, M.M.; Zeng, X.; Nasry, A.a.N.B.; Al-Hamadani, S.M.Z.F. Municipal solid waste management in China: A comparative analysis. J. Mater. Cycles Waste Manag. 2017, 19, 1127–1135. [Google Scholar] [CrossRef]
  3. Sianipar, C.P.M.; Dowaki, K. Eco-burden in pavement maintenance: Effects from excess traffic growth and overload. Sustain. Cities Soc. 2014, 12, 31–45. [Google Scholar] [CrossRef]
  4. Hidayat, A.R.T.; Sianipar, C.P.M.; Hashimoto, S.; Hoshino, S.; Dimyati, M.; Yustika, A.E. Personal cognition and implicit constructs affecting preferential decisions on farmland ownership: Multiple case studies in Kediri, East Java, Indonesia. Land 2023, 12, 1847. [Google Scholar] [CrossRef]
  5. Jung, K.; Song, M. Linking emergency management networks to disaster resilience: Bonding and bridging strategy in hierarchical or horizontal collaboration networks. Qual. Quant. 2015, 49, 1465–1483. [Google Scholar] [CrossRef]
  6. Pin, L.A.; Pennink, B.J.W.; Balsters, H.; Sianipar, C.P.M. Technological appropriateness of biomass production in rural settings: Addressing water hyacinths (E. crassipes) problem in Lake Tondano, Indonesia. Technol. Soc. 2021, 66, 101658. [Google Scholar] [CrossRef]
  7. Dimitrov, M.K. What the Party Wanted to Know. East Eur. Politics Soc. Cult. 2014, 28, 271–295. [Google Scholar] [CrossRef]
  8. Riccucci, N.M.; Ryzin, G.G.V. Representative Bureaucracy: A Lever to Enhance Social Equity, Coproduction, and Democracy. Public Adm. Rev. 2017, 77, 21–30. [Google Scholar] [CrossRef]
  9. Epp, D.A.; Thomas, H.F. When Bad News Becomes Routine: Slowly-Developing Problems Moderate Government Responsiveness. Political Res. Q. 2023, 76, 3–13. [Google Scholar] [CrossRef]
  10. Peters, B.G. Managing Horizontal Government: The Politics of Co-Ordination. Public Adm. 1998, 76, 295–311. [Google Scholar] [CrossRef]
  11. Ma, L.; Chung, J.; Thorson, S. E-government in China: Bringing economic development through administrative reform. Gov. Inf. Q. 2005, 22, 20–37. [Google Scholar] [CrossRef]
  12. Klamo, L.; Huang, W.W.; Wang, K.L.; Le, T. Successfully implementing e-government: Fundamental issues and a case study in the USA. Electron. Gov. Int. J. 2006, 3, 158. [Google Scholar] [CrossRef]
  13. Wibowo, M.I.; Santoso, A.J.; Setyohadi, D.B. Factors Affecting the Successful Implementation of E-Government on Network Documentation and Legal Information Website in Riau. CommIT Commun. Inf. Technol. J. 2018, 12, 51–57. [Google Scholar] [CrossRef]
  14. Relly, J.E.; Sabharwal, M. Perceptions of transparency of government policymaking: A cross-national study. Gov. Inf. Q. 2009, 26, 148–157. [Google Scholar] [CrossRef]
  15. Tejedo-Romero, F.; Araujo, J.F.F.E.; Tejada, Á.; Ramírez, Y. E-government mechanisms to enhance the participation of citizens and society: Exploratory analysis through the dimension of municipalities. Technol. Soc. 2022, 70, 101978. [Google Scholar] [CrossRef]
  16. Halachmi, A.; Greiling, D. Transparency, E-Government, and Accountability. Public Perform. Manag. Rev. 2013, 36, 562–584. [Google Scholar] [CrossRef]
  17. Freeman, J. E-government in the context of monitory democracy: Public participation and democratic reform. Media Asia 2013, 40, 354–362. [Google Scholar] [CrossRef]
  18. Sala, E.E.; Subriadi, A.P. Hot-Fit Model to Measure the Effectiveness and Efficiency of Information System in Public Sector. Winners 2023, 23, 131–141. [Google Scholar] [CrossRef]
  19. Oxford Analytica. GenAI Will Transform Workplace Tasks across Industries; Expert Briefings; Oxford Analytica: Oxford, UK, 2023. [Google Scholar] [CrossRef]
  20. Pan, Y.; Pan, L.; Chen, W.; Nakov, P.; Kan, M.-Y.; Wang, W.Y. On the Risk of Misinformation Pollution with Large Language Models. arXiv 2023. [Google Scholar] [CrossRef]
  21. Gong, Y. Multilevel Large Language Models for Everyone. arXiv 2023. [Google Scholar] [CrossRef]
  22. Karimpanal, T.G.; Bouffanais, R. Self-organizing maps for storage and transfer of knowledge in reinforcement learning. Adapt. Behav. 2019, 27, 111–126. [Google Scholar] [CrossRef]
  23. Madyatmadja, E.D.; Pristinella, D.; Dewa, M.D.K.; Nindito, H.; Wijaya, C. Data Mining Techniques of Complaint Reports for E-government: A Systematic Literature Review. In Proceedings of the 2020 International Conference on Information Management and Technology (ICIMTech), Bandung, Indonesia, 13–14 August 2020; pp. 841–846. [Google Scholar] [CrossRef]
  24. Kramer, O. K-Nearest Neighbors. In Dimensionality Reduction with Unsupervised Nearest Neighbors; Kramer, O., Ed.; Springer: Berlin/Heidelberg, Germany, 2013; Volume 51, pp. 13–23. [Google Scholar] [CrossRef]
  25. Breiman, L. Random Forests. Mach. Learn. 2001, 45, 5–32. [Google Scholar] [CrossRef]
  26. Suthaharan, S. Support Vector Machine. In Machine Learning Models and Algorithms for Big Data Classification, Thinking with Examples for Effective Learning; Springer: Boston, MA, USA, 2016; Volume 36, pp. 207–235. [Google Scholar] [CrossRef]
  27. Schapire, R.E. Empirical Inference, Festschrift in Honor of Vladimir N. Vapnik. In Empirical Inference; Schölkopf, B., Luo, Z., Vovk, V., Eds.; Springer: Berlin/Heidelberg, Germany, 2013; pp. 37–52. [Google Scholar] [CrossRef]
  28. Noi, P.T.; Kappas, M. Comparison of Random Forest, k-Nearest Neighbor, and Support Vector Machine Classifiers for Land Cover Classification Using Sentinel-2 Imagery. Sensors 2017, 18, 18. [Google Scholar] [CrossRef]
  29. Ernest, Y.B.; Joseph, O.; Daniel, A.A. Basic Tenets of Classification Algorithms K-Nearest-Neighbor, Support Vector Machine, Random Forest and Neural Network: A Review. J. Data Anal. Inf. Process. 2020, 8, 341–357. [Google Scholar] [CrossRef]
  30. Shabani, S.; Samadianfard, S.; Sattari, M.T.; Mosavi, A.; Shamshirband, S.; Kmet, T.; Várkonyi-Kóczy, A.R. Modeling Pan Evaporation Using Gaussian Process Regression K-Nearest Neighbors Random Forest and Support Vector Machines; Comparative Analysis. Atmosphere 2020, 11, 66. [Google Scholar] [CrossRef]
  31. Hariri, R.H.; Fredericks, E.M.; Bowers, K.M. Uncertainty in big data analytics: Survey, opportunities, and challenges. J. Big Data 2019, 6, 44. [Google Scholar] [CrossRef]
  32. Cury, R.M. Oscillation of tweet sentiments in the election of João Doria Jr. for Mayor. J. Big Data 2019, 6, 42. [Google Scholar] [CrossRef]
  33. Wowczko, I.A. Skills and Vacancy Analysis with Data Mining Techniques. Informatics 2015, 2, 31–49. [Google Scholar] [CrossRef]
  34. Dias, D.; Silva, J.S.; Bernardino, A. The Prediction of Road-Accident Risk through Data Mining: A Case Study from Setubal, Portugal. Informatics 2023, 10, 17. [Google Scholar] [CrossRef]
  35. Ngai, E.W.T.; Xiu, L.; Chau, D.C.K. Application of data mining techniques in customer relationship management: A literature review and classification. Expert Syst. Appl. 2009, 36, 2592–2602. [Google Scholar] [CrossRef]
  36. Rygielski, C.; Wang, J.-C.; Yen, D.C. Data mining techniques for customer relationship management. Technol. Soc. 2002, 24, 483–502. [Google Scholar] [CrossRef]
  37. Kesavaraj, G.; Sukumaran, S. A study on classification techniques in data mining. In Proceedings of the 2013 Fourth International Conference on Computing, Communications and Networking Technologies (ICCCNT), Tiruchengode, India, 4–6 July 2013; pp. 1–7. [Google Scholar] [CrossRef]
  38. Desai, B.C.; Almeida, A.M.; Mudur, S.; Borges, L.C.; Marques, V.M.; Bernardino, J. Comparison of data mining techniques and tools for data classification. In Proceedings of the International C* Conference on Computer Science and Software Engineering, Porto, Portugal, 10–12 July 2013; pp. 113–116. [Google Scholar] [CrossRef]
  39. Alaoui, I.E.; Gahi, Y.; Messoussi, R.; Chaabi, Y.; Todoskoff, A.; Kobi, A. A novel adaptable approach for sentiment analysis on big social data. J. Big Data 2018, 5, 12. [Google Scholar] [CrossRef]
  40. Sano, A.V.D.; Nindito, H. Application of K-Means Algorithm for Cluster Analysis on Poverty of Provinces in Indonesia. ComTech Comput. Math. Eng. Appl. 2016, 7, 141–150. [Google Scholar] [CrossRef]
  41. Condrobimo, A.R.; Sano, A.V.D.; Nindito, H. The Application Of K-Means Algorithm For LQ45 Index on Indonesia Stock Exchange. ComTech Comput. Math. Eng. Appl. 2016, 7, 151–159. [Google Scholar] [CrossRef]
  42. Berkhin, P. A Survey of Clustering Data Mining Techniques. In Grouping Multidimensional Data; Kogan, J., Nicholas, C., Teboulle, M., Eds.; Springer: Berlin/Heidelberg, Germany, 2006; pp. 25–71. [Google Scholar] [CrossRef]
  43. Yan, H.; Yang, N.; Peng, Y.; Ren, Y. Data mining in the construction industry: Present status, opportunities, and future trends. Autom. Constr. 2020, 119, 103331. [Google Scholar] [CrossRef]
  44. Iqbal, M.; Efendi, S. Data-Driven Approach for Credit Risk Analysis Using C4.5 Algorithm. ComTech Comput. Math. Eng. Appl. 2023, 14, 11–20. [Google Scholar] [CrossRef]
  45. Fan, W.; Wallace, L.; Rich, S.; Zhang, Z. Tapping the power of text mining. Commun. ACM 2006, 49, 76–82. [Google Scholar] [CrossRef]
  46. Alsaidi, S.A.; Sadeq, A.T.; Abdullah, H.S. English poems categorization using text mining and rough set theory. Bull. Electr. Eng. Inform. 2020, 9, 1701–1710. [Google Scholar] [CrossRef]
  47. Christian, H.; Agus, M.P.; Suhartono, D. Single Document Automatic Text Summarization using Term Frequency-Inverse Document Frequency (TF-IDF). ComTech Comput. Math. Eng. Appl. 2016, 7, 285–294. [Google Scholar] [CrossRef]
  48. Rosnelly, R.; Hartama, D.; Sadikin, M.; Lubis, C.P.; Simanjuntak, M.S.; Kosasi, S. The Similarity of Essay Examination Results using Preprocessing Text Mining with Cosine Similarity and Nazief-Adriani Algorithms. Turk. J. Comput. Math. Educ. 2021, 12, 1415–1422. [Google Scholar] [CrossRef]
  49. Li, J.; Li, Y.; Wang, X.; Tan, W.-C. Deep or simple models for semantic tagging? Proc. VLDB Endow. 2020, 13, 2549–2562. [Google Scholar] [CrossRef]
  50. Li, L.; Liu, X.; Zhang, X. Public attention and sentiment of recycled water: Evidence from social media text mining in China. J. Clean. Prod. 2021, 303, 126814. [Google Scholar] [CrossRef]
  51. Sutranggono, A.N.; Imah, E.M. Tweets Emotions Analysis of Community Activities Restriction as COVID-19 Policy in Indonesia Using Support Vector Machine. CommIT Commun. Inf. Technol. J. 2023, 17, 13–25. [Google Scholar] [CrossRef]
  52. Adeniyi, D.A.; Wei, Z.; Yongquan, Y. Automated web usage data mining and recommendation system using K-Nearest Neighbor (KNN) classification method. Appl. Comput. Inform. 2016, 12, 90–108. [Google Scholar] [CrossRef]
  53. Archer, K.J.; Kimes, R.V. Empirical characterization of random forest variable importance measures. Comput. Stat. Data Anal. 2008, 52, 2249–2260. [Google Scholar] [CrossRef]
  54. Guo, G.; Wang, H.; Bell, D.; Bi, Y.; Greer, K. KNN Model-Based Approach in Classification. In On the Move to Meaningful Internet Systems 2003: CoopIS, DOA, and ODBASE, OTM Confederated International Conferences, CoopIS, DOA, and ODBASE 2003, Catania, Sicily, Italy, 3–7 November 2003, Proceedings; Lecture Notes in Computer Science; Springer: Berlin/Heidelberg, Germany, 2003; pp. 986–996. [Google Scholar] [CrossRef]
  55. Lan, C.; Song, B.; Zhang, L.; Fu, L.; Guo, X.; Sun, C. State prediction of hydro-turbine based on WOA-RF-Adaboost. Energy Rep. 2022, 8, 13129–13137. [Google Scholar] [CrossRef]
  56. Wang, F.; Zhen, Z.; Wang, B.; Mi, Z. Comparative Study on KNN and SVM Based Weather Classification Models for Day Ahead Short Term Solar PV Power Forecasting. Appl. Sci. 2017, 8, 28. [Google Scholar] [CrossRef]
  57. Zhang, J.; Liu, P.; Zhang, F.; Iwabuchi, H.; de Moura, A.A.d.H.e.A.; de Albuquerque, V.H.C. Ensemble Meteorological Cloud Classification Meets Internet of Dependable and Controllable Things. IEEE Internet Things J. 2021, 8, 3323–3330. [Google Scholar] [CrossRef]
  58. Zhang, S.; Li, X.; Zong, M.; Zhu, X.; Wang, R. Efficient kNN Classification with Different Numbers of Nearest Neighbors. IEEE Trans. Neural Netw. Learn. Syst. 2018, 29, 1774–1785. [Google Scholar] [CrossRef]
  59. Martínez, F.; Frías, M.P.; Pérez, M.D.; Rivera, A.J. A methodology for applying k-nearest neighbor to time series forecasting. Artif. Intell. Rev. 2019, 52, 2019–2037. [Google Scholar] [CrossRef]
  60. Denisko, D.; Hoffman, M.M. Classification and interaction in random forests. Proc. Natl. Acad. Sci. USA 2018, 115, 1690–1692. [Google Scholar] [CrossRef] [PubMed]
  61. Parmar, A.; Katariya, R.; Patel, V. A Review on Random Forest: An Ensemble Classifier. In Lecture Notes on Data Engineering and Communications Technologies; Hemanth, J., Fernando, X., Lafata, P., Baig, Z., Eds.; Springer: Cham, Switzerland, 2019; Volume 26, pp. 758–763. [Google Scholar] [CrossRef]
  62. Ahmad, I.; Basheri, M.; Iqbal, M.J.; Rahim, A. Performance Comparison of Support Vector Machine, Random Forest, and Extreme Learning Machine for Intrusion Detection. IEEE Access 2018, 6, 33789–33795. [Google Scholar] [CrossRef]
  63. Erfani, S.M.; Rajasegarar, S.; Karunasekera, S.; Leckie, C. High-dimensional and large-scale anomaly detection using a linear one-class SVM with deep learning. Pattern Recognit. 2016, 58, 121–134. [Google Scholar] [CrossRef]
  64. Thongkam, J.; Xu, G.; Zhang, Y.; Huang, F. Breast cancer survivability via AdaBoost algorithms. In Proceedings of the Second Australasian Workshop on Health Data and Knowledge Management, Wollongong, Australia, 24–25 January 2008; Warren, J.R., Yu, P., Yearwood, J., Patrick, J.D., Eds.; Australian Computer Society: Wollongong, Australia, 2006; Volume 80, pp. 55–64. [Google Scholar]
  65. Wijaya, A.; Girsang, A.S. Use of Data Mining for Prediction of Customer Loyalty. CommIT Commun. Inf. Technol. J. 2015, 10, 41–47. [Google Scholar] [CrossRef]
  66. Lei, Y.; Zuo, M.J. Gear crack level identification based on weighted K nearest neighbor classification algorithm. Mech. Syst. Signal Process. 2009, 23, 1535–1547. [Google Scholar] [CrossRef]
  67. Liaw, A.; Wiener, M. Classification and regression by randomForest. R News 2002, 3, 18–22. [Google Scholar]
  68. Sarica, A.; Cerasa, A.; Quattrone, A. Random Forest Algorithm for the Classification of Neuroimaging Data in Alzheimer’s Disease: A Systematic Review. Front. Aging Neurosci. 2017, 9, 329. [Google Scholar] [CrossRef] [PubMed]
  69. Li, H.; Lü, Z.; Yue, Z. Support vector machine for structural reliability analysis. Appl. Math. Mech. 2006, 27, 1295–1303. [Google Scholar] [CrossRef]
  70. Hsu, C.-W.; Chang, C.-C.; Lin, C.-J. Practical Guide to Support Vector Classification; National Taiwan University: Taipei, Taiwan, 2003; p. 12. [Google Scholar]
  71. Vijayarani, S.; Dhayanand, S. Kidney disease prediction using SVM and ANN algorithms. Int. J. Comput. Bus. Res. 2015, 6, 1–12. [Google Scholar]
  72. Schapire, R.E.; Singer, Y. Improved Boosting Algorithms Using Confidence-rated Predictions. Mach. Learn. 1999, 37, 297–336. [Google Scholar] [CrossRef]
  73. Freund, Y.; Schapire, R.E. Experiments with a new boosting algorithm. In Proceedings of the Thirteenth International Conference on International Conference on Machine Learning, Bari, Italy, 3–6 July 1996; Saitta, L., Ed.; Morgan Kaufmann Publishers: San Francisco, CA, USA, 1996; pp. 148–156. [Google Scholar]
  74. Li, J.; Sun, L.; Li, R. Nondestructive detection of frying times for soybean oil by NIR-spectroscopy technology with Adaboost-SVM (RBF). Optik 2020, 206, 164248. [Google Scholar] [CrossRef]
  75. Dhote, S.; Vichoray, C.; Pais, R.; Baskar, S.; Shakeel, P.M. Hybrid geometric sampling and AdaBoost based deep learning approach for data imbalance in E-commerce. Electron. Commer. Res. 2020, 20, 259–274. [Google Scholar] [CrossRef]
  76. Almunawar, M.N.; Islam, M.Z.; de Pablos, P.O. Digital Transformation Management: Challenges and Futures in the Asian Digital Economy; Almunawar, M.N., Islam, M.Z., de Pablos, P.O., Eds.; Routledge: New York, NY, USA, 2022. [Google Scholar]
  77. Li, K.; Kim, D.J.; Lang, K.R.; Kauffman, R.J.; Naldi, M. How should we understand the digital economy in Asia? Critical assessment and research agenda. Electron. Commer. Res. Appl. 2020, 44, 101004. [Google Scholar] [CrossRef] [PubMed]
  78. Pillai, T.R.; Ahamat, A. Social-cultural capital in youth entrepreneurship ecosystem: Southeast Asia. J. Enterprising Communities People Places Glob. Econ. 2018, 12, 232–255. [Google Scholar] [CrossRef]
  79. Widagdo, B.; Rofik, M. Internet of Things as Engine of Economic Growth in Indonesia. Indones. J. Bus. Econ. 2019, 2, 255–264. [Google Scholar] [CrossRef]
  80. Dudhat, A.; Agarwal, V. Indonesia’s Digital Economy’s Development. IAIC Trans. Sustain. Digit. Innov. ITSDI 2023, 4, 109–118. [Google Scholar] [CrossRef]
  81. Prahono, A.; Elidjen. Evaluating the Role e-Government on Public Administration Reform: Case of Official City Government Websites in Indonesia. Procedia Comput. Sci. 2015, 59, 27–33. [Google Scholar] [CrossRef]
  82. Angeline, M.; Evelina, L.; Siregar, V.M. Towards Cyber City: DKI Jakarta and Surabaya Provincial Government Digital Public Services. Humaniora 2016, 7, 441–451. [Google Scholar] [CrossRef]
  83. Government of Indonesia. Peraturan Presiden (Perpres) No. 95 Tahun 2018 Tentang Sistem Pemerintahan Berbasis Elektronik. Pub. L. No. 95/2018. 2018. Available online: https://peraturan.bpk.go.id/Details/96913/perpres-no-95-tahun-2018 (accessed on 1 January 2023).
  84. Wismansyah, A.R. Assessing the Success of the E-Government System in Terms of the Quality of Public Services: A Case Study in the Regional Government of the City of Tangerang. In Proceedings of the 7th International Conference on Accounting, Management and Economics (ICAME-7 2022), Makassar, Indonesia, 6–7 October 2022; Atlantis Press: Amsterdam, The Netherlands, 2023; pp. 367–374. [Google Scholar] [CrossRef]
  85. Martinez, R.; Masron, I.N. Jakarta: A city of cities. Cities 2020, 106, 102868. [Google Scholar] [CrossRef]
  86. Handayeni, K.D.M.E.; Ariyani, B.S.P. Commuters’ travel behaviour and willingness to use park and ride in Tangerang city. IOP Conf. Ser. Earth Environ. Sci. 2018, 202, 012019. [Google Scholar] [CrossRef]
  87. Airports Council International. Annual World Airport Traffic Report: 2022 Edition; Airports Council International (ACI): Montréal, QC, Canada, 2022. [Google Scholar]
  88. Syukri, A.; Nurmandi, A.; Muallidin, I.; Kurniawan, D.; Loilatu, M.J. Toward an Agile and Transformational Government, Through the Development of the Tangerang LIVE Application (Case Study of Tangerang City, Indonesia). In Proceedings of the Seventh International Congress on Information and Communication Technology, London, UK, 21–24 February 2023; Springer: Singapore, 2023; Volume 464, pp. 343–352. [Google Scholar] [CrossRef]
  89. Ramadhan, R.; Arifianti, R.; Riswanda, R. Implementasi e-government di Kota Tangerang menjadi smart city (Studi kasus aplikasi Tangerang Live). Responsive 2019, 2, 140–156. [Google Scholar] [CrossRef]
  90. Sarasati, R.; Madyatmadja, E.D. Evaluation of e-government LAKSA services to improve the interest of use of applications using Technology Acceptance Model (TAM). IOP Conf. Ser. Earth Environ. Sci. 2020, 426, 012165. [Google Scholar] [CrossRef]
  91. Madyatmadja, E.D.; Olivia, J.; Sunaryo, R.F. Priority Analysis of Community Complaints through E-Government Based on Social Media. Int. J. Recent Technol. Eng. 2019, 8, 3345–3349. [Google Scholar] [CrossRef]
  92. Putri, T.T.A.; Warra, H.S.; Sitepu, I.Y.; Sihombing, M.; Silvi, S. Analysis and detection of hoax contents in Indonesian news based on Machine Learning. J. Inform. Pelita Nusant. 2019, 4, 19–26. [Google Scholar]
  93. Sulistyo, M.E.; Saptono, R.; Asshidiq, A. Penilaian ujian bertipe essay menggunakan metode text similarity. Telematika 2015, 12, 146–158. [Google Scholar] [CrossRef]
  94. Yusliani, N.; Primartha, R.; Marieska, M.D. Multiprocessing Stemming: A Case Study of Indonesian Stemmi. Int. J. Comput. Appl. 2019, 182, 15–19. [Google Scholar] [CrossRef]
  95. Lohr, S.L. Sampling: Design and Analysis; CRC Press: Boca Raton, FL, USA, 2022. [Google Scholar] [CrossRef]
  96. Lee, G.; Kwak, Y.H. An Open Government Maturity Model for social media-based public engagement. Gov. Inf. Q. 2012, 29, 492–503. [Google Scholar] [CrossRef]
  97. Trstenjak, B.; Mikac, S.; Donko, D. KNN with TF-IDF based Framework for Text Categorization. Procedia Eng. 2014, 69, 1356–1364. [Google Scholar] [CrossRef]
  98. Zhang, J.; Otomo, T.; Li, L.; Nakajima, S. Cyberbullying Detection on Twitter using Multiple Textual Features. In Proceedings of the 2019 IEEE 10th International Conference on Awareness Science and Technology, Morioka, Japan, 23–25 October 2019; pp. 1–6. [Google Scholar] [CrossRef]
  99. Santra, A.K.; Christy, C.J. Genetic Algorithm and Confusion Matrix for Document Clustering. Int. J. Comput. Sci. Issues 2012, 9, 322–328. [Google Scholar]
  100. Nurhasanah, N.; Sumarly, D.E.; Pratama, J.; Heng, I.T.K.; Irwansyah, E. Comparing SVM and Naïve Bayes Classifier for Fake News Detection. Eng. Math. Comput. Sci. EMACS J. 2022, 4, 103–107. [Google Scholar] [CrossRef]
  101. Cheng, M.-Y.; Kusoemo, D.; Gosno, R.A. Text mining-based construction site accident classification using hybrid supervised machine learning. Autom. Constr. 2020, 118, 103265. [Google Scholar] [CrossRef]
  102. Nindito, H.; Madyatmadja, E.D.; Sano, A.V.D. Evaluation of E-Government Services Based on Social Media Using Structural Equation Modeling. In Proceedings of the 2019 International Conference on Information Management and Technology (ICIMTech), Jakarta/Bali, Indonesia, 19–20 August 2019; Volume 1, pp. 78–81. [Google Scholar] [CrossRef]
  103. Madyatmadja, E.D.; Nindito, H.; Sano, A.V.D.; Sianipar, C.P.M.; Sembiring, D.J.M. Data visualization of priority region based on community complaints in government. ICIC Express Lett. Part B Appl. 2021, 12, 957–964. [Google Scholar] [CrossRef]
  104. Almira, P.D.; Lipu, B.G.; Pradipta, A.W.; Rachmawati, R. Utilization of Human Resources Management Information System (SIMPEG) Application to Support E-Government in the BKPP at Palangka Raya Municipality. In Proceedings of the 15th International Asian Urbanization Conference, Ho Chi Minh City, Vietnam, 27–30 November 2019; pp. 355–366. [Google Scholar] [CrossRef]
  105. Nyansiro, J.B.; Mtebe, J.S.; Kissaka, M.M. E-Government Information Systems (IS) Project Failure in Developing Countries: Lessons from the Literature. Afr. J. Inf. Commun. 2021, 28, 1–29. [Google Scholar] [CrossRef]
  106. Bakunzibake, P.; Klein, G.O.; Islam, S.M. E-Government Implementation Process in Rwanda: Exploring Changes in a Sociotechnical Perspective. Bus. Syst. Res. J. 2019, 10, 53–73. [Google Scholar] [CrossRef]
  107. Sunindyo, W.; Hendradjaya, B.; Saptawati, G.A.P.; Widagdo, T.E. Document Tracking Technology to Support Indonesian Local E-Governments. In Information and Communication Technology, Proceedings of the Second IFIP TC5/8 International Conference, ICT-EurAsia 2014, Bali, Indonesia, 14–17 April 2014, Proceedings; Lecture Notes in Computer Science; Springer: Berlin/Heidelberg, Germany, 2014; pp. 338–347. [Google Scholar] [CrossRef]
  108. Goel, S.; Dwivedi, R.; Sherry, A.M. Critical Factors for Successful Implementation of E-governance Programs: A Case Study of HUDA. Glob. J. Flex. Syst. Manag. 2012, 13, 233–244. [Google Scholar] [CrossRef]
  109. Awajan, A.; Alazab, M.; Alhyari, S.; Qiqieh, I.; Wedyan, M. Machine learning techniques for automated policy violation reporting. Int. J. Internet Technol. Secur. Trans. 2022, 12, 387–405. [Google Scholar] [CrossRef]
  110. Yenkar, P.; Sawarkar, S.D. Machine Intelligence and Smart Systems, Proceedings of MISS 2021. In Machine Intelligence and Smart Systems; Springer: Singapore, 2022; pp. 65–74. [Google Scholar] [CrossRef]
  111. Palma, I.; Ladeira, M.; Reis, A.C.B. Machine Learning Predictive Model for the Passive Transparency at the Brazilian Ministry of Mines and Energy. In Proceedings of the DG.O2021: The 22nd Annual International Conference on Digital Government Research, Omaha, NE, USA, 9–11 June 2021; pp. 76–81. [Google Scholar] [CrossRef]
  112. Devos, O.; Downey, G.; Duponchel, L. Simultaneous data pre-processing and SVM classification model selection based on a parallel genetic algorithm applied to spectroscopic data of olive oils. Food Chem. 2014, 148, 124–130. [Google Scholar] [CrossRef]
  113. Ketu, S.; Mishra, P.K. Scalable kernel-based SVM classification algorithm on imbalance air quality data for proficient healthcare. Complex Intell. Syst. 2021, 7, 2597–2615. [Google Scholar] [CrossRef]
  114. Yan, X.; Jia, M. A novel optimized SVM classification algorithm with multi-domain feature and its application to fault diagnosis of rolling bearing. Neurocomputing 2018, 313, 47–64. [Google Scholar] [CrossRef]
  115. Sano, Y.; Yamaguchi, K.; Mine, T. Automatic Classification of Complaint Reports about City Park. Inf. Eng. Express 2015, 1, 119–130. [Google Scholar] [CrossRef]
  116. Tjandra, S.; Warsito, A.A.P.; Sugiono, J.P. Determining Citizen Complaints to the Appropriate Government Departments Using KNN Algorithm. In Proceedings of the 2015 13th International Conference on ICT and Knowledge Engineering (ICT & Knowledge Engineering 2015, Bangkok, Thailand, 18–20 November 2015; pp. 1–4. [Google Scholar] [CrossRef]
  117. Reyzin, L.; Schapire, R.E. How boosting the margin can also boost classifier complexity. In Proceedings of the 23rd International Conference on Machine Learning—ICML ’06, Pittsburgh, PA, USA, 25–29 June 2006; pp. 753–760. [Google Scholar] [CrossRef]
  118. Zhang, Z. Introduction to machine learning: K-nearest neighbors. Ann. Transl. Med. 2016, 4, 218. [Google Scholar] [CrossRef] [PubMed]
  119. Jalal, N.; Mehmood, A.; Choi, G.S.; Ashraf, I. A novel improved random forest for text classification using feature ranking and optimal number of trees. J. King Saud Univ. Comput. Inf. Sci. 2022, 34, 2733–2742. [Google Scholar] [CrossRef]
  120. Oshiro, T.M.; Perez, P.S.; Baranauskas, J.A. How Many Trees in a Random Forest? In Machine Learning and Data Mining in Pattern Recognition, 8th International Conference, MLDM 2012, Berlin, Germany, 13–20 July 2012, Proceedings; Springer: Berlin/Heidelberg, Germany, 2012; Volume 7376, pp. 154–168. [Google Scholar] [CrossRef]
  121. Rodriguez-Galiano, V.F.; Ghimire, B.; Rogan, J.; Chica-Olmo, M.; Rigol-Sanchez, J.P. An assessment of the effectiveness of a random forest classifier for land-cover classification. ISPRS J. Photogramm. Remote Sens. 2012, 67, 93–104. [Google Scholar] [CrossRef]
  122. Belgiu, M.; Drăguţ, L. Random forest in remote sensing: A review of applications and future directions. ISPRS J. Photogramm. Remote Sens. 2016, 114, 24–31. [Google Scholar] [CrossRef]
  123. Singh, B.; Sihag, P.; Singh, K. Modelling of impact of water quality on infiltration rate of soil by random forest regression. Model. Earth Syst. Environ. 2017, 3, 999–1004. [Google Scholar] [CrossRef]
  124. Raghavendra, S.; Deka, P.C. Support vector machine applications in the field of hydrology: A review. Appl. Soft Comput. 2014, 19, 372–386. [Google Scholar] [CrossRef]
  125. Song, H.; Ding, Z.; Guo, C.; Li, Z.; Xia, H. Research on Combination Kernel Function of Support Vector Machine. In Proceedings of the 2008 International Conference on Computer Science and Software Engineering, Wuhan, China, 12–14 December 2008; Volume 1, pp. 838–841. [Google Scholar] [CrossRef]
  126. Mahajan, S.; Raina, A.; Gao, X.-Z.; Pandit, A.K. Plant Recognition Using Morphological Feature Extraction and Transfer Learning over SVM and AdaBoost. Symmetry 2021, 13, 356. [Google Scholar] [CrossRef]
  127. Wang, X.; Wu, C.; Zheng, C.; Wang, W. Improved Algorithm for Adaboost with SVM Base Classifiers. In Proceedings of the 2006 5th IEEE International Conference on Cognitive Informatics, Beijing, China, 17–19 July 2006; Volume 2, pp. 948–952. [Google Scholar] [CrossRef]
  128. Kale, S.S.; Patil, P.S. A Machine Learning Approach to Predict Crop Yield and Success Rate. In Proceedings of the 2019 IEEE Pune Section International Conference (PuneCon), Pune, India, 18–20 December 2019; pp. 1–5. [Google Scholar] [CrossRef]
  129. Bzdok, D.; Krzywinski, M.; Altman, N. Machine learning: A primer. Nat. Methods 2017, 14, 1119–1120. [Google Scholar] [CrossRef]
Figure 1. Location of Tangerang City (iii) in Banten Province (ii), Indonesia (i).
Informatics 10 00084 g001
Figure 2. Graphical user interface of the Tangerang LIVE super app (left) and LAKSA app (right). Screenshots taken on 8 March 2023.
Informatics 10 00084 g002
Figure 3. Research design.
Informatics 10 00084 g003
Figure 4. Example results of the text vectorization using TF–IDF.
Informatics 10 00084 g004
Table 1. Dataset divided into four simplified categories, with uncategorized data removed.
DatasetActual Categories
DisasterInfrastructureSocialNation-Related Affairs
Datapoints26524033353300
Total6321
Table 2. An example of text preprocessing unit.
Before Text PreprocessingAfter Text Preprocessing
Genangan di Jl. Raden Fatah, Parung, Serab,
Ciledug, Kota Tangerang mengakibatkan
kemacetan dan jalan berlubang, mohon kepada
dinas terkait untuk menindak lanjuti agar aktivitas warga tidak terganggu. Terima kasih.
genang raden fatah parung macet lubang
tindak lanjut aktivitas warga ganggu
Table 3. Data splitting into the training and testing datasets.
Split DatasetsActual Categories
DisasterInfrastructureSocialNation-Related Affairs
Training DatasetDatapoints21219222682240
Total5056
Testing DatasetDatapoints5348167160
Total1265
Table 5. Confusion matrix for the Random Forest algorithm.
Actual CategoryDisasterInfrastructureSocialNation-Related Affairs
Predicted Category
Disaster23010
Infrastructure21437592
Social94460831
Nation-Related Affairs00327
Accuracy86.6%
Table 6. Confusion matrix for the Support Vector Machine algorithm with a linear kernel.
Actual CategoryDisasterInfrastructureSocialNation-Related Affairs
Predicted Category
Disaster31310
Infrastructure14433282
Social84562828
Nation-Related Affairs00430
Accuracy89.2%
Table 7. Confusion matrix for the AdaBoost algorithm (base learner: SVM with a linear kernel).
Actual CategoryDisasterInfrastructureSocialNation-Related Affairs
Predicted Category
Disaster23010
Infrastructure21449602
Social93260729
Nation-Related Affairs00329
Accuracy87.5%
Table 8. Pattern implementation of the kNN algorithm under varying “k” values.
k102030405060708090100
Accuracy (%)58.781.584.885.284.884.483.783.783.783.2
Note: Blue-colored cells indicate the configuration with the highest accuracy.
Table 9. Pattern implementation of the Random Forest algorithm under varying number of trees.
No. of Trees12310203040506070
Accuracy (%)76.076.280.383.885.485.886.086.685.884.5
Note: Blue-colored cells indicate the configuration with the highest accuracy.
Table 10. Pattern implementation of the Support Vector Machine with three separate kernels.
KernelLinearRadial Basis FunctionPolynomialSigmoid
Accuracy (%)89.288.188.688.7
Note: Blue-colored cells indicate the configuration with the highest accuracy.
Table 11. Pattern implementation of the AdaBoost with three separate base learners.
Base LearnerAdaBoost + RFAdaBoost + Decision TreesAdaBoost + SVM (linear)
Accuracy (%)84.973.787.5
Note: Blue-colored cells indicate the configuration with the highest accuracy.
Table 12. Comparison of accuracies between algorithms.
AlgorithmAccuracy (%)
k-Nearest Neighbors85.2
Random Forest86.6
SVM + linear kernel89.2
SVM + radial basis function (RBF) kernel88.1
SVM + polynomial kernel88.6
SVM + sigmoid kernel88.7
AdaBoost + Random Forest (RF)84.9
AdaBoost + Decision Trees73.7
AdaBoost + Support Vector Machine (SVM)87.5
Note: Blue-colored cells indicate the configuration with the highest accuracy.
Table 13. Correct predictions by each algorithm for four actual classification categories.
AlgorithmActual Categories
DisasterInfrastructureSocialNation-Related
Correct%Correct%Correct%Correct%
kNN1732.0843390.0261191.061728.33
Random Forest2343.4043790.8560890.612745.00
SVM3158.4943390.0262893.593050.00
AdaBoost2343.4044993.3560790.462948.33
Average44.34%91.06%91.43%42.92%
Disclaimer/Publisher’s Note: The statements, opinions and data contained in all publications are solely those of the individual author(s) and contributor(s) and not of MDPI and/or the editor(s). MDPI and/or the editor(s) disclaim responsibility for any injury to people or property resulting from any ideas, methods, instructions or products referred to in the content.

