

Imbibition Characteristic of Fractured Tight Sandstone Reservoir

1
School of Petroleum Engineering, Xi’an Shiyou University, Xi’an 710065, China
2
No.4 Drilling Company, Daqing Drilling Engineering Corporation, Songyuan 138000, China
*
Author to whom correspondence should be addressed.
Processes 2022, 10(11), 2189; https://doi.org/10.3390/pr10112189
Submission received: 30 August 2022
/
Revised: 8 October 2022
/
Accepted: 21 October 2022
/
Published: 25 October 2022
(This article belongs to the Special Issue New Challenges in Advanced Process Control in Petroleum Engineering)
Abstract
:“Fracture network stimulation + imbibition replacement” is a new attempt to effectively develop tight sandstone reservoirs, and the fractures provide conditions for fluid imbibition replacement. On the basis of nuclear magnetic resonance and pseudo-color processing technology, combined with the imbibition experiments, this paper studies the imbibition process of fractured tight sandstone reservoirs, clarifies the effect of each level of pore-throat on imbibition, and realizes the visualization of the imbibition process. The results show that, in fractured tight sandstone reservoirs, the fluid displacement occurs in fractures first, followed by pore-throat. Most of the imbibition recovery is contributed by the macropore, the contribution of the mesopore to imbibition recovery is very weak, and the contributions of the micropore and the pinhole are even less. In the process of imbibition, capillary force and gravitational force are key parameters controlling fluid flow in pores and fractures. The replacement of fluid normally takes place in the early stage of imbibition, especially on the first day of imbibition, then the imbibition rate gradually decreases and finally tends to be stable.
1. Introduction
When the overburden matrix permeability of the sandstone reservoir is less than or equal to 0.1 × 10⁻³ μm2 (the gas permeability is less than 1 × 10⁻³ μm2), it is called a tight sandstone reservoir with low production capacity [1,2]. “Fracture network stimulation + imbibition replacement” is a widely used development method for tight sandstone reservoirs, and the development of natural fractures provides conditions for fluid imbibition replacement [3,4,5]. Currently, it is still a challenge to show the role of fractures during imbibition in fractured tight sandstone reservoirs [6,7,8,9].
At present, many researchers have contributed large amounts of work in this direction: Du et al. adopted the embedded discrete fracture model to verify the effectiveness of the semi analytical similar solution by comparing the results of grid numerical simulation, and made it clear that imbibition is the main factor controlling fluid flow [10]. Based on nuclear magnetic resonance (NMR) and the mercury intrusion porometer (MIP), Wang et al. conducted an advanced fractal analysis of rocks and concluded that the mesopore is the main contribution to imbibition displacement [11]. By considering the influence of osmotic pressure and production differential pressure, Liu et al. revealed that, in a tight sandstone reservoir, salinity, permeability and boundary conditions significantly influence the self-imbibition rate [12,13,14,15,16]. Qiu et al. proposed an in-situ imbibition NMR experimental method [17]. By recording and analyzing the oil migration image in the whole process, they made it clear that when the permeability of the core is high, the crude oil will migrate upward during the imbibition process, and when the permeability of the core is low, it will show the characteristics of the oil drainage. On the basis of different pore-throat distributions, Xu et al. adopted a new gas transport model to establish the relationship between apparent permeability and porosity [18,19]. Zhang et al. studied the imbibition law of fractured reservoirs and found that the ultimate recovery factor of co-directional imbibition is much higher than that of reverse imbibition by observing the fluid distribution in the cores [20]. Based on NMR technology and fractal theory, Cai et al. conducted in-depth research on the imbibition law of fluid in different types of reservoirs, and proposed that reservoirs’ physical properties have a great impact on imbibition [21,22,23,24]. Gharachelou et al. took advantage of core chips for self-imbibition experiments to study the imbibition law under different pore-throat characteristics [25,26,27]. However, most of the above-mentioned achievements involve qualitative analysis, and this paper studies the imbibition process of fractured tight sandstone reservoirs, clarifies the effect of each level of pore-throat on imbibition, and realizes the visualization of the imbibition process.
2. Materials and Methods
2.1. Sample Preparation
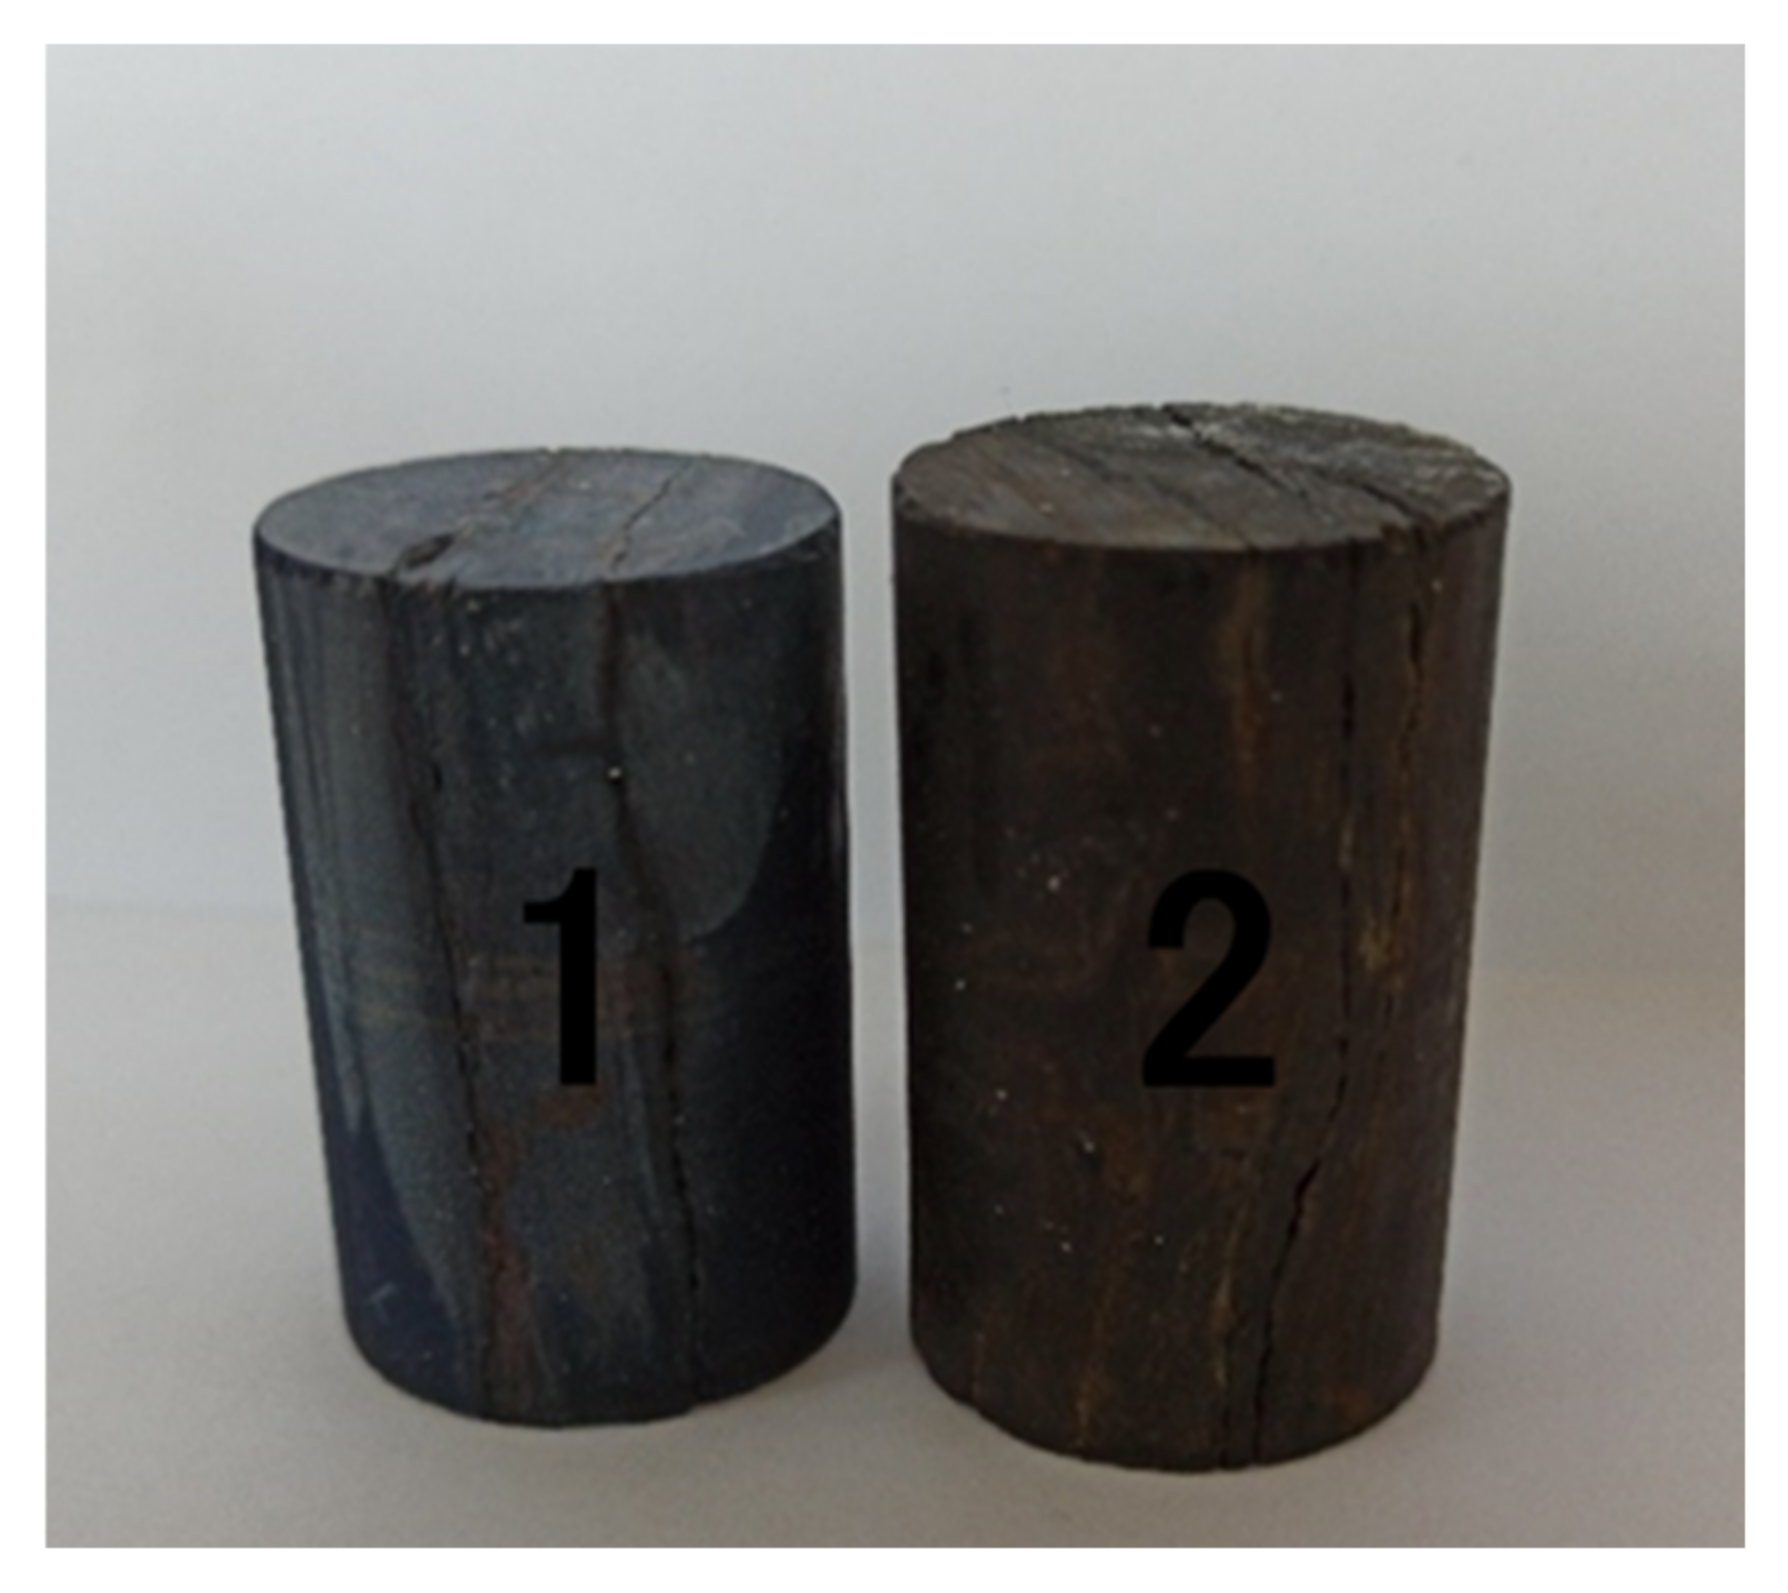
As shown in Figure 1, for the sake of grasping the imbibition law of fractured tight sandstone reservoirs, two fractured tight sandstone cores were selected for experimental research. During the experiment, porosity (φ), gas permeability (Kg), length (L), diameter (d), and dry weight (w) were tested. The test results of core physical properties indicate that natural fractures are well developed which meets the experimental requirements (Table 1).
Figure 2 expresses the two cores observation of cast thin sections (CTS) and scanning electron microscope (SEM). The pore type of core 1 was dominated by residual intergranular pores. The diagenetic authigenic minerals of core 1 were mostly composed of illite and carbonate. Chlorite adsorbs organic matter in a film shape, and the intergranular pores and some feldspar dissolved pores were relatively developed. Core 2 was also composed of residual intergranular pores. The mineral composition consisted of illite, pyrite, and carbonate. The production forms of core 2 were pore filling and cushion. Biotite was ferritized and the content of siliceous minerals increased. The surface of illite adsorbed organic matter and was filled with a small amount of iron calcite and iron dolomite.
The pore-throat radius in Figure 3 indicates that it is not difficult to find that, no matter core 1 or core 2, the peak value of pore-throat distribution is 0~0.1 μm. Core 1 was of poor quality with a pore-throat of less than 0.1 μm accounting for 84.19%, and core 2 with a pore-throat less than 0.1μm accounting for 71.62%.
2.2. Experimental Process
Figure 4 shows the experimental device of the imbibition mass method. The core was hung on the mettler balance through a thin line and soaked in imbibition solution. The mettler balance was connected with the computer to record the change of core quality with time. Because the core was hydrophilic, water entered the core to replace oil during imbibition, and the quality change of the core was the difference of oil–water quality. The imbibition oil recovery could be calculated through the quality change.
With combining imbibition experiments, pseudo-color processing, and NMR technologies, this paper aimed to master the law of self-imbibition in fractured tight sandstone reservoir. The experimental processes were as follows:
- (1)
- Cut the core into small core with 4.00 cm in length and 2.50 cm in diameter. Put it into the 3:1 mixed solution of benzene and alcohol for oil washing treatment. Then, place it in a thermostat at 70 °C for drying, measure the dry weight, and conduct the first NMR scanning of the dry core;
- (2)
- Prepare 500 mL of MnCl2 solution with a concentration of 40% (to shield the water phase signal during the NMR scanning). The core is placed in the pressurized saturation device, and the pressurized saturated MnCl2 solution is carried out for 24 h to complete saturation. After a period of time, the second NMR scanning is performed to record the NMR signals of the core when the MnCl2 solution is fully saturated;
- (3)
- The core is placed in the displacement device, and kerosene (kerosene viscosity is 1.87 mPa·s) is used to displace the core saturated solution (simulation of formation accumulation process). Pressurized and stood still, the core is completely saturated with fluid. After the fluid discharge is stable, the third nuclear magnetic scanning is performed, and the nuclear magnetic signals of the core after saturated with kerosene are recorded;
- (4)
- The core saturated with kerosene is vertically suspended in imbibition solution. The core is taken out for NMR scanning after 1, 3, 5 and 7 days of imbibition respectively, and NMR signals at different imbibition time points are recorded;
- (5)
- Deal with and analyze the NMR data, and process the images of core 1.
3. Results
3.1. Core 1
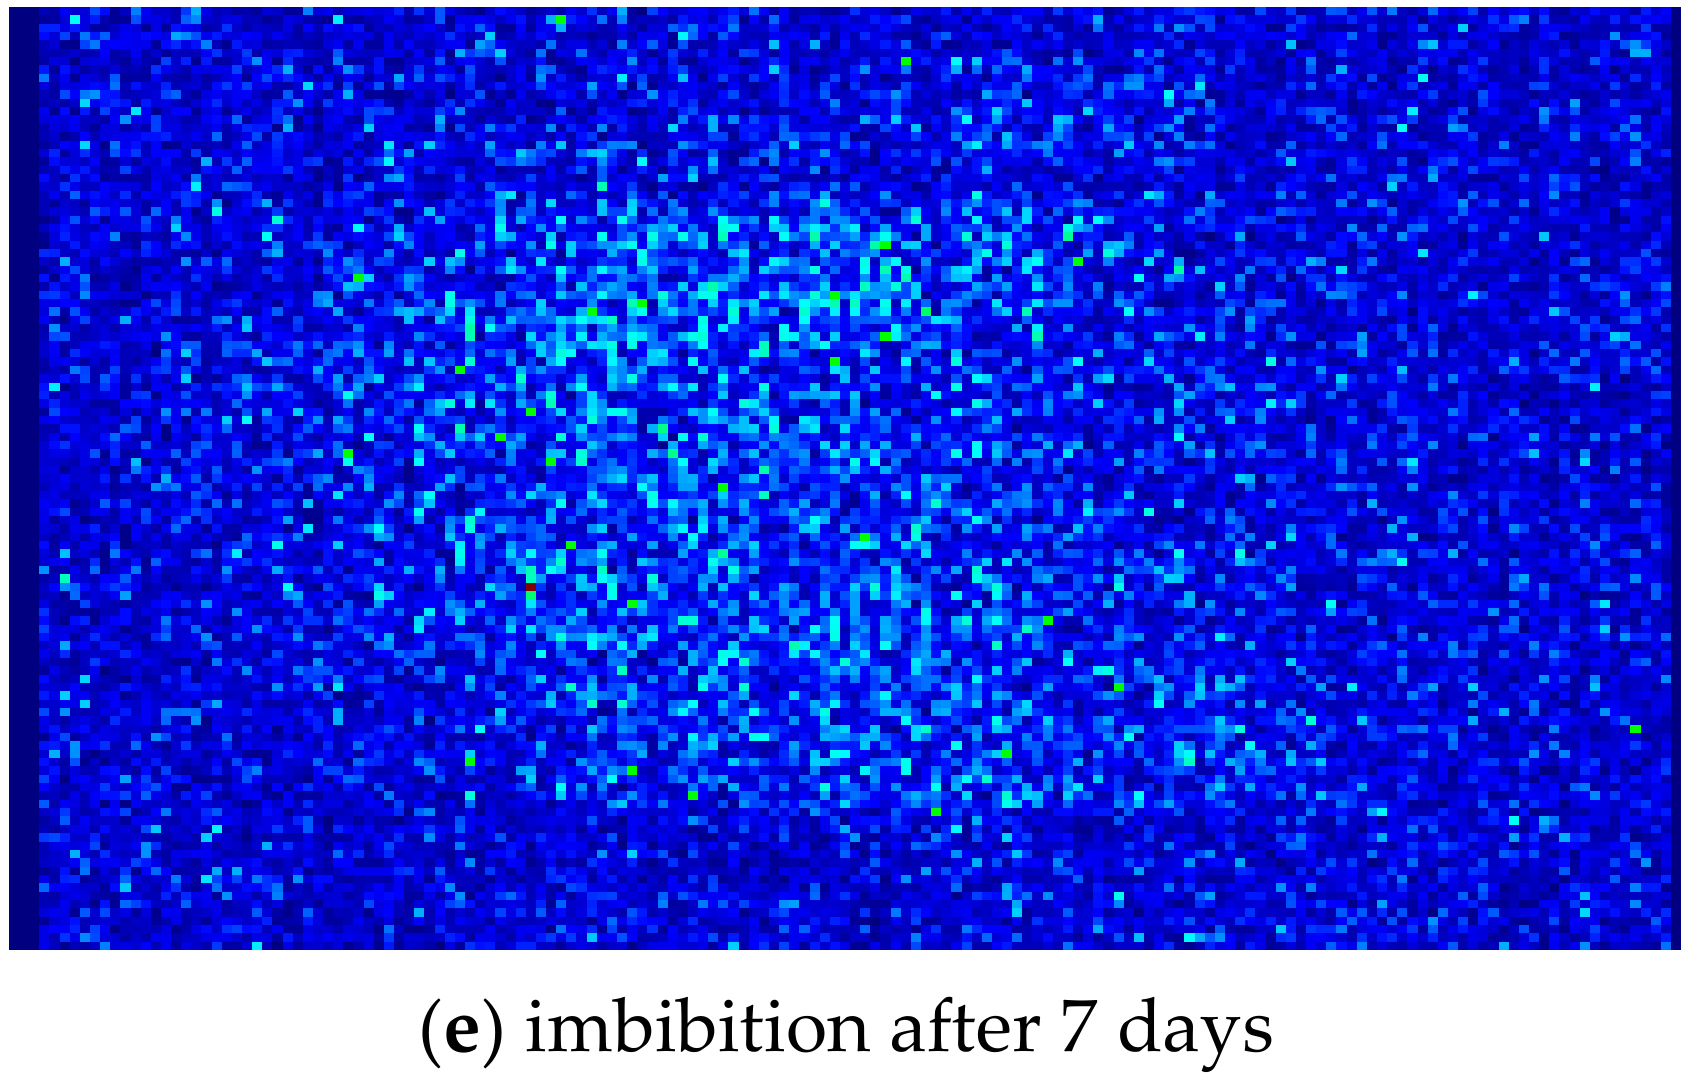
Figure 5a–e respectively show the pseudo-color processing images of core 1 after displacement-saturated oil and 1, 3, 5, and 7 days of imbibition. The fluorescence indicates that the region occupies the oil phase, and the deeper the fluorescence, the higher the oil phase content in the region. As can be seen from the figures, after the core is saturated with kerosene, kerosene firstly occupies the fractures with strong conductivity. As shown in Figure 5a, there are two significant fluorescent bands. With the increase of time, the fluorescence intensity of the core slowly decreases, indicating that there is a significant fluid replacement between the core and the MnCl2 imbibition solution in the beaker, especially at the fracture position. After 1 day of imbibition, the fluorescence intensity of the two prominent fluorescent bands decreases significantly, which indicates that the kerosene in the fractures is first replaced by the MnCl2 imbibition solution.
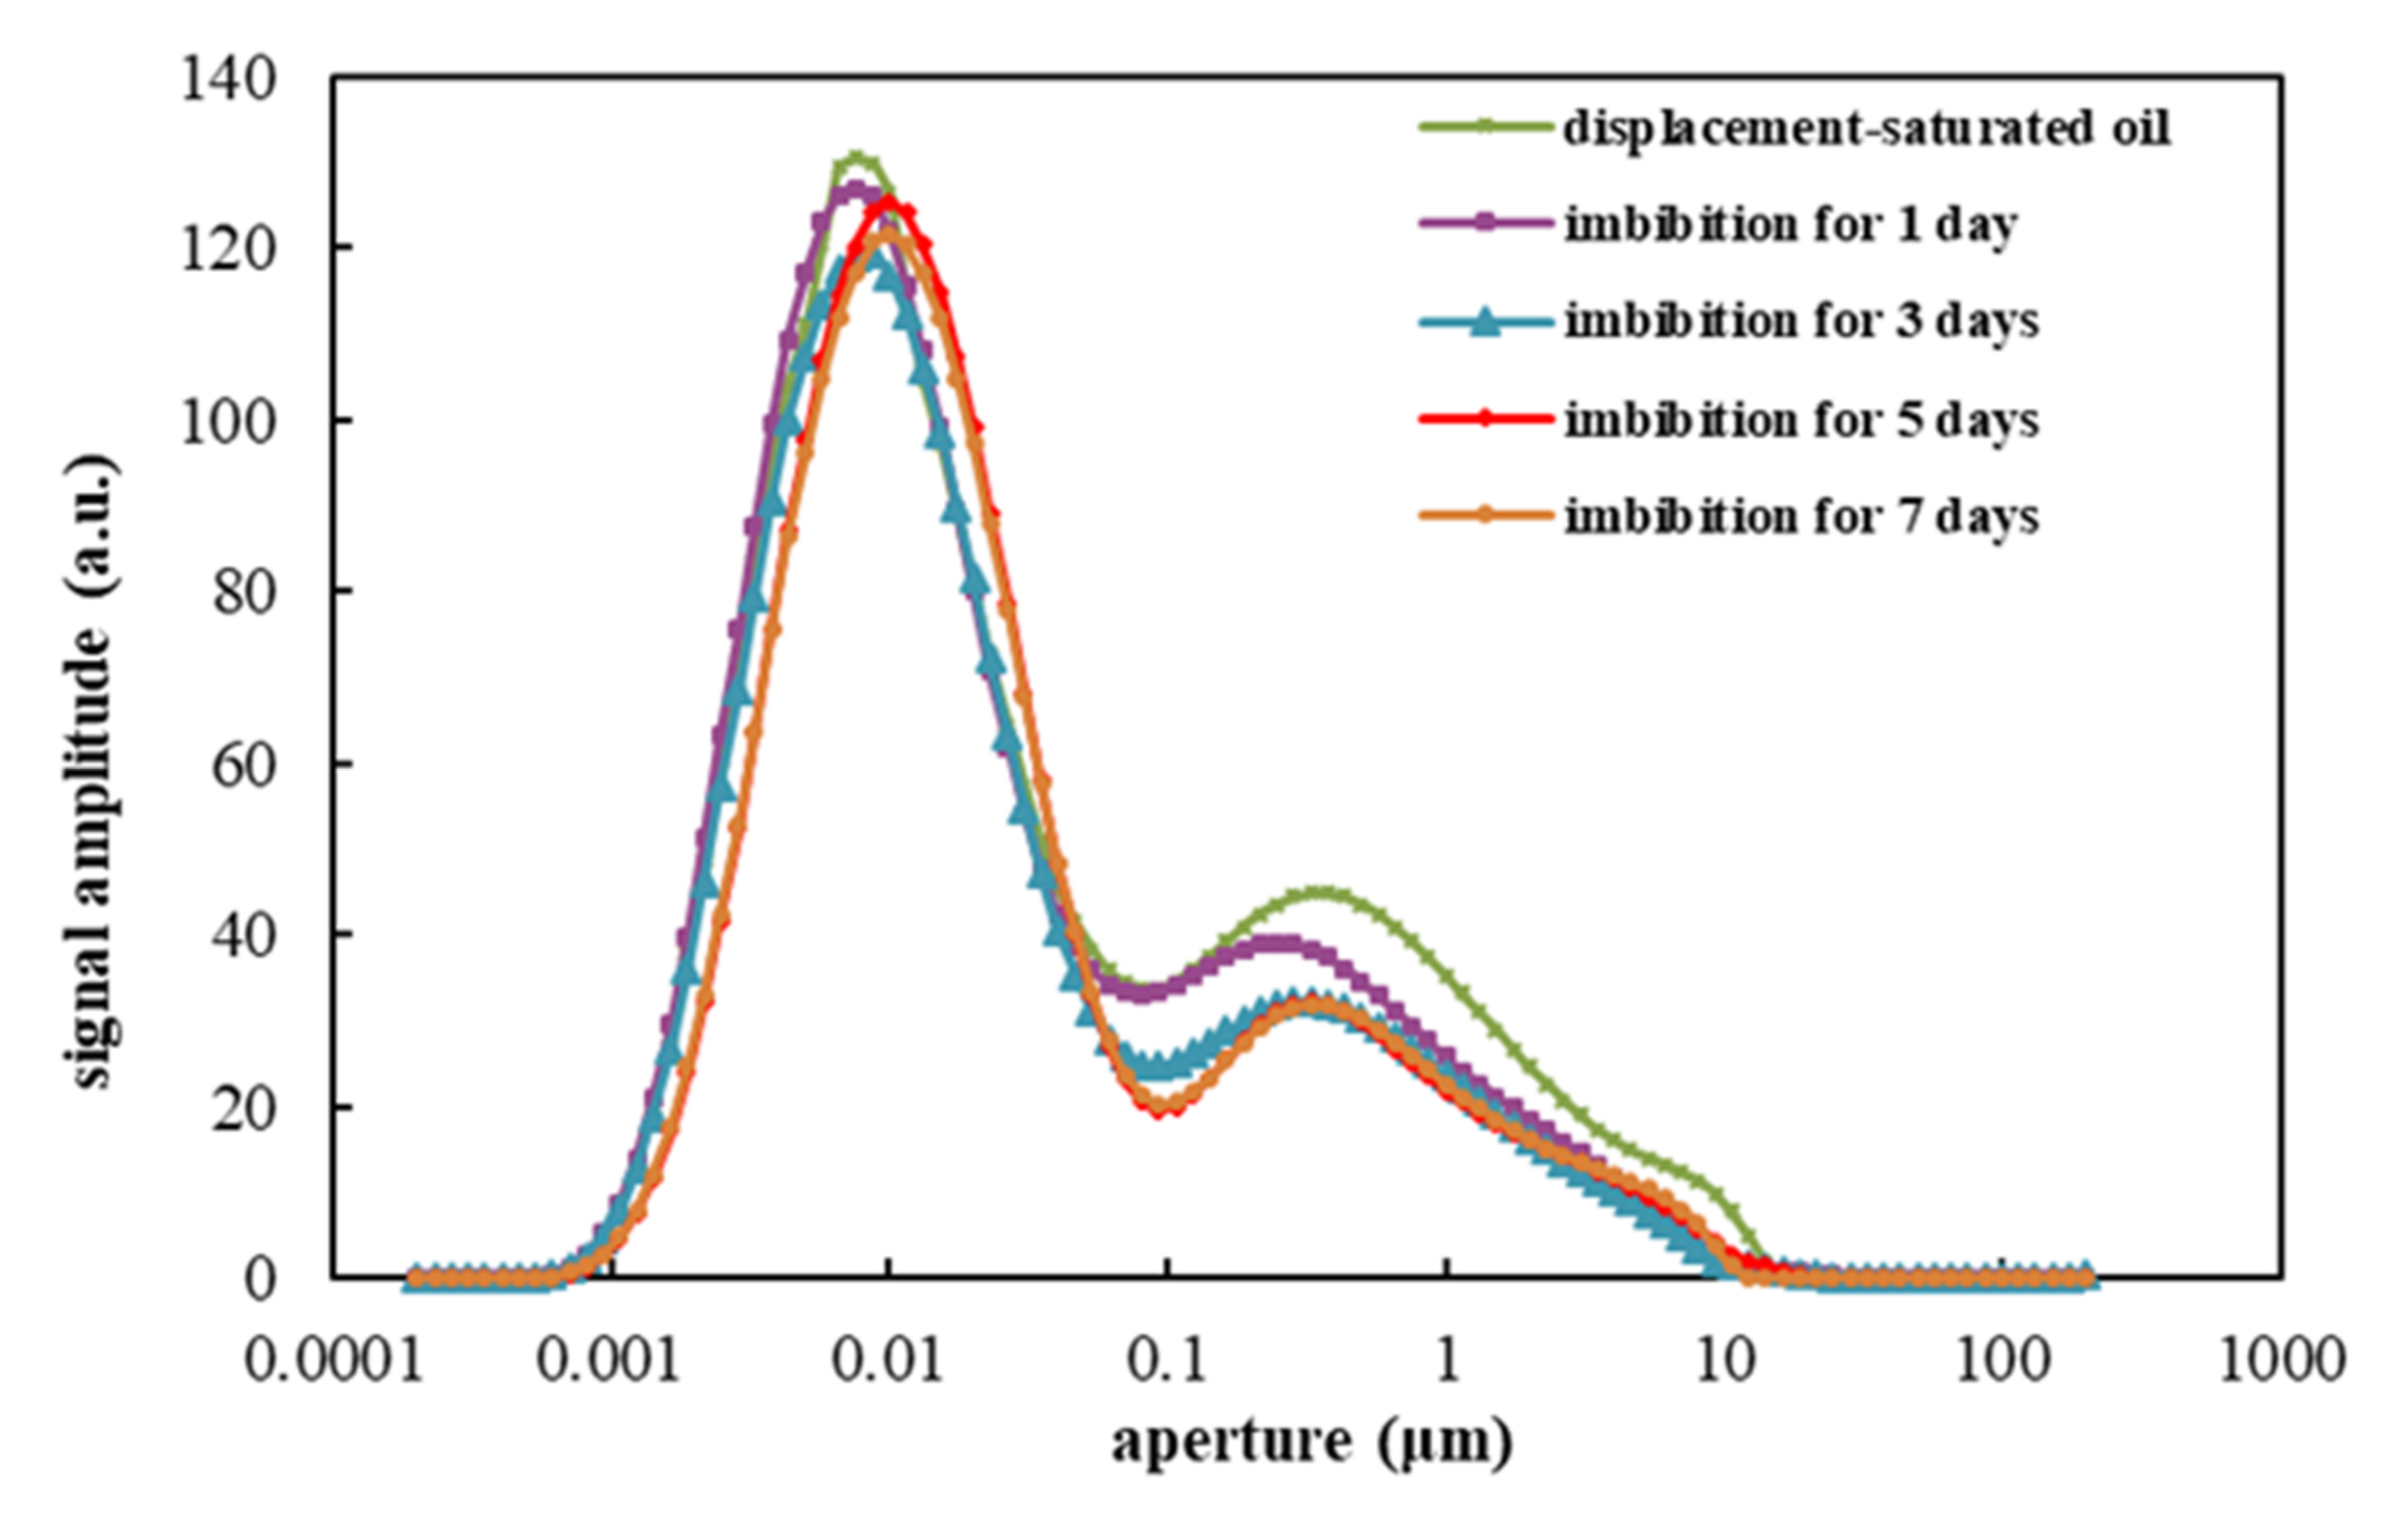
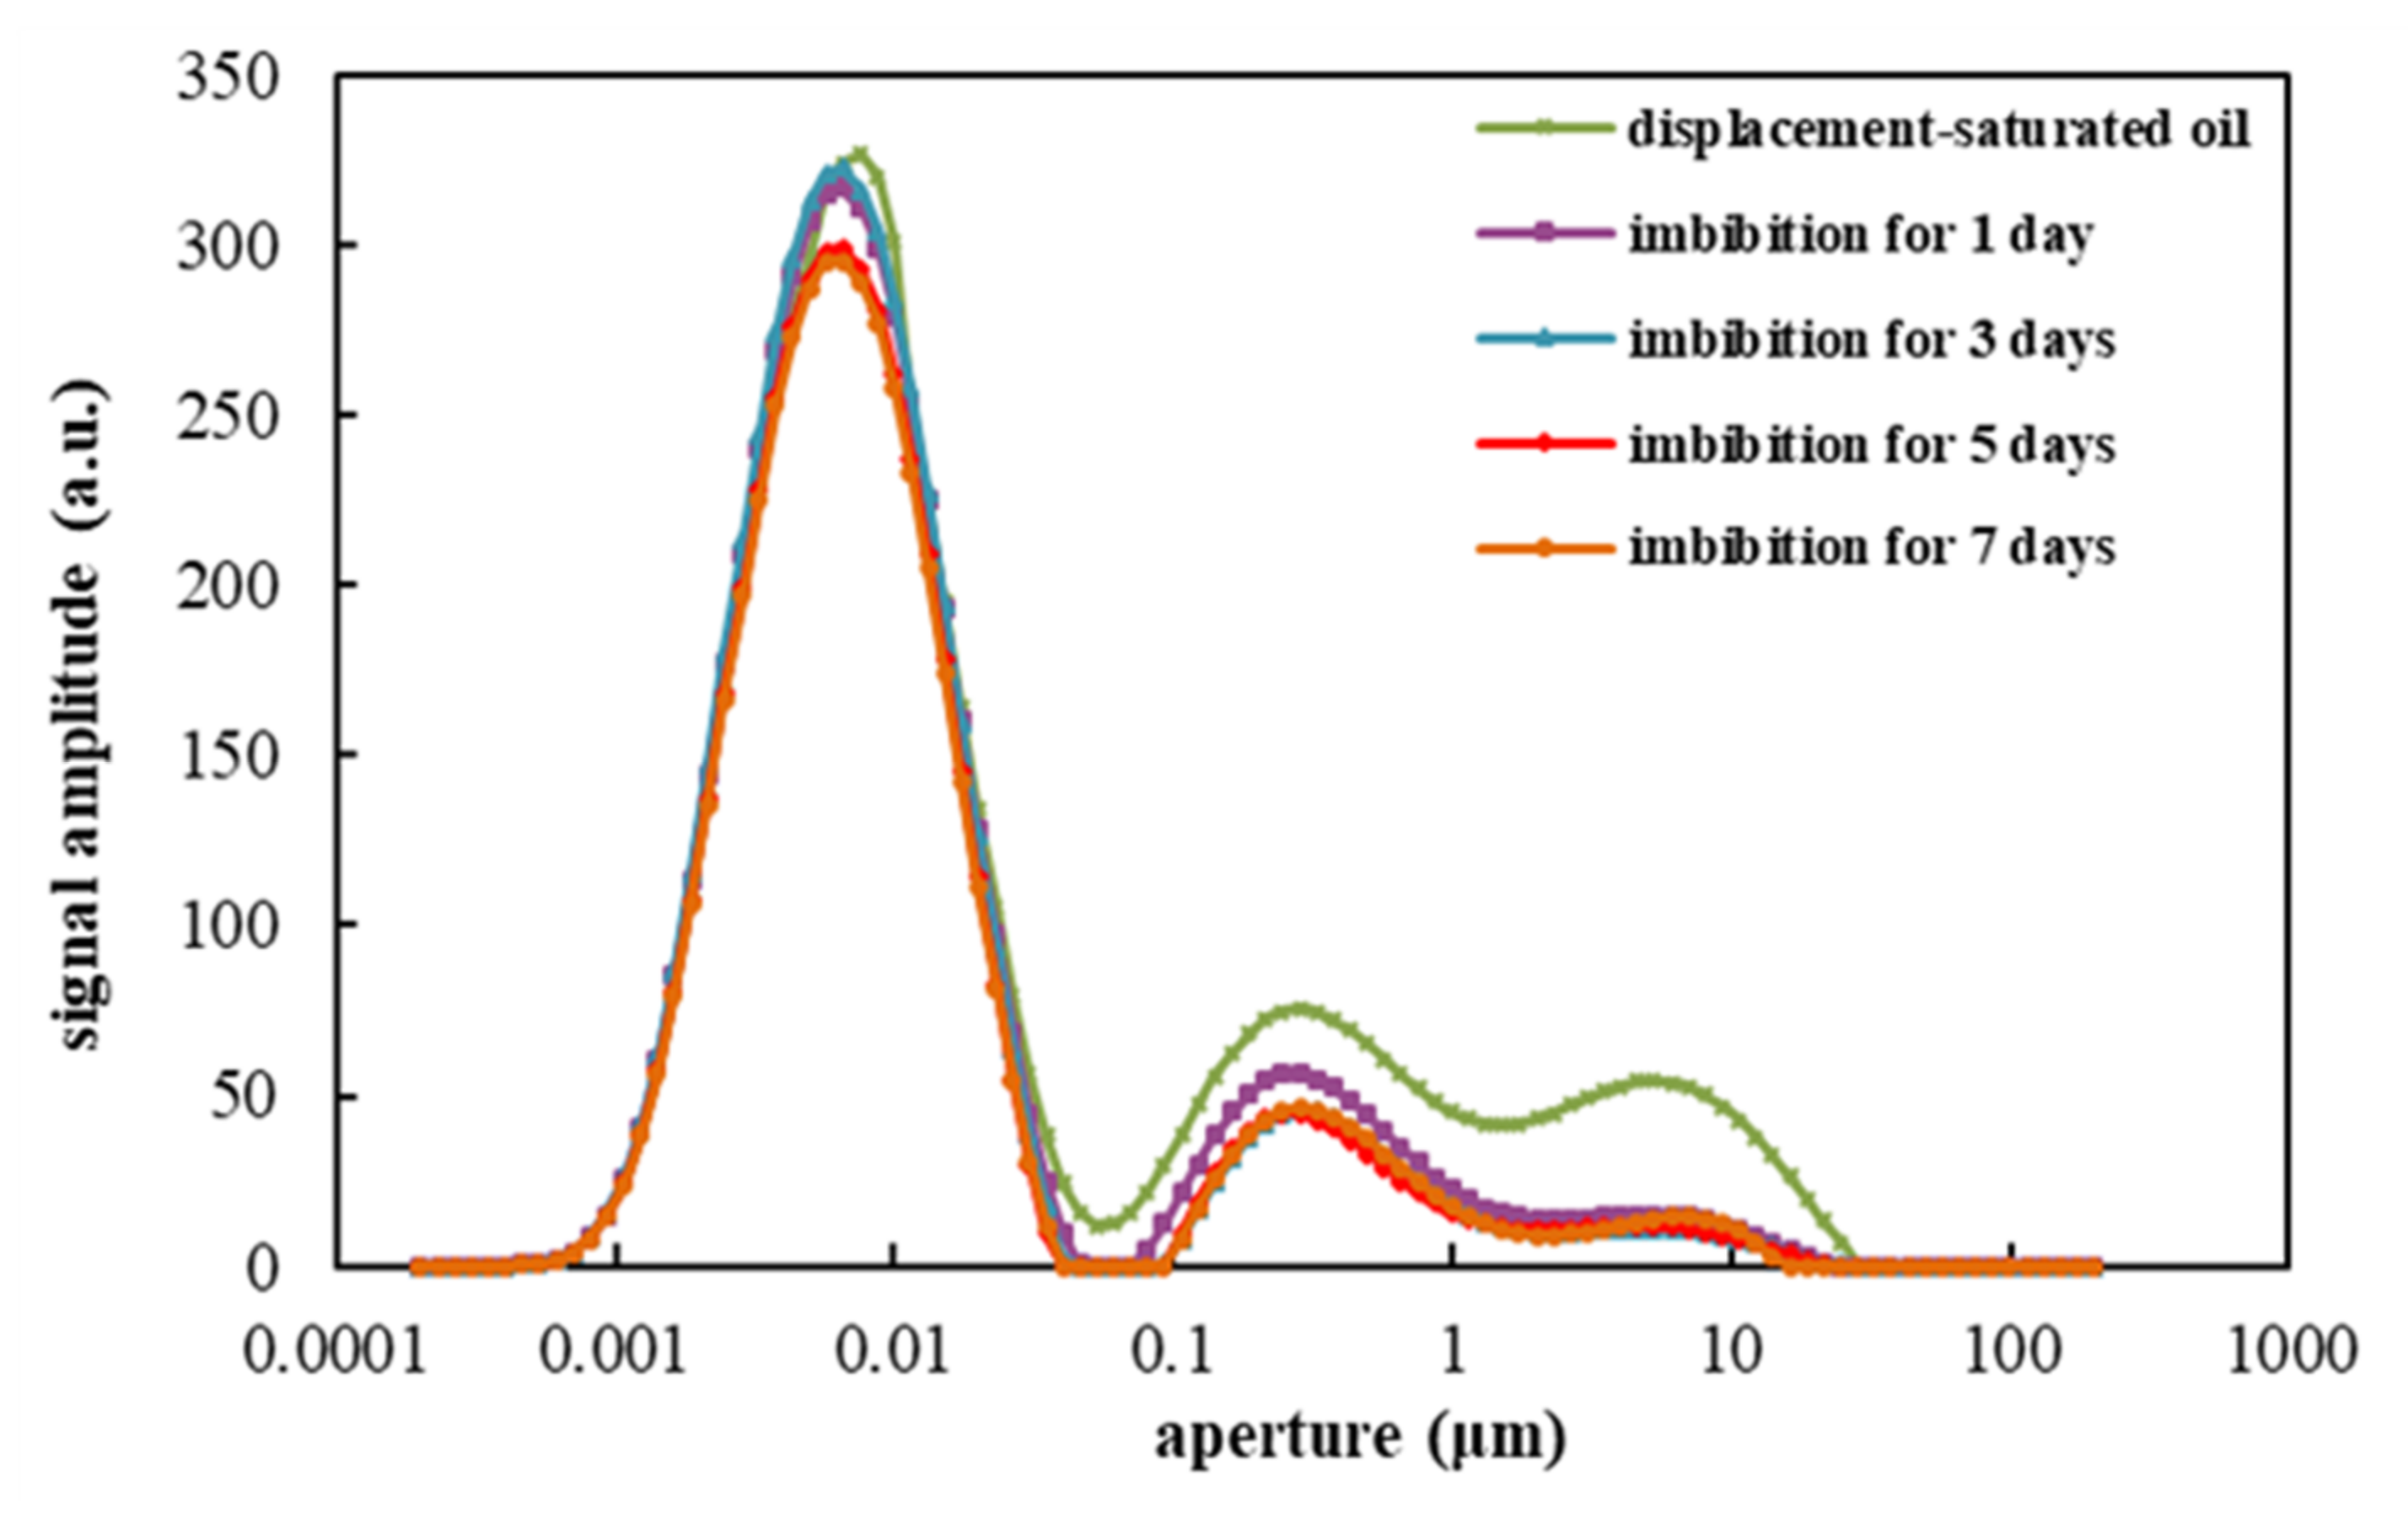
Figure 6 respectively reveals the T2 spectrum characteristics after displacement, and 1, 3, 5, and 7 days of imbibition. We notice that the fluid replacement of core 1 mostly takes place in the 0.02~14 μm pore-throat. Fluid imbibition and replacement in core 1 are significant in the first three days, and are relatively impaired in the following 4 days, which shows that the replacement primarily occurs in fractures of tight sandstone reservoirs. The fracture position is the main oil–water displacement position, which corresponds to the pseudo color images one by one. The peak value of the 0.02~14 μm pore-throat deviates slightly to the left with fluid replacement. It shows that the water phase enters from the large pore-throat, and displaces the oil phase to the small pore-throat. That is to say, the fluid replacement in the fracture is caused more by gravity differentiation. There is also a small amount of oil–water replacement in the pore-throat of less than 0.02 μm, and the peak value of the pore-throat deviates slightly to the right after 4 days of imbibition. This indicates that the water phase enters from the small pore-throat and displaces the oil phase to the larger pore-throat, which is an obvious feature of imbibition.
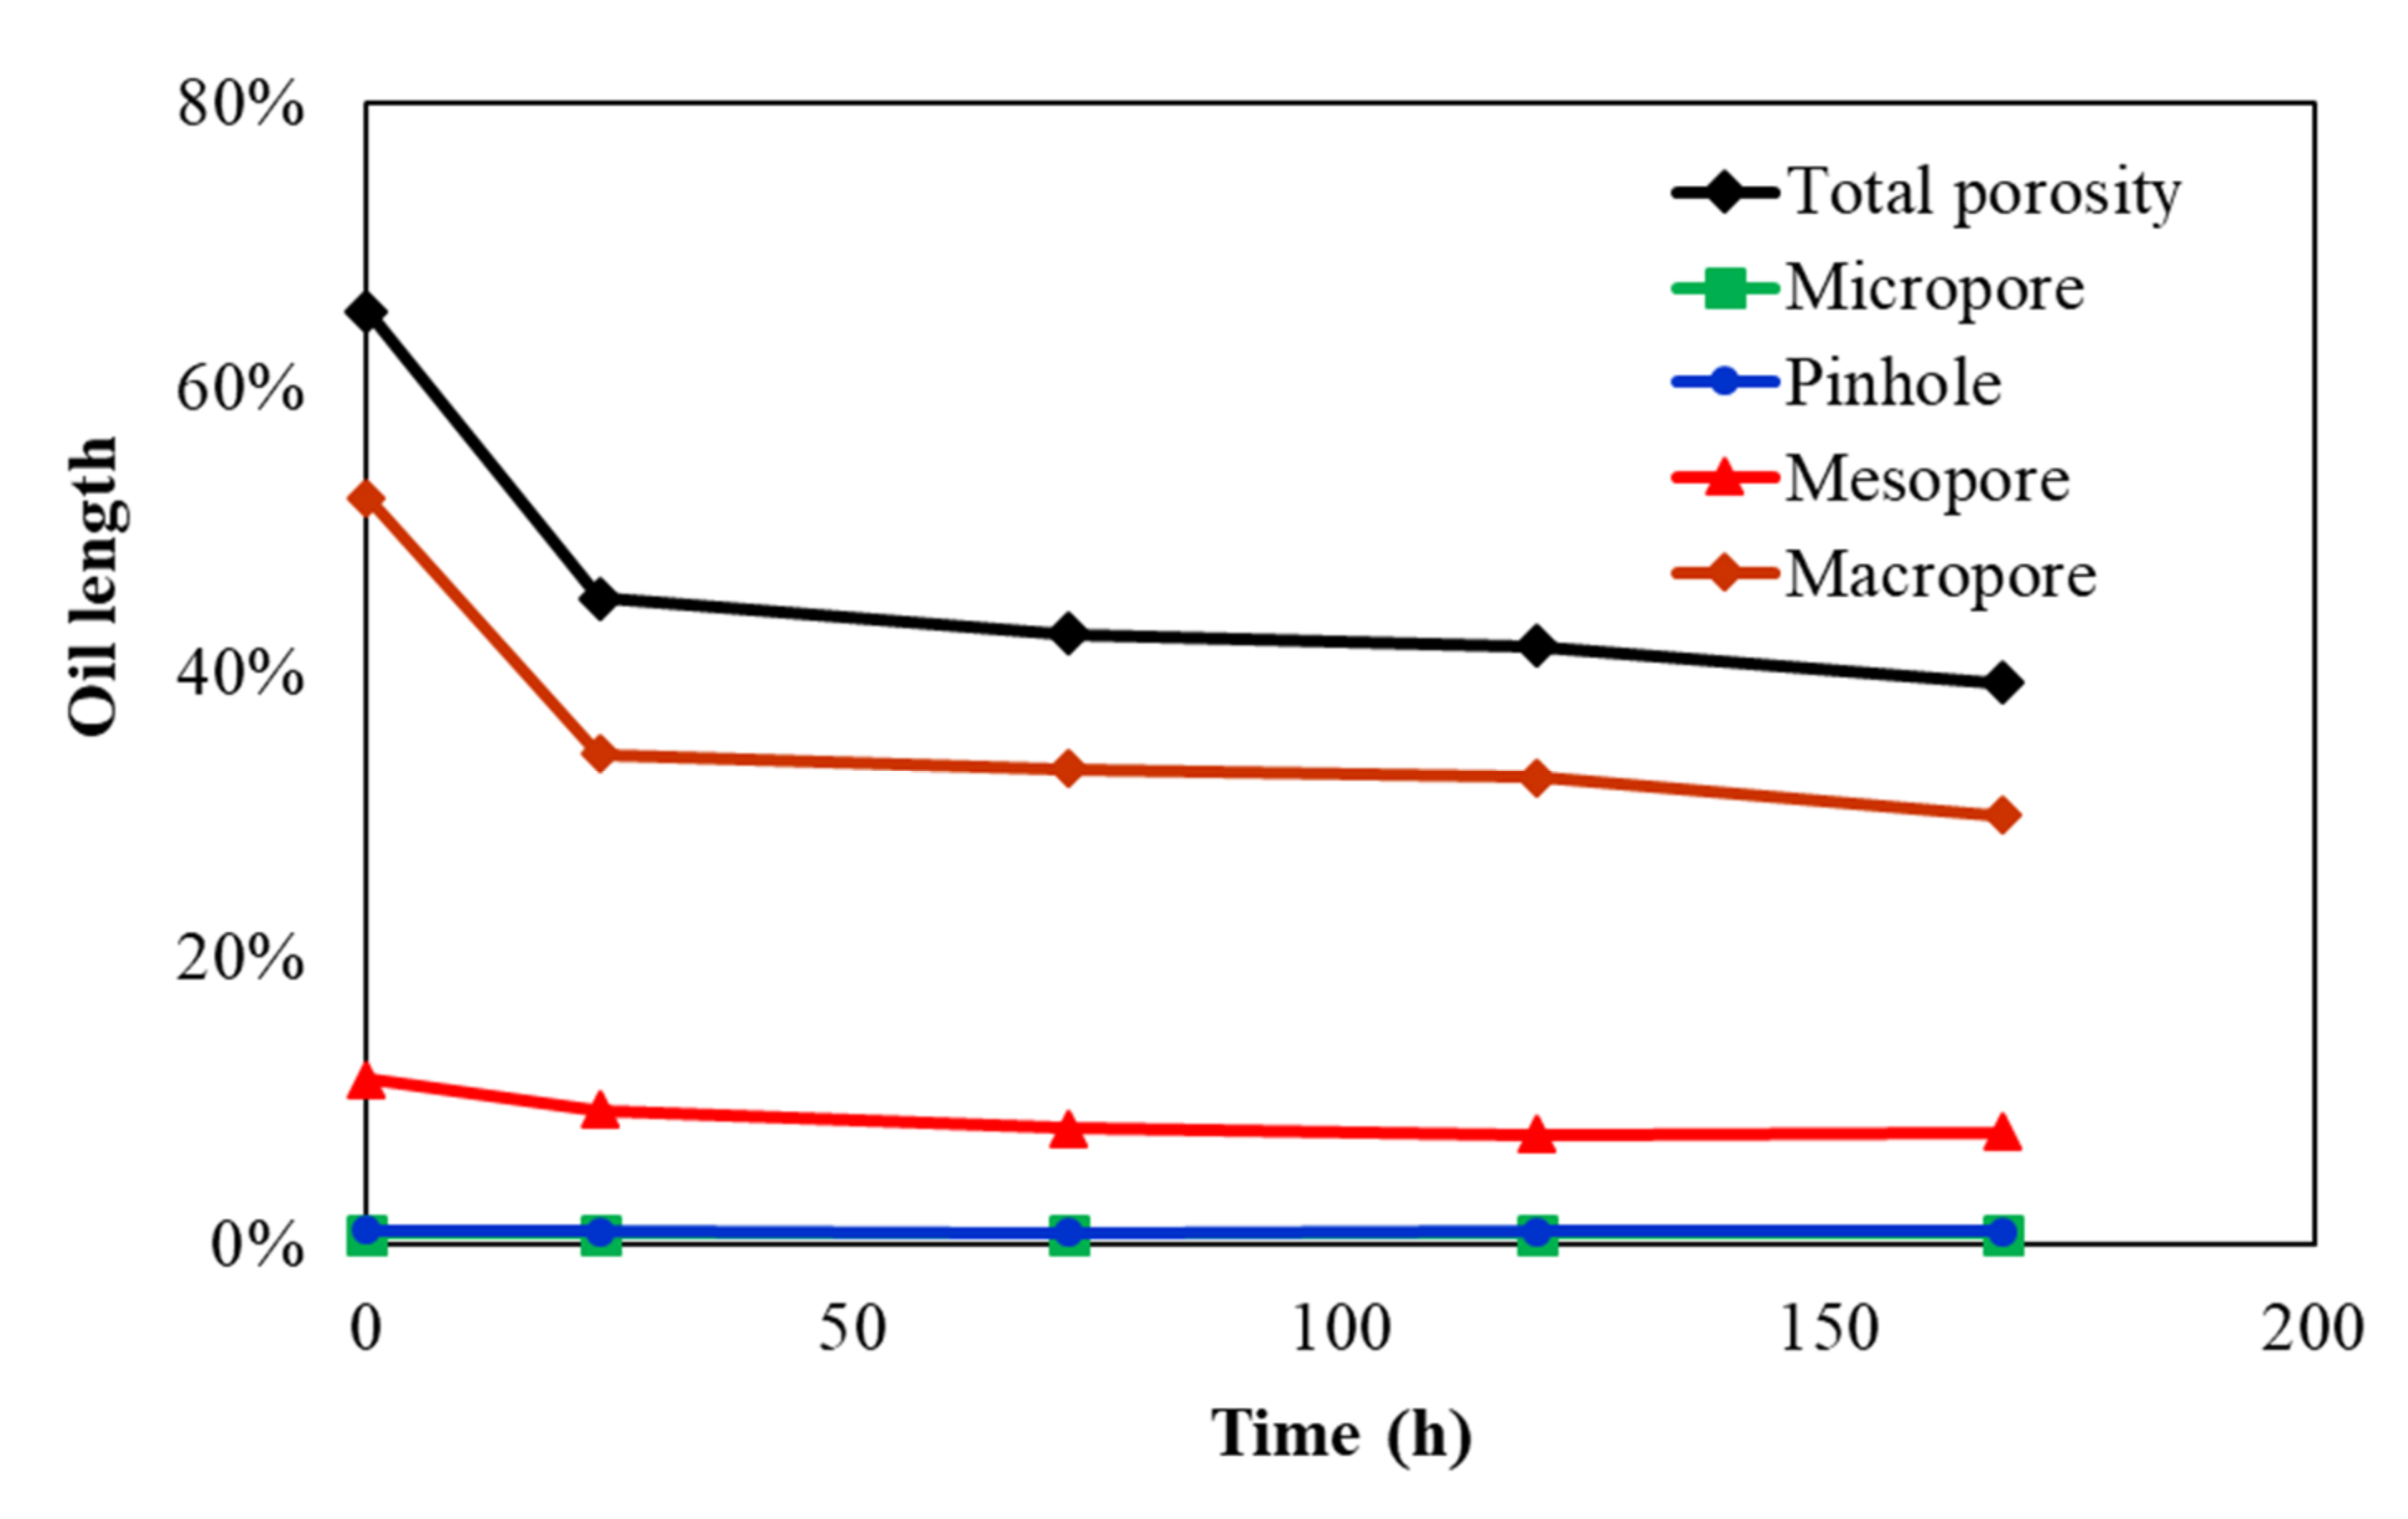
We classify the cores into four categories: a pore diameter of less than 0.025 μm is a micropore, a pore diameter of 0.025~0.1 μm is a pinhole, a pore diameter of 0.1~1 μm is a mesopore, and a pore diameter of more than 1 μm is a macropore. The time-varying curves of oil length in core 1 different levels of pore-throat are shown in Figure 7. The total oil length of core 1 decreases from 65.4% to 39.3% and, after 168-h of imbibition, the core oil recovery reaches 40.0%. The macropore oil length decreases from 52.3% to 29.9%, contributing 85.5% of the total imbibition oil recovery. The mesopore oil length decreases from the initial 11.5% to 7.7%, contributing 14.3% of oil recovery. Contributions of the micropore and the pinhole to recovery are negligible.
3.2. Core 2
Figure 8, respectively, reveals the T2 characteristics of core 2 after displacement at different time points. Both pore-throat and fracture undergo fluid displacement. With the increase of imbibition time, there are two intervals in core 2 that are mainly happening—fluid imbibition replacement, which is 0.003~0.01 μm and 0.02~33 μm, and the 0.02~33 μm pore-throat fluid displacement is relatively obvious. The peak value of a large pore-throat also deviates to the left with the fluid replacement, indicating that the water phase enters from the large pore-throat and displaces the oil phase to the small pore-throat. It also shows that the fluid replacement in the fracture is more caused by gravity differentiation.
The time-varying curves of oil length in core 2 and the different levels of pore-throat are shown in Figure 9. Oil length decreases to 13.4%. After imbibition, the core oil recovery reaches 80.0%. The macropore oil length decreases from 62.5% to 10.9%, which contributes 96.2% of imbibition recovery. Oil length in the mesopore decreases from the initial 4.1% to 2.1%, which contributes 3.6% of imbibition recovery. Contributions of the micropore and the pinhole yield to 0.2%, which can be negligible.
4. Conclusions
- (1)
- In fractured tight sandstone reservoirs, imbibition first occurs in fractures. Most of the imbibition recovery is contributed by the macropore; the contribution of the mesopore is weak, and the contributions of the micropore and the pinhole can be negligible. The imbibition recovery is greatly affected by fractures, and the productivity supply area is dominated by fractures and nearby reservoirs;
- (2)
- In the process of spontaneous imbibition, the peak value of the NMR curve corresponding to a pore-throat smaller than 0.02 μm shifts to the right. This is because the capillary force is the main force, and the water phase enters the displacement fluid from the smaller pore-throat to the larger pore-throat. The peak value of the NMR curve corresponding to a pore-throat larger than 0.02 μm slightly deviates to the left, because the displacement of oil and water in the fracture is more manifested by gravity, and the water phase enters the displacement fluid from the larger pore throat to the smaller pore throat;
- (3)
- The imbibition replacement of a fractured tight sandstone reservoir mainly occurs in the early stage. Fractures accelerate the imbibition speed. The replacement process is completed in a short time. Fractures can effectively shorten the imbibition time.
Author Contributions
Data curation, X.L.; experiment, X.F.; methodology, J.Y.; writing, Y.Z. All authors have read and agreed to the published version of the manuscript.
Funding
This work was supported by National Natural Science Foundation of China (No. 51804257, No. 52004220, No. 51934005, No. 51874242), Open Fund of State Key Laboratory of Oil and Gas Reservoir Geology and Exploitation (Chengdu University of Technology) (PLC20210316), the Postgraduate Innovation and Practice Ability Development Fund of Xi’an Shiyou University.
Data Availability Statement
Not applicable.
Acknowledgments
The Youth Innovation Team of Shaanxi Universities.
Conflicts of Interest
The authors declare no conflict of interest.
References
- Yu, F.W.; Gao, Z.D.; Zhu, W.H.; Wang, C.; Liu, F.; Xu, F.; Jiang, H.Q.; Li, J.J. Experiment on imbibition mechanism of fractured reservoirs by microfluidic chips. Pet. Explor. Dev. 2021, 48, 1162–1172. [Google Scholar] [CrossRef]
- Hu, S.; Zhao, W.; Hou, L.H.; Yang, Z.; Zhu, R.; Wu, S.; Bai, B.; Jin, X. Development potential and technical strategy of continental shale oil in China. Pet. Explor. Dev. 2020, 47, 819–828. [Google Scholar] [CrossRef]
- Sobhani, A.; Ghasemi, M.D. The effect of nanoparticles on spontaneous imbibition of brine into initially oil-wet sandstones. Energy Sources Part A Recovery Util. Environ. Eff. 2019, 41, 2746–2756. [Google Scholar] [CrossRef]
- Mirzaei-Paiaman, A.; Kord, S.; Hamidpour, E.; Mohammadzadeh, O. Scaling one and multi-dimensional co-current spontaneous imbibition processes in fractured reservoirs. Fuel 2017, 196, 458–472. [Google Scholar] [CrossRef]
- Xu, J.; Wu, K.; Yang, S.; Cao, J.; Chen, Z. Nanoscale free gas transport in shale rocks: A hard-sphere based model. In Proceedings of the SPE Unconventional Resources Conference, Calgary, AB, Canada, 15–16 February 2017. [Google Scholar]
- Bourbiaux, B.; Fourno, A.; Nguyen, Q.L.; Norrant, F.; Robin, M.; Rosenberg, E.; Argillier, J.-F. Experimental and numerical assessment of chemical enhanced oil recovery in oil-wet naturally fractured reservoirs. J. Pet. Sci. Eng. 2016, 21, 706–719. [Google Scholar] [CrossRef]
- Jiang, Y.; Shi, Y.; Xu, G.; Jia, C.; Meng, Z.; Yang, X.; Zhu, H.; Ding, B. Experimental study on spontaneous imbibition under confining pressure in tight sandstone cores based on low-field nuclear mag netic resonance measurements. Energy Fuels 2018, 32, 3152–3162. [Google Scholar] [CrossRef]
- Xu, G.; Shi, Y.; Jiang, Y.; Jia, C.; Gao, Y.; Han, X.; Zeng, X. Characteristic and influencing factors for forced imbibition in tight sand stone based on low-field nuclear magnetic resonance measurements. Energy Fuels 2018, 32, 8230–8240. [Google Scholar] [CrossRef]
- Habibi, A.; Dehghanpour, H.; Binazadeh, M.; Bryan, D.; Uswak, G. Advances in understanding wettability of tight oil formations: A montney case study. SPE Reserv. Eval. Eng. 2016, 19, 583–603. [Google Scholar] [CrossRef]
- Du, S.; Lee, S.; Wen, X.-H.; Efendiev, Y. A Similarity Solution for Imbibition Process and its Adaptation in Finite Difference Simulation of Fractured Reservoirs. In Proceedings of the SPE Reservoir Simulation Conference, On-Demand, 26 October–1 November 2021. [Google Scholar] [CrossRef]
- Wang, F.Y.; Yang, K.; Cai, J.C. Fractal characterization of tight oil reservoir pore structure using nuclear magnetic resonance and mercury intrusion porosimetry. Fractals 2018, 26, 1840017. [Google Scholar] [CrossRef] [Green Version]
- Liu, X.; Yan, L.; Gao, Q.; Liu, Y.; Huang, H.; Liu, S. Effect of salinity on imbibition recovery process of tight sand-stone reservoir. Processes 2020, 10, 228. [Google Scholar] [CrossRef]
- Liu, X.; Zhou, D.; Yan, L.; Liu, S.; Liu, Y. On the Imbibition Model for Oil-Water Replacement of Tight Sandstone Oil Reservoirs. Geofluids 2021, 2021, 8846132. [Google Scholar] [CrossRef]
- Liu, S.; Ni, J.; Wen, X.; Liu, X.; Huang, X.; Zhou, D.; Ren, P. A dual-porous and dual-permeable media model for imbibition in tight sandstone reservoirs. J. Pet. Sci. Eng. 2020, 194, 107477. [Google Scholar] [CrossRef]
- Liu, X.; Zhou, D.S.; Shi, Y.H.; Li, M.; Zhang, Z. Semi-analytical mathematical model for imbibition of tight sandstone reservoir considering osmotic pressure. Pet. Geol. Recovery Effic. 2018, 25, 93–98. [Google Scholar]
- Cheng, Z.; Ning, Z.; Wang, Q.; Li, M.; Sui, W. experimental investigation of boundary conditions effects on spontaneous imbibition in oil-water and gas-water systems for tight sandstones. In Proceedings of the SPE Middle East Oil and Gas Show and Conference, Manama, Bahrain, 19–21 March 2019. [Google Scholar] [CrossRef]
- Qiu, R.; Gu, C.; Xue, P.; Xu, D.; Gu, M. Imbibition characteristics of sandstone cores with different permeabilities in nanofluids. Pet. Explor. Dev. 2022, 49, 374–381. [Google Scholar] [CrossRef]
- Xu, J.; Wu, K.; Li, R.; Li, Z.; Li, J.; Xu, Q.; Li, L.; Chen, Z. Nanoscale pore size distribution effects on gas production from fractal shale rocks. Fractals 2019, 27, 1950142. [Google Scholar] [CrossRef]
- Xu, J.; Wu, K.; Li, Z.; Pan, Y.; Li, R.; Li, J.; Chen, Z. A model for gas transport in dual-porosity shale rocks with fractal structures. Ind. Eng. Chem. Res. 2018, 57, 6530–6537. [Google Scholar] [CrossRef]
- Zhang, S.J.; Pu, H.; Zhao, X.J. Experimental and numerical study of spontaneous imbibition with different boundary conditions: Cases study of middle bakken and berea cores. Energy Fuels 2019, 33, 5135–5146. [Google Scholar] [CrossRef]
- Cai, J.C.; Jin, T.X.; Kou, J.S.; Zou, S.; Xiao, J.; Meng, Q. Lucas-Washburn equation-based modeling of capillary-driven flow in porous systems. Langmuir 2021, 37, 1623–1636. [Google Scholar] [CrossRef]
- Liu, M.; Xie, R.; Xu, H.; Wu, S.; Zhu, R.; Mao, Z. A new method for predicting capillary pressure curves based on NMR logging in tight sandstone reservoirs. Appl. Magn. Reson. 2018, 49, 1043–1058. [Google Scholar] [CrossRef]
- Hübner, W. Studying the pore space of cuttings by NMR and μCT. J. Appl. Geophys. 2014, 104, 97–105. [Google Scholar] [CrossRef]
- Lin, H.; Zhang, S.; Wang, F.; Pan, Z.; Mou, J.; Tong, Z.; Ren, Z. Experimental investigation on imbibition-front progression shale based on nuclear magnetic resonance. Energy Fuels 2016, 30, 9097–9105. [Google Scholar] [CrossRef]
- Gharachelou, S.; Amini, A.; Kadkhodaei, A.; Hosseini, Z.; Honarmand, J. Rock typing and reservoir zonation based on the NMR logging and geological attributes in the mixed carbonate-siliciclastic Asmari Reservoir. Geopersia 2018, 8, 77–98. [Google Scholar] [CrossRef]
- Peng, X.; Wang, X.; Zhou, X.; Lin, Z.; Zeng, F.; Huang, X. Lab-on-a-chip systems in imbibition processes: A review and applications/issues for studying tight formations. Fuel 2021, 306, 121603. [Google Scholar] [CrossRef]
- Wang, X.; Peng, X.; Zhang, S.; Du, Z.; Zeng, F. Characteristics of oil distributions in forced and spontaneous imbibition of tight oil reservoir. Fuel 2018, 224, 280–288. [Google Scholar] [CrossRef]
Figure 1.
Cores selected in this paper.

Figure 2.
The CTS and SEM of cores.

Figure 3.
The pore-throat distribution of cores.

Figure 4.
Self-imbibition experimental device.

Figure 5.
Pseudo-color processing images of core 1 (fluorescence represents oil phase).


Figure 6.
NMR T2 spectrum curve of core 1.

Figure 7.
The time-varying curves of oil length in core 1 different levels pore-throat.

Figure 8.
NMR T2 spectrum curve of core 2.

Figure 9.
The time-varying curves of oil length in core 2 different levels of pore-throat.


Table 1.
Physical parameters of cores.
| No. | φ/% | Kg/10−3 μm2 | L/cm | d/cm | w/g |
|---|---|---|---|---|---|
| 1 | 4.36 | 4.0258 | 4.02 | 2.54 | 42.3032 |
| 2 | 3.78 | 5.1424 | 4.25 | 2.56 | 45.5039 |
Publisher’s Note: MDPI stays neutral with regard to jurisdictional claims in published maps and institutional affiliations. |
© 2022 by the authors. Licensee MDPI, Basel, Switzerland. This article is an open access article distributed under the terms and conditions of the Creative Commons Attribution (CC BY) license (https://creativecommons.org/licenses/by/4.0/).
Share and Cite
MDPI and ACS Style
Liu, X.; Fan, X.; Yin, J.; Zhang, Y. Imbibition Characteristic of Fractured Tight Sandstone Reservoir. Processes 2022, 10, 2189. https://doi.org/10.3390/pr10112189
AMA Style
Liu X, Fan X, Yin J, Zhang Y. Imbibition Characteristic of Fractured Tight Sandstone Reservoir. Processes. 2022; 10(11):2189. https://doi.org/10.3390/pr10112189
Chicago/Turabian StyleLiu, Xiong, Xin Fan, Jian Yin, and Yang Zhang. 2022. "Imbibition Characteristic of Fractured Tight Sandstone Reservoir" Processes 10, no. 11: 2189. https://doi.org/10.3390/pr10112189
Note that from the first issue of 2016, this journal uses article numbers instead of page numbers. See further details here.