
An Agent-Based Approach for Make-To-Order Master Production Scheduling
by
 , , , , and
Faezeh Bagheri
1,* ,
,
Melissa Demartini
2,
Alessandra Arezza
3 ,
,
Flavio Tonelli
1,
Massimo Pacella
4 and
Gabriele Papadia
4 1
Department of Mechanical, Energy, Management and Transportation Engineering (DIME) Polytechnic School, University of Genoa, 16145 Genoa, Italy
2
SDU—Center for Sustainable Supply Chain Engineering, Department of Technology and Innovation, University of Southern Denmark, Campusvej 55, 5230 Odense, Denmark
3
DGS SPA, Via Paolo di Dono, 73, 00142 Roma, Italy
4
Department of Engineering for Innovation, University of Salento, 73100 Lecce, Italy
*
Author to whom correspondence should be addressed.
Processes 2022, 10(5), 921; https://doi.org/10.3390/pr10050921
Submission received: 1 April 2022
/
Revised: 29 April 2022
/
Accepted: 3 May 2022
/
Published: 6 May 2022
(This article belongs to the Special Issue Process Control and Smart Manufacturing for Industry 4.0)
Abstract
:In recent decades, manufacturers’ intense competitiveness to suit consumer expectations has compelled them to abandon the conventional workflow in favour of a more flexible one. This new trend increased the importance of master production schedule and make-to-order (MTO) strategy concepts. The former improves overall planning and controls complexity. The latter enables the production businesses to reinforce their flexibility and produce customized products. In a production setting, fluctuating resource capacity restricts production line performance, and ignoring this fact renders planning inapplicable. The current research work addresses the MPS problem in the context of the MTO production environment. The objective is to resolve Rough-Cut Capacity Planning by considering resource capacity fluctuation to schedule the customer’s order with the minimum cost imposed by the company and customer side. Consequently, this study is an initial attempt to propose a mathematical programming approach, which provides the optimum result for small and medium-size problems. Regarding the combinatorial intrinsic of this kind of problem, the mathematical programming approach can no longer reach the optimum solution for a large-scale problem. To overcome this, an innovative agent-based heuristic has been proposed. Computational experiments on variously sized problems confirm the efficiency of the agent-based approach.
1. Introduction
In the last few decades, the interest of industry and academia has led to a stable increase in the production planning (PPC) area, as this is considered one of the most central and relevant choices faced by firms [1,2]. A traditional PPC problem originates with the details of a customer demand that must be covered with a specific production plan by managing different resources and constraints (i.e., demand, process, and supply) while minimizing costs [3]. Mula et al. (2006) identified five main PPC areas: (i) Master Production Schedule (MPS), (ii) Material Requirement Planning and Manufacturing Resources Planning (MRP); (iii) Supply Chain Planning; (iv) Aggregate Production Planning and (v) Hierarchical Production Planning [4]. MPS defines the optimal production plan by meeting customer demand and minimizing holding and set-up costs. MRP accomplishes PPC components by using a bill of materials (BOM) and the MPS outputs. An additional component, the Rough-Cut Capacity Plan (RCCP) module, can be used to check the feasibility of the MPS plan. However, due to the supply chain complexity and the increasing need for integration and coordination among supply chain players, Supply Chain Planning modules have been introduced in the last decades to manage multisite PPC. Finally, Hierarchical Production Planning is used to distinguish between several planning levels, and Aggregate Production Planning to establish production, inventory, and workforce levels. Manufacturing businesses encounter complicated production planning problems due to a growing focus on customer requirement and service and a rise in product complexity. A high degree of manufacturing flexibility is also necessitated due to short product life cycles, ongoing market volatility, and unpredictable demand. Understanding operational interdependence and reacting effectively to market or demand shifts is even more crucial in an ever-complex environment [5]. In today’s competitive market, manufacturing companies are striving to modify their production strategy to enhance their market share by responding to a broader variety of client needs. One supporting strategy in this regard is Make-To-Order (MTO). MTO enables business owners to produce customized products according to what is desirable for customers, and can be facilitated through the implementation of Industry 4.0 technologies [6]. The higher the customer satisfaction and the more needs are met, the more successful the company will be in attracting higher number of customers and increasing its market share [7,8,9]. According to the capability of MTO to confront market competitiveness and MPS to handle intrinsic uncertainty in production, their accompaniment could play a noteworthy role for manufacturers in the direction of overcoming the above-mentioned challenges. Therefore, the goal of this paper is to focus on an MPS/RCCP problem similar to that proposed in [10], where the authors developed a decision support framework to improve the MPS process in a MTO environment. They extended the RCCP functionalities of Microsoft Navision by implementing an Extended-RCCP based on a Genetic Algorithm (GA). In this paper, instead of using the GA, we present an innovative agent-based heuristic, and we compare its results versus a mathematical programming approach. The paper is organized as follows; the next section depicts the state of art related to MPS, MTO problems, the focus of this research, and the main characteristics of the agent-based heuristic. Section 3 describes the model formulation and the solution approach. Section 4 presents the comparison between results obtained by the mathematical programming approach and agent-based heuristics applied to some problem instances in ‘real’ industrial cases. Finally, Section 5 presents conclusions and future outlook.
2. Literature Review
The MPS process defines production plans for product families or products regarding fluctuating demands [11]. The results of demand planning and forecasting influence the MPS as it aims to balance the demand and available capacities. In return, the resulting plans determine purchased parts for the MRP and the production volume for the lot sizing. In the literature for the MPS, various mathematical optimization models can be found, most of which are used in linear programming, integer linear programming, and mixed-integer linear programming [12]. Basic MPS models consider a single-period single-stage case [13]. However, there are many extensions as practical examples; there are usually many different stages, with planning horizons spanning from a few months up to one year. Therefore, multi-period multi-stage models are considered contributions. Additionally, the insertion of capacity restrictions is the state of the art for MPS models. In this scenario, to allow demand to be met, the number of stored products needs to be determined [14]. Different models consider further additional adjustments for uncertainties, such as quality issues, rework, and uncertain demand. An example of this can be found in Taşkın and Ünal (2009) [15]. They describe an MPS model applied within the glass industry. They come up against the problem of inconsistent product qualities and downgrade substitution to meet demand. The reworking of rejects is integrated into the MPS by Inderfurth, Lindner and Rachaniotis (2005) [16]. At present, many models focus on existing uncertainties in tactical and operational planning, though at the forefront are those focusing on demand. Researchers can broadly be split into two groups: those who consider non-cost-based objective functions like flow time, job tardiness, job earliness and schedule makespan [17], and those who consider combined cost-based and non-cost-based objective functions [18,19]. Among the latter group, some recent studies [20,21] indicate that smoothed series of production volumes, through the minimization of (i) ‘total variations in production volumes’; (ii) the total cost; and (iii) other objectives; are sought by production managers. Driven by the complexity of the automotive industry, Mansouri, Golmohammadi, and Miller (2019), in their paper, first examine how the throughput of complex job shop systems can be forecasted based on problem characteristics and different MPS methods [22]. Next, they analyse how different MPS approaches balance the relationship between problem characteristics and throughput. A mixed-effects model based on operational characteristics and the MPS development method was established to obtain these objectives and predict the system’s throughput. The analyses are based on a real case study taken from the automotive industry and two complex job shop systems in the literature. The experimental results indicate that the throughput of job shop systems can be predicted with a high level of accuracy. Golmohammadi (2013) developed a neural network model focused on detailed scheduling for analysis of job shop scheduling. Instead of a simulation model, which is a costly and complex approach for scheduling, the output of the model proposed by the author helps managers estimate the throughput based on historical data with a trained neural network model [23]. The main shortcoming of the research is that the prediction results may not be accurate due to the training data set potentially not comprising new problem characteristics. The paper by Guillaume, Thierry and Zieliński (2017) focuses on the tactical level by examining the MPS and MRP planning processes; specifically, they work on the CLSP (for the MPS process) and MLCLSP (for the MRP process), both with back-ordering, with uncertain cumulative demand [24]. An essential difficulty for the production planning systems is the issue of tactical production and capacity planning under uncertainty in demand. In the paper, the authors cover (i) the MPS (CLSP) under small uncertainty in the cumulative demand; (ii) the MRP (MLCLSP) problems under uncertainty in the cumulative demand. The model of uncertainty in the cumulative demand enables us to take into account simultaneously the imprecision on order quantities and dates. For both problems, linear programming models, including back-ordering and the cumulative demand, have been presented. Efficient methods for evaluating the impact of uncertainty on production plans and linear programming for computing optimal robust production plans for MPS and MRP problems in the cumulative demand are proposed. The authors prove that the computational complexity of optimization processes, with the min-max criterion, is not significantly increased when introducing uncertainty in the cumulative demand, compared with the deterministic counterparts–they remain polynomial solvable. Therefore, they can be applied in the industrial context, namely in the manufacturing planning tools using linear programming solvers. Sahin, Powell Robinson and Gao (2008) explored the MPS problem in a MTO environment [25]. They developed a simulation model to analyse cost and schedule metrics and design specific advanced order commitment policies. They conducted full-factorial experiments to define the main drivers of MPS policy cost and schedule stability. Powell Robinson, Sahin, and Gao (2008) also develop a two-stage rolling schedule environment with a particular focus on the policy related to the schedule flexibility in the non-frozen time intervals [26]. Sawik (2007) explored the same topic by developing multi-objective, long-term production scheduling in an MTO environment and a lexicographic approach with a hierarchy of integer programming formulations [27]. The goal was to assign customer orders with different due dates to minimize tardiness and maximize the input and output inventory. The same topic is explored by Nedaei and Mahlooji (2014), who developed a multi-objective MPS and rolling schedule policies in a two-stage MTO environment [28]. Finally, very recent articles address MPS and MTO problems in connection with Industry 4.0. Indeed, Yin, Stecke and Li (2018) explained that due to the relevance of the mass-customization trend and due to the difficulties companies are experiencing with the current manufacturing systems, Industry 4.0 technologies can enable and facilitate a MTO environment as a typical strategy of customization [29]. Gu and Koren (2022) stated that internet of things, cyber physical systems, machine learning and deep learning technologies should be integrated to develop a mass-individualisation MTO [30]. Mladineo et al. (2022) stated that companies need to advance their product configurators to satisfy customer needs and to keep the whole process economical and efficient. In this regard, data integration is defined as a fundamental requirement for MTO, especially in the context of horizontal and vertical integration of the value chain [9]. Kundu, Rossini and Portioli-Staudacher (2018) discussed the importance of Industry 4.0 technologies in workload control for MTO companies. They stated that the first condition is to implement production automation to improve flexibility, then they highlighted the importance of cyber physical systems as a representation of physical components. To this end, sensors are considered one of the core technologies to enable cyber physical systems. Finally, they emphasised the importance of a proper communication network within the factory to improve data sharing between manufacturing processes and production orders [31]. Lee et al. (2019) implemented an MTO strategy in the context of Industry 4.0. They developed a product configuration system to match customer demands and manufacturer orders [32]. Rahman, Janardhanan and Nielsen (2019) focused on real-time order acceptance and scheduling as key concepts of MTO in an Industry 4.0 environment. They developed a real time system capable of accepting orders and scheduling decisions through a hybrid genetic algorithm and particle swarm optimization model [33]. Micieta et al. (2019) designed an innovative approach to products segmentation in an MTO environment based on Industry 4.0 concepts. This approach allowed companies to reduce work in progress lead time and increase efficiency [34]. Woschanka, Dallasega and Kapeller (2020) aimed to enhance logistics performance in a MTO environment by using real data and analysing several planning granularity levels. The approach has been validated through a discrete event simulation model [35].
2.1. Main Focus of the Proposed Research
This study aims to closen the MPS problem in the context of MTO to the real production environment. Various limitations that frequently occur in the production factories have been imposed to realize this goal. For example, limited resource capacity is one of the most frequent challenges that restrict the production rate and affect customer order delivery date. There are also other kinds of constraints that make the production setting more complicated. More details and clarification have been explained in the rest of the paper. This extension and modification enable a manufacturer to achieve more practical results. To achieve these results, two solution approaches, including Mathematical Programming (MP_RCCP) and an Agent-Based approach (AB_RCCP), have been presented. Garey and Johnson have proven that when capacity and setup limitations are imposed, the MPS problem is taken into account as an NP-hard problem. In practice, this implies that the processing time required to answer such issues will swiftly and tremendously increase as the problem size rises [36]. Following this, achieving the optimal solution through mathematical programming with increasing instances’ size is quite complicated (MP_RCCP). To overcome this challenge, an AB_RCCP has been developed to perform an acceptable solution in a reasonable time.
The ‘conceptual’ generated problem instance is described as follows:
- Customer Order (CO): this is the customer’s request. It is managed in an MTO environment. Each customer order presents a due date and a specific quantity that needs to be satisfied.
- Bill of material (BOM): this lists the raw materials, parts, and components needed to make a product. It presents different levels according to the customer order.
- Bill of the process (BOP): this is comprised of detailed plans explaining the manufacturing processes for a particular product. These plans contain in-depth information on machinery, plant resources, equipment layout, configurations, tools, and instructions.
- Resources: these can be physical (work centers, tooling, process materials) or skills. Each resource presents its capacity and feature.
2.2. The Main Characteristics of the Proposed Approach
The Cooperative Supply Chain (Coop SC) framework is a prototype capable of supporting a decision-making process through adequate, modern, and flexible tools, capable of hosting algorithms from third parties [37]. CoopSC includes an RCCP engine to optimize multi-site contexts using a modified multi-agent architecture by adopting three different levels of supervision: demand, production sites, and resources.
Starting from the highest planning levels (Figure 1), the Demand Management and Inventory Management modules generate medium and long-term forecasts for macro-families and/or product types related to a CO. The Inventory Management is a collection of inventory planning tools and applications that can optimize the mix and quantity of planned inventory. They provide a validation of the input required to satisfy the CO for a set of KPI. The MPS component is, therefore, able to provide decision-making support for the resolution of typical business constraints, generated by conflicts between the company needs and the constraints of a multi-plant/multi-supplier context. The requests, processed by CoopSC, can be defined manually or imported by an external forecasting module [38] capable of forecasting the sales and use of the products (appropriately divided into production lots by the Inventory Management level) so that they can be purchased or made in adequate quantities in advance. The production and procurement commitments, which are required by the estimate of future requirements, are simulated according to the capacity of the resources, the planning cycles, and the actual processing bills, and considering the supply and transport constraints (RCCP module). The CoopSC MPS/RCCP component is based on the Service Lanes Planning (SLP) concept [39]. It articulates the evaluation of customer service levels by identifying service lanes based on assignment criteria and heuristics that verify inventory availability and production plans in the processing, production and supply stages. The SLP develops a proposal by considering a multi-constrained context as depicted in Figure 2, the goal of which is to provide a feasible solution that takes into consideration the available stock, the CO, the production constraints, and the SL.
The CoopSC MPS component provides two analyses:
- Allocate CO by using an infinite capacity approach;
- Execute a master planning activity with a finite capacity and develop several proposals to satisfy CO and several production constraints.
In the first case, CoopSC MPS can satisfy the SL, but it doesn’t take into account the capacity of resources. In the second case, the tool splits up the proposals defining the allocation rules that make it possible to move the individual planning lots to respect the finished capacity, always according to the service level. Therefore, CoopSC MPS divides the proposal into minimal lots and, by early and tardy times, attempts to change the allocation of the lots to meet the SL and the capacity of resources.
Therefore, the goal of the CoopSC MPS is to minimize capacity overflows by using several levers, or the user can force a proposal to make the allocation feasible. If there is a capacity overflow, the system allocates the CO to the next bucket and executes a new backward assignment of that CO.
The backward assignment is based on an AB_RCCP heuristics where a set of agents can solve the planning problem by simulating the resources allocation to meet the objective function.
3. Problem Description and Solution Approaches
The production environment characterized by the MTO strategy possesses a high level of flexibility concerning satisfying the customer requirement. This specification supports business owners to cover a wide range of customers’ needs by customizing their requirements into the product features and enabling them to maintain and raise their market share in today’s competitive market [7].
In the make-to-store (MTS) strategy, the factory could produce the products in advance and store them in the warehouse. This feature enables more efficiently handling of demand fluctuations. Establishing a balance between resources and production line within MTS is more achievable [40], while in the MTO strategy the factory will proceed with production after receiving the customer order. It is obvious, regarding the limitation of the resources, that if fluctuation occurs in the customer order, the production process will encounter the challenge of instituting balance in the factory’s resources [8]. In this regard, the main concentration of current research is presenting an efficient solution approach for coping with this kind of challenge in the MTO production setting. Section 2.1 and Section 2.2 have been dedicated to the description of MP_RCCP and AB_RCCP, respectively.
3.1. The Mathematical Programming Approach (MP_RCCP)
In this section, the MILP model presented by [41] has been extended according to the MTO production strategy. In the context of MTO, each customer could customize their order. Each customer order (CO) consists of the sequence of operations and due date. The resources have a limited capacity for processing the operations in the real production environment. Concerning this fact, this model aims to plan/schedule the orders to minimize tardiness and overtime cost.
To apply the approach, it is required to formulate a mathematical model of the production environment. In the current study, the first requirement has been satisfied in Section 2. Depending on the managers’ preference, whether this preference can originate from the customer side or the production environment, or both, the goal of mathematical model is adjusted accordingly and production line features are introduced as the series of constraints. At this stage, the optimal solution is achieved by relying on the optimizing software and coding the formulated mathematical model.
Other assumptions of the proposed model are as follows:
- There is no priority for each customer order.
- Each resource could process only one operation at a time.
- Each operation is eligible to operate with only one resource.
- Resumption of operations is possible.
- The orders are processed in the batch.
- Resources have limited capacity.
- Resources are available from time zero.
The index, parameters, and variables of the model are as follows:
| Index | |
| Customer | |
| Resource | j |
| Operation | |
| Time horizon |
| Parameters | ||
| Customer | The quantity of customer order | |
| The due date for customer order | ||
| Tardiness cost for customer order | ||
| Resource | The capacity of resource in time bucket | |
| The overtime cost of resource | ||
| Equal to 1 if overtime is allowed, otherwise 0 | ||
| Operation | Processing time operation of customer order | |
| Equal to 1 if resource is eligible to process operation of customer order , otherwise 0 | ||
| other | The length of each time bucket | |
| A very large number | ||
| Variables | |
| The length of the time that operation of customer order is performed in time bucket | |
| Equal 1, if operation of customer order is begun in time bucket | |
| Equal 1 if operation of customer order is started in time bucket before operation of customer order and | |
| Start time operation of customer order in time bucket | |
| Completion time operation of customer order in time bucket | |
| A lower bound for starting time of operation of customer order | |
| A upper bound of completion time of operation of customer order | |
| The amount of lateness related to customer order | |
| The amount of overtime related to resource in time bucket | |
The proposed model is as follows:
| Z = + | (1) | |
| ∗ | (2) | |
| (3) | ||
| (4) | ||
| (5) | ||
| (6) | ||
| (7) | ||
| (8) | ||
| + | (9) | |
| (10) | ||
| (11) | ||
| (12) | ||
| + | (13) | |
| (14) | ||
| (15) | ||
| , | (16) | |
The objective function (1) involves the cost related to tardiness and overtime and tries to minimize it with respect to the constraints. Constraint (2) ensures that the summation of processing time in the all-time bucket should satisfy the whole quantity of customer orders. Through constraint (3), the value for the variable is determined. This variable is used to avoid overlapping in scheduling. Constraint (4) calculates the completion time of each operation in each time bucket. Constraints (5) and (6), define the upper bound for completion time and lower bound for starting time of operation o in time bucket t. Constraint (7) ensures the sequence of operations. It means that the next operation cannot be started unless the previous operation is completed. Constraints (8) and (9) jointly arrange the sequence of operations from different customer orders on the same machine. Constraints (10) and (11) define the start and completion time boundaries. Constraint (12) computes customer order lateness. Constraint (13) ensures that resource loading does not exceed the available capacity. Constraint (14) limits the amount of resource overloading. Constraints (15) and (16) define the non-negative and binary variables.
3.2. The Agent Based Approach (AB_RCCP)
The AB_RCCP aggregates the individual proposals into minimum planning batches and, according to previously defined lead times or delays, tries to shift the allocation of production batches to provide the required level of service and ensure compliance with the finite capacity.
The proposed multi-agent heuristics is distinguished by efficient interactivity and computational convergence thanks to the optimized simulation engine, and the ability to work in ‘back and forth’ allocation to time.
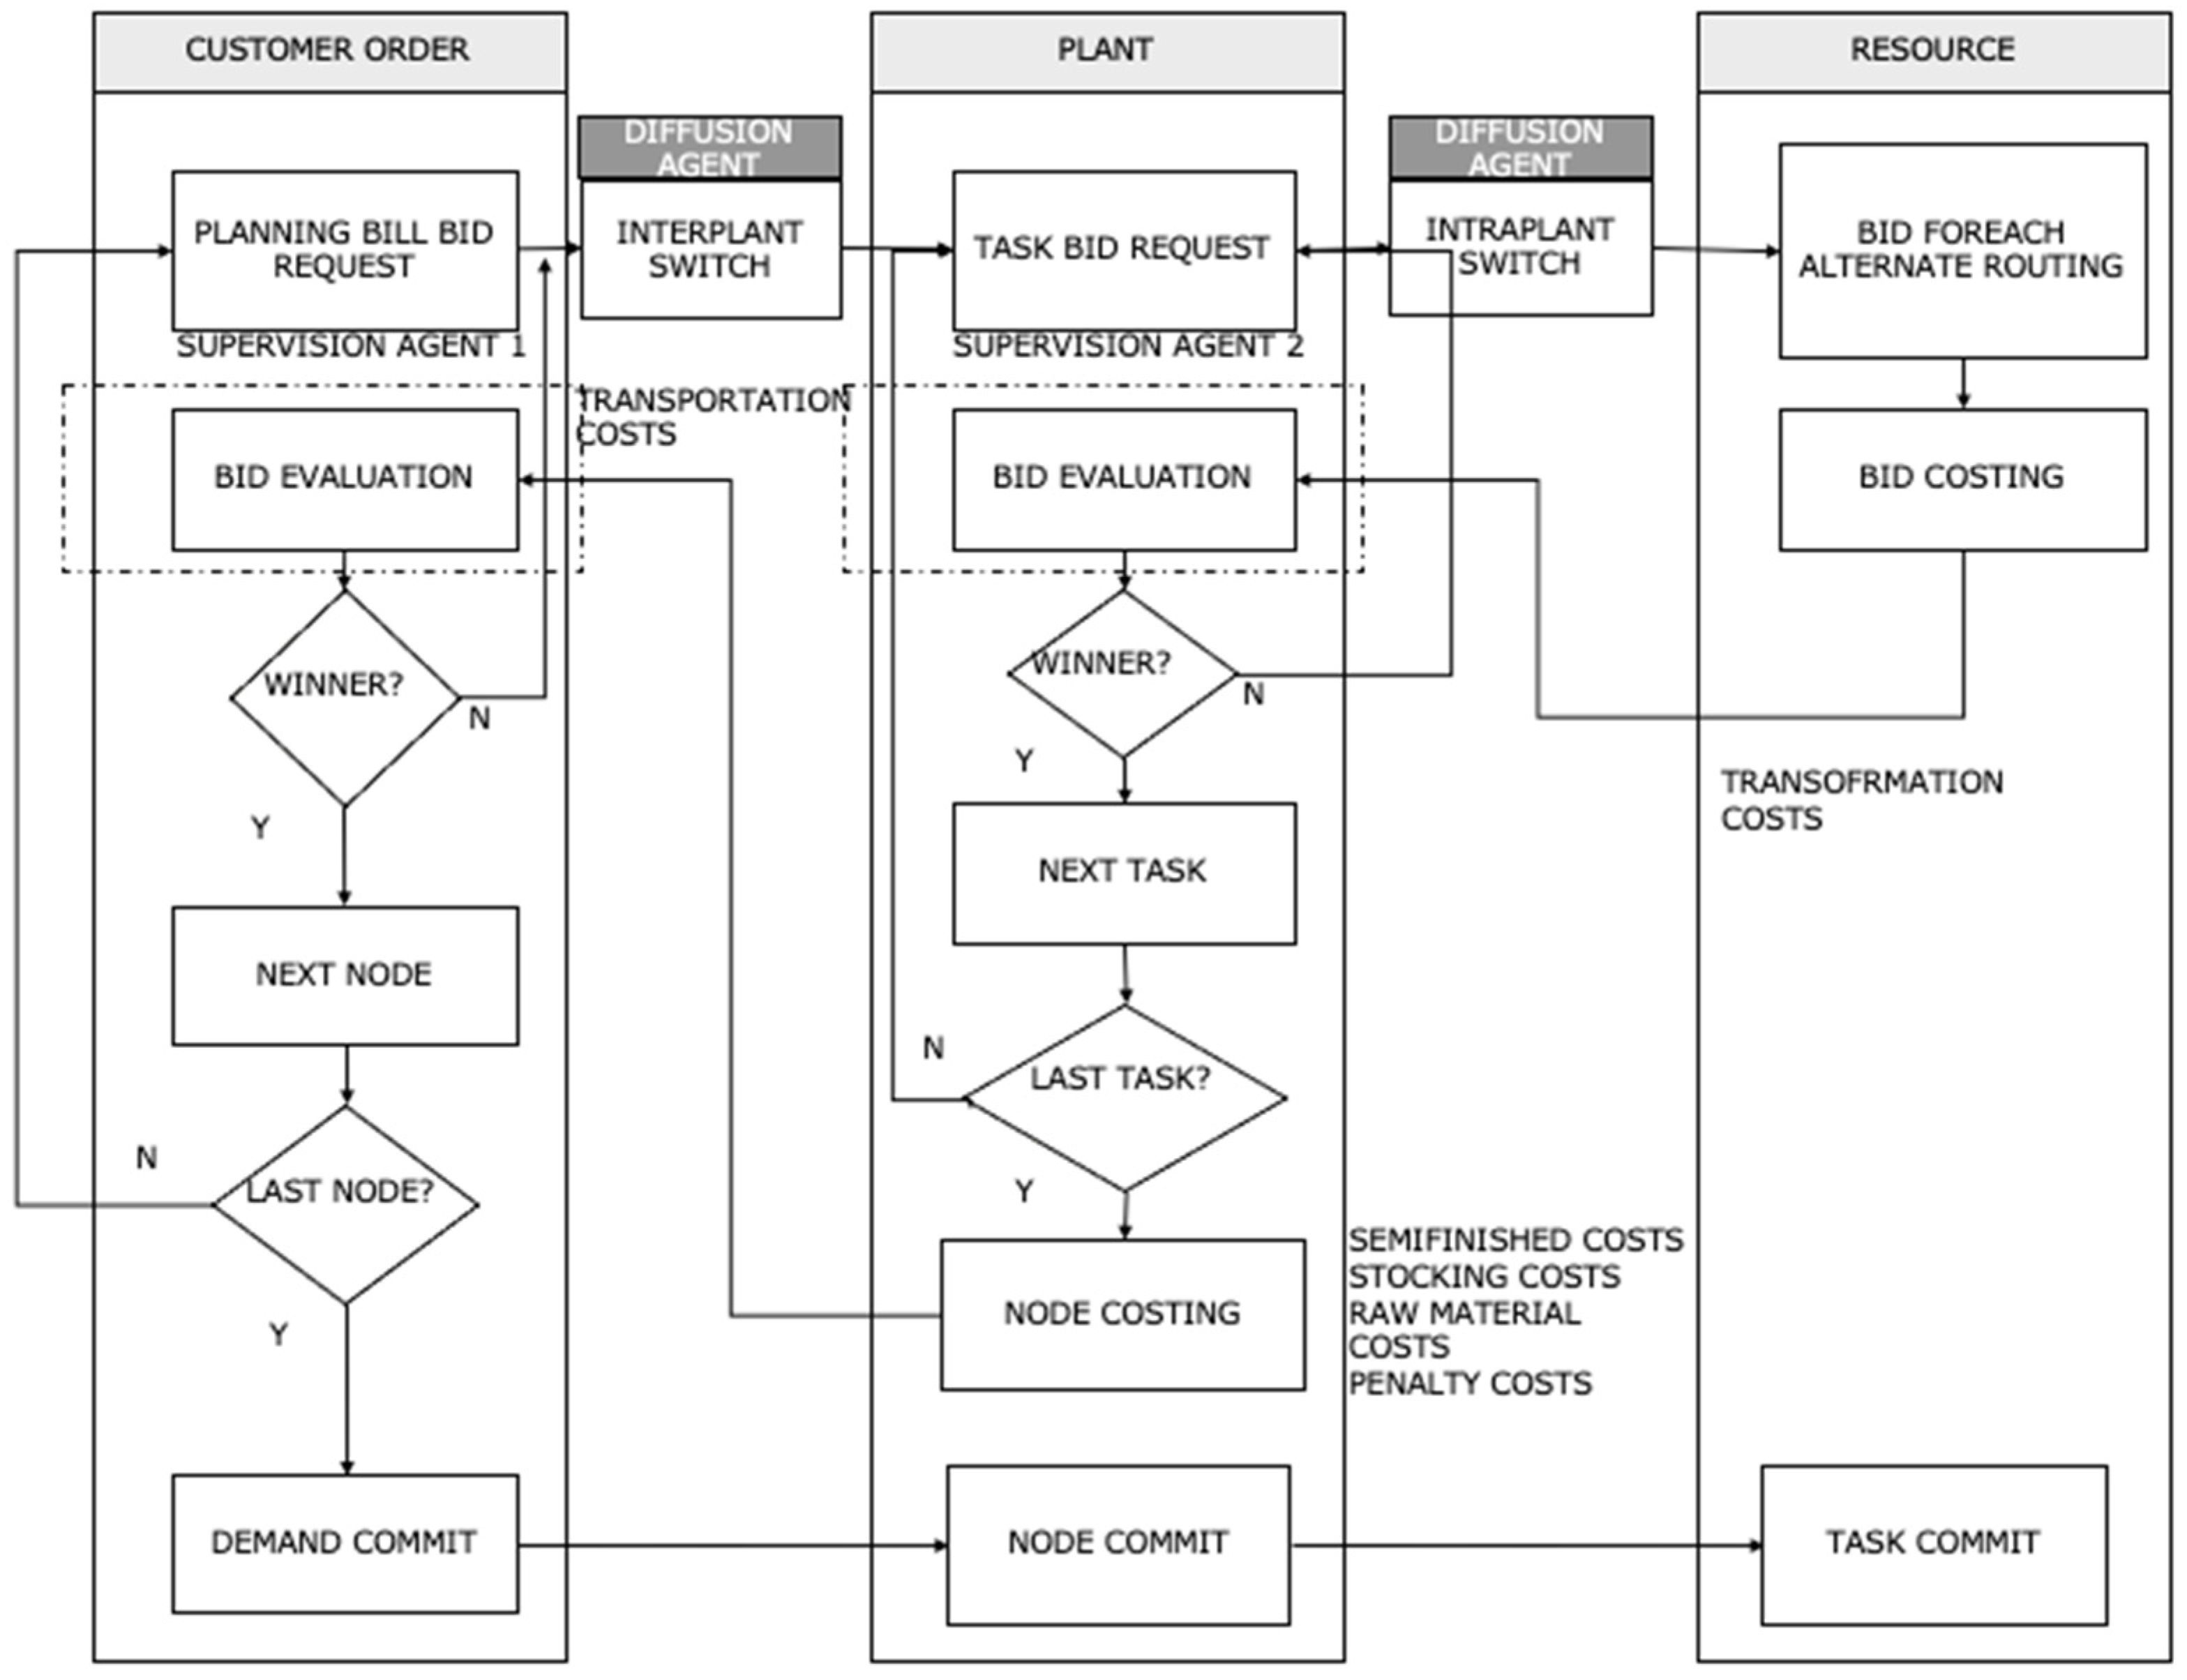
The planning process, developed through the backward loading of the production sites and the macro resources associated with them, is carried out by two supervising agents (plant and resource). Their goal is to choose the production site where the demand will be allocated and then decide which production resources will be destined for the batch to be produced according to the CO and their feature and capacity. This process is depicted in Figure 3.
Each agent has information related to (i) the production system and (ii) the option for exchanging data with other agents to start the negotiations. They are also equipped with a decision-making system to determine the planning of tasks based on the information defined above.
The same logic is applied at the hierarchical level of resources. The final goal is to define which resources will perform which operations in which buckets. The supervisory agents (plants and resources) engage in negotiations with their level agents to satisfy the CO and optimize a specific target objective function. Therefore, the plant and resource agents sell a service to satisfy their load profile.
Accordingly to these mechanisms, the AB_RCCP of CoopSC calculates different “scenarios” by applying several planning heuristics parameters. Then, allowing for the comparison of the plans through a set of performance indicators.
4. Computational Results
This section evaluates the performance and efficiency of the MP and AB approaches. The MP approach was coded in General Algebraic Modeling System (GAMS) software, and the CPLEX solver was employed. The AB approach has been developed on Net (C#). Both approaches are executed on a laptop characterized by Intel(R) Core(TM) i7-10750H CPU @ 2.60 GHz processor and 16 GB memory to achieve comparable results.
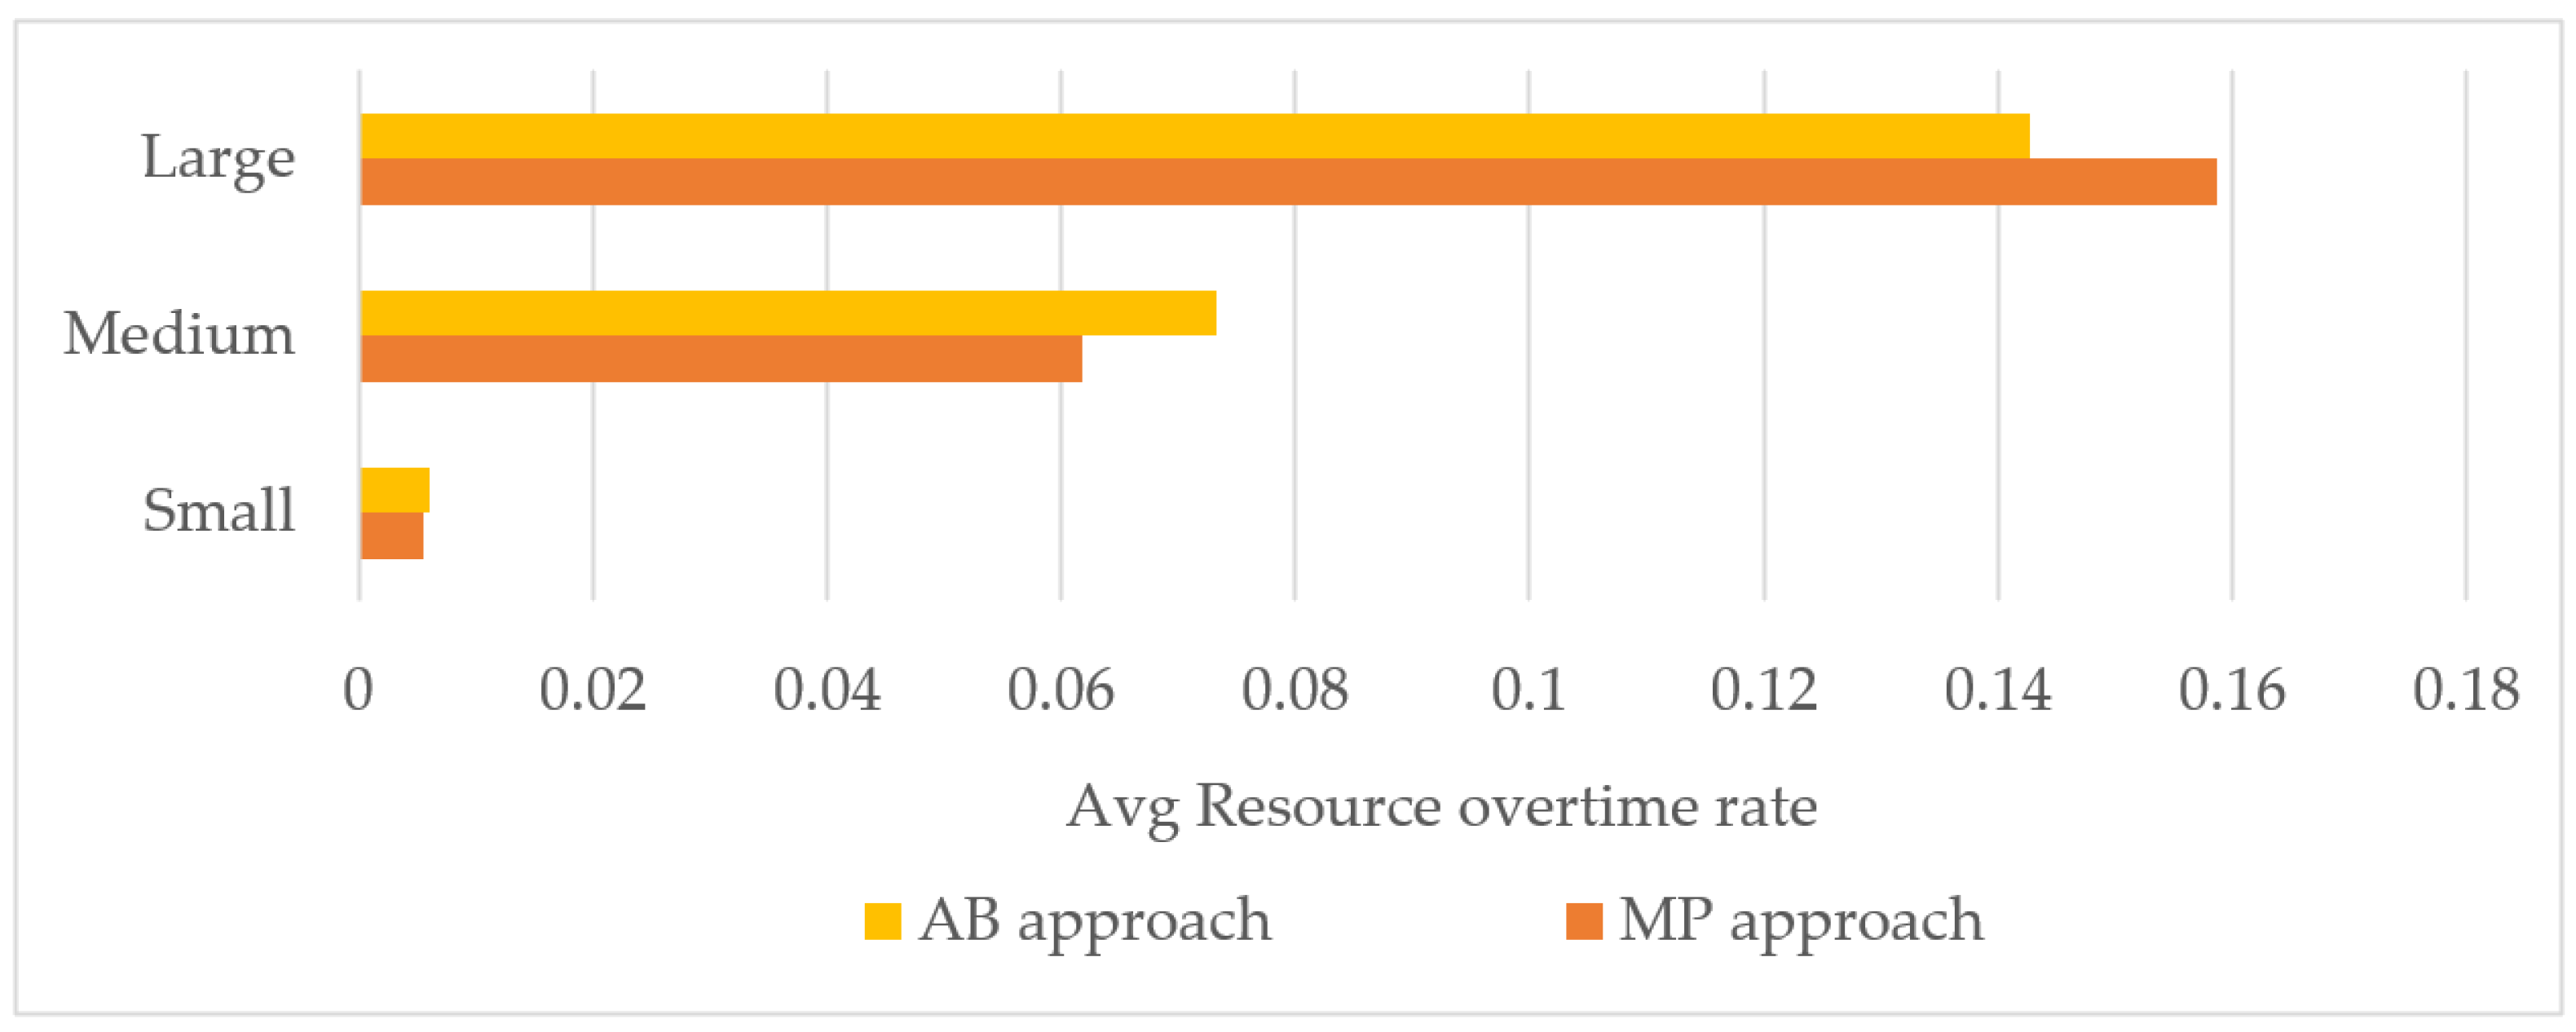
In order to quantify this evaluation, two measurement indexes, including “Service level” and “Average Resource Overtime” have been formulated. The former, presented by Equation (17), assesses how well the company is able to deliver customer orders on time. The latter one, presented by Equation (18), focuses on resource utilization and calculates how much additional resource capacity is used on average.
The “Service level” value would be (0, 1]. The higher the service level value, the more successful the factory has been in delivering the customer’s orders on time.
The “Average Resource Overtime” value would be [0, 1]. The less the average Resource overtime receives, the less load will be applied to the resources. Consequently, the factory is more successful in establishing balance on the production line.
The proposed MP approach tries to find the best solution for the resource capacity constraint while trying to minimize tardiness and overtime. These two objective functions simultaneously seek to satisfy the customer’s expectations and improve resource usage.
The AB approach enables anticipating the production planning by considering earliness besides tardiness and overtime. This approach by imposing earliness is more flexible. The earliness is activated within the AB approach when the factory has enough space for holding the final products until their due date.
4.1. Systematic Generation of Test Instances
In this section, various random instances, according to Table 1, have been generated to evaluate the performance of the MP and AP approaches. To make these two approaches comparable, it is assumed that the earliness is diactive in the AB approach.
In this study, the size of instances is defined through the number of customers. By increasing the number of customers, the size of the problem will increase from small to medium and large. In this regard, ten instances will be generated in three different sizes.
4.2. Results for Systematically Generated Test Instances
In this section, the two proposed approaches are evaluated through executing instances generated in Section 3.2. Two measurement indexes presented in Section 3 have been calculated to provide a clear evaluation. These quantities enable managers to have an explicit vision of the planning. While Table 2, Table 3 and Table 4 provide details of the calculations, Figure 4, Figure 5 and Figure 6 illustrate an overview of how these two approaches work.
4.3. Sensitivity Analysis of MP Approach
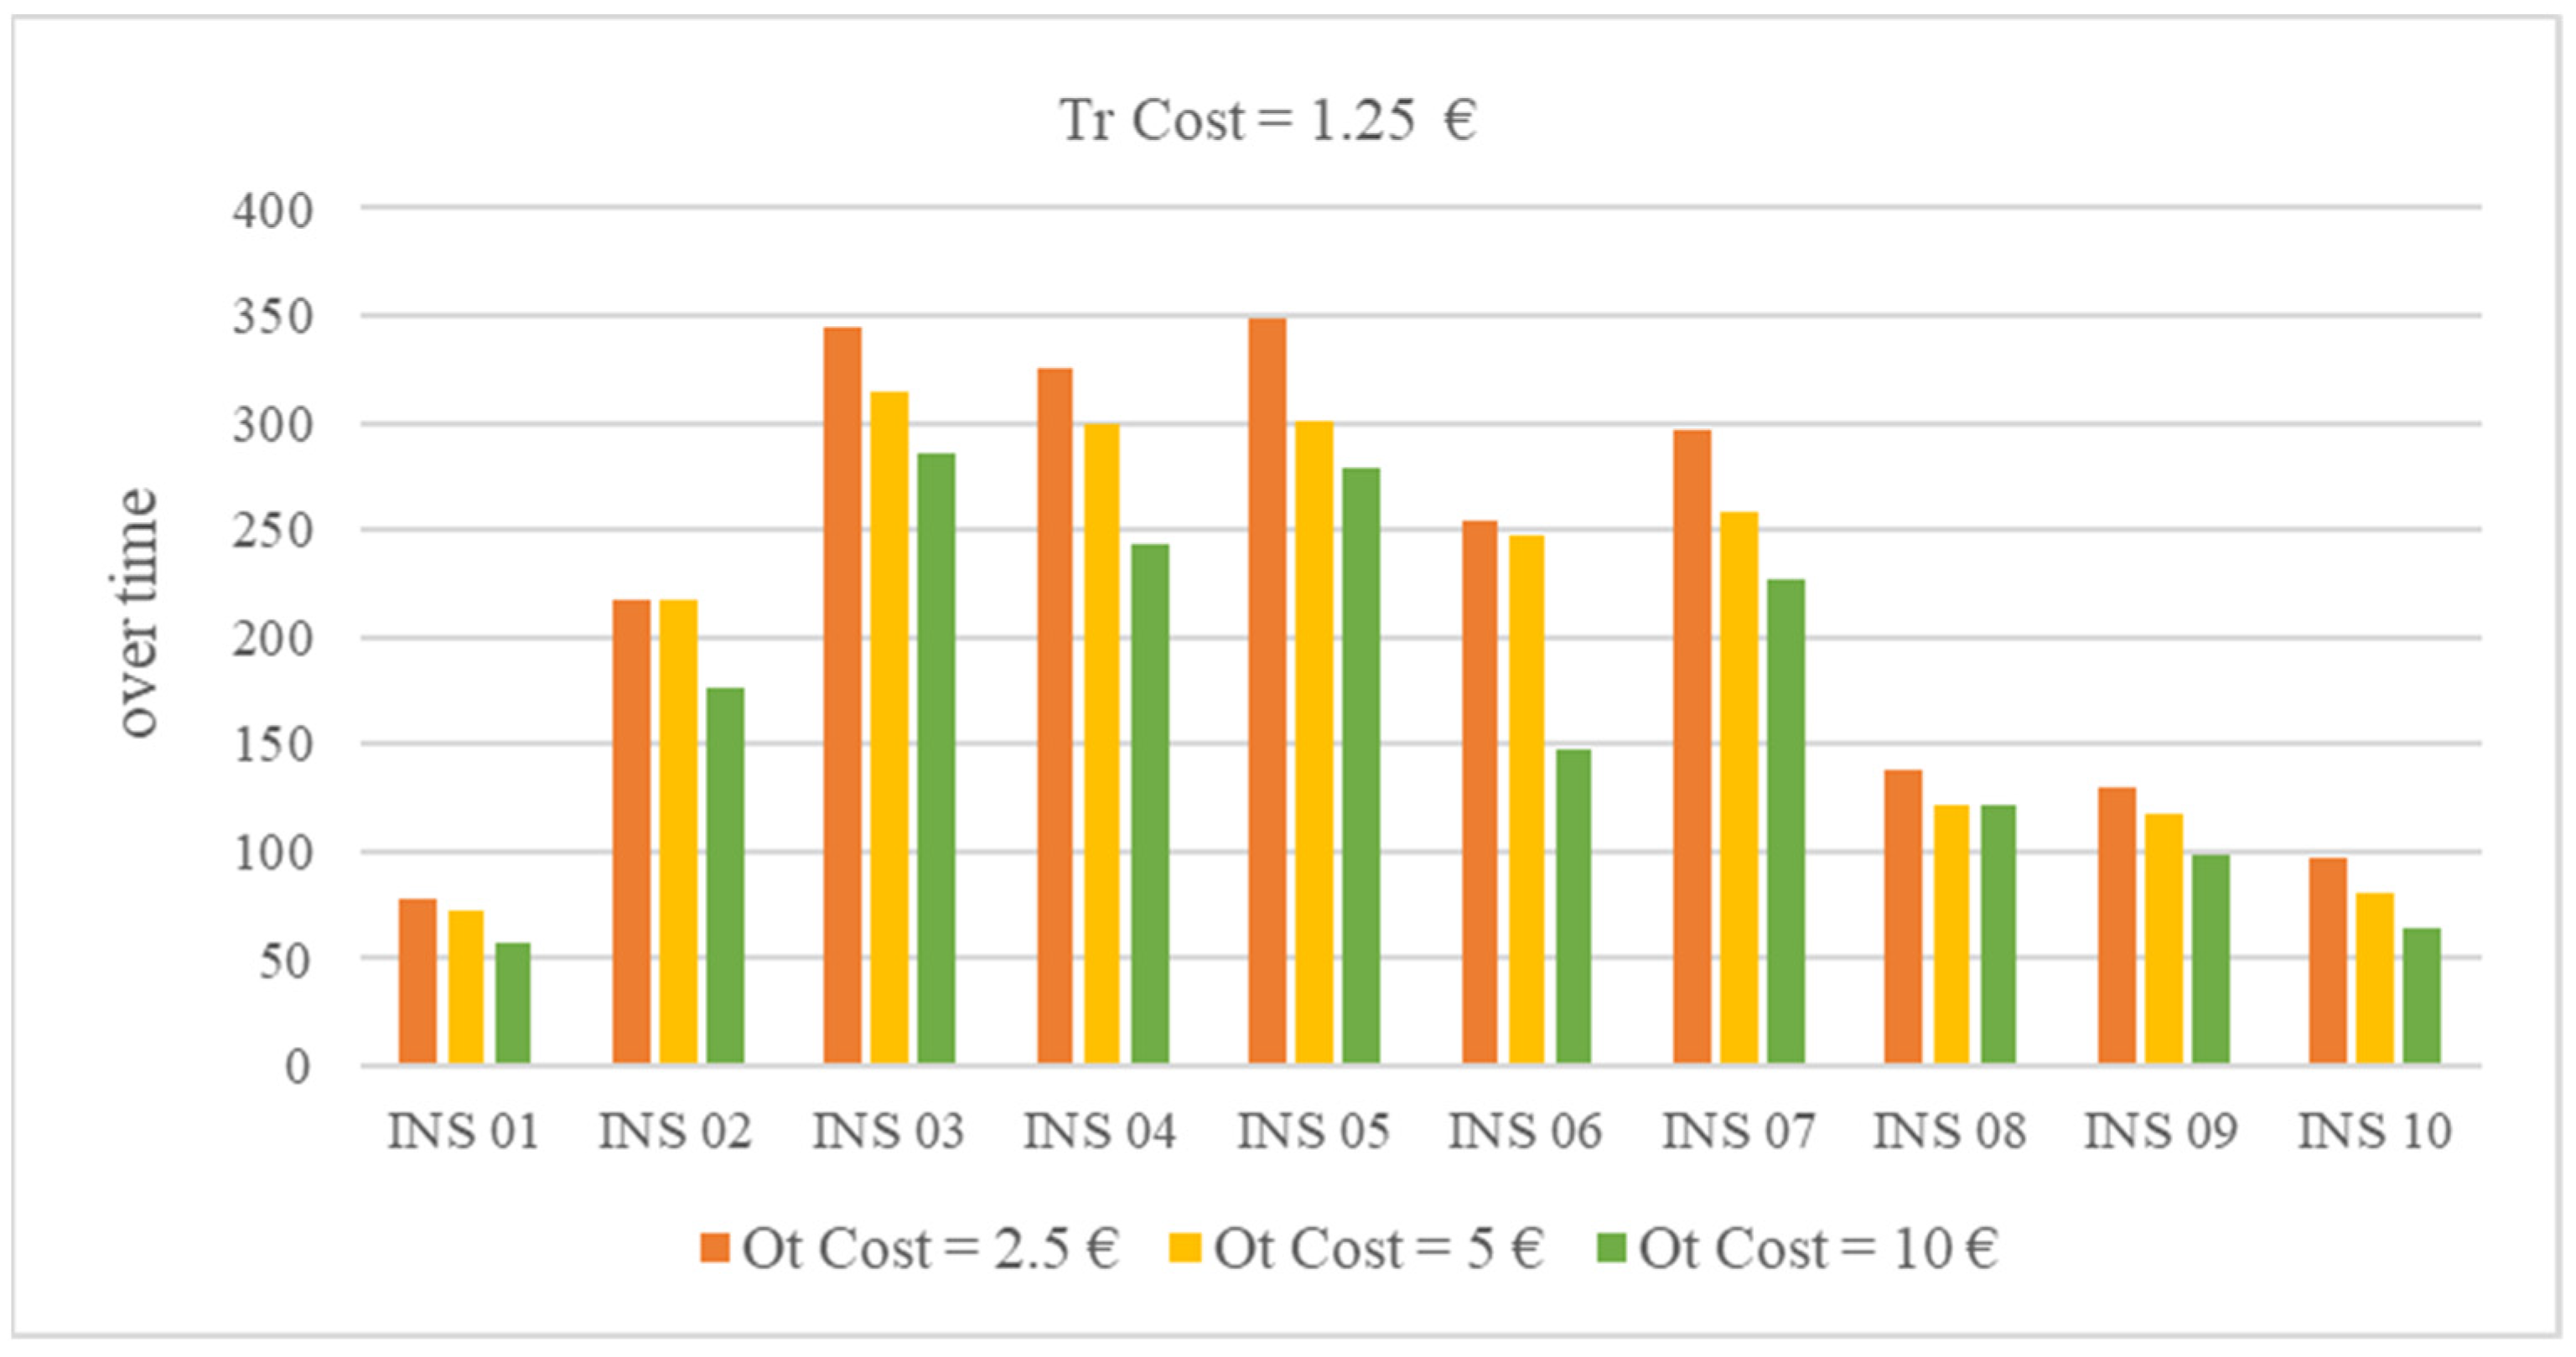
The proposed MP approach in this study aims to schedule the customer orders in a way that tries to satisfy the demands according to the company’s beneficiaries. The company’s beneficiary is specified through the penalty value for tardiness and overtime. The MP approach behaves differently with respect to the various value of penalties to establish the best balance. As the analysis of medium-sized instances has shown in Figure 7, Figure 8, Figure 9 and Figure 10 by raising the penalty value for tardiness, the mathematical model struggles to compensate by applying more overtime. This conduct is also valid for overtime penalty value.
4.4. Case Study and Sensitivity Analysis of AB Approach
According to the revealed information in Section 3.2, by increasing the dimension of instances, the required time for discovering an optimum solution by the MP approach will increase impressively. Since, in the real production environment, the number and the diversity of customer orders are far from what has been supposed previously, the case study was scrutinized in this section to unfold how the AB approach provides the solution for real-world production planning problems under various scenarios stemming from manager’s priorities.
Here, the case of production planning for the “Table production factory” for a one-year time horizon has been reviewed. This company accepts up to 35 customer orders in each time bucket (each time bucket is equal to the length of the month). The production procedure of this company is split into several main operations, which could be attributed to fabricating legs and top, constructing frames, and assembling and colouring the main body. The design features of each piece could be customized according to the customer’s desire. Figure 11 shows the Table production diagram.
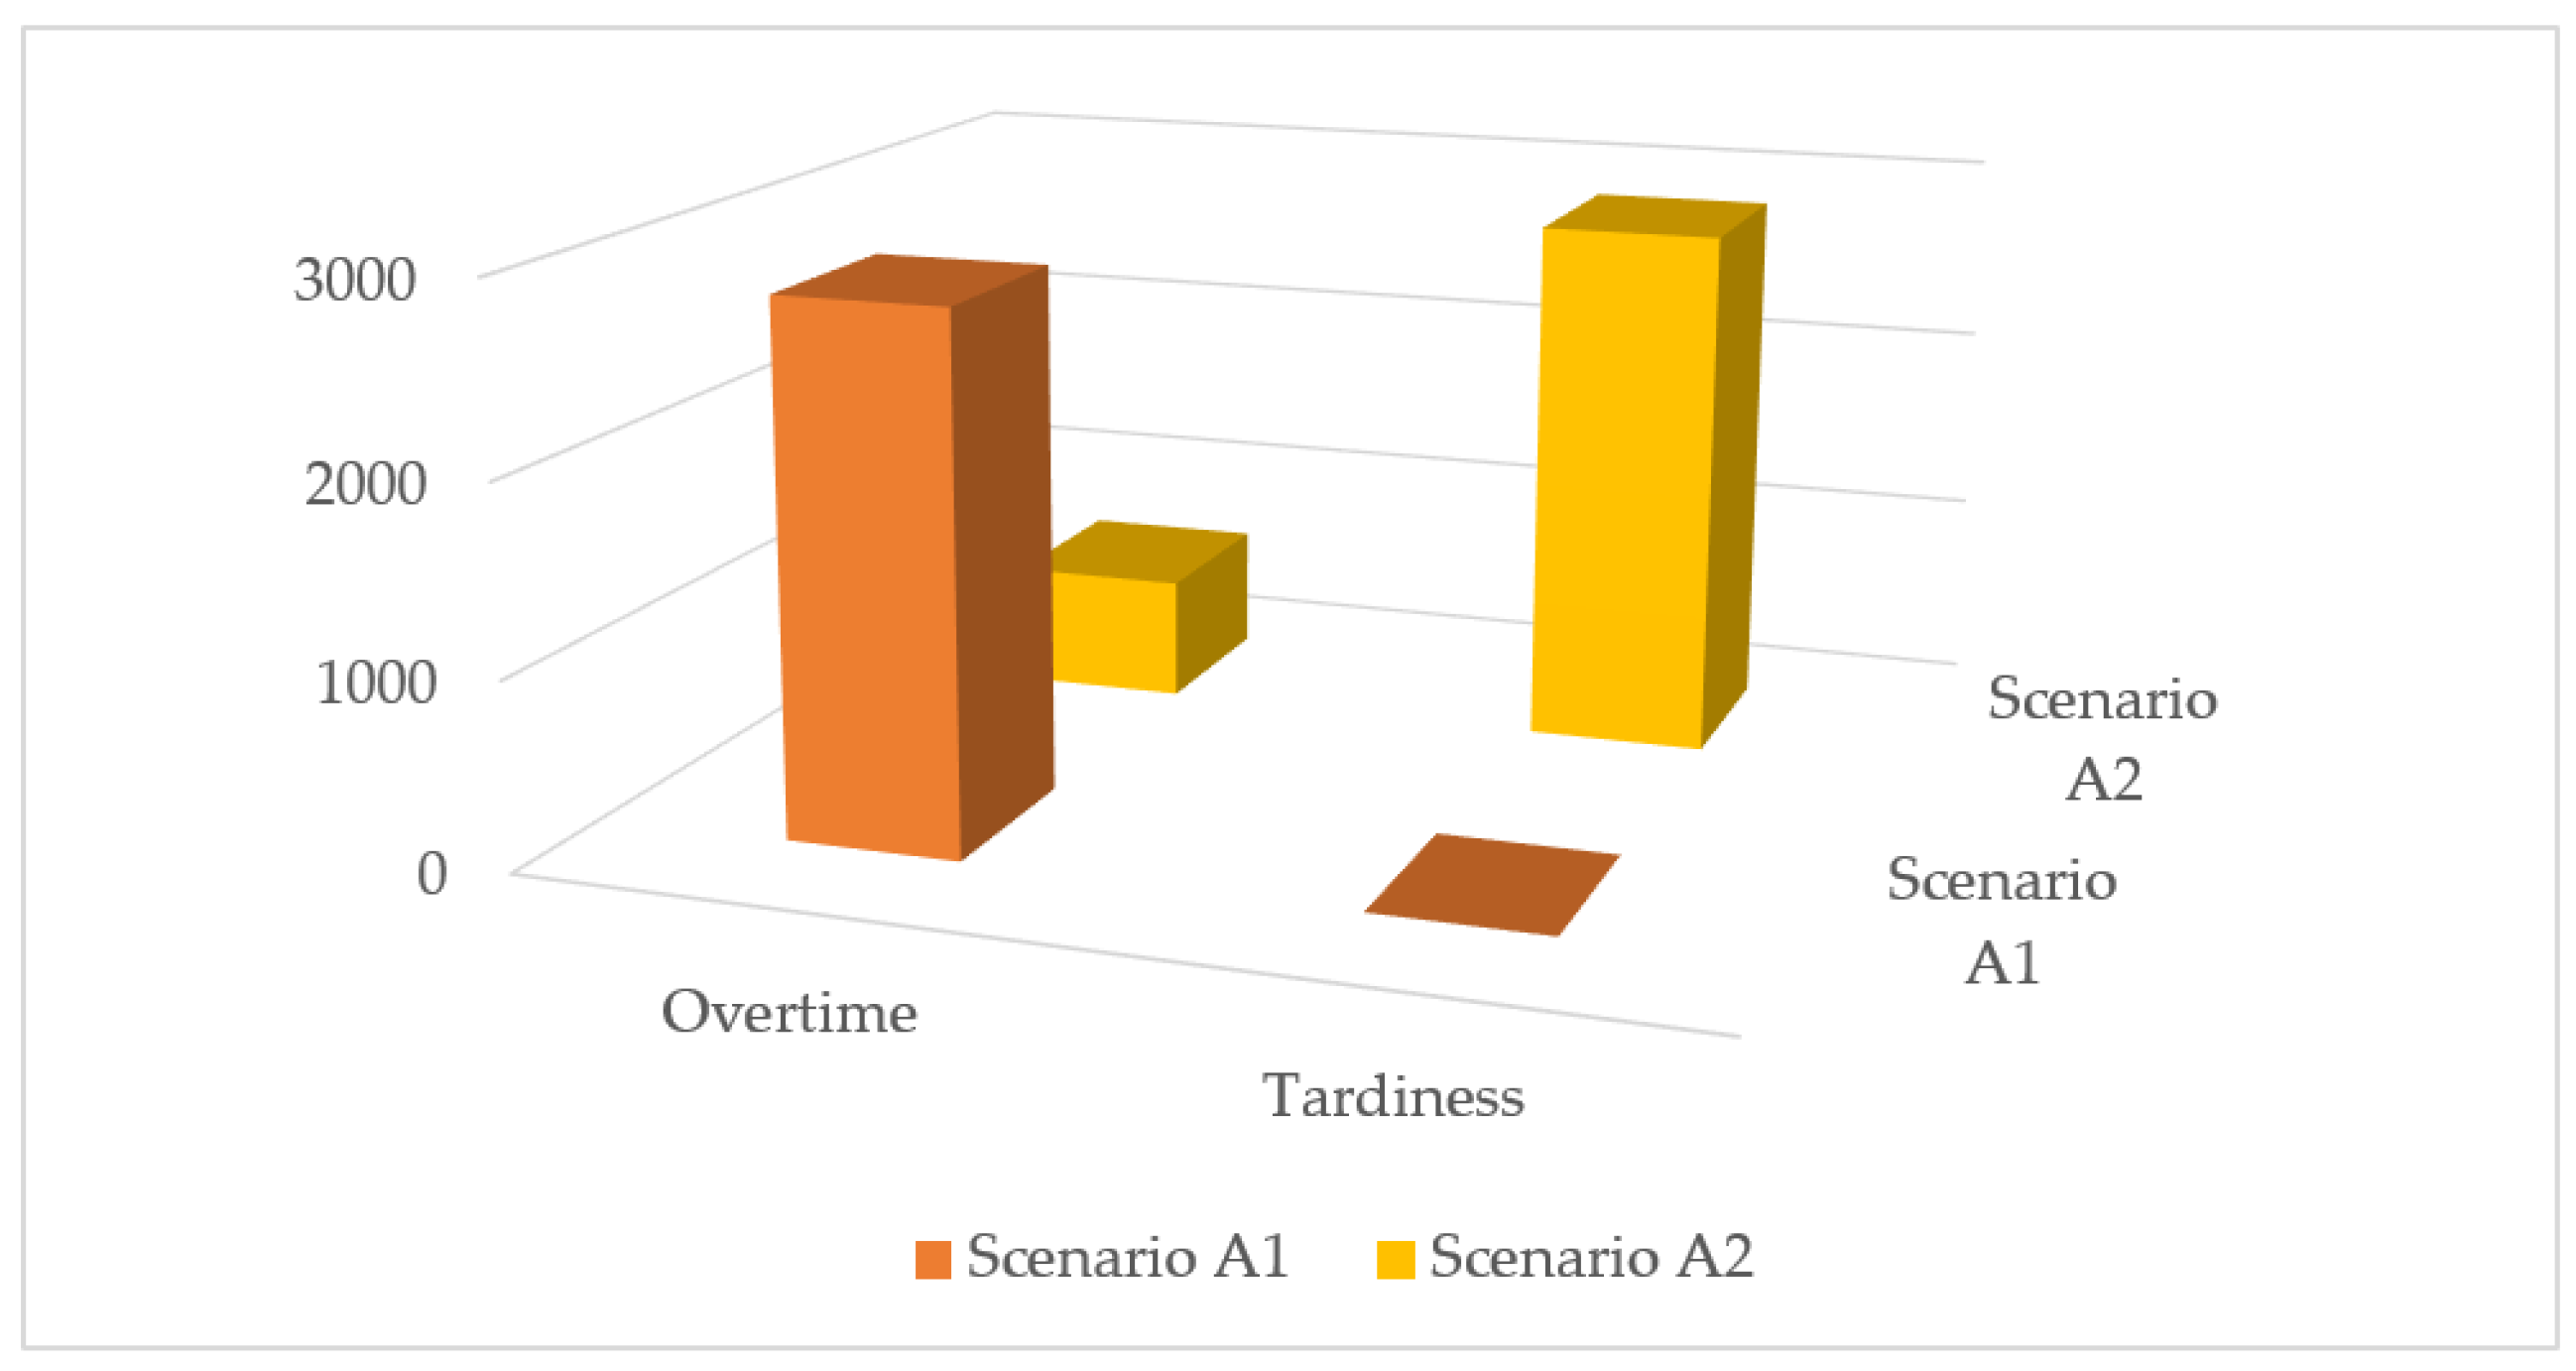
In order to assess the performance of the AB approach for the real problem, five different scenarios have been developed according to combinations of management’s priorities to discover how the AB approach reacts to various circumstances. These scenarios have been presented in Table 5. One notable feature of the AB approach is that the earliness strategy could be initiated if the production factory contains enough storage space. Following this, the proposed solution by the AB approach could easily make itself compatible with the nature of the production environment.
In Table 5, scenario type A supposes that the factory does not contain enough storage. Hence, producing the customers’ orders in advance is not possible, while strategy B assumes enough space for storing, and the company could anticipate production orders by imposing earliness. Strategy A and B include two and three subcategories, respectively. In each combination, one out of three criteria, including “Overtime”, “Tardiness”, and “Earliness,” has a high level of priority for the manager. In contrast, the rest of them have less priority. Inside each combination, the AB approach tries to find the proper solution by imposing the planning burden on low-level priority criteria and avoiding high-level priority criterion occurrence.
5. Conclusions
In today’s technologically advanced world, the variety of products available to the market is rising. As a result, customers’ expectations are always shifting and evolving. In this environment, if the manufacturers want to maintain and enhance their market share, they need to align their production strategies with customers’ expectations. Among various production strategies with their own special pros and cons, MTO’s production strategy strives to cover a wide range of customers’ expectations by relying on customization. The proper solution for its MPS should be provided to make this alignment successful.
In addition to the complex nature of MTO, the fluctuation in resource availability in the real production environment, which has been ignored by previous studies, restricts the production activities and makes MPS more complicated, and the previous result not applicable. Following this, the main concentration of this study is proposing a proper approach to respond to this requirement.
To this end, the mixed-integer linear programming model was formulated, which is capable of presenting the optimum solution for small and medium-sized factories that receive limited number of orders, while for the large-sized factories, where the amount and diversity of client orders are far from the rest, the MP approach is no longer capable of providing the optimum solution reasonably. To overcome this weakness, an innovative AB heuristic has been developed which provides an effective and flexible MPS planning. The striking feature that distinguishes the AB approach from MP is that it could anticipate the production planning by considering earliness when the factory has enough space to store the final products until their due date. Computational experiments on variously sized problems confirm the proposed AB approach’s efficiency, even for increasingly complex industrial instances in terms of flexibility and running time.
One outstanding point of this study is that a MPS which is defined through AB and MP approaches not only enables the businesses owner to maintain and raise their market share by maximizing customers’ service level, but also improves resource utilization. Both of these fulfillments which address the managers’ external and internal desires are accomplished by setting the goal of AB and MP approaches for MPS planning in the direction of minimizing tardiness and overtime cost.
This current study could be extended in various aspects. One limitation of this study is ignoring the operator availability for imposing the overtime on the resource. In some manufacturing environments, the production procedure is operators-dependent and overlooking this fact would make the results not applicable.
From the manufacturing perspective, this study could be extended for those factories that prepare a series of semi-finished products in advanced and assemble them according to customers’ orders.
From the supply chain viewpoint, an inevitable crucial requirement for establishing successful production is supplying the raw materials at the right time and in the sufficient quantity. This prerequisite could be combined with the current problem in future research studies, and broader planning could be provided for the manufacturers.
Author Contributions
Conceptualization, F.B.; methodology, F.B. and M.D.; software, F.B.; validation, F.B. and A.A.; investigation, M.D.; writing—original draft preparation, F.B. and M.D.; writing—review and editing, F.B. and M.D.; supervision, F.T., M.P. and G.P.; funding acquisition, F.T. All authors have read and agreed to the published version of the manuscript.
Funding
This research was funded by Regione Puglia: Project ‘Cooperative Supply Chain’ (CoopSC).
Conflicts of Interest
The authors declare no conflict of interest.
References
- Jans, R.; Degraeve, Z. Modeling Industrial Lot Sizing Problems: A Review. Int. J. Prod. Res. 2008, 46, 1619–1643. [Google Scholar] [CrossRef] [Green Version]
- Karimi, B.; Fatemi Ghomi, S.M.T.; Wilson, J.M. The Capacitated Lot Sizing Problem: A Review of Models and Algorithms. Omega 2003, 31, 365–378. [Google Scholar] [CrossRef]
- Mula, J.; Poler, R.; Garcia-Sabater, J.P. Capacity and Material Requirement Planning Modelling by Comparing Deterministic and Fuzzy Models. Int. J. Prod. Res. 2008, 46, 5589–5606. [Google Scholar] [CrossRef] [Green Version]
- Mula, J.; Poler, R.; García-Sabater, J.P.; Lario, F.C. Models for Production Planning under Uncertainty: A Review. Int. J. Prod. Econ. 2006, 103, 271–285. [Google Scholar] [CrossRef] [Green Version]
- Gansterer, M. Aggregate planning and forecasting in make-to-order production systems. Int. J. Prod. Econ. 2015, 170, 521–528. [Google Scholar] [CrossRef]
- Demartini, M.; Evans, S.; Tonelli, F. Digitalization Technologies for Industrial Sustainability. Procedia Manuf. 2019, 33, 264–271. [Google Scholar] [CrossRef]
- Rajagopalan, S. Make to order or make to stock: Model and application. Manag. Sci. 2002, 48, 241–256. [Google Scholar] [CrossRef]
- Stevenson, M.; Hendry, L.C.; Kingsman, B.G. A review of production planning and control: The applicability of key concepts to the make-to-order industry. Int. J. Prod. Res. 2005, 43, 869–898. [Google Scholar] [CrossRef]
- Mahdavisharif, M.; Cagliano, A.C.; Rafele, C. Investigating the Integration of Industry 4.0 and Lean Principles on Supply Chain: A Multi-Perspective Systematic Literature Review. Appl. Sci. 2022, 12, 586. [Google Scholar] [CrossRef]
- Zobolas, G.I.; Tarantilis, C.D.; Ioannou, G. Extending Capacity Planning by Positive Lead Times and Optional Overtime, Earliness and Tardiness for Effective Master Production Scheduling. Int. J. Prod. Res. 2008, 46, 3359–3386. [Google Scholar] [CrossRef]
- Supply Chain Management and Advanced Planning; Stadtler, H.; Kilger, C. (Eds.) Springer: Berlin/Heidelberg, Germany, 2008. [Google Scholar] [CrossRef]
- Díaz-Madroñero, M.; Mula, J.; Peidro, D. A Review of Discrete-Time Optimization Models for Tactical Production Planning. Int. J. Prod. Res. 2014, 52, 5171–5205. [Google Scholar] [CrossRef]
- Dolgui, A.; Ivanov, D.; Sethi, S.P.; Sokolov, B. Scheduling in Production, Supply Chain and Industry 4.0 Systems by Optimal Control: Fundamentals, State-of-The-Art and Applications. Int. J. Prod. Res. 2018, 57, 411–432. [Google Scholar] [CrossRef]
- Englberger, J.; Herrmann, F.; Manitz, M. Two-Stage Stochastic Master Production Scheduling under Demand Uncertainty in a Rolling Planning Environment. Int. J. Prod. Res. 2016, 54, 6192–6215. [Google Scholar] [CrossRef]
- Caner Taşkın, Z.; Tamer Ünal, A. Tactical Level Planning in Float Glass Manufacturing with Co-Production, Random Yields and Substitutable Products. Eur. J. Oper. Res. 2009, 199, 252–261. [Google Scholar] [CrossRef] [Green Version]
- Inderfurth, K.; Lindner, G.; Rachaniotis, N.P. Lot Sizing in a Production System with Rework and Product Deterioration. Int. J. Prod. Res. 2005, 43, 1355–1374. [Google Scholar] [CrossRef]
- Loukil, T.; Teghem, J.; Tuyttens, D. Solving Multi-Objective Production Scheduling Problems Using Metaheuristics. Eur. J. Oper. Res. 2005, 161, 42–61. [Google Scholar] [CrossRef]
- Tometzki, T.; Engell, S. Systematic Initialization Techniques for Hybrid Evolutionary Algorithms for Solving Two-Stage Stochastic Mixed-Integer Programs. IEEE Trans. Evol. Comput. 2011, 15, 196–214. [Google Scholar] [CrossRef]
- Amorim, P.; Günther, H.-O.; Almada-Lobo, B. Multi-Objective Integrated Production and Distribution Planning of Perishable Products. Int. J. Prod. Econ. 2012, 138, 89–101. [Google Scholar] [CrossRef]
- Karimi-Nasab, M.; Aryanezhad, M.B. A Multi-Objective Production Smoothing Model with Compressible Operating Times. Appl. Math. Model. 2011, 35, 3596–3610. [Google Scholar] [CrossRef]
- Karimi-Nasab, M.; Ghomi, S.M. Multi-Objective Production Scheduling with Controllable Processing Times and Sequence-Dependent Setups for Deteriorating Items. Int. J. Prod. Res. 2012, 50, 7378–7400. [Google Scholar] [CrossRef]
- Mansouri, S.A.; Golmohammadi, D.; Miller, J. The Moderating Role of Master Production Scheduling Method on Throughput in Job Shop Systems. Int. J. Prod. Econ. 2019, 216, 67–80. [Google Scholar] [CrossRef]
- Golmohammadi, D. A Neural Network Decision-Making Model for Job-Shop Scheduling. Int. J. Prod. Res. 2013, 51, 5142–5157. [Google Scholar] [CrossRef]
- Guillaume, R.; Thierry, C.; Zieliński, P. Robust Material Requirement Planning with Cumulative Demand under Uncertainty. Int. J. Prod. Res. 2017, 55, 6824–6845. [Google Scholar] [CrossRef]
- Sahin, F.; Powell Robinson, E.; Gao, L.-L. Master production scheduling policy and rolling schedules in a two-stage make-to-order supply chain. Int. J. Prod. Econ. 2008, 115, 528–541. [Google Scholar] [CrossRef]
- Powell Robinson, E.; Sahin, F.; Gao, L.-L. Master production schedule time interval strategies in make-to-order supply chains. Int. J. Prod. Res. 2008, 46, 1933–1954. [Google Scholar] [CrossRef]
- Sawik, T. Multi-objective master production scheduling in make-to-order manufacturing. Int. J. Prod. Res. 2007, 45, 2629–2653. [Google Scholar] [CrossRef]
- Nedaei, H.; Mahlooji, H. Joint multi-objective master production scheduling and rolling horizon policy analysis in make-to-order supply chains. Int. J. Prod. Res. 2014, 52, 2767–2787. [Google Scholar] [CrossRef]
- Yin, Y.; Stecke, K.E.; Li, D. The evolution of production systems from Industry 2.0 through Industry 4.0. Int. J. Prod. Res. 2018, 56, 848–861. [Google Scholar] [CrossRef] [Green Version]
- Gu, X.; Koren, Y. Mass-Individualisation—The twenty first century manufacturing paradigm. Int. J. Prod. Res. 2022. [Google Scholar] [CrossRef]
- Kundu, K.; Rossini, M.; Portioli-Staudacher, A. Analysing the impact of uncertainty reduction on WL methods in MTO flow shops. Prod. Manuf. Res. 2018, 6, 328–344. [Google Scholar] [CrossRef] [Green Version]
- Lee, C.H.; Chen, C.H.; Lin, C.; Li, F.; Zhao, X. Developing a Quick Response Product Configuration System under Industry 4.0 Based on Customer Requirement Modelling and Optimization Method. Appl. Sci. 2019, 9, 5004. [Google Scholar]
- Rahman, H.F.; Janardhanan, M.N.; Nielsen, I.E. Real-Time Order Acceptance and Scheduling Problems in a Flow Shop Environment Using Hybrid GA-PSO Algorithm. IEEE Access 2019, 7, 112742–112755. [Google Scholar] [CrossRef]
- Micieta, B.; Binasova, V.; Lieskovsky, R.; Krajcovic, M.; Dulina, L. Product Segmentation and Sustainability in Customized Assembly with Respect to the Basic Elements of Industry 4.0. Sustainability 2019, 11, 6057. [Google Scholar] [CrossRef] [Green Version]
- Woschank, M.; Dallasega, P.; Kapeller, J.A. The Impact of Planning Granularity on Production Planning and Control Strategies in MTO: A Discrete Event Simulation Study. Procedia Manuf. 2020, 51, 1502–1507. [Google Scholar] [CrossRef]
- Garey, M.R.; Johnson, D.S. Computers and Intractability: A Guide to the Theory of NP-Completeness; W.H. Freeman and Co.: New York, NY, USA, 2003. [Google Scholar]
- Demartini, M.; Tonelli, F.; Pacella, M.; Papadia, G. A Review of Production Planning Models: Emerging Features and Limitations Compared to Practical Implementation. Procedia CIRP 2021, 104, 588–593. [Google Scholar] [CrossRef]
- Pacella, M.; Papadia, G. Evaluation of Deep Learning with Long Short-Term Memory Networks for Time Series Forecasting in Supply Chain Management. Procedia CIRP 2021, 99, 604–609. [Google Scholar] [CrossRef]
- Bernocco, M.; Schenone, M.; Queirolo, F.; Tonelli, F. A supervised multi-agent approach for aps in multi-site production systems for demand validation and evaluation. Simul. Ser. 2003, 35, 823–828. [Google Scholar]
- Amaro, G.; Hendry, L.; Kingsman, B. Competitive Advantage, Customisation and a New Taxonomy for Non Make-To-Stock Companies. Int. J. Oper. Prod. Manag. 1999, 19, 349–371. [Google Scholar] [CrossRef]
- Rohaninejad, M.; Sahraeian, R.; Nouri, B.V. Minimising the Total Cost of Tardiness and Overtime in a Resumable Capacitated Job Shop Scheduling Problem by Using an Efficient Hybrid Algorithm. Int. J. Ind. Syst. Eng. 2017, 26, 318. [Google Scholar] [CrossRef]
Figure 1.
The MPS/RCCP component of the Cooperative supply chain framework.

Figure 2.
The Service Lane Planning concept–Note Adapted from Bernocco et al. (2003).

Figure 3.
Multi-agent planning architecture (AB_RCCP)–Note Adapted from Bernocco et al. (2003).

Figure 4.
Average service level for small, medium, and large instances for MP and AP approach.

Figure 5.
Average Resource overtime for small, medium, and large instances for MP and AP approach.

Figure 6.
Average Run time for small, medium, and large instances for MP and AP approach.

Figure 7.
The amount of imposed “Tardiness” with respect to various overtime penalties.

Figure 8.
The amount of imposed “Overtime” with respect to various overtime penalties.

Figure 9.
The amount of imposed “Tardiness” with respect to various tardiness penalties.

Figure 10.
The amount of imposed “Overtime” with respect to various tardiness penalties.

Figure 11.
Production process diagram of “Table”.

Figure 12.
The comparison between Scenario A1 and A2.

Figure 13.
The comparison among Scenario B1, B2, and B3.


Table 1.
Parameter adjustment.
| Parameters | Notation | The Function of Generation |
|---|---|---|
| The quantity of customer orders i | The uniform distribution between [1, 10] | |
| The due date for customer order i | The uniform distribution between [5, 25] | |
| Tardiness cost for customer order | The uniform distribution between [0.625, 2.5] | |
| The overtime cost of resource | The uniform distribution between [2.5, 10] |
Table 2.
Result of small size problem (EC PART I).
| INS | Service Level | Average Resource Overtime | Time (s) | |||
|---|---|---|---|---|---|---|
| MP | AB | MP | AB | MP | AB | |
| 01 | 0.9976 | 0.9937 | 0.0080 | 0.0161 | 15 | 9 |
| 02 | 0.9950 | 0.9891 | 0.0009 | 0.0000 | 18 | 9 |
| 03 | 1.0000 | 0.9947 | 0.0000 | 0.0000 | 17 | 9 |
| 04 | 0.9979 | 0.9882 | 0.0066 | 0.0000 | 15 | 9 |
| 05 | 1.0000 | 0.9903 | 0.0057 | 0.0123 | 15 | 9 |
| 06 | 0.9953 | 0.9896 | 0.0038 | 0.0000 | 14 | 10 |
| 07 | 0.9855 | 0.9585 | 0.0099 | 0.0204 | 18 | 10 |
| 08 | 0.9988 | 0.9944 | 0.0071 | 0.0118 | 18 | 9 |
| 09 | 0.9933 | 0.9760 | 0.0038 | 0.0000 | 14 | 9 |
| 10 | 0.9938 | 0.9706 | 0.0090 | 0.0000 | 18 | 11 |
| Avg | 0.9927 | 0.9845 | 0.0055 | 0.0061 | 16.2 | 9.4 |
Table 3.
Result of medium size problem (EC PART II).
| INS | Service Level | Average Resource Overtime | Time (s) | |||
|---|---|---|---|---|---|---|
| MP | AB | MP | AB | MP | AB | |
| 01 | 0.9975 | 0.9896 | 0.0208 | 0.0771 | 1004 | 15 |
| 02 | 0.9969 | 0.9921 | 0.0885 | 0.1084 | 1004 | 14 |
| 03 | 0.9899 | 0.9883 | 0.1354 | 0.1382 | 1007 | 13 |
| 04 | 0.9891 | 0.9867 | 0.1283 | 0.1387 | 1025 | 13 |
| 05 | 0.9963 | 0.9781 | 0.0918 | 0.0946 | 1004 | 11 |
| 06 | 0.9950 | 0.9791 | 0.0430 | 0.0454 | 1004 | 10 |
| 07 | 0.9996 | 0.9917 | 0.0724 | 0.0809 | 1007 | 9 |
| 08 | 0.9980 | 0.9865 | 0.0080 | 0.0108 | 1004 | 10 |
| 09 | 0.9994 | 0.9878 | 0.0184 | 0.0213 | 1005 | 8 |
| 10 | 0.9986 | 0.9983 | 0.0123 | 0.0179 | 1003 | 10 |
| Avg | 0.9960 | 0.9878 | 0.0618 | 0.0733 | 1006.7 | 11.3 |
Table 4.
Result of large size problem (EC PART III).
| INS | Service Level | Resource Overtime | Time (s) | |||
|---|---|---|---|---|---|---|
| MP | AB | MP | AB | MP * | AB | |
| 01 | 0.9403 | 0.9928 | 0.0971 | 0.0724 | More than 3600 | 16 |
| 02 | 0.9566 | 0.9895 | 0.1458 | 0.1501 | More than 3600 | 19 |
| 03 | 0.9296 | 0.9865 | 0.1941 | 0.1828 | More than 3600 | 20 |
| 04 | 0.9510 | 0.9937 | 0.1847 | 0.2093 | More than 3600 | 17 |
| 05 | 0.9651 | 0.9940 | 0.1226 | 0.1321 | More than 3600 | 18 |
| 06 | 0.9417 | 0.9927 | 0.1117 | 0.1387 | More than 3600 | 16 |
| 07 | 0.9550 | 0.9924 | 0.1960 | 0.2334 | More than 3600 | 15 |
| 08 | 0.9854 | 0.9909 | 0.1875 | 0.0180 | More than 3600 | 17 |
| 09 | 0.9745 | 0.9938 | 0.1728 | 0.1198 | More than 3600 | 16 |
| 10 | 0.9642 | 0.9929 | 0.1747 | 0.1705 | More than 3600 | 15 |
| Avg | 0.9573 | 0.9919 | 0.1587 | 0.1427 | 16.9 | |
* The Mp approach requires more than 3600 s to provide an optimum result. The best result at 3600 s has been presented in this column.
Table 5.
Scenarios for case study.
| Scenario | Over Time | Tardiness | Earliness | ||||
|---|---|---|---|---|---|---|---|
| High Priority | Less Priority | High Priority | Less Priority | High Priority | Less Priority | ||
| A | A1 | ✓ | ✓ | is not activated | |||
| A2 | ✓ | ✓ | is not activated | ||||
| B | B1 | ✓ | ✓ | ✓ | |||
| B2 | ✓ | ✓ | ✓ | ||||
| B3 | ✓ | ✓ | ✓ | ||||
Table 6.
Computational results for “Case study”.
| Scenario | Over Time (h) | Tardiness (h) | Earliness (h) | Run Time (s) | |
|---|---|---|---|---|---|
| A | A1 | 2822 | 0 | is not activated | 19 |
| A2 | 660 | 2843 | is not activated | 20 | |
| B | B1 | 2822 | 0 | 308 | 19 |
| B2 | 563 | 2920 | 232 | 22 | |
| B3 | 437 | 0 | 3655 | 23 | |
Publisher’s Note: MDPI stays neutral with regard to jurisdictional claims in published maps and institutional affiliations. |
© 2022 by the authors. Licensee MDPI, Basel, Switzerland. This article is an open access article distributed under the terms and conditions of the Creative Commons Attribution (CC BY) license (https://creativecommons.org/licenses/by/4.0/).
Share and Cite
MDPI and ACS Style
Bagheri, F.; Demartini, M.; Arezza, A.; Tonelli, F.; Pacella, M.; Papadia, G. An Agent-Based Approach for Make-To-Order Master Production Scheduling. Processes 2022, 10, 921. https://doi.org/10.3390/pr10050921
AMA Style
Bagheri F, Demartini M, Arezza A, Tonelli F, Pacella M, Papadia G. An Agent-Based Approach for Make-To-Order Master Production Scheduling. Processes. 2022; 10(5):921. https://doi.org/10.3390/pr10050921
Chicago/Turabian StyleBagheri, Faezeh, Melissa Demartini, Alessandra Arezza, Flavio Tonelli, Massimo Pacella, and Gabriele Papadia. 2022. "An Agent-Based Approach for Make-To-Order Master Production Scheduling" Processes 10, no. 5: 921. https://doi.org/10.3390/pr10050921
Note that from the first issue of 2016, this journal uses article numbers instead of page numbers. See further details here.