
Two-Dimensional, Two-Layer Quality Regression Model Based Batch Process Monitoring


College of Information Science and Engineering, Northeastern University, Shenyang 110819, China
*
Author to whom correspondence should be addressed.
Processes 2022, 10(1), 43; https://doi.org/10.3390/pr10010043
Submission received: 4 December 2021
/
Revised: 23 December 2021
/
Accepted: 23 December 2021
/
Published: 27 December 2021
(This article belongs to the Special Issue Process Control and Smart Manufacturing for Industry 4.0)
Abstract
:In this paper, a two-dimensional, two-layer quality regression model is established to monitor multi-phase, multi-mode batch processes. Firstly, aiming at the multi-phase problem and the multi-mode problem simultaneously, the relations among modes and phases are captured through the analysis between process variables and quality variables by establishing a two-dimensional, two-layer regression partial least squares (PLS) model. The two-dimensional regression traces the intra-batch and inter-batch characteristics, while the two-layer structure establishes the relationship between the target process and historical modes and phases. Consequently, online monitoring is carried out for multi-phase, multi-mode batch processes based on quality prediction. In addition, the online quality prediction and monitoring results based on the proposed method and those based on the traditional phase mean PLS method are compared to prove the effectiveness of the proposed method.
1. Introduction
Batch process is a way of production closely related to people’s life in the modern process industry. It is now widely used in the production and preparation of small-batch and high value-added products to meet the rapidly changing market demand, such as in the production of fine chemical industry, food, polymer reaction, metal processing, biopharmaceutical, etc. Batch operation process characteristics are more complex and have richer data statistical characteristics than the continuous industrial process. Firstly, a batch cycle usually consists of several fixed phases, and different phases in each batch may show different potential behaviors, which is called multi-phase characteristic. Multi-phase characteristic is one kind of intra-batch characteristic evolution; it is one characteristic evolution along the time direction within each batch. Secondly, in the process of industrial production, due to the change of operating conditions, there are many different stable working points. Certain number of batches within the same working points belong to the same mode, which is called multi-mode characteristic. Multi-mode characteristic is one kind of inter-batch characteristic evolution; it is one characteristic evolution along the batch direction through the process. Multi-phase characteristic and multi-mode characteristic exist in batch processes simultaneously, which makes the batch processes complex and interesting for researchers.
At the end of the 1980s, principal component analysis (PCA) [1] and partial least squares (PLS) [2], as the focus of multivariate statistical modeling methods, began to be applied to statistical modeling, online monitoring, quality control, and fault diagnosis based on process data [3,4,5]. In order to maximize their effectiveness, it is necessary to extend these methods to batch processes. In the mid-1990s, Nomikos and MacGregor proposed multilinear principal component analysis (MPCA) and multiway partial least squares regression (MPLS) [6,7]. After, many international research groups invested a lot of manpower and material resources to carry out the research work for batch processes. In 1998, Wold et al. described an approach to multivariate batch process modeling and monitoring, which was focused on following the evolution of the batch and oriented to the monitoring of the individual time points [8]. In 2000, a new methodology for analyzing batch and semi-batch process variable trajectories was proposed for process development and optimization, which was aimed at identifying trajectory features, such as cumulative effects and time-specific effects, of process variables on the final product quality [9]. In 2003, Hyun-Woo et al. proposed a new method for predicting the future observations of the batch that is currently being operated. In their work, the past batch trajectory which is deemed the most similar the new batch was selected from the batch library and used as the basis for predicting the unknown part of the new batch [10]. In 2004, Lu et al. proposed a stage-based sub-PCA modeling method for multistage batch processes, based on the recognition of a batch process may be divided into several operation stages [11]. In 2014, Zhao et al. analyzed the inter-batch evolution and proposed a process monitoring strategy based on inter-batch mode division, where reference windows were used to judge the variance of the process and identify new process modes [12].
In a great deal of the work, multi-phase and multi-mode problems are usually investigated and handled separately as two key characteristics of batch processes.
The multi-phase nature is an important nature of batch processes, and many research studies have been done for process monitoring and quality prediction of batch processes [13,14,15]. Phases have their own characteristics different from each other, which should be captured by different models. As the basic component of the batch process, phases are the research focus, and even more important than the production modes because phases are indispensable to finish one batch production and obtain the final product. Around the multi-phase characteristic, phase division [11], and uneven-durations [15] are the main problems that the researchers are interested in, and they have been resolved by different strategies. Recently, a multi-phase residual recursive model was established using each quality residual of the phase mean models to connect the contributions of the multiple phases together for quality prediction [16]. An evolutionary PLS method was proposed for process monitoring to deal with the calibration and modeling problems about operation switching [17].
Because of different production requirements, multiple production modes happen and should also be modeled correctly. Different from the continuous process, a mode for batch processes includes several batches, which is a classification along the batch direction. Integrated model [18] and specific model [19] are the traditional strategies to handle the multi-mode problem. Moreover, then, the relationship between modes was analyzed for mode division in process monitoring of time-varying batch processes [12]. In addition, mode relationship analysis has been improved for multi-mode batch process quality prediction [20]. Recently, a multi-mode Fisher discriminant analysis based process monitoring method was proposed to overcome the limitation of the single operation mode assumption [21].
As stated before, the multi-phase characteristic and the multi-mode characteristic are both important natures in batch processes of great significance for process monitoring and quality prediction. Although a great deal of work has been done around these two problems, they are usually investigated and handled separately in each work, or only one is the research focus, and the other is dealt with by some simple methods. That is, the previous analysis of the multi-phase and multi-mode problems tends to focus on only one direction, intra or inter batches, rather than processing simultaneously in both two directions. It has interested the author to deal with these two problems at the same time. Recently, a complete set of process modeling methods attempted to cover the process characteristic evolution problem in both the intra-batch and inter-batch directions [22]. Due to the complexity of the problem, the idea of the proposed method is firstly to handle the problem in two directions separately, and then combine the two strategies. This kind of approach is flexible to select appropriate modeling methods in two directions. However, choosing the method to deal with problems in two directions, respectively, rather than solving the problem from a unified perspective, to some extent, is easy to cause the separation of methods. It is hard to give a comprehensive explanation of the process characteristics under the two irrelevant methods. In addition, when the methods in both directions need to be jointed, the method structure is relatively complex and difficult to comprehend and implement. Therefore, it is necessary to further improve the existing methods by proposing a novel united strategy framework according to the two-dimensional evolution characteristics of the batch processes. That is, it is necessary to study the method of solving the process evolution in both directions from the overall perspective of the two-dimensional evolution of batch processes. Based on the above analysis, the research focus in this paper is to establish the overall framework of tracking the two-dimensional evolution based on a two-dimensional regression model. Moreover, the basic one-dimensional regression model used in the above framework should be selected appropriately to have the ability to establish the relationship between the target process and historical process (modes or phases). The between-mode quality analysis [20], which has a two-layer mode analysis structure, is adopted, and the object is changed to processes (modes or phases), rather than modes. By the two-layer regression analysis strategy, the relationship between the target process and historical processes will be established.
Therefore, in this work, by expanding two-layer regression analysis strategy from dealing with one direction process evolution into two direction process evolutions under the two-dimensional framework, both the intra-batch and inter-batch characteristics will be traced for multi-phase and multi-mode processes, based on which a process monitoring strategy is developed. The two-dimensional regression traces the intra-batch and inter-batch characteristics, while the two-layer structure establishes the relationship between the target process and historical modes and phases. Firstly, aiming at the multi-mode problem and the multi-phase problem simultaneously, the relations among modes and phases are captured through the analysis of the characteristics of each mode and each phase in the batch process by establishing a two-dimensional regression model. This model is expanded from the two-layer between-mode analyzing model which can extract useful quality-related information from historical modes. In the first layer of relation analysis, for all historical processes, different quality regression models are developed by PLS and according regression parameters are obtained. In addition, by applying these regression parameters to the process variables of the target process, a series of assumed quality predictions would be obtained. Then, in the second layer, PLS is conducted between the assumed quality predictions and real qualities of the target process to judge the relationship between the target process and the historical processes. Based on the two-dimensional, two-layer regression model, for the target process, quality prediction can be conducted using all available quality information underling both the intra-batch and inter-batch evolutions. Consequently, online monitoring is carried out for multi-phase, multi-mode batch processes based on quality prediction. In addition, the online quality prediction and monitoring results based on the proposed method and those based on the traditional method are compared to prove the effectiveness of the proposed method. In the traditional strategy [16,23], historical modes are considered together and modeled by PLS method to include more mode information and avoid the overfitting problem. However, for the multi-phase problem, several phase mean models are built for different phases, respectively. To be fair, all concerned modes are available for modeling in both the proposed method and the traditional method.
The remaining work of this paper includes the following aspects: firstly, the Section 2 introduces the establishment of two-dimensional, two-layer regression model and the principle of online monitoring. The Section 3 briefly introduces the characteristics of the injection molding process, and the application of the proposed method is illustrated by the online monitoring of the injection molding process. The Section 4 is conclusions.
2. Methodology
2.1. Batch Process Monitoring Based on Phase Mean PLS
Generally, process data of batch processes are stored in data matrix , where refers to the number of batches; refers to the number of process variables; and refers to the sample times. Based on the phase characteristic, the average variable matrix of phase c can be obtained,
where is the data length of phase c, and is the time-slice process data matrix.
The PLS algorithm is used to decompose the average process data matrix and quality data matrix linearly, and the model is as follows:
where is the score matrix of , is the score matrix of , is the load matrix of , is the load matrix of , is the fitting error matrix of , and is the fitting error matrix of .
The previous model can be expressed by the regression model as:
where is the regression parameter matrix, and is the predicted quality. When considering a single quality variable , the regression model can be simply expressed as:
where is the regression parameter.
In this paper, PLS model is used for online monitoring. The commonly used statistics are Hotelling-T2 statistics and square prediction error SPE statistics. Hotelling-T2 statistics reflects the deviation degree of latent variables from the established model in amplitude and process data development trend. SPE describes the deviation degree of the measured value of the input variable from the latent variable space in the batch process [13].
In the online monitoring of batch process, the current operating condition can be determined by observing the Hotelling-T2 and the control limit of the square prediction error SPE. The definitions of T2 statistics and SPE statistics are as follows:
where is the residual vector, , and Wc is the weight matrix. The detailed properties and calculations can be found in reference [8].
The corresponding control limits are:
where means the F distribution with the confidence level and the degrees of freedom H and , and H refers to the number of retained latent variables; means the distribution with the confidence level and the proportional coefficient ; ; refers to the mean value of SPEc; is the variance of SPEc.
After obtaining the vector at the k-th moment, the online T2 statistics and online SPE statistics are calculated, and the calculation formula is as follows:
where is the residual vector at the k-th moment.
2.2. Framework of Two-Dimensional, Two-Layer Regression Modeling Strategy
To perform process monitoring based on the three-dimensional data matrix of the batch process, in this paper, a novel two-dimensional, two-layer regression modeling strategy is established, where the process evolution that exists in both directions within and between batches can be tracked, and important quality information in historical processes can be extracted.
In the process of batch process modeling and online application, the most direct embodiment of the process characteristics is the data, and the main characteristic of the batch process is the three-dimensional data matrix. Extraction and analysis of process characteristics from the data is the basis of subsequent process modeling and process analysis. On the basis of understanding the characteristics of the actual three-dimensional data matrix of the batch process, appropriate scientific methods should be adopted to extract the process evolution information intelligently and accurately, so as to deeply understand the characteristics of the process and further establish the process model. The analysis of process evolution characteristics reflects the respective characteristics in both intra-batch direction and inter-batch direction but also the consistency of the two directions from the three-dimensional data matrix.
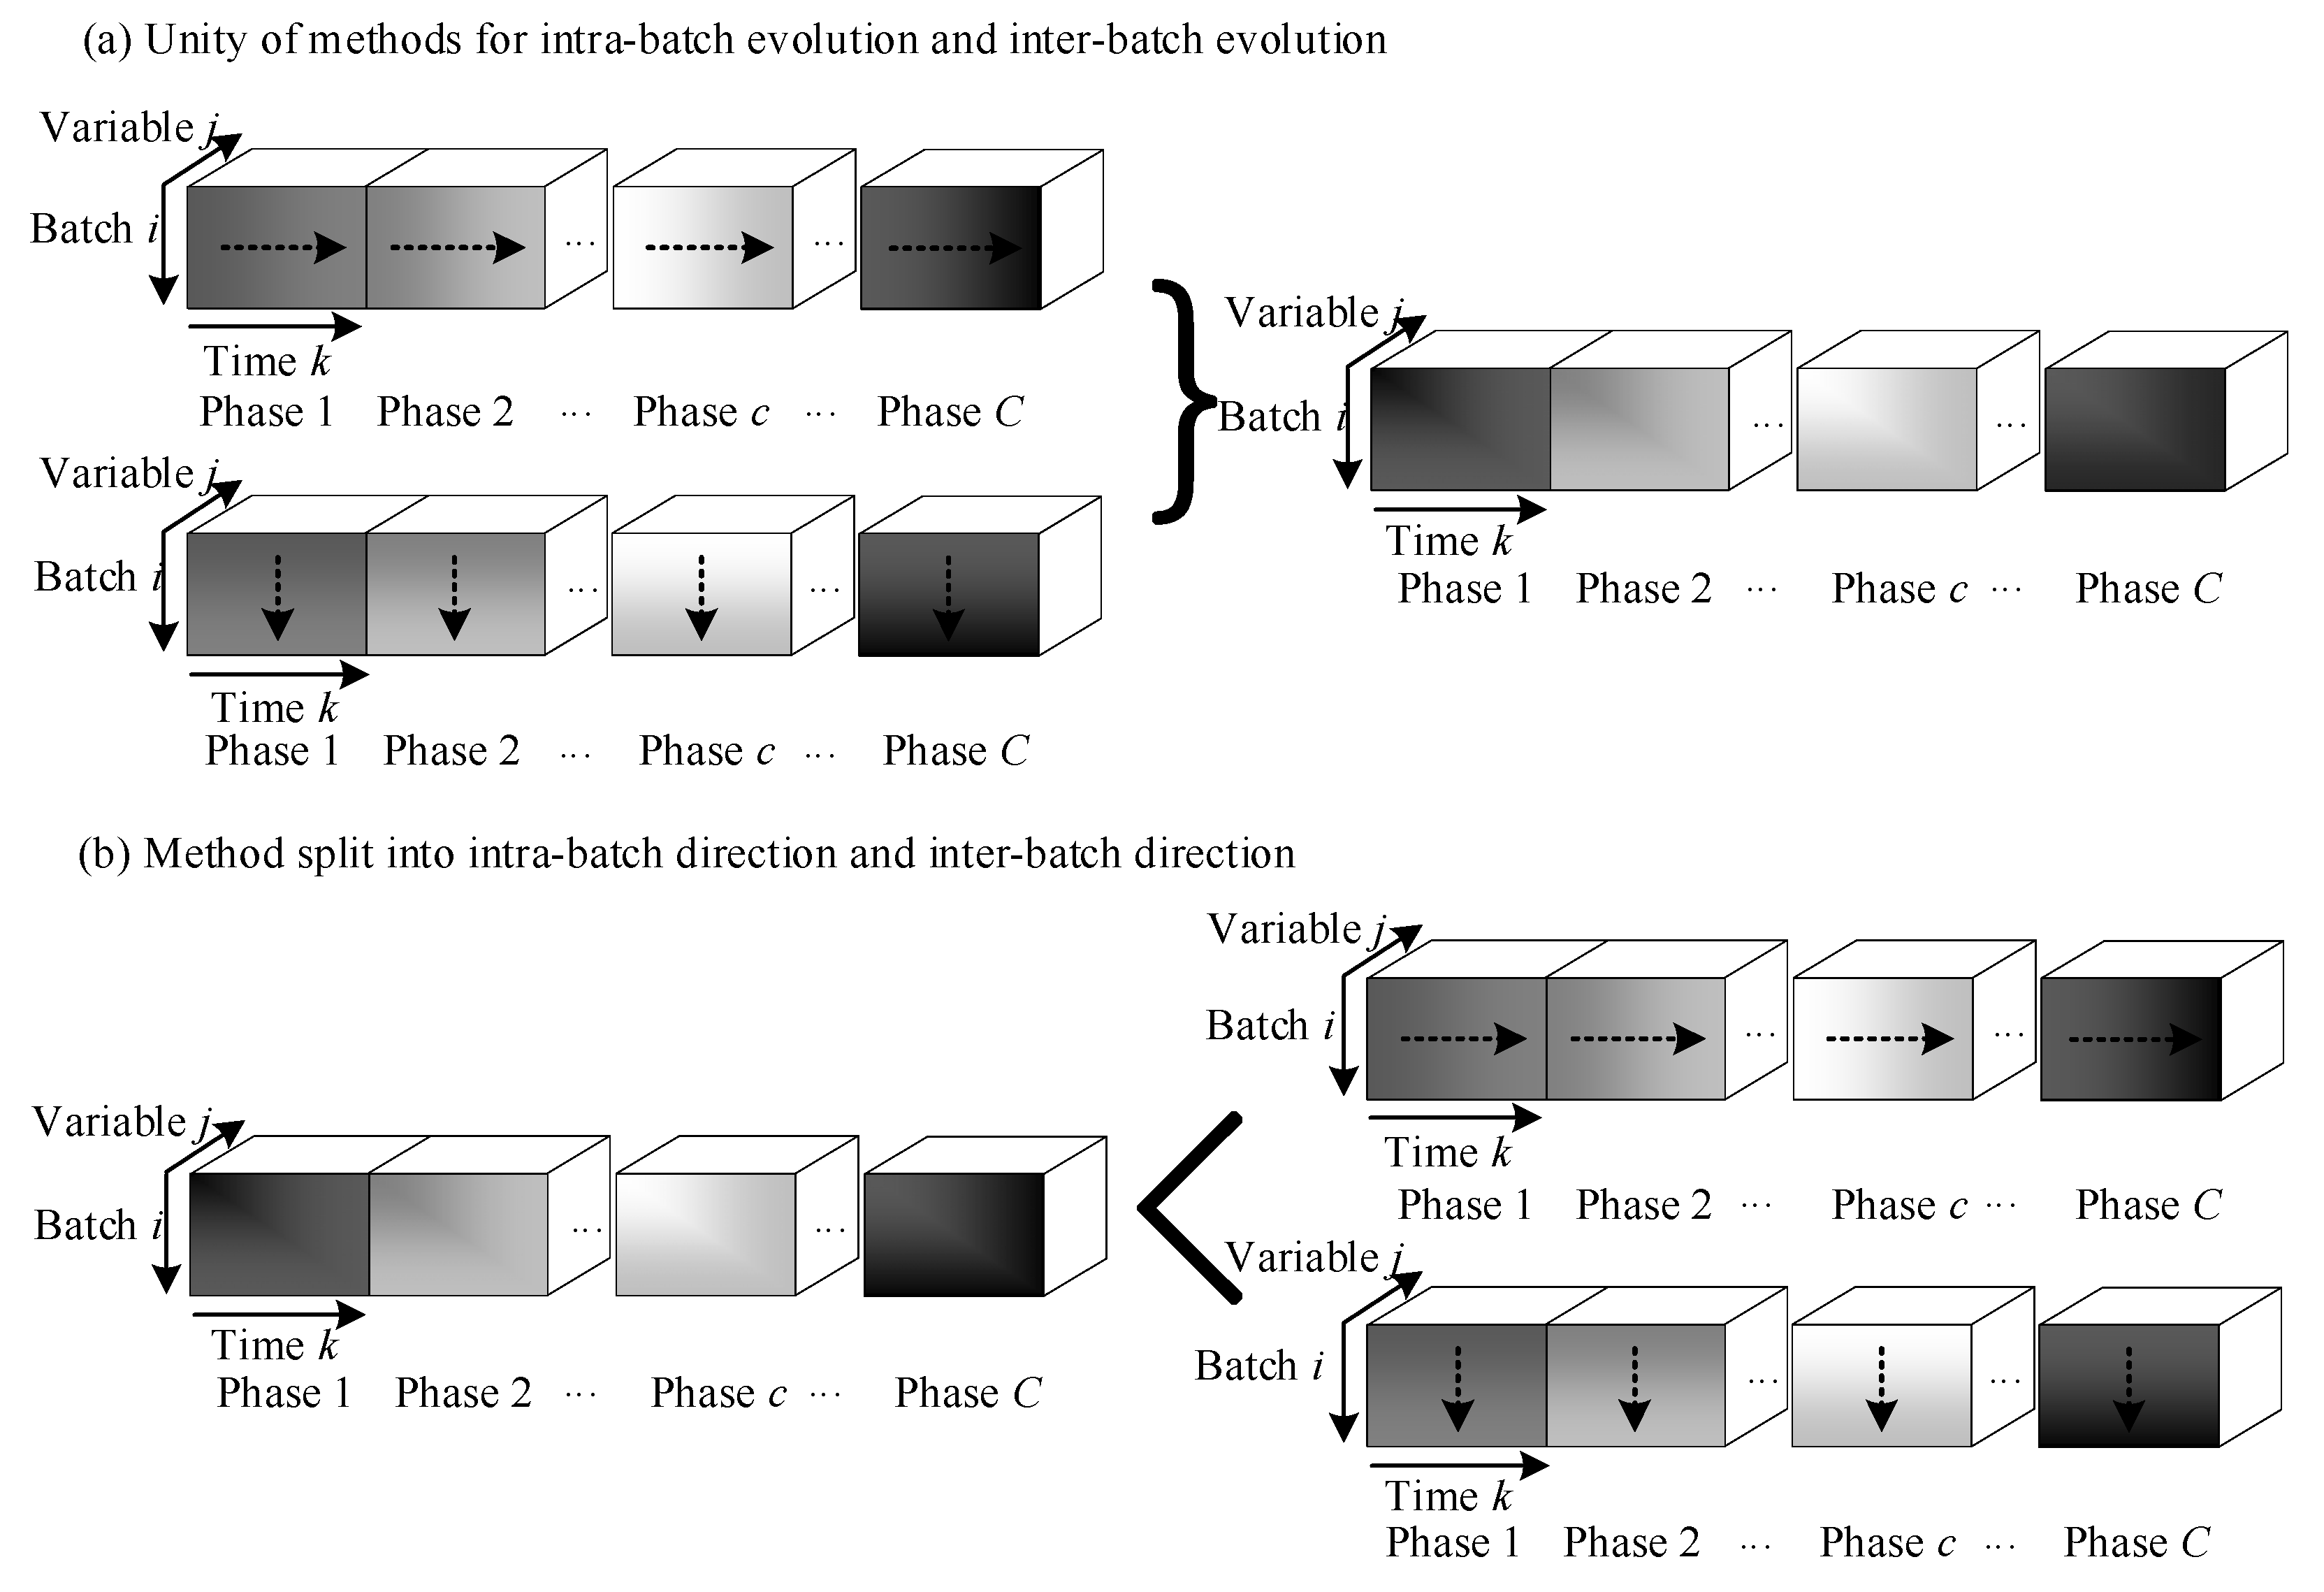
The intra-batch evolution problem and inter-batch evolution problem are shown in Figure 1. In early work, the researchers proposed different methods to track the intra-batch evolution and inter-batch evolution, respectively. In general, these methods are individual and can be selected simultaneously in evolution analysis and used for modeling in one of the two directions, as shown in Figure 1a. However, it is relatively complex to choose different methods when processing jointly in both directions. In addition, the most important is that the evolution nature in the both directions is the same. Although the evolutions in the two directions may be raised because of different physical significances, they are both process characteristic evolutions. It is a straightforward idea to adopt one method to handle both problems in the two directions. Therefore, a thinking framework is proposed, that is, expanding the method to inter-batch evolution based on intra-batch evolution, and maintaining the unity of the method under a reasonable premise, so as to achieve the method simplification. It should be noted that the model building method should follow the physical significances of both the inter-batch evolution and the intra-batch evolution during application. Following this framework, the proposed methods in both directions are consistent in core ideas and will be more convenient when uniting.
Secondly, from the overall perspective of batch process three-dimensional data matrix, the other kind of method can solve the process evolution in two directions simultaneously. As shown in Figure 1b, this kind of method can be split into two directions, and performs under the thought of handling the whole first, and dealing with the parts later. This kind of strategy adopts a unified core algorithm to extract and analyze the evolution in two directions. The core method here should be as suitable for the tracking of process evolution characteristics as much as possible. Attention is paid to the use of intelligent analysis method to avoid computational redundancy and reflect the superiority of the algorithm starting from the 3-dimensional data matrix.
Thus, this work is to explore more effective data modeling methods on the basis of preliminary work and trace the intra-batch evolution and inter-batch evolution simultaneously, as shown in Figure 1a, while, for the strategy shown in Figure 1b, the research will be talked about in later works. Next, the modeling method based on two-layer multi-mode regression analysis will be expanded to deal with the multi-mode and multi-phase problem at the same time, and a two-dimensional, two-layer regression model will be proposed.
In the multi-mode batch process, when a new mode occurs, the single mode model will no longer match the target process, resulting in serious overrun of T2 and SPE statistics when monitoring. Therefore, the statistical modeling and online monitoring of the batch process should not only consider a single mode but also carry out the quality analysis of multiple modes.
The main strategy to deal with the multi-mode problem is to extract the relationship between the historical modes and the target process. By doing this, more between-mode information would be captured by the model, and the multi-mode process can be better predicted and monitored. In this two-layer regression strategy, first, the PLS regression models are built for historical modes. Then, using those regression models and the process variables of the target process, a series of assumed quality predictions can be obtained in the first regression layer. In the second layer, based on these assumed quality predictions and real quality values of the target process, the PLS regression model is established for quality prediction.
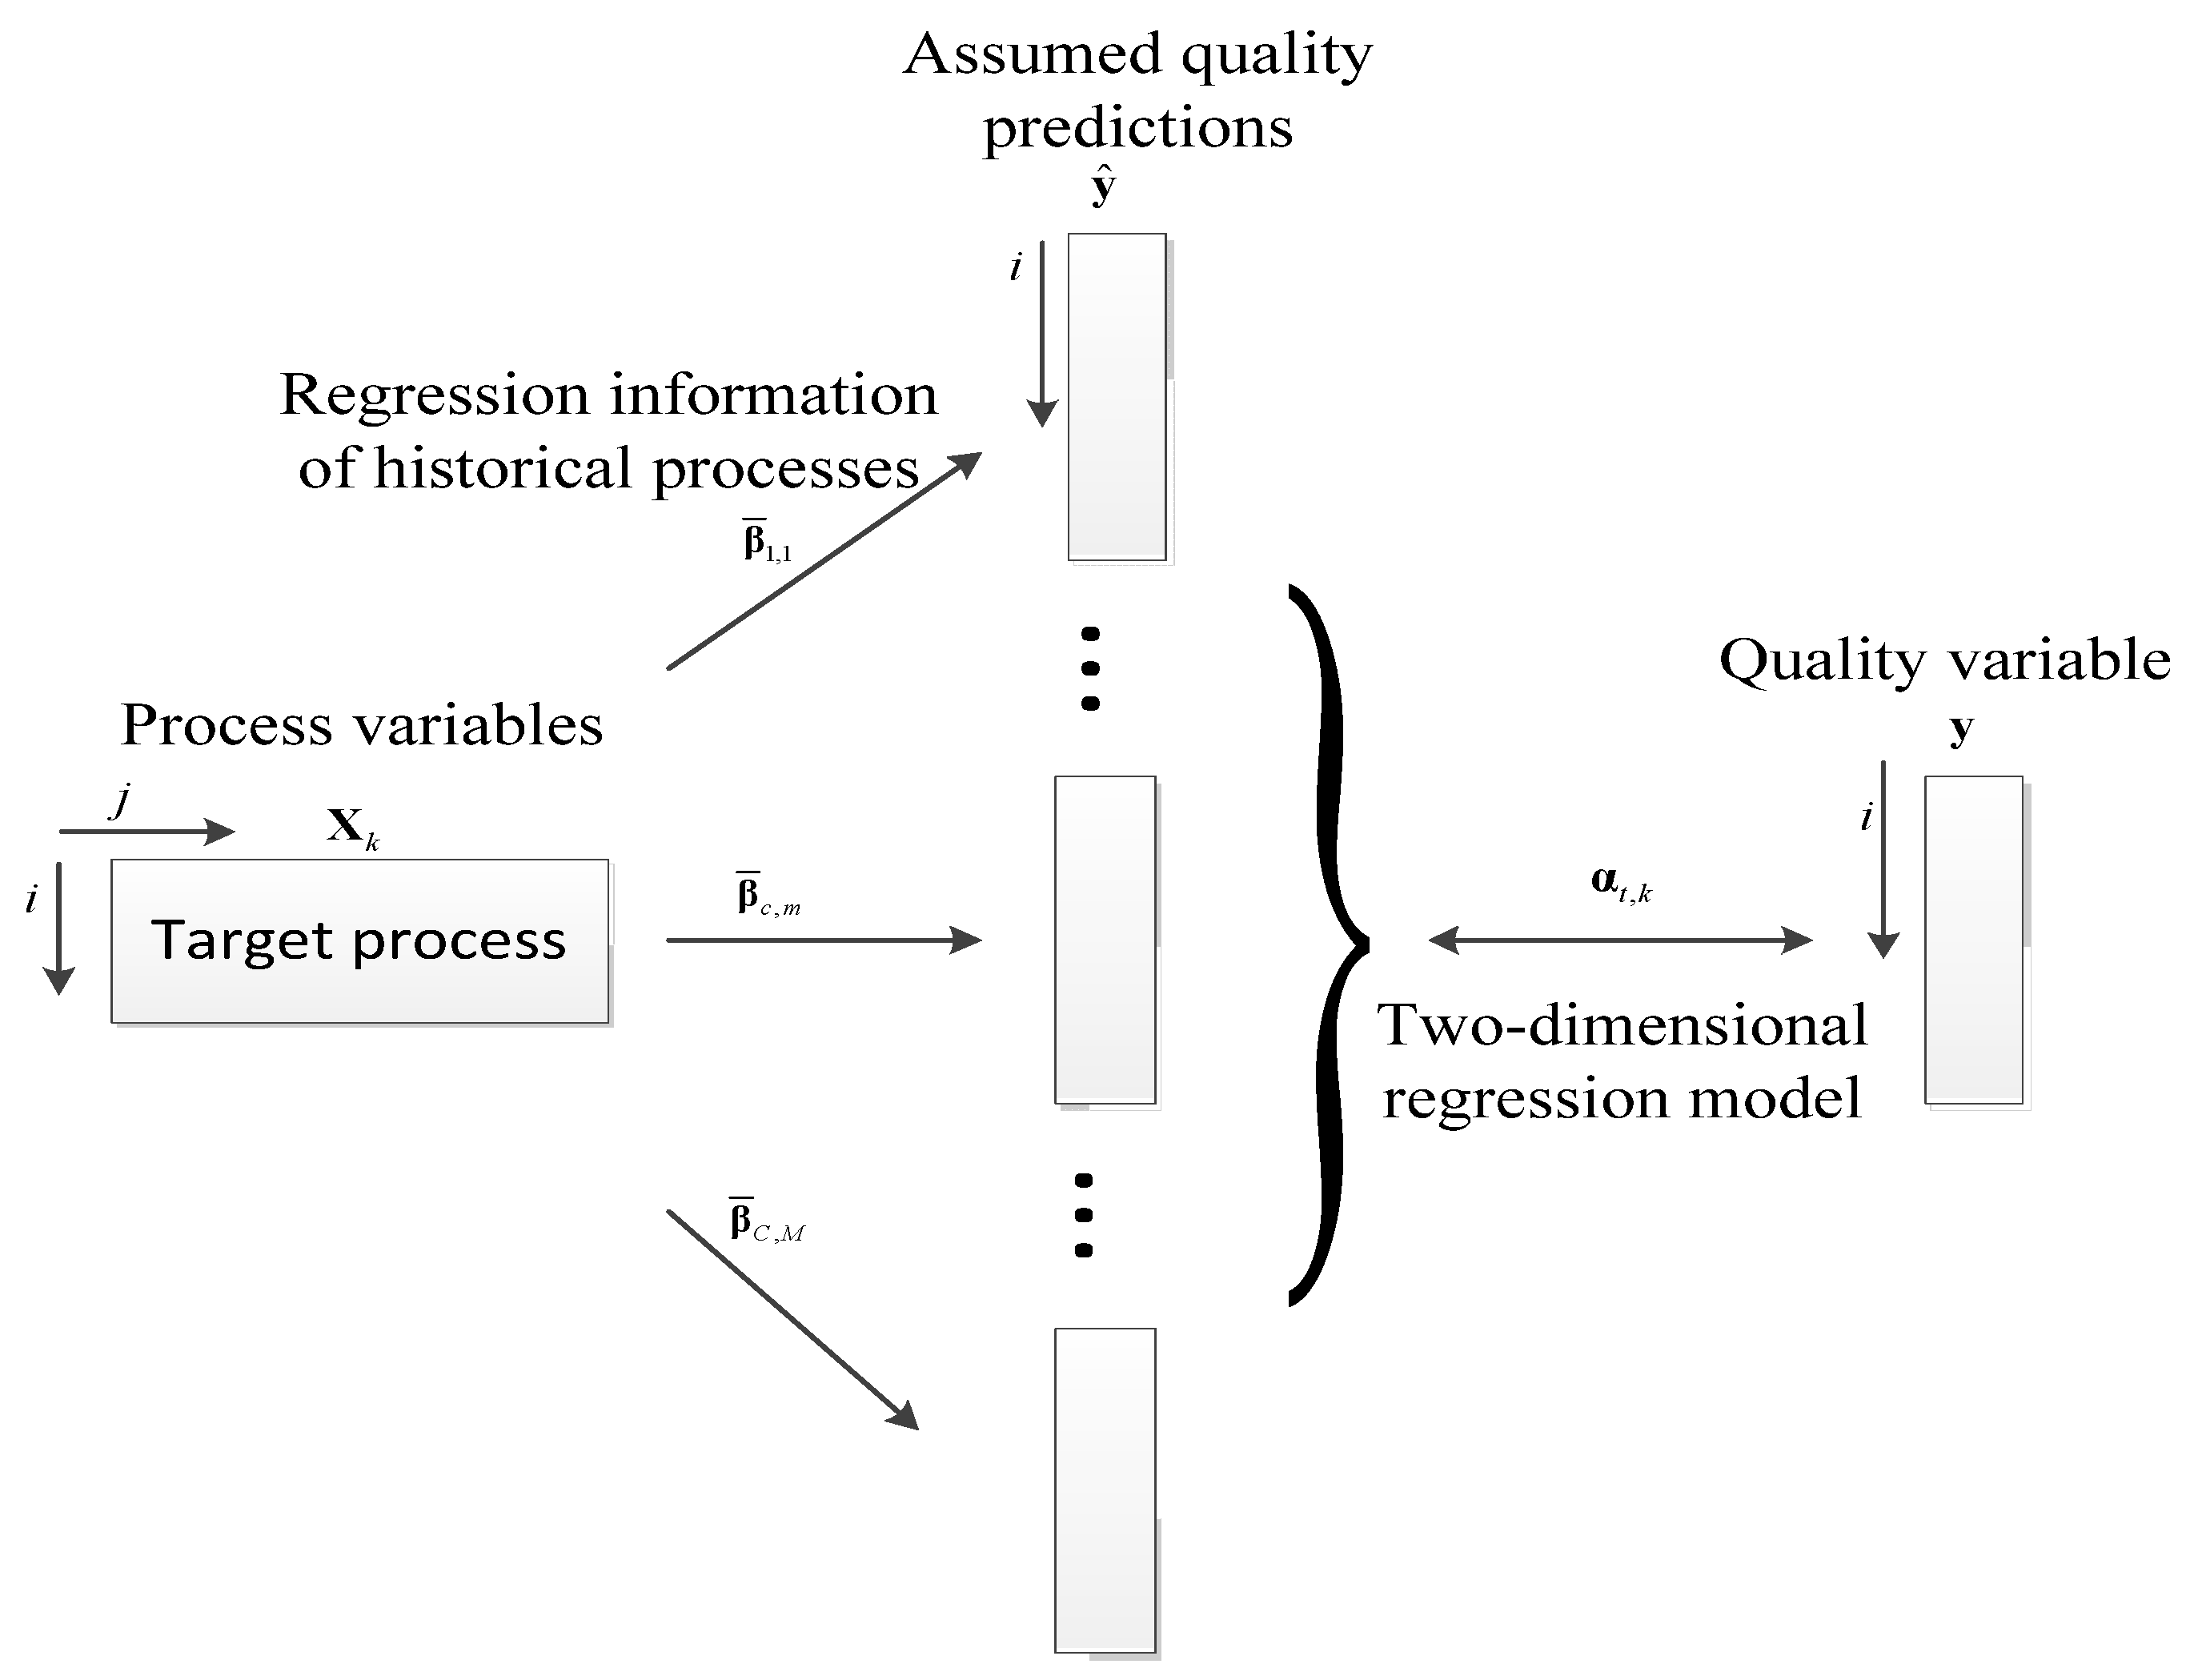
To adopt the same strategy to handle the multi-mode problem and the multi-phase problem at the same time, the strategy above will be applied to the intra-batch batch direction and handle the multi-phase problem by analyzing the intra-batch evolution. The framework of the two-dimensional, two-layer regression modeling strategy is shown in Figure 2. In the first regression layer, first, the PLS regression models are built between the process variables and quality variables of the historical processes with phase and mode indexes to get regression parameters. Then, using those regression parameters and the process variables of the target process, a series of assumed quality predictions can be obtained. Here, it is assumed that the target process belongs to each modeled process. This step connects all historical process information with the target process. Whether the information captured is related to the final quality of the target process will be judged in next regression layer. Consequently, in the second regression layer, based on these assumed quality predictions and real quality values of the target process, the PLS regression model is established, which captures the valuable information existing in the historical processes related to the final quality of the target process. Finally, by applying the two-dimensional, two-layer regression model, the final prediction quality can be obtained.
In the proposed method, the two-dimensional regression, which is mainly reflected by the regression parameters of the historical processes with both phase and mode indexes, traces the intra-batch and inter-batch characteristics, while the two-layer structure establishes the relationship between the target process and historical processes. Compared with the between-mode model, the two-dimensional, two-layer regression model handles the inter-batch evolution and intra-batch evolution simultaneously, and, at the same time, maintaining the unity of the method. However, the between-mode method deals with only the inter-batch multi-mode problem, which means other methods dealing with the intra-batch multi-phase problem or phase information are necessary. Compared with the traditional strategy [16,23], where historical modes are considered together and modeled by phase mean PLS method, and several phase mean models are built for different phases, respectively, the proposed method mixes all process mode and phase information together in the first regression layer, then using the second regression layer to extract valuable information for the target process, which is more reasonable to use regression method to judge the relationship between the processes, rather than excluding the information by phase division.
The details of the proposed two-dimensional, two-layer quality regression modeling strategy are introduced in the next section.
2.3. Two-Dimensional, Two-Layer Regression Model
In this section, after establishing the models representing the quality related information of each historical processes, the regression relationship between the process variables and the quality of the target process is analyzed through the regression model of the historical phases of historical modes, and, on this basis, online monitoring is carried out.
Firstly, the models representing the quality related information of each historical processes are established. Within phase c of mode m, and are the normalized time-slice process variables and quality variables. The PLS algorithm is used to capture the relationship of the process data matrix and quality data matrix , and the model is as follows:
where and are the score matrices, and are the loading matrices, and and are the residual matrices.
The prediction model can be expressed as below:
where is the regression parameter matrix.
When only one final quality variable is considered, the prediction model can be written as:
where is the regression parameter vector.
So, the regression coefficient of historical phases is obtained:
where Kc stands for the number of time-slices within phase c of mode m, m stands for the number of the historical modes, m = 1, 2, …, M, and c stands for the historical phases in each batch, c = 1, 2, …, C.
For the target process, and are the normalized time-slice process variables and quality variable.
The regression model and the process variables of the target process are used to obtain the assumed quality prediction of the target process:
where t stands for the target process, m stands for the number of the historical modes, m = 1, 2, …, M, and c stands for the number of historical phases, c = 1, 2, …, C. It should be noted that is called the assumed quality prediction, which means it is obtained by assuming that the process variables belong to the certain phase of the certain mode with the regression parameter . By obtaining the assumed quality predictions, the quality information of historical phases and modes is shared by the target process. Further, the quality information of historical phases and modes will be judged and extracted by the next regression.
Then, the relationship between the assumed quality predictions and the quality data of the target process will be established. All these assumed predictions of the historical modes can comprise a new matrix , . Then, the kth time-slice PLS regression model is built between and as follows:
where and are the score matrix and vector of the target process, and are the loading matrix and vector of the target process, and and are the residual matrix and vector of the target process. Then, novel predictions are obtained:
where is the regression parameter of the kth time-slice model.
The mean regression parameters of the target process can be obtained from the regression parameters of the time-slice models,
where Kt is the number of the time intervals within phase c. Then, the predictions based on the regression parameter of the whole phase, , are obtained:
Corresponding coefficients can be obtained based on the assumed prediction quality obtained from the above analysis:
After obtaining the vector at the k-th moment, the online T2 statistics and online SPE statistics are calculated, and the calculation formula is as follows:
where is the T2 statistic of the current k-th moment, and is the SPE statistic of the current k-th moment; is the residual vector at the k-th moment.
The corresponding control limits are calculated similarly as Equations (8) and (9).
3. Illustration and Discussions
3.1. Introduction of Injection Molding Process
Injection molding a typical batch process, which is one of the important technologies of plastic processing. To obtain plastic products, an injection molding process mainly consists of mold closing, injection, packing-holding, plasticizing, cooling, mold opening, part ejection, and other processes. Among those phases, injection, packing-holding, plasticizing, and cooling are the most important four operation phases to determine the quality of products: in the injection phase, the molten plastic is injected into the mold; then, in the packing-holding phase, a certain pressure is maintained to fulfill the hollows which may occur due to the temperature decrease; consequently, in the plasticizing phase, the raw material, i.e., plastic particles, is transported forward, plasticized, and melted; finally, in the cooling phase, the plastic is cooled in the mold until the product becomes sufficiently rigid for ejection. As the development of computers, all important process variables can be obtained online by high-precision sensors.
The material used in this experiment is high density polyethylene (HDPE). The quality analyzed in this experiment is the weight of injection molded parts. The operating conditions are shown in Table 1. The selected process variables are shown in Table 2, which are used to establish the model. The variable data shown in the table can be collected by sensors. The mode information of this experiment includes the packing pressure (PP) and the barrel temperature (BT). Five different modes are obtained. The experimental conditions are shown in Table 3. The data used in the modeling process are all real experiment data.
3.2. Normal Batch Monitoring
The two-dimensional, two-layer regression model proposed in this paper can track the process evolution that exists in both directions within and between batches and extract important quality information from historical processes. To illustrate the superiority of this method, real injection molding process data with both multi-mode and multi-phase characteristics are used for analyzing.
In this simulation, 18 batches in mode 1, mode 2, and mode 3, 22 batches in mode 4, and 17 batches in mode 5 are selected, respectively, as normal batches of historical modes. Mode 3, with 18 batches, is used as the target mode for modeling. Five batches of mode 3 are selected as the normal test batches. During regression modeling, the four-fold cross-validation method is used to determine the number of reserved latent variables of the traditional method and the proposed method, which is 2 after analyzation. The confidence level of is set to 0.99.
To illustrate the advantages of the proposed method, it is compared with the traditional multi-mode and multi-phase strategy. In this kind of traditional strategy, historical modes are considered together and modeled by phase mean PLS method, and several models are built for different phases, respectively. To be fair, all concerned modes are available for modeling in both the proposed method and the traditional method.
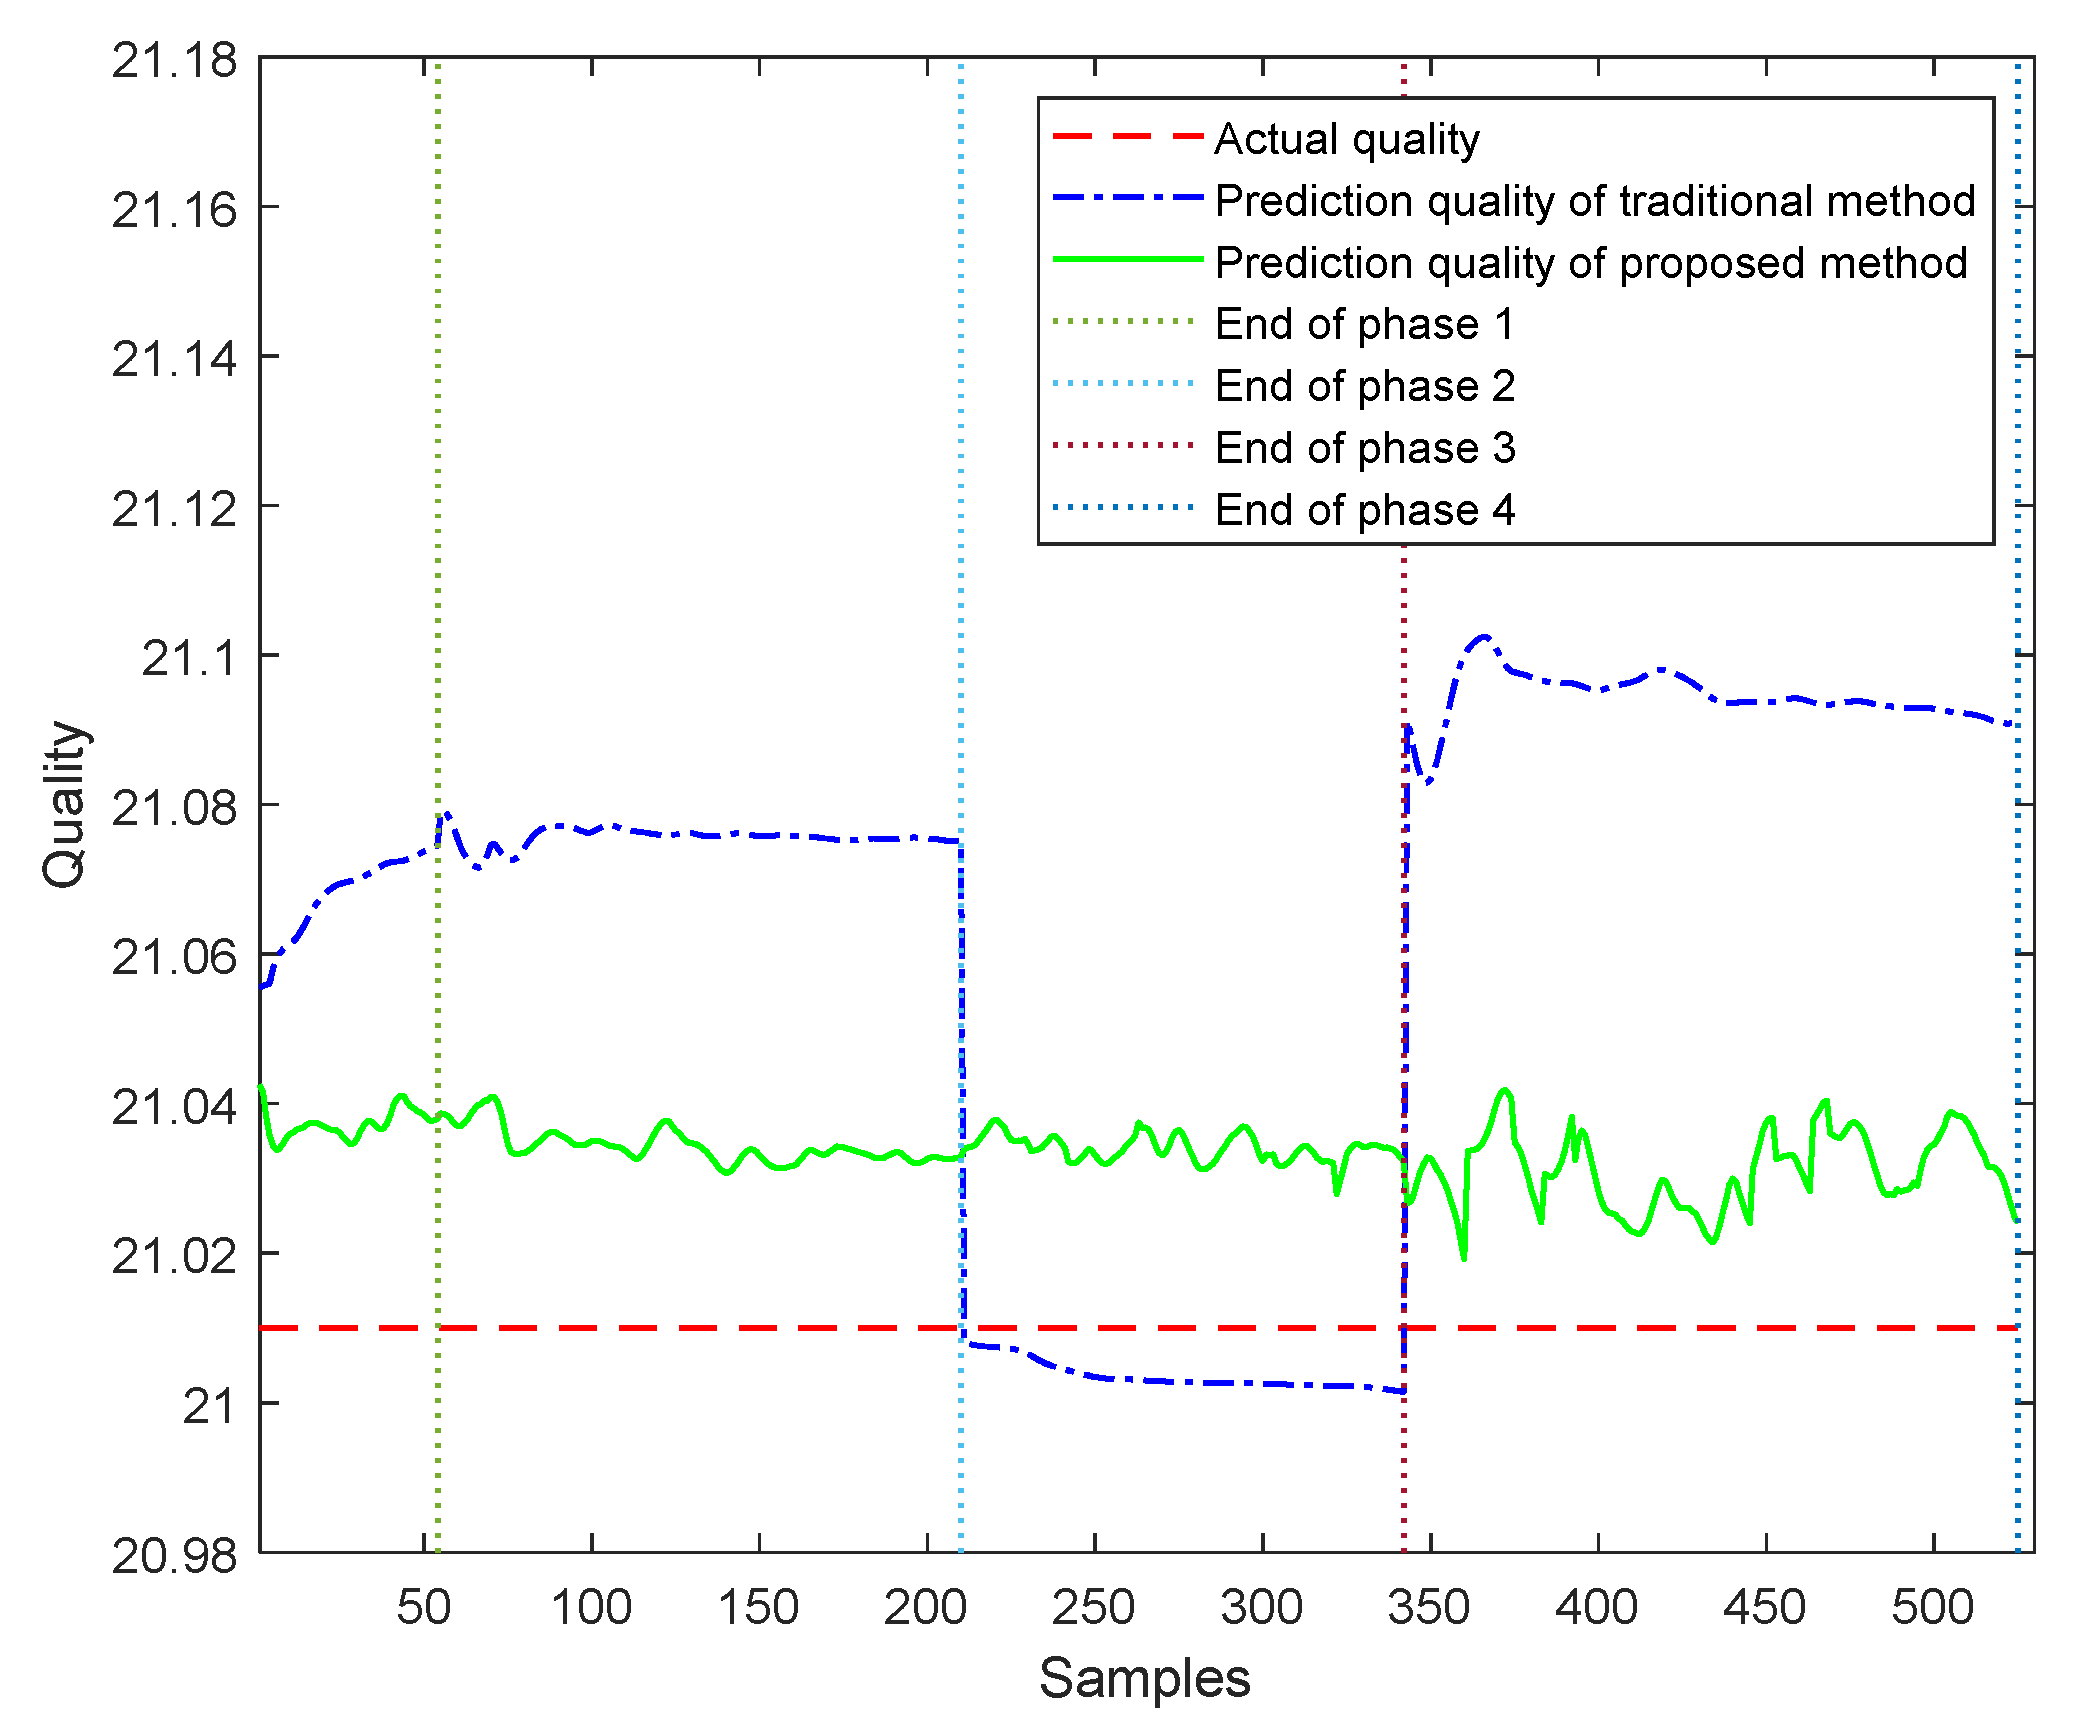
The mean RMSE of the quality predictions of the test batches from mode 3 by the traditional method is 0.0077, while the mean RMSE obtained by the proposed method is 0.0071, so the proposed method provides a more accurate prediction. The RMSE values of online quality predictions of the test batches using the two methods are shown in Figure 3. The dot dashed line is the RMSE value of the traditional method, the full line is the RMSE value of the proposed method, and vertical dotted lines are the phase boundaries. It can be seen from Figure 3 that the RMSE values of the traditional method have obvious phase variation, which indicates that the precision of the traditional method may be affected by different phase models. Therefore, the proposed method provides better quality prediction results than the proposed method. The RMSE values of the traditional method reflect obvious different phase characteristics because, in the traditional method, four models have been established for the four phases, while, for the proposed method, the RMSE values are not only lower than those of the traditional method within each phase but also keep a continuous low value throughout the four phases. This is because the proposed method mixes all process mode and phase information together in the first regression layer and then uses the second regression layer to extract valuable information for the target process. The results prove that using the two-layer regression method to judge the relationship between the target process and the historical processes is better than the traditional method based on phase division.
Further, one of the five test batches from mode 3 is selected to show the online quality prediction and monitoring results. The online quality prediction results of one test batch are shown in Figure 4. Similar conclusions can be obtained from Figure 4 with those from Figure 3, which proves the correctness of the conclusion from Figure 3.
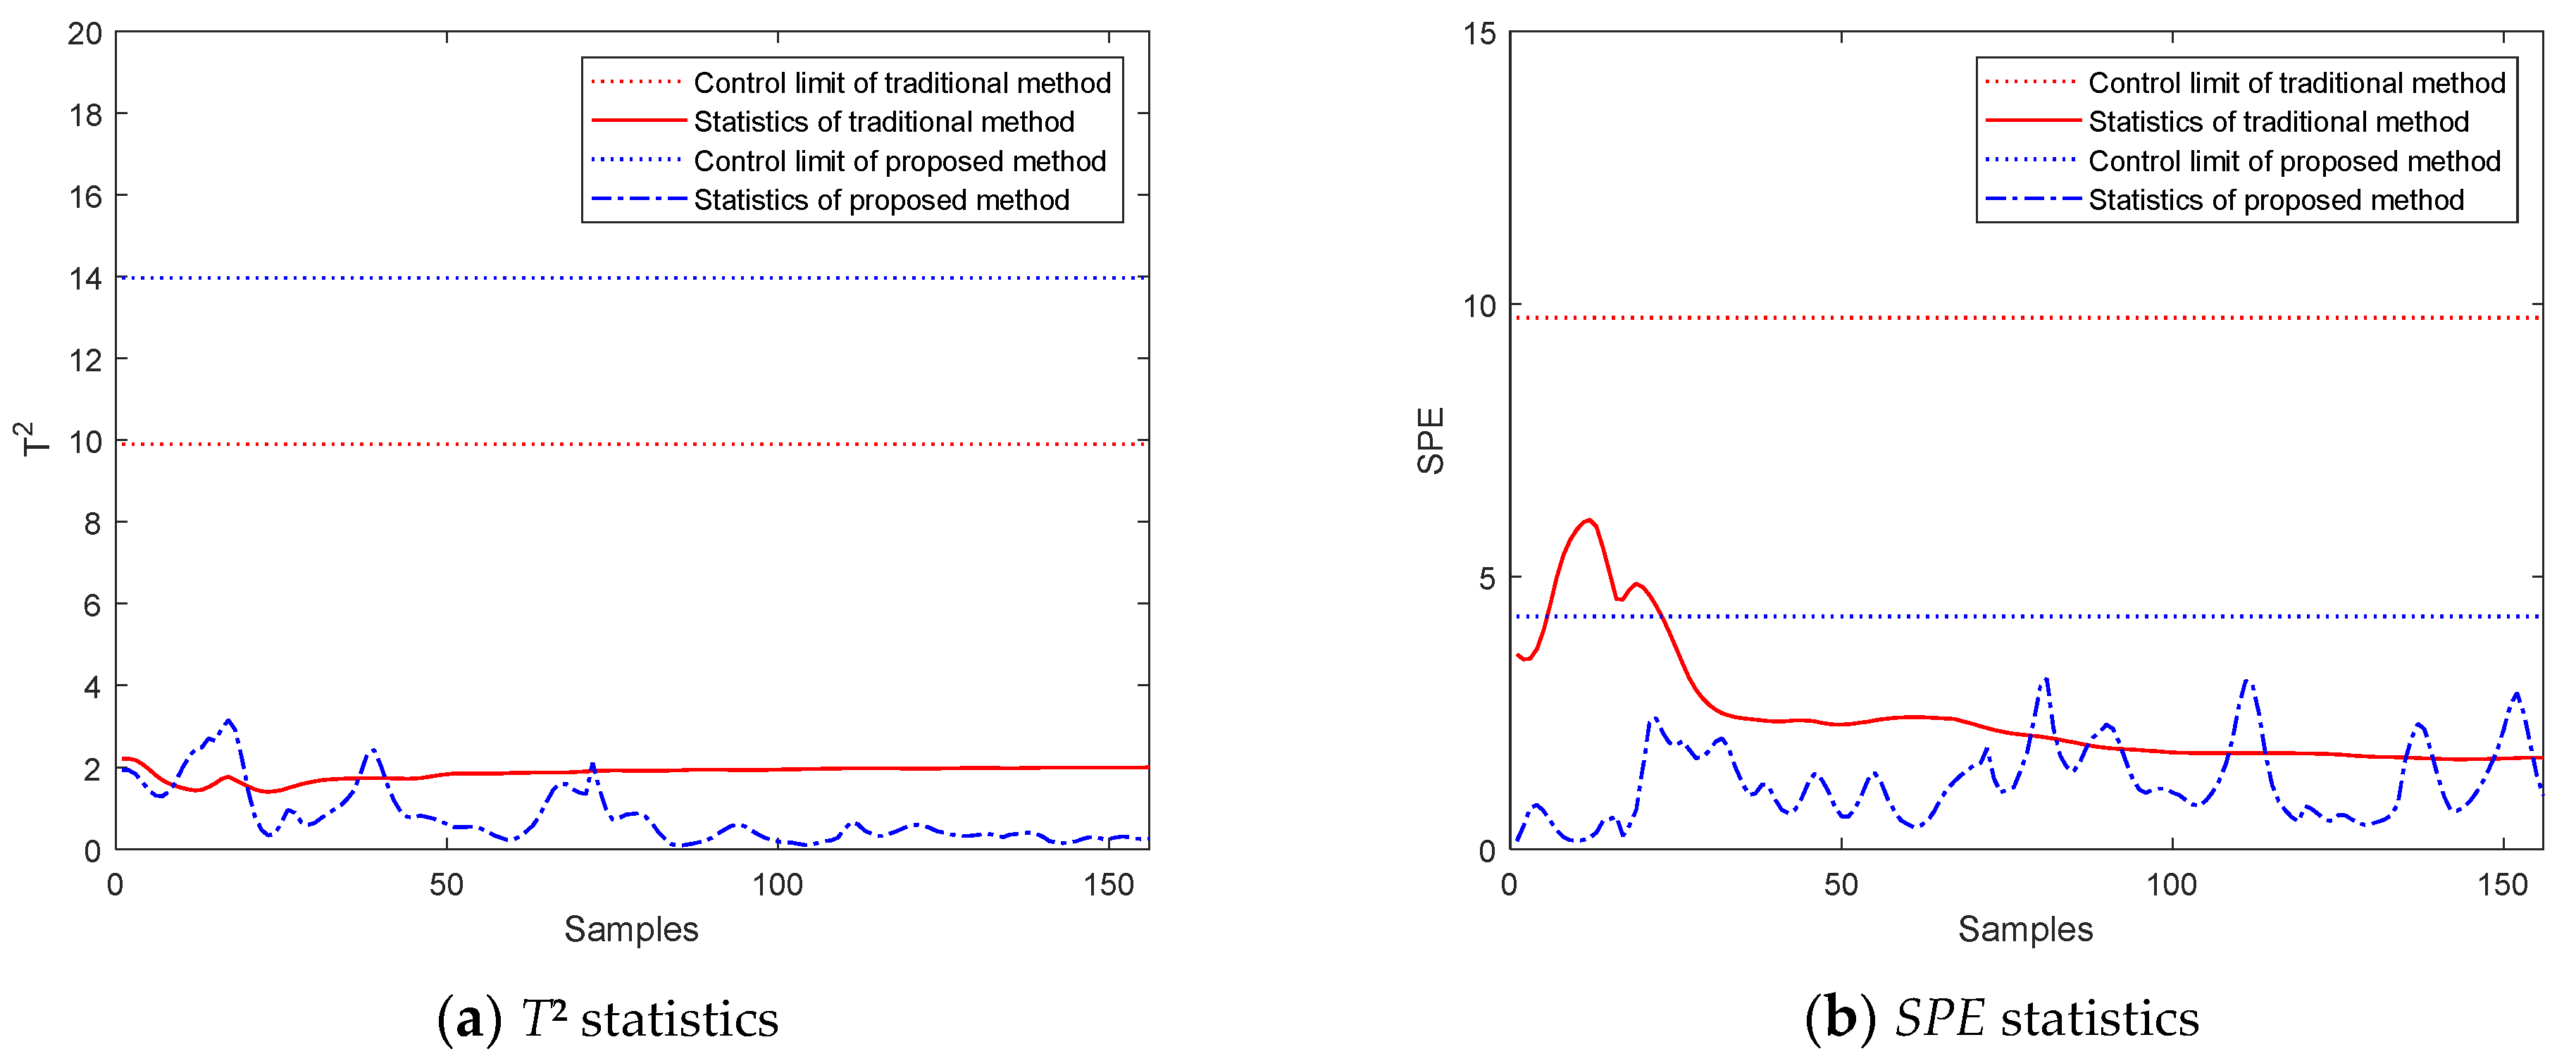
The monitoring results of the four phases of one normal test batch from mode 3 are shown in Figure 5, Figure 6, Figure 7 and Figure 8, respectively. This batch, which has some fluctuation, may be identified as anormal batch by the traditional method, and false alarm will occur due to the process fluctuation. While, by the propose method, this normal batch can be normally monitored. The details are as follows: In Figure 5 and Figure 6, it can be seen that both T2 and SPE of the proposed method and the traditional method do not exceed the control limits in the injection phase and the packing-holding phase. In Figure 7, it can be seen that, in the plasticizing phase, T2 and SPE of the proposed method do not exceed their respective control limits, while, for the traditional method, although T2 does not exceed its control limit, there is an obvious period at the beginning of the phase during which the SPE value exceeds its control limit. In fact, the fluctuation of this batch is caused by the transition between the packing-holding phase and the plasticizing phase. During the transition, process characteristic change from the packing-holding phase characteristic to the plasticizing phase characteristic. This characteristic fluctuation is natural progress and does not affect the production, so this batch is normal. Because the traditional method which uses the phase mean model to represent the phase characteristic is more easily affected by the characteristic fluctuation away from the phase mean characteristic, this fluctuation is identified as a fault by the traditional method. However, this is not consistent with the conclusion from the real production. Because the proposed method comprehensively deals with the multi-phase and multi-mode problems by involving all quality-related phase and mode information in historical processes in the regression model, it is not easily affected by phase fluctuation, and it can offer the right monitoring result, in which this batch is normal during the plasticizing phase. In Figure 8, there is one point of SPE value of the proposed method exceeds the control limit. Generally, this point will not be considered as a fault. Therefore, it can be concluded from the monitoring results of the normal test batch that the proposed method is better than the traditional method because, by the two-dimensional, two-layer quality regression, all quality-related phase and mode information in historical processes have been extracted and utilized for quality prediction and monitoring.
3.3. Abnormal Batch Monitoring
In the injection molding process, the sensor fault is one of the common faults. Because of the sensor fault, some important process variable cannot be detected, the control system cannot know the real progress, and wrong control commands may be delivered, leading to serious dangerousness of production.
To simulate the sensor fault, a test batch with the pressure variable removed during the packing-holding phase is monitored. The T2 and SPE monitoring effects of the traditional method and the proposed method are shown in Figure 9, respectively. Compared with the traditional method, the amplitudes of the statistics of the proposed method are relatively larger. It can be concluded that the sensitivity of the proposed method is not affected, although it involves all quality-related phase and mode information in historical processes in the regression model, and it can identify the fault batch as fast as the traditional method, with an even larger alarm signal. So, the proposed method is better than the traditional method.
4. Conclusions
In this work, a two-dimensional, two-layer quality regression model is established to monitor multi-phase, multi-mode batch processes. First, traditional batch process monitoring method based on phase mean PLS is introduced. Then, aiming at the multi-mode problem and the multi-phase problem simultaneously, the framework of two-dimensional, two-layer quality regression modeling strategy is proposed by expanding the multi-mode analysis strategy into the multi-phase problem and dealing with the intra-batch evolution and inter-batch evolution at the same time. Accordingly, the two-dimensional, two-layer regression model is established, based on which the quality predictions are obtained, and the process is monitored. Through the application to an injection molding process, it is proved that the proposed methodology can provide better quality prediction and process monitoring results for multi-phase, multi-mode batch processes than the traditional method.
Author Contributions
Conceptualization, L.Z. Data curation, L.Z.; Formal analysis, L.Z.; Funding acquisition, L.Z.; Investigation, L.Z.; Methodology, L.Z. and X.H.; Project administration, L.Z.; Resources, L.Z.; Software, L.Z. and X.H.; Supervision, L.Z.; Validation, L.Z.; Visualization, L.Z.; Writing—original draft, L.Z.; Writing—review & editing, L.Z. All authors have read and agreed to the published version of the manuscript.
Funding
This research was funded by the National Natural Science Foundation of China (No. 61503069) and the Fundamental Research Funds for the Central Universities (N150404020).
Institutional Review Board Statement
Not applicable.
Informed Consent Statement
Not applicable.
Data Availability Statement
The data presented in this study are openly available in https://share.weiyun.com/Jbc9pbWF.
Acknowledgments
This work is supported in part by the National Natural Science Foundation of China (No. 61503069) and the Fundamental Research Funds for the Central Universities (N150404020).
Conflicts of Interest
The authors declare no conflict of interest.
References
- Dunteman, G.H. Principal Component Analysis; SAGE publication Inc.: Los Angeles, CA, USA, 1989. [Google Scholar]
- Geladi, P.; Kowalshi, B.R. Partial least squares regression: A tutorial. Anal. Chim. Acta 1986, 185, 1–17. [Google Scholar] [CrossRef]
- Wang, X.Z. Data Mining and Knowledge Discovery for Process Monitoring and Control; Springer: Berlin/Heidelberg, Germany, 1999. [Google Scholar]
- Kourti, T.; MacGregor, J.F. Process analysis, monitoring and diagnosis, using multivariate projection methods. Chemom. Intell. Lab. Syst. 1995, 28, 3–21. [Google Scholar] [CrossRef]
- Wang, H.W. Partial Least Squares Regression Method and Its Application; National Defense Industry Press: Beijing, China, 1999. [Google Scholar]
- Nomikos, P.; MacGregor, J.F. Monitoring batch processes using multiway principal component analysis. AIChE J. 1994, 40, 1361–1375. [Google Scholar] [CrossRef]
- Nomikos, P.; MacGregor, J.F. Multi-way partial least squares in monitoring batch processes. Chemom. Intell. Lab. Syst. 1995, 30, 97–108. [Google Scholar] [CrossRef]
- Wold, S.; Kettaneh, N.; Fridén, H.; Holmberg, A. Modelling and diagnostics of batch processes and analogous kinetic experiments. Chemom. Intell. Lab. Syst. 1998, 44, 331–340. [Google Scholar] [CrossRef]
- Duchesne, C.; MacGregor, J.F. Multivariate analysis and optimization of process variable trajectories for batch process. Chemom. Intell. Lab. Syst. 2000, 51, 125–137. [Google Scholar] [CrossRef]
- Cho, H.W.; Kim, K.J. A method for predicting future observations in the monitoring of a batch process. Qual. Technol. 2003, 35, 59–69. [Google Scholar] [CrossRef]
- Lu, N.Y.; Wang, F.L.; Gao, F.R. Sub-PCA modeling and online monitoring strategy for batch processes. AIChE J. 2004, 50, 255–259. [Google Scholar] [CrossRef]
- Zhao, L.P.; Zhao, C.H.; Gao, F.R. Inter-batch-evolution-traced process monitoring based on inter-batch mode division for multi-phase batch processes. Chemom. Intell. Lab. Syst. 2014, 138, 178–192. [Google Scholar] [CrossRef]
- Dong, D.; McAvoy, T.J. Multi-stage batch process monitoring. In Proceedings of the 1995 American Control Conference, Seattle, WA, USA, 21–23 June 1995; pp. 1857–1861. [Google Scholar]
- Ündey, C.; Cinar, A. Statistical monitoring of multistage, multi-phase batch processes. IEEE Control Syst. Mag. 2002, 22, 40–52. [Google Scholar]
- Lu, N.Y.; Gao, F.R.; Yang, Y.; Wang, F.L. PCA-based modeling and on-line monitoring strategy for uneven-length batch processes. Ind. Eng. Chem. Res. 2004, 43, 3343–3352. [Google Scholar] [CrossRef]
- Zhao, L.P.; Wang, F.L.; Chang, Y.Q.; Wang, S.; Gao, F.R. Phase-based recursive regression for quality prediction of multi-phase batch processes. In Proceedings of the 13th IEEE International Conference on Control and Automation, Ohrid, Macedonia, 3–6 July 2017; pp. 283–288. [Google Scholar]
- Gunther, J.C.; Conner, J.S.; Seborg, D.E. Process monitoring and quality variable prediction utilizing PLS in industrial fed-batch cell culture. J. Process. Control 2009, 19, 914–921. [Google Scholar] [CrossRef]
- Hwang, D.H.; Han, C.H. Real-time monitoring for a process with multiple operating modes. Control Eng. Pract. 1999, 7, 891–902. [Google Scholar] [CrossRef]
- Chen, J.; Liu, J. Mixture principal component analysis models for process monitoring. Ind. Eng. Chem. Res. 1999, 38, 1478–1488. [Google Scholar] [CrossRef]
- Zhao, L.P.; Zhao, C.H.; Gao, F.R. Between-mode quality analysis based multi-mode batch process quality prediction. Ind. Eng. Chem. Res. 2014, 53, 15629–15638. [Google Scholar] [CrossRef]
- Qin, Y. Research on Data Driven Batch Process Monitoring and Quality Control; Zhejiang University: Hangzhou, China, 2018. [Google Scholar]
- Zhao, L.P.; Huang, X.; Yu, H. Quality-analysis-based process monitoring for multi-phase multi-mode batch processes. Processes 2021, 9, 1321. [Google Scholar] [CrossRef]
- Lu, N.Y.; Gao, F.R. Stage-based process analysis and quality prediction for batch processes. Ind. Eng. Chem. Res. 2005, 44, 3547–3555. [Google Scholar] [CrossRef]
Figure 1.
Process modeling based on 3-D data matrix analysis.

Figure 2.
Illustration of two-dimensional, two-layer regression modeling.

Figure 3.
RMSE values of online quality predictions.

Figure 4.
Online quality prediction results of one test batch.

Figure 5.
Online monitoring of the injection phase.

Figure 6.
Online monitoring of the packing-holding phase.

Figure 7.
Online monitoring of the plasticizing phase.

Figure 8.
Online monitoring of the cooling phase.

Figure 9.
Online monitoring of the sensor fault.


Table 1.
Operating condition settings for injection molding process.
| Operating Parameter | Set Value |
|---|---|
| Material | High density polyethylene (HDPE) |
| Packing pressure | 25 Bar, 30 Bar, 35 Bar |
| Packing time | 3 s |
| Mold cooling water temperature | 25 °C |
| Injection velocity | 24 mm/s |
| Barrel temperature | 180 °C, 200 °C |
| Cooling time | 15 s |
Table 2.
Process variables of injection molding process in start-up process.
| Number | Variable Description | Unit |
|---|---|---|
| 1 | Screw speed | Mm/s |
| 2 | Plasticizing pressure | Bar |
| 3 | Nozzle temperature | °C |
| 4 | Cylinder pressure | Bar |
| 5 | SV2 valve opening | % |
| 6 | SV1 valve opening | % |
Table 3.
Different operation modes caused by different packing pressure (PP) and different barrel temperature (BT).
Table 3.
Different operation modes caused by different packing pressure (PP) and different barrel temperature (BT).
| Modes | PP/Bar | BT/°C |
|---|---|---|
| Mode 1 | 25 | 180 |
| Mode 2 | 35 | 180 |
| Mode 3 | 25 | 200 |
| Mode 4 | 30 | 200 |
| Mode 5 | 35 | 200 |
Publisher’s Note: MDPI stays neutral with regard to jurisdictional claims in published maps and institutional affiliations. |
© 2021 by the authors. Licensee MDPI, Basel, Switzerland. This article is an open access article distributed under the terms and conditions of the Creative Commons Attribution (CC BY) license (https://creativecommons.org/licenses/by/4.0/).
Share and Cite
MDPI and ACS Style
Zhao, L.; Huang, X. Two-Dimensional, Two-Layer Quality Regression Model Based Batch Process Monitoring. Processes 2022, 10, 43. https://doi.org/10.3390/pr10010043
AMA Style
Zhao L, Huang X. Two-Dimensional, Two-Layer Quality Regression Model Based Batch Process Monitoring. Processes. 2022; 10(1):43. https://doi.org/10.3390/pr10010043
Chicago/Turabian StyleZhao, Luping, and Xin Huang. 2022. "Two-Dimensional, Two-Layer Quality Regression Model Based Batch Process Monitoring" Processes 10, no. 1: 43. https://doi.org/10.3390/pr10010043
Note that from the first issue of 2016, this journal uses article numbers instead of page numbers. See further details here.