
Energy Consumption Optimization of Milk-Run-Based In-Plant Supply Solutions: An Industry 4.0 Approach


Institute of Logistics, University of Miskolc, 3515 Miskolc, Hungary
*
Author to whom correspondence should be addressed.
Processes 2023, 11(3), 799; https://doi.org/10.3390/pr11030799
Submission received: 27 January 2023
/
Revised: 27 February 2023
/
Accepted: 6 March 2023
/
Published: 7 March 2023
Abstract
:Smart factories are equipped with Industry 4.0 technologies including smart sensors, digital twin, big data, and embedded software solutions. The application of these technologies contributes to better decision-making, and this real-time decision-making can improve the efficiency of both manufacturing and related logistics processes. In this article, the transformation of conventional milk-run-based in-plant supply solutions into a cyber–physical milk-run supply is described, where the application of Industry 4.0 technologies makes it possible to make real-time decisions regarding scheduling, routing, and resource planning. After a literature review, this paper introduces the structure of Industry 4.0 technologies supported by milk-run-based in-plant supply. A mathematical model of milk-run processes is described including both scheduling and routing problems of in-plant supply. This mathematical model makes it possible to analyze the impact of Industry 4.0 technologies on the efficiency, performance, and flexibility of in-plant supply logistics. The scenarios’ analysis validates the mathematical model and shows that significant performance improvement and energy savings can be achieved using Industry 4.0 technologies. This performance improvement can lead to a more cost-efficient and sustainable in-plant supply solution, where not only logistics aspects but also energy efficiency and emissions can be taken into consideration.
1. Introduction
The manufacturing sector benefits from new technological development including new product development, time-to-market reduction, cost-effective use of manufacturing resources, and personalized production supplying [1]. To validate smart manufacturing, essential issues should be taken into consideration, which include interoperability, developing the integration of the technologies, developing the technologies themselves, and customization of the support for technology development and implementation as required practically [2]. Smart factory expresses the integration and combination of Industry 4.0 (I4.0) technologies in the manufacturing sector. We found that the terms ‘smart’ and ‘intelligent’ are used interchangeably to show various aspects of ‘smartness’ or ‘intelligence’ by applying advanced manufacturing systems. The papers found in a review study [3] covered various areas of smartness/intelligence of the future factory next to a broad range of activities and proposed models, algorithms, methodologies, frameworks, and other tools, which support developing and applying the technology in order to fit the actual needs in manufacturing covering different recognition levels toward the implementation and deployment in a real factory. In addition, to counter the highly diverse customer demands within new manufacturing systems next to the constantly increasing product variety and continuous mass customization, the single-model assembly lines transferred to mixed-model assembly lines in manufacturing [4]. The mixed model for the assembling line in the mass production method works on the assembly of several variants of finished products within the same assembly line that contributes to the realization of lean production in automobile companies. However, the large number of component variables makes it more difficult for just-in-time (JIT) materials to arrive within the mixed-model assembling lines, which leads to a significant challenge in the problem of supplying the materials in manufacturing systems [5].
One of the important methods in delivery is the milk-run, which allows the movement of small quantities of various items with predictable lead times from many suppliers to a customer. The main goal of this method is to minimize the costs of transportation that comes from minimizing the transportation distance and maximizing the vehicle capacity. The uncertainties and effects in the arrival times of vehicles and loading times of shipments are also to be considered in modeling the problems of milk-run [6]. A milk-run material-feeding problem was analyzed and used in different approaches such as being researched based on a two-level logistics network for mixed-model assembly lines that was proposed as a series of material-feeding tasks and performed by a group of electrical vehicles between the central warehouse and the line-integrated. That problem aimed to minimize the number of used vehicles and, at the same time, maximize the electric vehicle traveling distance, which leads in the same direction of raising the efficiency of cost and energy requests within the JIT production of automobile manufacturing [7]. While I4.0 and manufacturing digitalization were once considered among future directions [8], they are currently considered a main part of the manufacturing plans for transformation into a more customer-oriented inclusion within mass customization as this is among the strategic priorities for manufacturers who are looking for sustainable competitiveness [9]. This supported the planning of the regular small-lot deliveries from a decentralized storage point into various locations. Loading and delivery schedule problems aimed to be optimized. The optimization included the selection of material types and quantities next to the best sequence of materials that should be delivered to each assembly station at each time with the aim of minimizing the total cost related to material transportation and storage at stations [10]. Modern optimization algorithms have become commonly used in logistics applications such as heuristic and metaheuristic approaches [11], and this is reflected directly in the relationships with the sustainability aspect [12], for instance, by raising productivity efficiency [13] or decreasing GHG emissions.
The purpose of this research is to describe a novel mathematical model, which makes it possible to integrate the Manufacturing Execution System (MES) data-based and real-time-generated supply demands to decrease the energy consumption and virtual GHG emission of milk-run trolleys. The scope of this research is an optimization approach that is based on the application of I4.0 technologies with the aim of improving the efficiency, flexibility, and sustainability of the in-plant supply.
This article presents a new approach for in-plant supply systems based on I4.0 technologies including digital twin and milk-run approaches with the aim of energy consumption optimization. After a literature review that states the main contribution of the previous studies in this area, the structure of the I4.0 technologies supported milk-run-based in-plant supply is presented and described including the enterprise level, management level, supervisory level, digital twin of the control and field level, and control and field level. After that, a mathematical model is described focusing on the evaluation and optimization of the energy efficiency of the I4.0 technologies supported by in-plant supply. This described optimization includes both conventional milk-run-based in-plant supply optimization and real-time milk-run-based in-plant supply optimization supported by I4.0 technologies. Then, a numerical analysis is presented for the two described models in different scenarios with comparative analysis between them. In the end, a final discussion of this study is presented including the managerial decisions, limitations, and possible further studies.
2. Literature Review
Within this chapter, a literature review is presented about the impact of I4.0 technologies on the optimization of the energy consumption of milk-run-based in-plant supply solutions. A proposed model of the master production scheduling process of a group of SMEs was presented as a starting point toward digitalization to find a guide for the digital transformation of manufacturing in the SMEs’ medium-term production planning process [14], and it was identified that I4.0 technologies could improve medium-term planning and be integrated into a standardized MPS process model. Another article [15] presented a multi-objective evolutionary approach based on decomposition for efficiently addressing the multi-objective flow shop problem, which showed the competitiveness of the proposed approach compared with other baseline metaheuristics. Scheduling optimization within in-plant supplying was tackled within different aspects, such as the graduation-inspired synchronization framework [16] that showed superiority compared to the others on average and displayed minor variations in statistics regarding cost-efficiency, punctuality, and simultaneity measures, indicating that it was more effective, stable, and resilient in stochastic environments, or by a proposed system [17] that presented a two-phased solution provided to improve the communication within data-heterogeneous networks achieving maximum network throughput. In addition, less delay was demonstrated by using a simulation based on digital twins and IoT devices that communicate seamlessly in I4.0 networks. Furthermore, smart manufacturing scheduling was identified to set up a conceptual and structured relationship framework to raise the effectiveness of the scheduling process toward better flexibility, through enhanced rescheduling ability, and toward autonomous operation, mainly supported by the use of machine learning technology based on several reviewed contributions [18] from the I4.0 perspective or even I5.0 solutions [19] that served as a starting point for R&D projects and algorithm developments, which are needed in the field of multiagent, multistage and inverse optimizations. In addition, I4.0 technologies were adopted into optimization models in another application [20] where the new system and mathematical model were described and showed a major advantage. On the other side, a study showed that the benefit of using integrated real-time in the designed models in the scheduling process depended on the proper choice of both the scheduling approach and the solution procedures, and in a few scenarios, this usage was even counterproductive [21], which encourages further research regarding the design of approaches and solution procedures that allow fully exploiting the technological advances of I4.0 for decision-making in scheduling.
An investigation of I4.0 technologies’ adoption by manufacturing companies confirmed the efficiency growth as a result of this adoption [22], where the automation of production planning and scheduling next to industrial robots for handling processes showed significant relationships with improving the environmental impact and productivity. Among the production planning and scheduling, a milk-run solution in the logistics field showed a possible approach to achieve more benefits and higher efficiency. This solution was tackled from various perspectives in the research field as it was found in the literature. It was discussed as a tool to improve logistics flows processed next to lean production tools in a case study [23]. Among the reached conclusions, they determined that manufacturers could become more agile and increase customer service levels while reducing the cost of custom manufacturing by using a milk-run approach. In another study in Turkey [6], an optimization model was presented to minimize the transportation cost by minimizing the travel distance and maximizing vehicle capacity while it tackled a milk-run situation. It was also considered [24] as a solution to minimize carbon emissions and reduce the distribution cost of logistics enterprises, and it was described as a win-win situation for social and economic aspects. In another consideration for forward and reverse milk-run vehicle routing and scheduling, constraints imposed by an in-plant distribution network were modeled [25]. It was used to determine the number and time of transport trips, and the proposed model met the need for alternative and repeated formulation of successive forward and reverse decision problems. Further, in a German automotive component manufacturer [26], a milk-run solution was applied for the collected goods from several suppliers to be transported to an individual customer and the collected goods from a distinct supplier to be delivered to a diverse group of customers. It aimed for a probable opportunity to minimize the procurement cost of the raw materials because the number of trucks used for the transportation of goods was reduced, which reduced the operating cost by saving fuel and time and thus increased the company’s profit margin by reducing production costs.
As a summary of the literature review, the following points are found:
- The literature stated various applications of the developed I4.0 technologies in the manufacturing and in-plant supply areas with a high potential of raising the efficiency of energy consumption. This reflects the high expectations of achieving a positive impact through the adoption of these technologies.
- I4.0 technologies are expected to contribute directly to digitalization, full product life analysis, dynamic feedback, and other tools that could achieve more deep and inclusive analysis to reach higher optimization in the investigated systems.
- While many studies worked on finding and presenting the benefits of I4.0 technologies in manufacturing and in-plant supply, further research focus and details are expected. Especially, some studies showed contradictory results to what was expected with no clear/direct correlation. Therefore, presenting new models and modeling plays a positive part in this direction.
- A scientific gap regarding the actual impact of I4.0 technologies on in-plant supply systems does exist especially regarding real-time optimization. While the potential positive impact has been claimed to be shown, validating this impact was limited to specific situations without general studies that showed a full description of the system’s structure and mathematical modeling.
Therefore, the scientific gap identifies the problem of functional integration for the MES data-based and real-time-generated supply demands even though it showed the potential to decrease energy consumption and GHG emissions. We aim to contribute to solving this problem by taking an important step in presenting an innovative system that includes both scheduling and routing problems with detailed mathematical modeling which is an essential step in implementing such a system. Numerical analysis is also aimed to be applied to validate the presented model.
3. Structure of I4.0-Based In-Plant Supply
As the above literature review showed, the application of I4.0 technologies can lead to a significant increase in the performance of manufacturing and service processes. It is especially important in the case of the in-plant supply processes of manufacturing systems, where the availability, flexibility, and efficiency of logistics processes have a great impact on manufacturing operations; therefore, it is unavoidable that I4.0 technologies will be applied to improve conventional in-plant supply systems and transform them into cyber–physical systems. This transformation can lead to real-time in-plant supply optimization, which is important to take dynamically changing demands, status, and failure data into consideration (Figure 1).
The structural model of I4.0 technologies supported by milk-run-based in-plant supply includes the following levels:
- Enterprise level: the enterprise level is represented by Enterprise Resource Planning (ERP), where all strategic decisions are made. The ERP includes the following main modules: inventory, sales, finance, services, human resources, procurement or purchasing, and customer relationship management. The production module focuses on scheduling and quantitative analysis, while the shop-floor process operations are managed by the MES in real-time, based on the results of the supervisory level, as mentioned in Pyramid Solutions [27].
- Management level: the management level is represented by the MES, which focuses on productivity and cost efficiency by using the following MES modules and functions: delivery, inventory, reports, work orders, statistical process control (SPC), work orders, tracking, work instructions, resource management, and equipment interfacing.
- Supervisory level: the supervisory level supports the optimization processes of the MES through simulation, analysis, and forecasting. The simulation model of the discrete event simulation software is a dynamic real-time model, which is permanently upgraded by the digital twin of the real-world system, including technological and logistics processes. The technological processes include the manufacturing zone, while logistics includes the warehousing zone and the resources of in-plant supply, e.g., the milk-run trolley pool. The supervisory level is responsible for the support of MES functions, including optimization of shop-floor processes and in-plant supply optimization.
- Digital twin of the control and field level: in the digital level of the model, we can define three levels of maturity of digital twin solutions: digital model, digital shadow, and digital twin. In the case of the digital model, we are talking about a digital copy of the physical system, where the data exchange is performed manually in both directions between the physical and digital systems. In the case of digital shadow, status and failure data is uploaded from the physical system to the digital shadow, while in the other direction, the data upload is automatic. In the case of the digital twin, the data exchange is performed automatically. The digital twin is a digital reproduction of the physical system, which represents all parameters of the physical system based on status information and failure data from sensors, sensor networks, and sensor hubs. Big data is especially important in the case of the digital twin because sensors collect data with big volume, velocity, and variety. The digital aggregate represents processes, the digital prototype products, while the digital environment is a copy of the physical environment of the physical system. The digital twin generates a real-time model based on the status information and failure data of the manufacturing system, warehouse, and in-plant supply logistics, and this real-time model is uploaded to the discrete event simulation. The real-time upgraded simulation model is a very important part of the model because the simulation and optimization of the integrated manufacturing and in-plant supply system can be efficiently performed only with a real-time upgraded model including the current status of resources and processes.
- Control and field level: the control and field level is represented by the real-world system, where the physical components of the manufacturing and logistics operations are integrated into a value chain. The physical level of the model includes the following I4.0 technologies: smart sensors, sensor networks, sensor hubs, edge computing, intelligent tools, gentelligent products or components, robots, AGVs, cobots, and RFID technologies for identification or location detection. The monitoring of technological and logistics resources is performed by smart sensors and sensor networks. These smart sensors, sensor networks, and sensor hubs collect data from the physical system and perform predefined preprocessing and statistical analysis to create a predefined specific input regarding status information and failure data. The preprocessed information is sent to an IoT gateway through RFID, Bluetooth, or Message Queue Telemetry Transport (MQTT), which is the standard messaging protocol for IoT solutions. The monitoring of the tool condition can be automatized by using intelligent tools, where in-built microsensors can send information regarding the status of the machining tool [28]. Gentelligent products generate information about their creation, distribution, and use, including their life cycle. Gentelligent products in the physical processes can support the decision-making regarding operations required in the manufacturing and logistics processes [29]. In our model, the sensor data is coming from manufacturing resources, warehouse equipment, milk-run trolleys, products, and also from operators.
Based on the above-mentioned application, it is possible to define a mathematical model and to optimize the in-plant supply taking not only MES data-based predefined supply demands but also real-time through the supervisory level generated in-plant supply demands into consideration. In the next section, the mathematical model of the conventional and I4.0 technologies supported milk-run-based in-plant supply is described.
4. Mathematical Model of I4.0 Technologies Supported In-Plant Supply Optimization
Within the frame of this section, a mathematical model is described, focusing on the evaluation and optimization of the energy efficiency of I4.0 technologies supported by in-plant supply. The objective function of the optimization model is the energy efficiency of the milk-run-based in-plant supply, while time and capacity-related constraints are taken into consideration. Depending on the source of the in-plant supply demand, we can define two different types of scheduling. In-plant supply demands generated by the MES can be scheduled before a specific, predefined time window, while new in-plant supply demands generated by the supervisory level must be scheduled in real-time. The supervisory level can generate real-time in-plant demands depending on the status information and failure data uploaded from the digital twin of the manufacturing, warehouse, or milk-run trolley depot zone, and the prescheduled, MES-based routing must be upgraded in order to fulfill the new in-plant supply demands. In this section, the conventional milk-run-based in-plant supply model and the real-time milk-run-based in-plant supply model supported by I4.0 technologies are described.
4.1. Conventional Milk-Run-Based In-Plant Supply Optimization
The optimization model of the conventional milk-run-based in-plant supply includes the following main parts:
- the objective function (minimization of energy consumption and emission);
- time-based constraints;
- capacity-based constraints;
- sequence-based constraints;
- energy-based constraints;
- decision variable (optimal routing and scheduling of MES-based and real-time supply demands).
In the case of conventional optimization, we can define two solutions: in the first case, only MES data-based in-plant supply demands are taken into consideration, while in the second case, real-time demands are also added to the routes as separated supply operations. A description of the nomenclature is presented in Nomenclature.
4.1.1. Objective Function of Conventional Milk-Run-Based In-Plant Supply Optimization
The objective function of the milk-run-based in-plant supply can be defined depending on the routing and scheduling of the milk-run trolleys:
where is the energy consumption of the milk-run-based in-plant supply solution within the time frame of the analysis, is the length of the route scheduled between the milk-run trolley depot and the first station of the in-plant supply in the case of route i, is the weight of the loading of the milk-run trolley between the milk-run trolley depot and the first station of the in-plant supply in the case of route i, is the length of the route scheduled between the last station and the milk-run trolley depot of the in-plant supply in the case of route i, is the weight of the loading of the milk-run trolley between the last station and the milk-run trolley depot of the in-plant supply in the case of route i, is the length of the route scheduled between station j and station j + 1 in the case of the milk-run route i, is the weight of the loading of the milk-run trolley between station j and station j + 1 in the case of the milk-run route i, is the specific energy consumption of the milk-run trolley depending on the weight of the loading of the milk-run trolleys: , is the number of stations assigned to route i, is the assignment matrix, which is the decision variable of the optimization problem, as the ID of th station of route based on MES data-generated in-plant supply demands, is the specific energy consumption of material handling operations, and is the weight of loaded/unloaded products at the station j of route i (difference of weight before and after station i).
4.1.2. Time-Related Constraints of the Conventional Optimization
In the case of MES-generated in-plant supply demand, the time-related constraint can be defined depending on the scheduled route for the first station of the route as follows:
where is the lower limit of the arrival time of the milk-run trolley to the first station of the scheduled route i, is the upper limit of the arrival time of the milk-run trolley to the first station of the scheduled route i, and is the velocity of the milk-run trolley depending on the loading between the milk-run trolley depot and the first station of route i.
In the same way, we can define this time limit for the stations before the last station as follows:
where is a station between the first station and the depot of the milk-run trolley and , is the velocity of the milk-run trolley depending on the loading between station j and j + 1.
We can also define time-related constraints for the depot of the milk-run trolley:
In the case of a conventional milk-run-based in-plant supply, new supply demands are assigned to new supply routes, which means that new milk-runs must be initialized, and this can lead to a significantly increased cost. In the case of a conventional in-plant supply, the (2–4) time-related constraints can be taken into consideration, where the number of routes can be increased by the number of demands generated by the supervisory level.
The time-related constraint for the first station of the routes after adding new milk-runs based on the real-time supply demands to the scheduled supply demands can be defined as follows:
where is the number of routes after adding new milk-runs based on the real-time in-plant supply demand and is the number of supply demands generated by the supervisory level.
In the same way, we can define the time limit for the stations before the last station after adding new milk-runs based on the real-time supply-demand as follows:
We can also define in the case of the conventional scheduling of real-time in-plant supply demands time-related constraints for the depot of the milk-run trolley after adding new milk-runs based on the real-time supply-demand as follows:
where is the number of milk-runs routed after adding new milk-runs to the MES-based scheduled routes.
4.1.3. Capacity-Related Constraint of the Conventional Optimization
The capacity-based constraint takes the capacity of the milk-run trolleys into consideration. In the case of MES data-based in-plant supply optimization, the capacity-based constraint can be defined as follows:
- in the case of the first station:
- in the case of the station between the start and end point of the route (these points are generally in the milk-run trolley depot):
- in the case of the last station of the route (generally in the milk-run trolley depot after arrival):
This capacity-based constraint can be transformed to take real-time demands added to the scheduled route into consideration:
- in the case of the first station:
- in the case of the station between the start and end point of the route (these points are generally in the milk-run trolley depot):
- in the case of the last station of the route (generally in the milk-run trolley depot after arrival):
4.1.4. Sequence-Related Constraints of the Conventional Optimization
We can also describe sequencing-related constraints, where specific sequences of stations can be predefined. This sequencing-related constraint can be written as follows in the case of MES data-based optimization using an existential quantifier:
where defines the succeeded station.
This sequence-based constraint can be transformed to take real-time demands added to the scheduled route into consideration:
4.1.5. Energy Consumption-Related Constraints of the Conventional Optimization
The milk-run trolleys are working with electricity; therefore, the capacity of their batteries is also an important energy-based constraint, which is especially important in the case of heavy loadings and long in-plant supply distances.
This energy consumption-based constraint can be defined in the case of conventional in-plant supply routing and scheduling as follows:
- in the case of MES data-based conventional routing and scheduling:
- in the case of the conventional optimization of MES data-based and added real-time demands:
The results of the numerical analysis of this model are discussed in Section 5.1.
4.2. Real-Time Milk-Run-Based In-Plant Supply Optimization Supported by I4.0 Technologies
The optimization model of the I4.0 technologies supported by real-time milk-run-based in-plant supply is presented in Figure 2.
The model includes the following main parts:
- the objective function (minimization of the energy consumption and emissions after adding MES data-based and real-time in-plant supply demands);
- time-based constraints (both the MES data-based and real-time supply demands must be performed within a predefined specific time window);
- capacity-based constraints (it is not allowed to exceed the capacity of the milk-run trolleys);
- sequence-based constraints (the predefined sequences of stations must be taken into consideration);
- energy-based constraints (the available energy of the battery must be taken into consideration);
- decision variable (optimal routing and scheduling of MES-based and real-time supply demands).
In the case of I4.0-technology-based optimization, the real-time data regarding failures and status can be taken into consideration and the existing, scheduled routes can be rescheduled in real-time; therefore, no additional milk-run routes must be started.
4.2.1. Objective Function of I4.0-Supported Milk-Run-Based In-Plant Supply Optimization
In the case of the I4.0-technology-based in-plant supply operation, it is possible to optimize the MES data-based scheduled routes and modify the existing routes in real-time to add the new in-plant supply demands generated by the supervisory level. In this case, the objective function can be transformed into a new objective function, where the milk-runs perform not only the MES data-based supply demands but also the real-time demands generated by the supervisory level:
where is an assignment matrix, which is the decision variable of the optimization problem, as the ID of th station of route based on real-time in-plant supply demands generated by the supervisory level, and is the number of stations added to route i including both MES-based and supervisory-level-based in-plant supply demands.
4.2.2. Time-Related Constraints of the I4.0-Supported Real-Time Optimization
In the case of real-time scheduling, the (2–4) time-related constraints can be modified because in this case the real-time in-plant supply demands are integrated into the MESdata-based scheduled routes.
In the case of real-time in-plant supply optimization, the time-related constraint can be defined depending on the scheduled route for the first station of the route as follows:
where is the lower limit of the arrival time of the milk-run trolley to the first station of the scheduled route i after adding all real-time supply demand generated by the supervisory level, is the upper limit of the arrival time of the milk-run trolley to the first station of the scheduled route i after adding all real-time supply demand generated by the supervisory level, is the velocity of the milk-run trolley depending on the loading between the milk-run trolley depot and the first station of route i after adding all real-time supply demand generated by the supervisory level. If the rescheduling of the in-plant supply routes is performed after the milk-run trolley passes the first station of their route, then and .
In the case of real-time in-plant supply optimization, we can define this time limit in the same way for the stations before the last station as follows:
where is a station between the first station and the depot of the milk-run trolley after adding the real-time in-plant supply demands to the scheduled milk-run.
We can also define these time-related constraints for the depot of the milk-run trolley as follows:
4.2.3. Capacity-Related Constraints of the I4.0-Supported Real-Time Optimization
The capacity-based constraint takes the capacity of the milk-run trolleys into consideration. In the case of the scheduling and routing of both MES data-based and real-time supply demands, the capacity-based constraint can be defined as follows:
- in the case of the first station:
- in the case of the stations between the start and end point of the route (these points are generally in the milk-run trolley depot):
- in the case of the last station of the route (generally in the milk-run trolley depot):
4.2.4. Sequence-Related Constraints of the I4.0-Supported Real-Time Optimization
We can describe sequencing-related constraints, where specific sequences of stations can be predefined including existing in-plant supply tasks and new real-time tasks to be scheduled. This sequencing-related constraint can be written as follows:
4.2.5. Energy-Related Constraints of the I4.0-Supported Real-Time Optimization
This energy consumption-based constraint can be defined in the case of the I4.0-supported real-time in-plant supply routing and scheduling as follows:
The results of the numerical analysis of this model are discussed in Section 5.2.
5. Results of the Numerical Analysis
Within the frame of this section, the above-described in-plant supply models are validated using two different scenarios. The optimization of the scenarios was performed by Excel Evolutive Solver, but in the case of large-scale problems other solvers for NP-hard problems can be used (Matlab, Gurobi, GNU Octave, Octerant, or SciLab). The first scenario analyzes the conventional scheduling and routing of MES data-based in-plant supply and the conventional scheduling and routing of real-time in-plant supply generated by the supervisory level, while the second scenario focuses on the computational results of real-time milk-run-based in-plant supply optimization supported by I4.0 technologies.
The input parameters of both optimization problems are the following:
- the layout of the plant including the manufacturing zone, warehousing zone, and milk-run trolley depot, which defines the location of each manufacturing and logistics resource and the distances between them;
- MES data-based supply demands for a predefined specific time window (Table 1);
- sources and destinations of MES data-based supply demands (Table 1);
- predefined specific time frames for MES data-based supply demands (Table 1);
- real-time supply demands for a predefined specific time window (Table 2);
- sources and destinations of real-time-generated supply demands (Table 2);
- predefined specific time frames for real-time-generated supply demands (Table 2);
- capacity and net weight of milk-run trolleys;
- the average velocity of milk-run trolleys;
- specific energy consumption of the transportation of components by milk-run trolleys depending on the weight of loading;
- specific energy consumption of material handling operations (loading and unloading of milk-run trolleys) depending on the weight of components.
The following assumptions are taken into consideration in the numerical analysis:
- it is not allowed to exceed time-related constraints (time windows for supply demands);
- it is not allowed to exceed the capacity of milk-run trolleys;
- the number of available milk-run trolleys is limited, and it is not allowed to exceed;
- the MES-generated supply demands are not changing within a time window;
- it is not allowed to exceed the available energy of milk-run trolleys (battery capacity is limited);
- the velocity of milk-run trolleys is constant, but in further models, acceleration can also be taken into consideration;
- real-time-generated supply demands are scheduled within the current time window.

Table 1.
MES data-based supply demands of the in-plant supply optimization problem.
| C_ID 1 | Type 2 | From 3 | To 4 | LOAD 5 | TFRAME 6 | C_ID 1 | Type 2 | From 3 | To 4 | LOAD 5 | TFRAME 6 |
|---|---|---|---|---|---|---|---|---|---|---|---|
| C_01 | LO | C_00 | - | 9 | 03:50:00–03:53:00 | C_10 | LO | C_00 | - | 8 | 03:59:00–04:04:00 |
| C_02 | UNLO | - | C_10 | 40 | 03:40:00–03:42:00 | C_10 | UNLO | - | C_00 | 7 | 04:24:00–04:25:00 |
| C_02 | LO | C_00 | - | 2 | 03:52:00–03:53:00 | C_11 | LO | C_00 | - | 10 | 04:00:00–04:04:00 |
| C_02 | UNLO | - | C_04 | 17 | 03:52:00–03:57:00 | C_11 | UNLO | - | C_16 | 8 | 04:02:00–04:05:00 |
| C_03 | LO | C_14 | - | 21 | 03:42:00–03:45:00 | C_11 | LO | C_07 | - | 7 | 04:24:00–04:27:00 |
| C_03 | UNLO | - | C_00 | 15 | 03:42:00–03:44:00 | C_11 | UNLO | - | C_00 | 36 | 04:27:00–04:30:00 |
| C_03 | LO | C_00 | - | 9 | 03:54:00–03:57:00 | C_12 | LO | C_00 | - | 12 | 03:28:00–03:30:00 |
| C_03 | LO | C_00 | - | 18 | 04:21:00–04:24:00 | C_12 | LO | C_00 | - | 12 | 03:47:00–03:50:00 |
| C_04 | LO | C_07 | - | 14 | 03:44:00–03:47:00 | C_12 | UNLO | - | C_13 | 8 | 04:15:00–04:17:00 |
| C_04 | LO | C_02 | - | 17 | 03:55:00–03:57:00 | C_13 | LO | C_12 | - | 8 | 04:15:00–04:20:00 |
| C_04 | UNLO | - | C_00 | 8 | 03:55:00–03:57:00 | C_13 | UNLO | - | C_08 | 14 | 04:16:00–04:20:00 |
| C_04 | UNLO | - | C_00 | 5 | 04:22:00–04:24:00 | C_14 | UNLO | - | C_03 | 21 | 03:30:00–03:32:00 |
| C_05 | UNLO | - | C_00 | 5 | 03:56:00–03:59:00 | C_14 | LO | C_00 | - | 2 | 04:06:00–04:08:00 |
| C_05 | LO | C_00 | - | 15 | 03:57:00–04:04:00 | C_14 | LO | C_16 | - | 20 | 04:30:00–04:35:00 |
| C_06 | LO | C_07 | - | 11 | 03:58:00–04:04:00 | C_15 | UNLO | - | C_00 | 10 | 03:46:00–03:50:00 |
| C_07 | LO | C_00 | - | 21 | 03:35:00–03:40:00 | C_16 | LO | C_00 | - | 25 | 03:30:00–03:35:00 |
| C_07 | UNLO | - | C_04 | 14 | 03:35:00–03:40:00 | C_16 | LO | C_11 | - | 8 | 04:03:00–04:05:00 |
| C_07 | LO | C_00 | - | 8 | 03:48:00–03:50:00 | C_16 | LO | C_00 | - | 10 | 04:28:00–04:30:00 |
| C_07 | UNLO | - | C_06 | 11 | 03:48:00–03:50:00 | C_16 | UNLO | - | C_14 | 20 | 04:30:00–04:32:00 |
| C_07 | UNLO | - | C_11 | 7 | 04:18:00–04:20:00 | C_17 | UNLO | - | C_00 | 7 | 04:03:00–04:06:00 |
| C_08 | LO | C_13 | - | 14 | 04:19:00–04:22:00 | C_17 | LO | C_00 | - | 16 | 04:27:00–04:30:00 |
| C_10 | LO | C_02 | - | 40 | 03:45:00–03:47:00 | C_17 | UN | - | C_00 | 2 | 04:28:00–04:30:00 |
1 C_ID = Identification number of the assembly or manufacturing cell. 2 Type = Type of the material-handling operation at the assembly or manufacturing cell (LO = Loading and UNLO = Unloading). 3 From = Source of the components to be transported to the assembly or manufacturing cell. 4 To = Destination of the components loaded at a specific assembly or manufacturing cell. 5 LOAD = Load of the milk-run trolley [LU]. 6 CLO = Cumulative loading after passing the specific station [LU].
Table 2.
Real-time-generated supply demands of the in-plant supply optimization problem.
| C_ID 1 | Type 2 | From 3 | To 4 | LOAD 5 | TFRAME 6 |
|---|---|---|---|---|---|
| C_01 | UNLO | - | C_17 | 12 | 03:40:00–03:42:00 |
| C_17 | LO | C_01 | - | 12 | 03:46:00–03:50:00 |
| C_17 | UNLO | - | C_15 | 24 | 04:03:00–04:06:00 |
| C_15 | LO | C_17 | - | 24 | 04:03:00–04:08:00 |
| C_07 | UNLO | C_00 | - | 34 | 04:15:00–04:17:00 |
| C_05 | UNLO | - | C_15 | 21 | 04:20:00–04:30:00 |
| C_15 | LO | C_05 | - | 21 | 04:22:00–04:35:00 |
1 C_ID = Identification number of the assembly or manufacturing cell. 2 Type = Type of the material-handling operation at the assembly or manufacturing cell (LO = Loading and UNLO = Unloading). 3 From = Source of the components to be transported to the assembly or manufacturing cell. 4 To = Destination of the components loaded at a specific assembly or manufacturing cell. 5 LOAD = Load of the milk-run trolley [LU]. 6 CLO = Cumulative loading after passing the specific station [LU].
5.1. Conventional Milk-Run-Based In-Plant Supply Optimization
The conventional milk-run-based in-plant supply includes two main phases. Within the first phase, the MES data-based supply demands are scheduled, while in the second phase, the real-time-generated supply demands are scheduled and assigned to new supply routes of milk-run trolleys.
5.1.1. Conventional Scheduling and Routing of MES Data-Based In-Plant Supply
In the first part of Scenario 1, three different milk-run routes are defined for MES-data-based in-plant supply demands. These routes represent a theoretical scenario. This part of Scenario 1 takes only the MES data-based supply demands of the in-plant supply optimization problem into consideration (Table 1). In the case of route 1, 10 in-plant supply demands are performed and all of them are within the predefined time window (Figure 3 and Table 3).
In the case of route 2, 17 in-plant supply demands are performed and all of them were between the predefined time window (Figure 4 and Table 4).
In the case of route 3, 14 in-plant supply demands are performed and all of them were between the predefined time window (Figure 5 and Table 5).
The loading of milk-run trolleys is shown in Figure 6. As the figure demonstrates, the conventional optimization of MES-generated supply demands was successful because not only the time window for each supply demand was taken into consideration but also the predefined loading capacity of milk-trolleys was not exceeded.
The cumulative energy consumption of the three routes is shown in Figure 7. The total energy consumption was computed for 100 routes. The total energy consumption including transportation and material-handling operations was 1307.9 kW for the first route, 1043.5 kW for the second route, and 1048 kW for the third route, which means a total energy consumption of 3399.4 kW out of which 2661.5 kW is for transportation and 737.9 kW is for the loading and unloading of components. The loading and unloading operations include all material-handling operations both in the warehouse and at the stop stations of the milk-run trolleys.
5.1.2. Conventional Scheduling and Routing of Real-Time In-Plant Supply Generated by the Supervisory Level
In the second part of Scenario 1, three different milk-run routes are defined for real-time-generated in-plant supply demands. This part of Scenario 1 takes only real-time-generated supply demands of the in-plant supply optimization problem into consideration (Table 2). In the case of route 1, two in-plant supply demands are performed and all of them are within the predefined time window (Figure 8 and Table 6).
It is not possible to integrate the supply of real-time-generated demands into one milk-run route because the defined time windows are different (the difference between the minimum of the lower time limits and the maximum of the upper time limits is 55 min) and it is not allowed for the milk-run trolleys to wait in the manufacturing zone.
Figure 8.
The first route of the conventional milk-run-based in-plant supply including real-time supply demand.
Figure 8.
The first route of the conventional milk-run-based in-plant supply including real-time supply demand.

Table 6.
Numerical results of the conventional optimization of real-time supply demands performed by the milk-run trolley within the additional route 4.
Table 6.
Numerical results of the conventional optimization of real-time supply demands performed by the milk-run trolley within the additional route 4.
| S_ID * | C_ID 1 | Type 2 | From 3 | To 4 | LOAD 5 | CLO 6 | TFRAME 7 | TSCHED 8 | ECT 9 | ECH 10 | EC 11 |
|---|---|---|---|---|---|---|---|---|---|---|---|
| S_00 | C_00 | - | - | - | 100 | 100 | - | 3:38:20 | 0.0 | 0.0 | |
| S_01 | C_01 | UNLO | - | C_17 | 12 | 112 | 03:40:00–03:42:00 | 3:41:19 | 99.4 | 10.2 | 109.7 |
| S_02 | C_17 | LO | C_01 | - | 12 | 100 | 03:46:00–03:50:00 | 3:46:39 | 217.6 | 10.2 | 337.5 |
| S_03 | C_00 | - | - | - | 0 | 100 | - | 3:51:28 | 173.4 | 0.0 | 510.9 |
* S_ID = Identification number of the stop of milk-run trolleys. 1 C_ID = Identification number of the assembly or manufacturing cell. 2 Type = Type of the material-handling operation at the assembly or manufacturing cell (LO = Loading and UNLO = Unloading). 3 From = Source of the components to be transported to the assembly or manufacturing cell. 4 To = Destination of the components loaded at a specific assembly or manufacturing cell. 5 LOAD = Load of the milk-run trolley in the loading unit [LU]. 6 CLO = Cumulative loading after passing the specific station in the loading unit. 7 TFRAME = Predefined time frame; it is not allowed to exceed this lower and upper limit of the delivery time window. 8 TSCHED = Scheduled arrival and departure times of the milk-run trolley at the assembly or manufacturing cells. 9 ECT = Transportation-related energy consumption of the milk-run trolley. 10 ECH = Material-handling-related (loading and unloading) energy consumption at the assembly or manufacturing cells. 11 EC = Total energy consumption including transportation and material-handling-related energy consumption.
In the case of route 2, two in-plant supply demands are performed and all of them are within the predefined time window (Figure 9 and Table 7).
In the case of route 3, three in-plant supply demands are performed and all of them are within the predefined time window (Figure 10 and Table 8).
The conventional routing of real-time-generated supply demands was successful because not only the time window for each supply demand was taken into consideration but also the predefined loading capacity of milk-run trolleys was not exceeded (the loading of milk-run trolleys was quite low because there were only two or three supply demands assigned to a milk-run route).
The total energy consumption was computed for 100 routes. The total energy consumption including transportation and material-handling operations was 510.9 kW for the first route, 404.5 kW for the second route, and 526.3 kW for the third route, which means a total energy consumption of 1441.8 kW out of which 923.3 kW is for transportation and 518.4 kW is for the loading and unloading of components. The loading and unloading operations include all material-handling operations both in the warehouse and at the stop stations of the milk-run trolleys.
5.2. Computational Results of Real-Time Milk-Run-Based In-Plant Supply Optimization Supported by I4.0 Technologies
In the first part of Scenario 2, three different milk-run routes are defined integrating MES data-based in-plant supply demands and real-time supply demands generated by the supervisory level. I4.0 technologies make it possible to use real-time data to reschedule and reroute existing milk-runs by adding the new supply demands. In this case, no additional routes and trolleys are required. This part of Scenario 1 takes both MES data-based supply demands and real-time-generated demands. In the case of route 1, 12 in-plant supply demands are performed and all of them are within the predefined time window (Figure 11 and Table 9). It was possible to integrate one unloading operation at C_01 and one loading operation of the same component at C_17.
In the case of route 2, 19 in-plant supply demands are performed and all of them are within the predefined time window (Figure 12 and Table 10). It was possible to integrate one transshipment operation which includes one unloading operation at C_17 and one loading operation with the same component at C_15.
In the case of route 3, 17 in-plant supply demands are performed and all of them are within the predefined time window (Figure 13 and Table 11). It was possible to integrate one transshipment operation and one loading operation. The transshipment includes one unloading operation at C_05 and one loading operation with the same component at C_15, while the loading operation is performed between the warehouse (C_00) and C_07.
The loading of milk-run trolleys in the case of Scenario 2 is shown in Figure 14. As the figure demonstrates, the integrated real-time optimization of MES-generated supply demands and real-time demands was successful because not only the time window for each supply demand was taken into consideration but also the predefined loading capacity of milk-trolleys was not exceeded.
The cumulative energy consumption of the three routes is shown in Figure 15. The total energy consumption was computed for 100 routes. The total energy consumption including transportation and material-handling operations was 1448.7 kW for the first route, 1129.3 kW for the second route, and 1376.9 kW for the third route, which means a total energy consumption of 3954.9 kW out of which 3051.4 kW is for transportation and 903.5 kW is for the loading and unloading of components. The loading and unloading operations include all material-handling operations both in the warehouse and at the stop stations of the milk-run trolleys.
5.3. Comparative Analysis of Conventional and I4.0 Technologies Supported Milk-Run-Based In-Plant Supply Optimization in the Case of MES Data-Based and Real-Time Supply Demands
Based on the above-mentioned scenarios, it is possible to compare the results of conventional and I4.0-technologies-based real-time optimization of in-plant supply. As Table 12 shows, the average length of the required route per supply demand was 89.27 m/demand in the case of conventional optimization, while it was 33.19 m/demand in the case of real-time optimization. This transportation length reduction leads to a significant energy consumption reduction, which means that the average energy consumption per supply demand was 1.46 kW/demand in the case of conventional optimization and 0.81 kW/demand in the case of real-time optimization. Both these parameters can be analyzed for weight units. The average length of the required route per weight unit was 5.47 m/kg in the case of conventional routing, while in the case of real-time optimization, it was 2.17 m/kg. The average energy consumption per weight unit was 0.089 kW/kg in the case of conventional supply optimization and 0.053 kW/kg in the case of real-time routing. The average idle capacity was 72 kg in the case of conventional optimization and 45 kg in the case of real-time optimization. The capacity utilization of the milk-run trolleys was 28.4% in the case of conventional routing, while in the case of real-time routing, it was 54.2%. An important constraint of in-plant supply optimization is the time-related constraint, which defines that it is allowed to exceed the given time window for each supply demand and we have analyzed the average deviance of the actual supply time from the average of the lower and upper limit of each time window. This average deviation was 88 s in the case of conventional optimization, while in the case of real-time routing, it was 52 s. The same result is shown by the comparison of total deviances, which was 48 min in the case of conventional optimization, while in the case of real-time optimization, it was 43 min.
6. Discussion and Conclusions
Within the frame of this research work, the authors described a new approach focusing on the analysis of the impact of I4.0 technologies on the energy efficiency and performance of milk-run-based in-plant supply optimization.
6.1. Discussion
The presented new approach was supported by presenting detailed mathematical modeling. For having a reference function that we can compare to our new optimization model, we presented an objective function of conventional milk-run-based in-plant supply optimization. It depended on the routing and scheduling of the milk-run trolleys. All the models and related capacities and constraints were described in detail. After that, the objective function of I4.0 supported milk-run-based in-plant supply optimization was presented in detail as well. A numerical analysis was done to compare the results of the two scenarios for various routes. The loading and unloading operations included the material-handling operations both in the warehouse and at the stop stations of the milk-run trolleys.
As the comparison of the results showed, the average length of the required route per supply demand was 89.27 m/demand in the case of conventional optimization, while it was 33.19 m/demand in the case of real-time optimization. This reflects a 62.8% route-length saving. On other hand, the average energy consumption per supply demand was 1.46 kW/demand in the case of conventional optimization and 0.81 kW/demand in the case of real-time optimization. This reflects a 44.5% energy saving. In addition, the average energy consumption per weight unit was 0.089 kW/kg in the case of conventional supply optimization and 0.053 kW/kg in the case of real-time routing. This reflects a 40.4% energy saving, which concurs with the previous study [6] that showed how the optimization model helped to minimize travel distance and with other studies [13,17,24] where using I4.0 optimization and milk-run routes raised the energy efficiency for manufacturing systems in the automotive industry. Further, this supports the previous studies [22,25] that showed a positive impact of I4.0 technologies on the scheduling processes in manufacturing systems. Moreover, the average idle capacity was 72 kg in the case of conventional optimization and 45 kg in the case of real-time optimization. The capacity utilization of the milk-run trolleys was 28.4% in the case of conventional routing, while in the case of real-time routing, it was 54.2%. While this supports the previous study [6] that showed how the presented optimization maximized vehicle capacity, it helps to clarify the unclear results of other studies such as [21] which showed counterproductive outcomes.
The comparison of the conventional and real-time optimization showed that the application of I4.0 technologies can significantly increase the efficiency of in-plant supply, as well as energy efficiency. This is attributed to the usage of the digital twin in the first place where prolonged failure processes are avoidable. The results encourage this adoption and urge further steps of applying it in reality in the routing and scheduling processes, especially using the milk-run trolleys that showed a great advantage as one of the tools that support I4.0 technologies engagement.
6.2. Conclusions
The described model makes it possible to compare the impact of the application of I4.0 technologies on the operation parameters of routing and scheduling of milk-run trolleys in a manufacturing plant. More generally, this paper focuses on the mathematical description of conventional and real-time optimization of in-plant supply processes, where in the case of the conventional solution, the MES data-based and real-time supply demands are scheduled in a conventional way, while in the case of real-time optimization, MES-generated and real-time demands are taken into consideration using digital twin technology, dynamic simulation models, and real-time optimization. The results showed a high advantage for the I4.0-technologies-based real-time optimization of in-plant supply above the conventional one. This encourages and validates the adoption of I4.0 technologies in the in-plant supply operation and manufacturing generally.
The added value of the paper is in the description of the impact of the application of I4.0 technologies on the energy efficiency and performance of milk-run-based in-plant supply, while time, capacity, sequencing, and energy-related constraints are taken into consideration. The scientific contribution of this paper for researchers in this field is the mathematical modeling of routing and scheduling problems for conventional and real-time optimization. The results can be generalized because the model can be applied to different milk-run-based services (e.g., optimization of parcel delivery services).
As the literature review and the definition of research gaps shown in the literature reveals, the real-time optimization of in-plant supply is a potential way to improve the efficiency of milk-run-based in-plant supply. Without real-time optimization, real-time supply demands are usually added as new supply routes using additional milk-run trolleys, and this solution is not cost-efficient because of high idle capacity, idle routes, and energy consumption. This case study shows that the application of I4.0 technologies makes it possible to integrate real-time supply demands into scheduled, MES data-based supply routes, and this solution can significantly increase the flexibility of the whole manufacturing system. As demonstrated, not only the flexibility but also the energy efficiency can be increased, which leads to an increase in cost efficiency and a decrease in GHG emissions.
Managerial decisions can be influenced by the results of this research because the described method makes it possible to analyze available solutions for the routing and scheduling of milk-run-based in-plant supply and find a suitable application of I4.0 technologies to convert the conventional solution into a cyber–physical system, which can lead to potential real-time optimization. The scientific result of this research work is the mathematical description of conventional and I4.0 technologies supported by real-time in-plant supply. The mathematical model makes it possible to compare both solutions while optimizing the in-plant supply focusing on real-time-generated supply demands. However, there are also limitations of the study and the described model, which provides direction for further research. Within the frame of this model, the supply demands were taken into consideration as deterministic parameters, but it is possible to analyze in-plant supply in the case of stochastic parameters, where uncertainties can be taken into consideration using fuzzy models. In further studies, the model can be extended to a more complex model including other environmental aspects. I4.0 technologies are generally expensive technologies; therefore, another future research direction is the optimization of the investment cost of using I4.0 technologies, where not only the investment but also the operational costs can be analyzed.
The obtained results can be used in the future as input parameters for a digital-twin-based dynamic simulation, where the current status of the manufacturing and related logistics systems can be continuously updated to have a state-of-the-art model of a real-world system. As mentioned, the obtained results can also be used for managerial decisions regarding the investment in I4.0 technologies, the sizing of milk-run trolley pools, and strategic designs of routing.
The importance of the presented research work can be summarized from the aspects of the method, analysis, and results. Our approach includes an evaluation methodology, which makes it possible to analyze and compare the energy efficiency and logistics performance of conventional and I4.0 technologies supported by milk-run-based in-plant supply solutions in the case of real-time-generated supply demands. The results of the numerical analysis of case studies show that the deployment of I4.0 technologies can lead to increased energy efficiency which has a great impact on the efficiency of the whole manufacturing system.
Author Contributions
Conceptualization, M.Z.A. and T.B.; methodology, M.Z.A. and T.B.; software, M.Z.A. and T.B.; validation, M.Z.A. and T.B.; formal analysis, M.Z.A. and T.B.; investigation, M.Z.A. and T.B.; resources, M.Z.A. and T.B.; data curation, M.Z.A. and T.B.; writing—original draft preparation, M.Z.A. and T.B.; writing—review and editing, M.Z.A. and T.B.; visualization, M.Z.A. and T.B.; supervision, T.B.; project administration, M.Z.A. and T.B.; funding acquisition, T.B. All authors have read and agreed to the published version of the manuscript.
Funding
This work is supported by the ÚNKP-22-3 New National Excellence Program of the Ministry for Culture and Innovation from the source of the National Research, Development and Innovation Fund.
Data Availability Statement
No new data were created or analyzed in this study. Data sharing is not applicable to this article.
Conflicts of Interest
The authors declare no conflict of interest.
Abbreviations
| AGV | Automated Guided Vehicle |
| DB | Data Base |
| ERP | Enterprise Resource Planning |
| GHG | Green House Gas |
| I4.0 | Industry 4.0 |
| IoT | Internet of Things |
| JIT | Just-in-Time |
| MES | Manufacturing Execution System |
| MPS | Master Production Schedule |
| MQTT | Manage Queue Telemetry Transport |
| R&D | Research and Development |
| RFID | Radio Frequency Identification |
| SME | Small and Medium-Sized Enterprise |
| SPC | Statistical Process Control |
Nomenclature
| Energy consumption of the milk-run-based in-plant supply solution within the time frame of the analysis. | |
| Length of the route scheduled between the milk-run trolley depot and the first station of the in-plant supply in the case of route i. | |
| Weight of the loading of the milk-run trolley between the milk-run trolley depot and the first station of the in-plant supply in the case of route i. | |
| Length of the route scheduled between the last station and the milk-run trolley depot of the in-plant supply in the case of route i. | |
| Weight of the loading of the milk-run trolley between the last station and the milk-run trolley depot of the in-plant supply in the case of route i. | |
| Length of the route scheduled between station j and station j + 1 in the case of the milk-run route i. | |
| Weight of the loading of the milk-run trolley between station j and station j + 1 in the case of the milk-run route i. | |
| Specific energy consumption of the milk-run trolley depending on the weight of the loading of the milk-run trolley. | |
| Number of stations assigned to route i. | |
| Assignment matrix. | |
| Specific energy consumption of material-handling operations. | |
| Weight of loaded/unloaded products at station j of route i (difference of weight before and after station j). | |
| Lower limit of the arrival time of the milk-run trolley to the first station of the scheduled route i. | |
| Upper limit of the arrival time of the milk-run trolley to the first station of the scheduled route i. | |
| Velocity of the milk-run trolley depending on the loading between the milk-run trolley depot and the first station of route i. | |
| Station between the first station and the depot of the milk-run trolley. | |
| Velocity of the milk-run trolley depending on the loading between station j and j + 1. | |
| Number of routes after adding new milk-runs based on the real-time in-plant supply demand. | |
| Number of supply demands generated by the supervisory level. | |
| Number of milk-runs routed after adding new milk-runs to the MES-based scheduled routes. | |
| Succeeded station. | |
| Available capacity of the battery in the case of MES data-based routing. | |
| Available capacity of the battery in the case of the conventional integrated routing of MES data-based and real-time in-plant supply optimization. | |
| Assignment matrix. | |
| Number of stations added to route i including both MES-based and supervisory level-based in-plant supply demands. | |
| Lower limit of the arrival time of the milk-run trolley to the first station of the scheduled route i after adding all real-time supply demand generated by the supervisory level. | |
| Upper limit of the arrival time of the milk-run trolley to the first station of the scheduled route i after adding all real-time supply demand generated by the supervisory level. | |
| The velocity of the milk-run trolley depending on the loading between the milk-run trolley depot and the first station of route i after adding all real-time supply demand generated by the supervisory level. | |
| Station between the first station and the depot of the milk-run trolley after adding the real-time in-plant supply demands to the scheduled milk-run. |
References
- Romero, M.; Guédria, W.; Panetto, H.; Barafort, B. Towards a Characterisation of Smart Systems: A Systematic Literature Review. Comput. Ind. 2020, 120, 103224. [Google Scholar] [CrossRef]
- Kang, H.S.; Lee, J.Y.; Choi, S.; Kim, H.; Park, J.H.; Son, J.Y.; Kim, B.H.; Noh, S.D. Smart manufacturing: Past research, present findings, and future directions. Int. J. Precis. Eng. Manuf.-Green Technol. 2016, 3, 111–128. [Google Scholar] [CrossRef]
- Rosso, R.S.U.; Tsuzuki, M.d.S.G.; Barari, A.; Macchi, M. Transition towards Smart Factories. Int. J. Comput. Integr. Manuf. 2022, 35, 341–344. [Google Scholar] [CrossRef]
- Zhang, H.; Zhang, X.; Gao, X.Z.; Song, S. Self-organizing multiobjective optimization based on decomposition with neighborhood ensemble. Neurocomputing 2016, 173, 1868–1884. [Google Scholar] [CrossRef]
- Fager, P. Kit preparation for mixed-model assembly: Efficiency impact of confirmation methods. Ind. Manag. Data Syst. 2019, 119, 547–560. [Google Scholar] [CrossRef]
- Çakir, E.; Ulukan, Z.; Kahraman, C.; Saǧlam, C.Ö.; Kuleli Pak, B.; Pekcan, B. Intuitionistic fuzzy multi-objective milk-run modelling under time window constraints. J. Intell. Fuzzy Syst. 2022, 42, 47–62. [Google Scholar] [CrossRef]
- Zhou, B.; Zhao, L. A multi-objective decomposition evolutionary algorithm based on the double-faced mirror boundary for a milk-run material feeding scheduling optimization problem. Comput. Ind. Eng. 2022, 171, 108385. [Google Scholar] [CrossRef]
- Machado, C.G.; Winroth, M.P.; Ribeiro da Silva, E.H.D. Sustainable manufacturing in Industry 4.0: An emerging research agenda. Int. J. Prod. Res. 2019, 58, 1462–1484. [Google Scholar] [CrossRef]
- Fathi, M.; Nourmohammadi, A.; Ghobakhloo, M.; Yousefi, M. Production Sustainability via Supermarket Location Optimization in Assembly Lines. Sustainability 2020, 12, 4728. [Google Scholar] [CrossRef]
- Fathi, M.; Ghobakhloo, M. Enabling mass customization and manufacturing sustainability in Industry 4.0 Context: A novel heuristic algorithm for in-plant material supply optimization. Sustainability 2020, 12, 6669. [Google Scholar] [CrossRef]
- Akkad, M.Z.; Bányai, T. Analytical Review on the Modern Optimization Algorithms in Logistics. Adv. Logist. Syst.-Theory Pract. 2020, 14, 25–31. [Google Scholar] [CrossRef]
- Akkad, M.Z.; Bányai, T. Applying Sustainable Logistics in Industry 4.0 Era. Lect. Notes Mech. Eng. 2021, 22, 222–234. [Google Scholar] [CrossRef]
- Francuz, Á.; Bányai, T. Optimisation of Milkrun Routes in Manufacturing Systems in the Automotive Industry. Cut. Tools Technol. Syst. 2022, 96, 32–41. [Google Scholar] [CrossRef]
- Tobon-Valencia, E.; Lamouri, S.; Pellerin, R.; Moeuf, A. Modeling of the Master Production Schedule for the Digital Transition of Manufacturing SMEs in the Context of Industry 4.0. Sustainability 2022, 14, 12562. [Google Scholar] [CrossRef]
- Rossit, D.G.; Nesmachnow, S.; Rossit, D.A. A Multi Objective Evolutionary Algorithm based on Decomposition for a Flow Shop Scheduling Problem in the Context of Industry 4.0. Int. J. Math. Eng. Manag. Sci. 2022, 7, 433–454. [Google Scholar] [CrossRef]
- Li, M.; Li, M.; Ding, H.; Ling, S.; Huang, G.Q. Graduation-inspired synchronization for industry 4.0 planning, scheduling, and execution. J. Manuf. Syst. 2022, 64, 94–106. [Google Scholar] [CrossRef]
- Patil, S.A.; Gokhale, P.K. AI-federated novel delay-aware link-scheduling for Industry 4.0 applications in IoT networks. Int. J. Pervasive Comput. Commun. 2022; ahead-of-print. [Google Scholar] [CrossRef]
- Serrano-Ruiz, J.C.; Mula, J.; Poler, R. Development of a multidimensional conceptual model for job shop smart manufacturing scheduling from the Industry 4.0 perspective. J. Manuf. Syst. 2022, 63, 185–202. [Google Scholar] [CrossRef]
- Bakon, K.; Holczinger, T.; Sule, Z.; Jasko, S.; Abonyi, J. Scheduling Under Uncertainty for Industry 4.0 and 5.0. IEEE Access 2022, 10, 74977–75017. [Google Scholar] [CrossRef]
- Akkad, M.Z.; Bányai, T. Multi-objective approach for optimization of city logistics considering energy efficiency. Sustainability 2020, 12, 7366. [Google Scholar] [CrossRef]
- Fernandez-Viagas, V.; Framinan, J.M. Exploring the benefits of scheduling with advanced and real-time information integration in Industry 4.0: A computational study. J. Ind. Inf. Integr. 2022, 27, 100281. [Google Scholar] [CrossRef]
- Akkad, M.Z.; Šebo, J.; Bányai, T. Investigation of the Industry 4.0 Technologies Adoption Effect on Circular Economy. Sustainability 2022, 14, 12815. [Google Scholar] [CrossRef]
- Pekarcikova, M.; Trebuna, P.; Kliment, M.; Schmacher, B.A.K. Milk Run Testing through Tecnomatix Plant Simulation Software. Int. J. Simul. Model. 2022, 21, 101–112. [Google Scholar] [CrossRef]
- Quan, C.; He, Q.; Ye, X.; Cheng, X. Optimization of the Milk-run route for inbound logistics of auto parts under low-carbon economy. J. Algorithms Comput. Technol. 2021, 15, 1–8. [Google Scholar] [CrossRef]
- Bocewicz, G.; Nielsen, I.; Gola, A.; Banaszak, Z. Reference model of milk-run traffic systems prototyping. Int. J. Prod. Res. 2021, 59, 4495–4512. [Google Scholar] [CrossRef]
- Kumar, P.; Michael, L.K.; Mathew, A.O.; Sriram, K. Optimisation of milk run logistics for an automotive component manufacturer—A case study. SRAC-Rom. Soc. Qual. 2019, 20, 27–34. [Google Scholar]
- 3 Major Differences Between an MES and ERP System|Pyramid Solutions. Available online: https://pyramidsolutions.com/intelligent-manufacturing/blog-im/3-differences-between-mes-and-erp/ (accessed on 24 January 2023).
- Lee, W.J.; Mendis, G.P.; Sutherland, J.W. Development of an Intelligent Tool Condition Monitoring System to Identify Manufacturing Tradeoffs and Optimal Machining Conditions. Procedia Manuf. 2019, 33, 256–263. [Google Scholar] [CrossRef]
- Lachmayer, R.; Mozgova, I.; Scheidel, W. An Approach to Describe Gentelligent Components in their Life Cycle. Procedia Technol. 2016, 26, 199–206. [Google Scholar] [CrossRef]
Figure 1.
Structure of I4.0 technologies supported by milk-run-based in-plant supply.

Figure 2.
Optimization model of the I4.0 technologies supported real-time milk-run-based in-plant supply model.
Figure 2.
Optimization model of the I4.0 technologies supported real-time milk-run-based in-plant supply model.
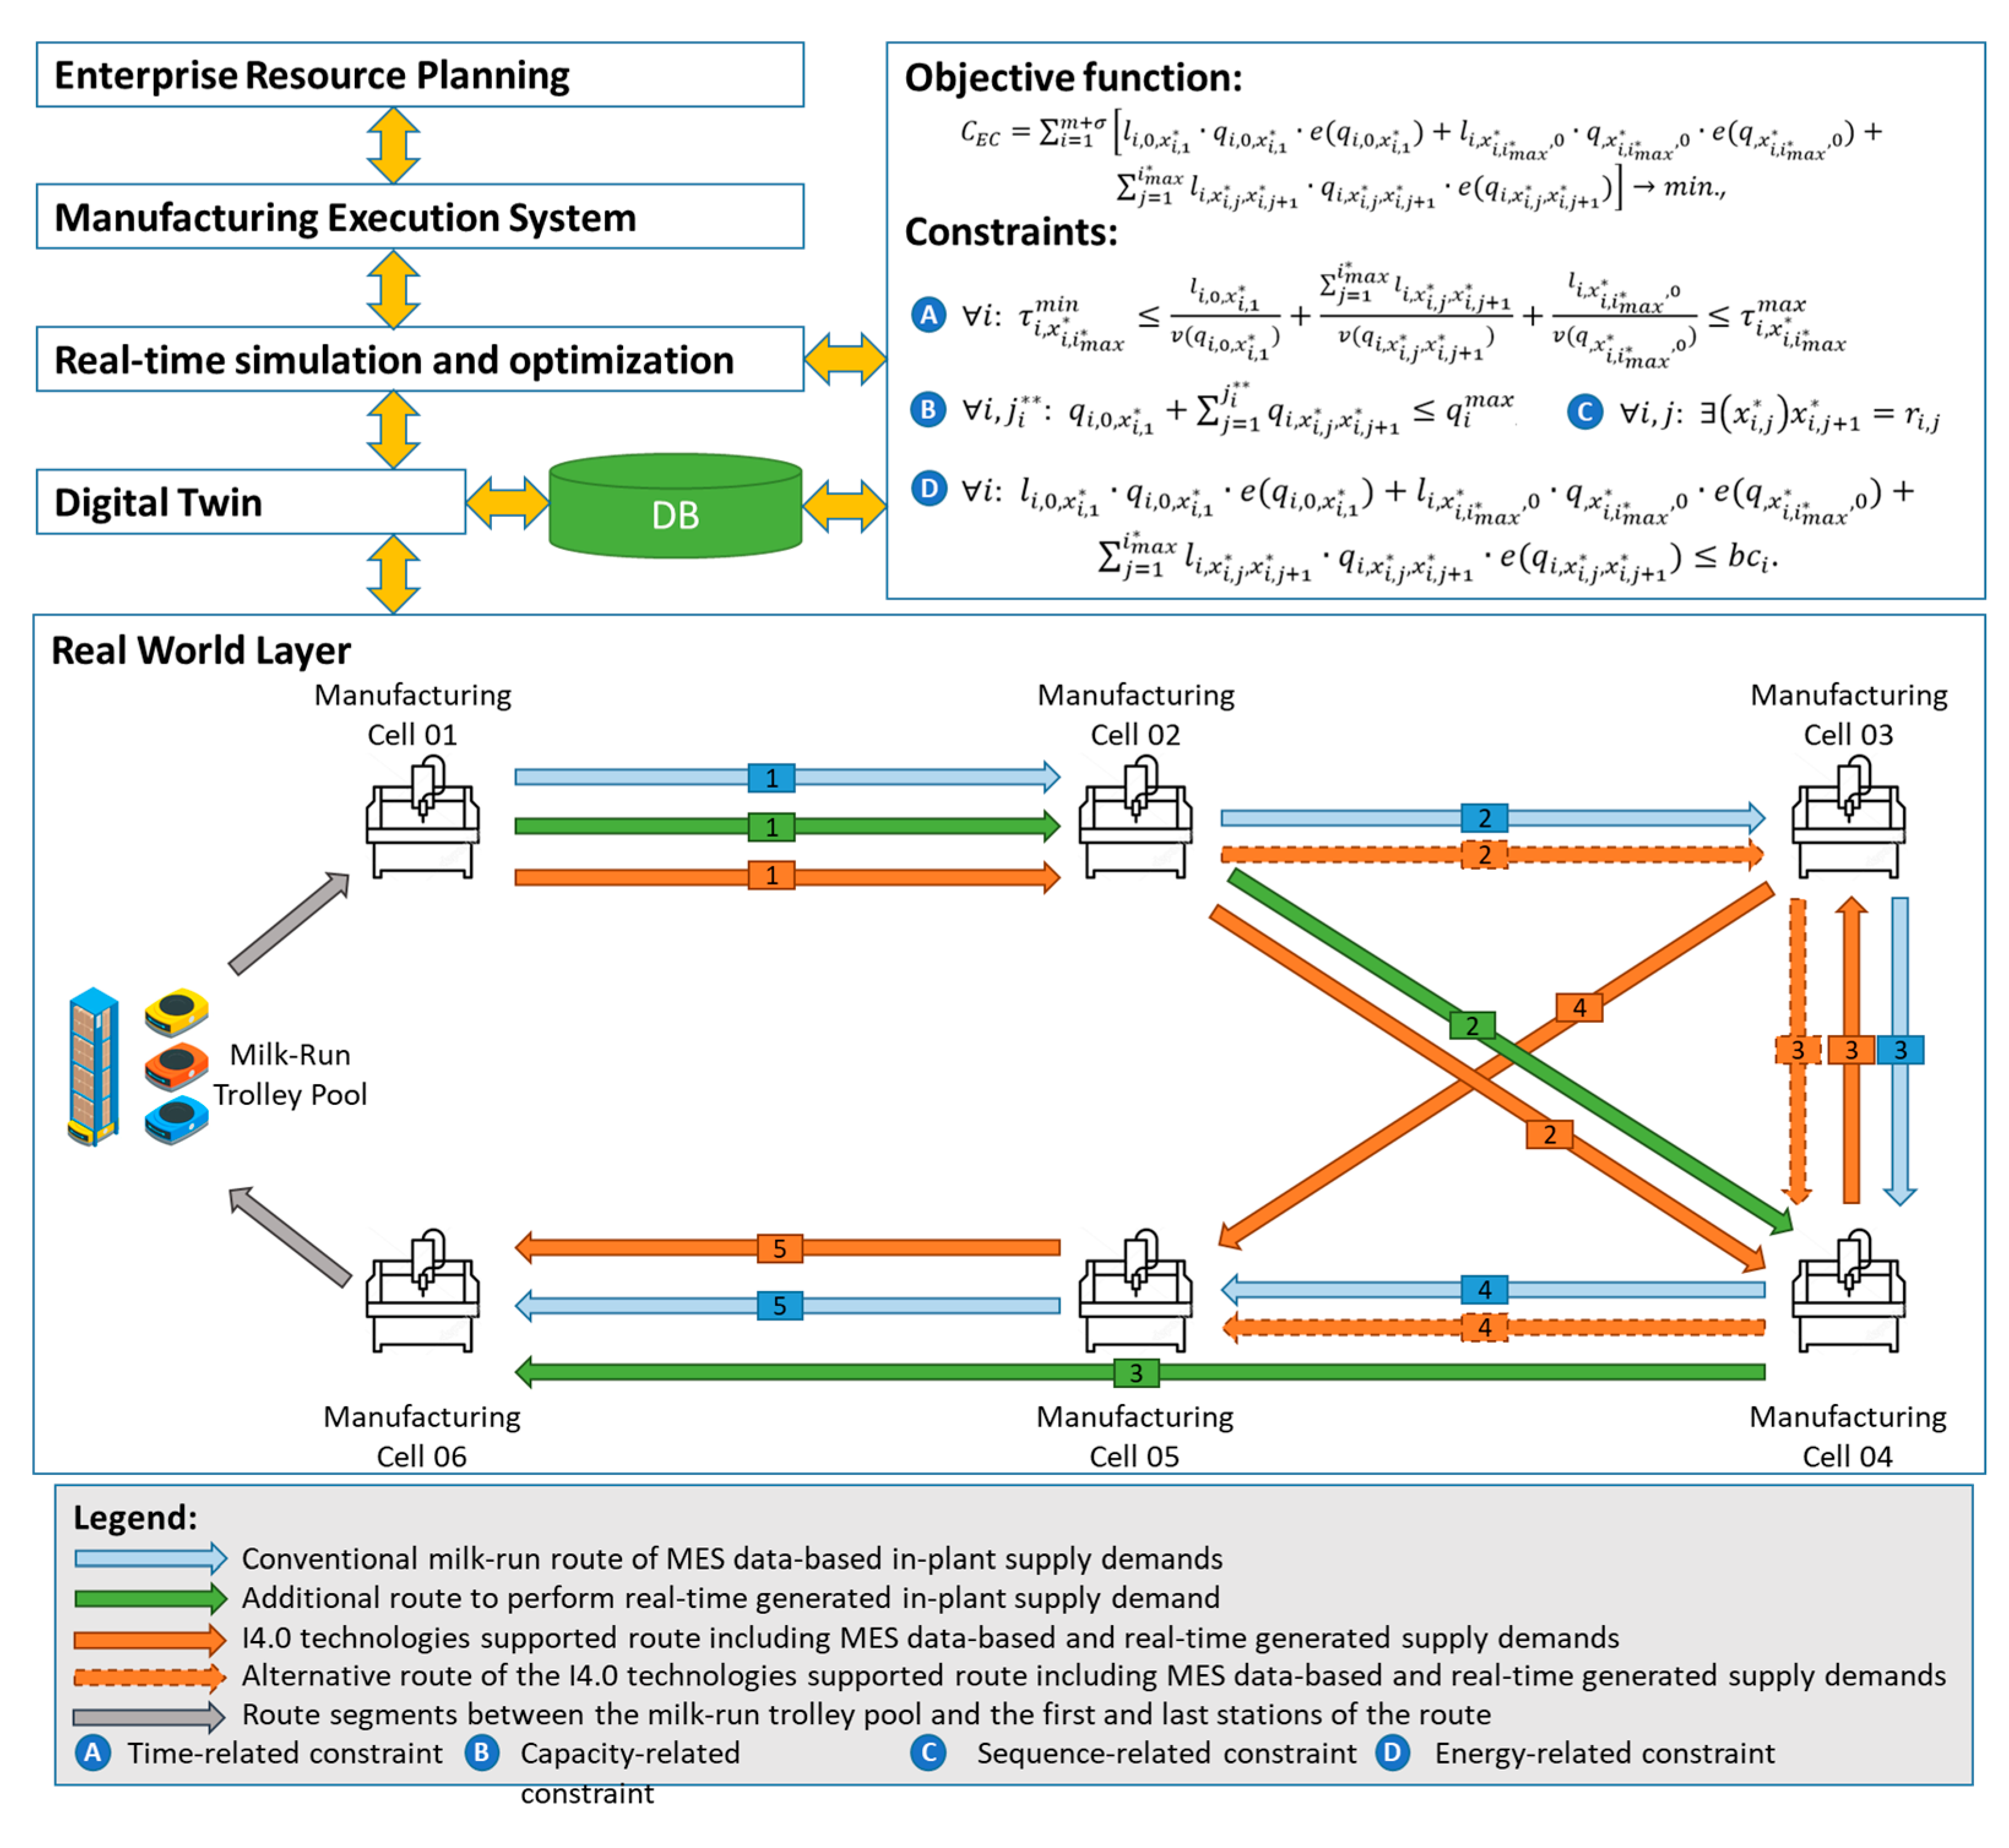
Figure 3.
The first route of the conventional milk-run-based in-plant supply including MES data-based supply demands.
Figure 3.
The first route of the conventional milk-run-based in-plant supply including MES data-based supply demands.
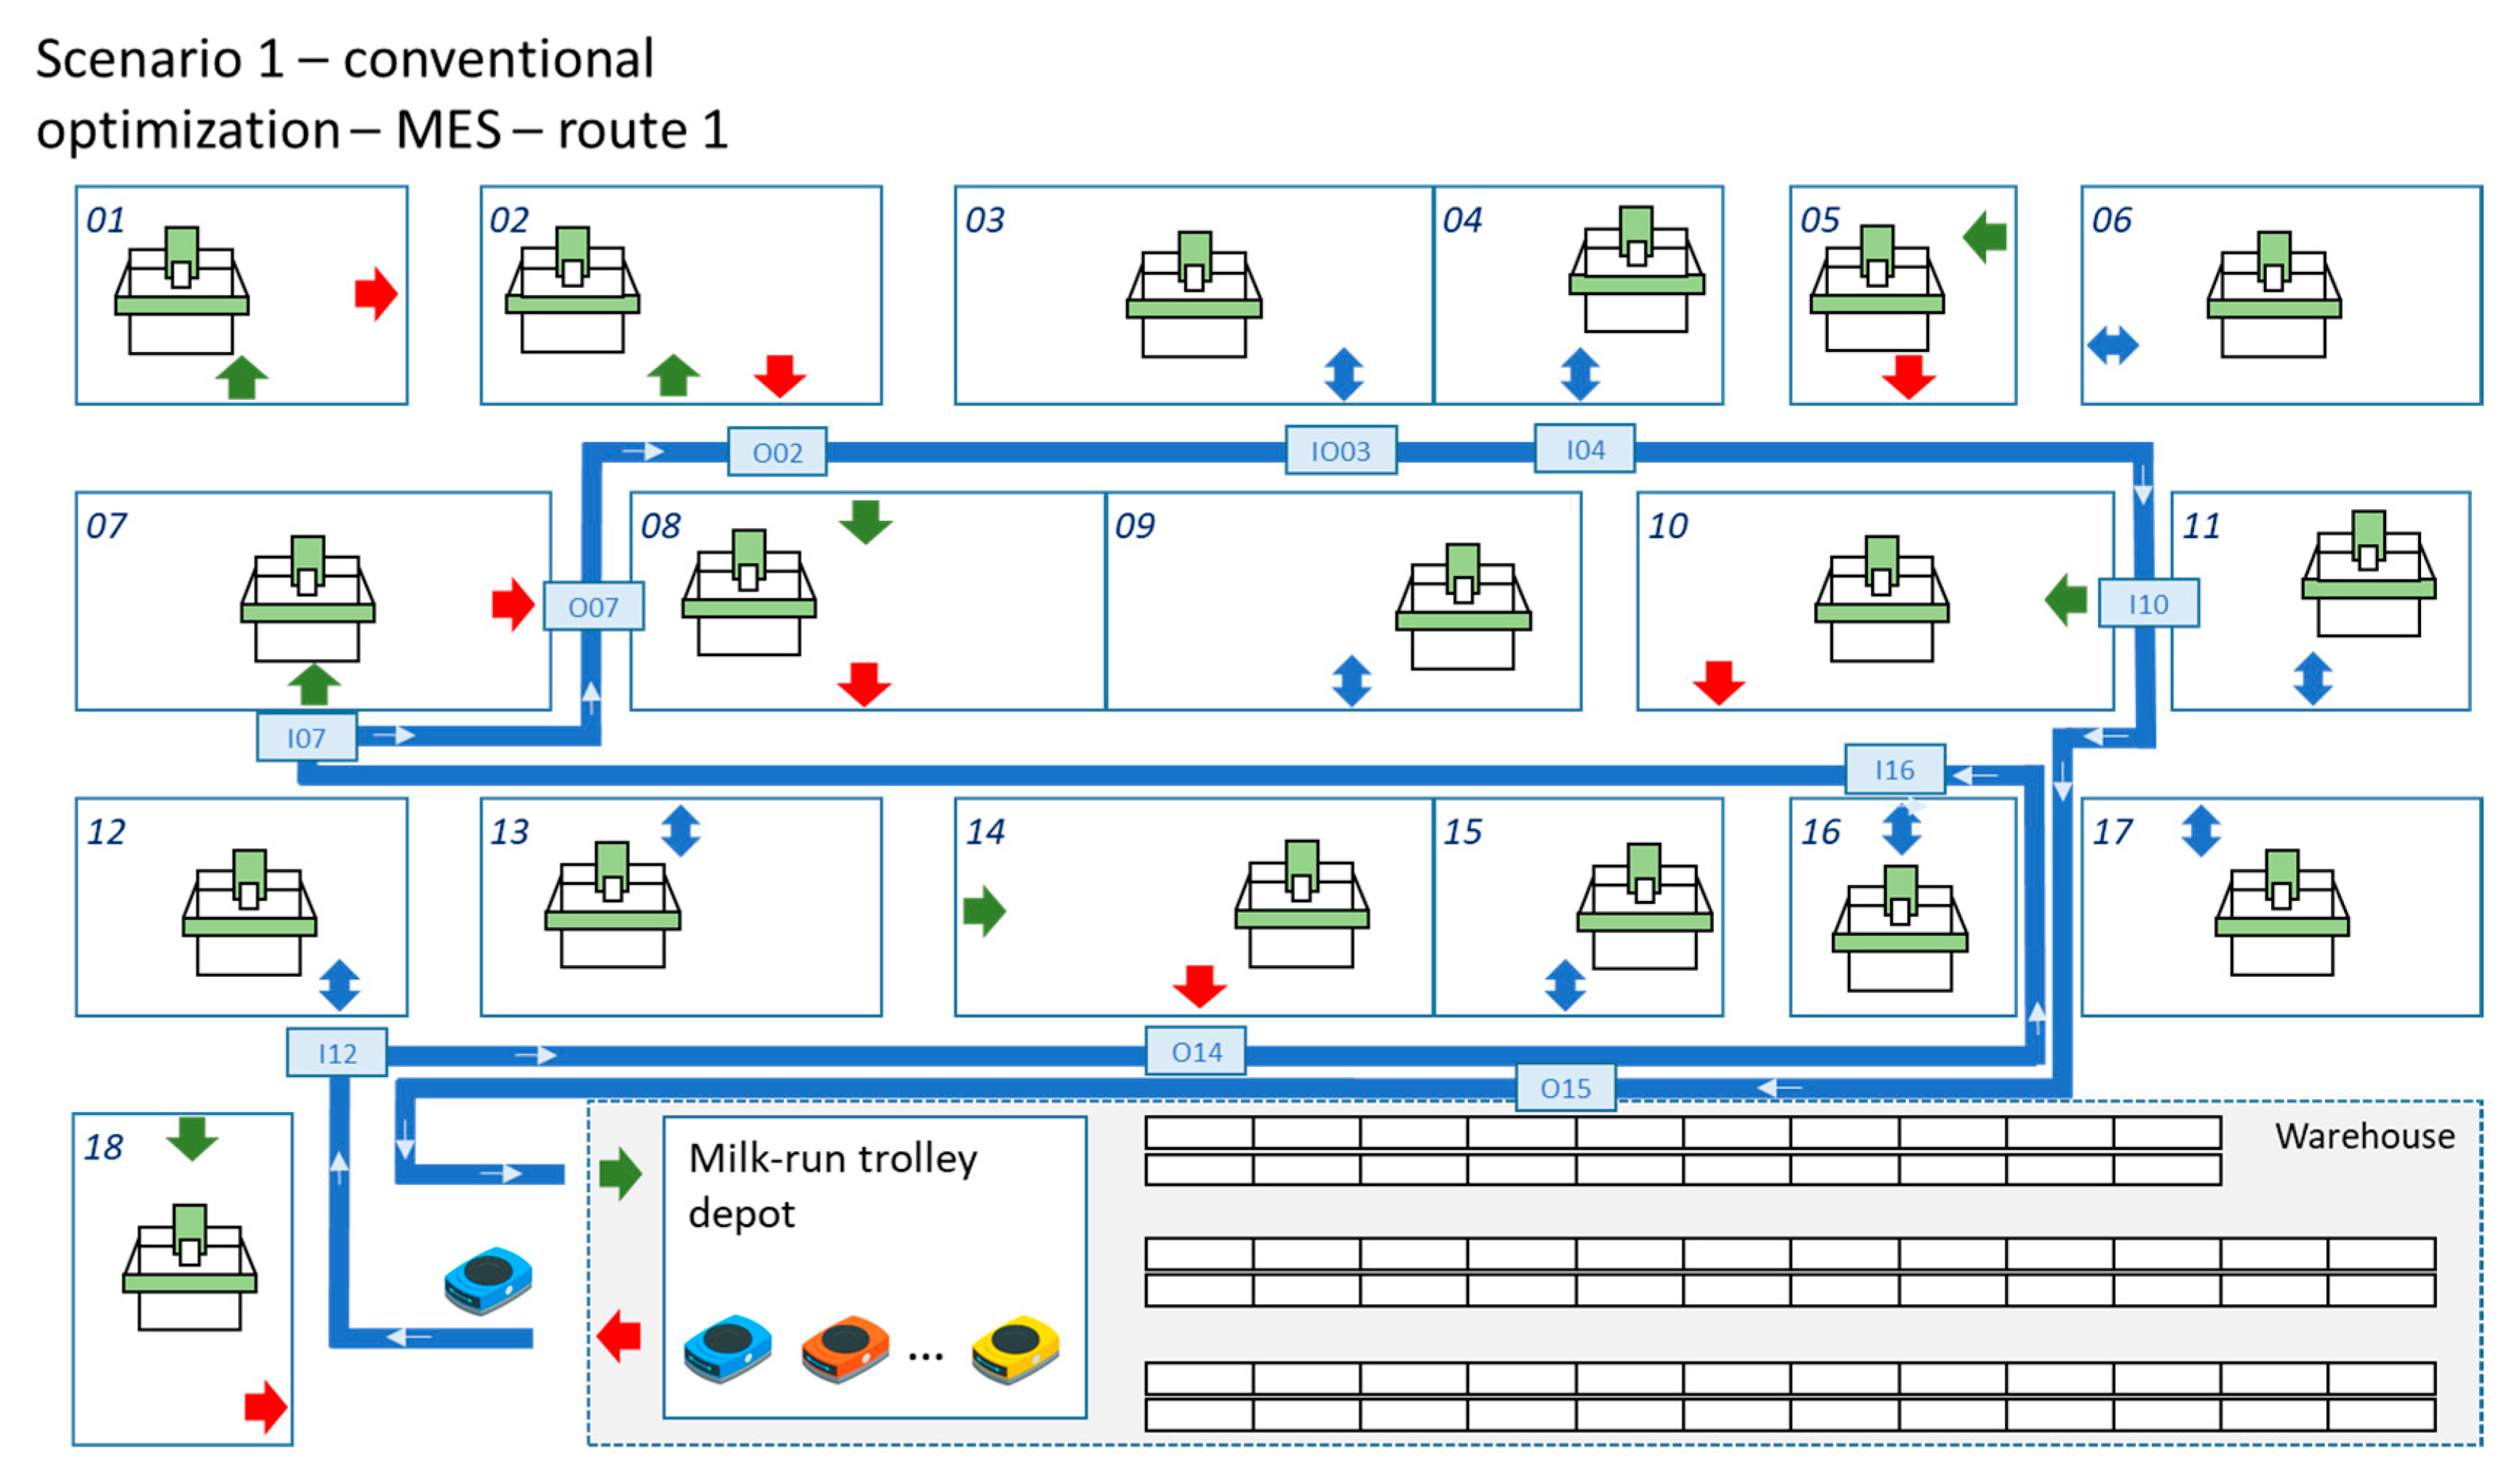
Figure 4.
The second route of the conventional milk-run-based in-plant supply including MES data-based supply demands.
Figure 4.
The second route of the conventional milk-run-based in-plant supply including MES data-based supply demands.

Figure 5.
The third route of the conventional milk-run-based in-plant supply including MES data-based supply demands.
Figure 5.
The third route of the conventional milk-run-based in-plant supply including MES data-based supply demands.

Figure 6.
The optimized loading capacity of the three milk-run trolleys.
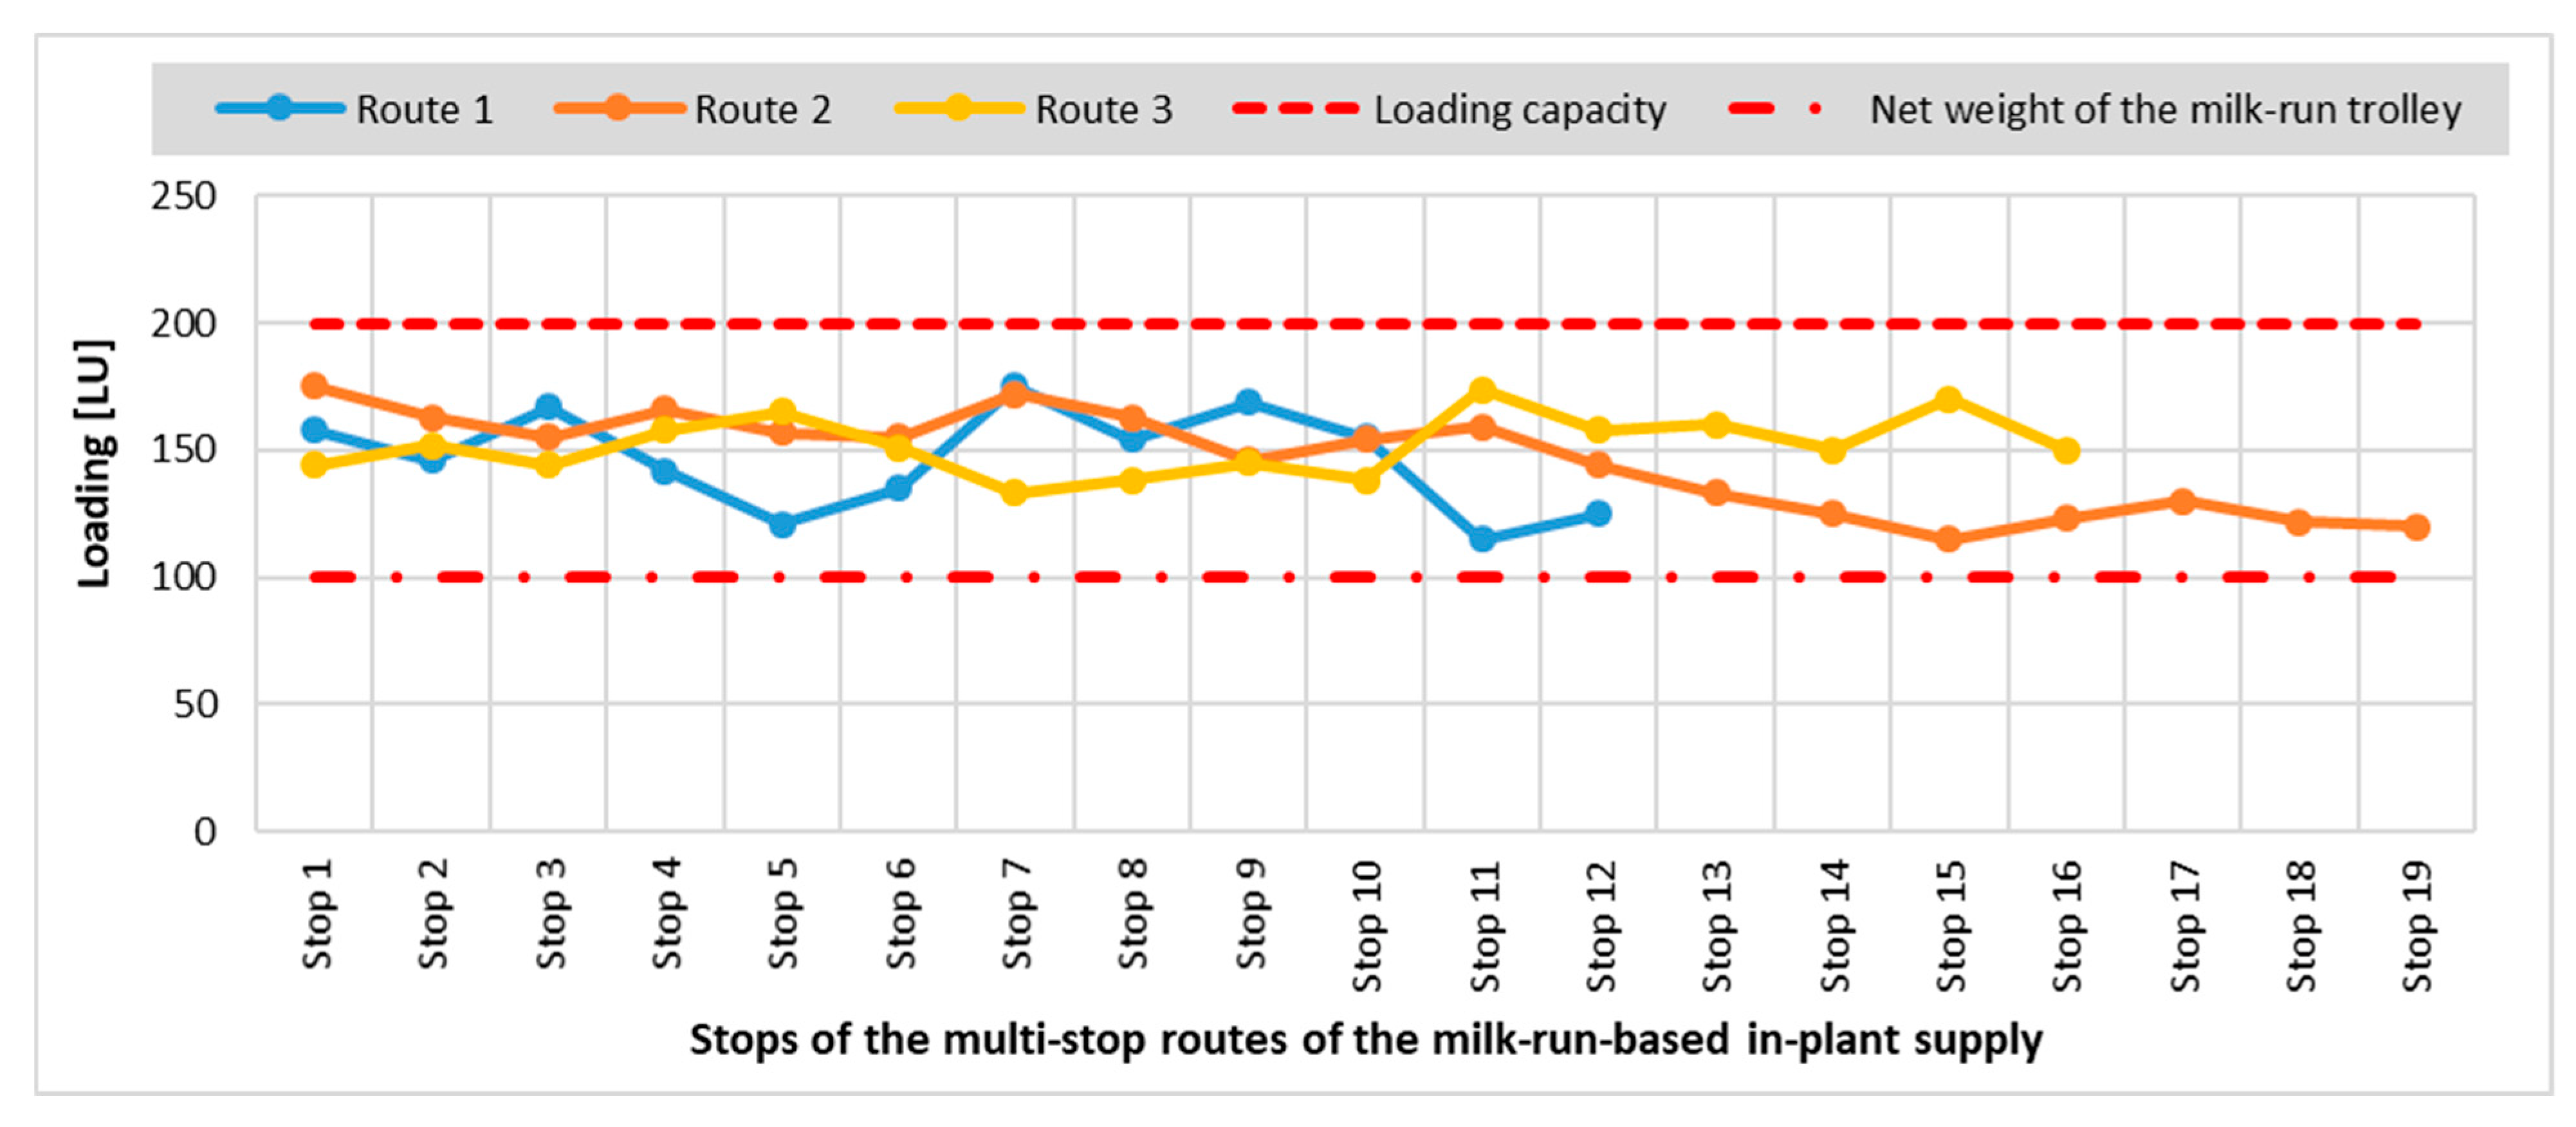
Figure 7.
Cumulative energy consumption of the three milk-run routes in the case of conventional real-time routing and scheduling.
Figure 7.
Cumulative energy consumption of the three milk-run routes in the case of conventional real-time routing and scheduling.
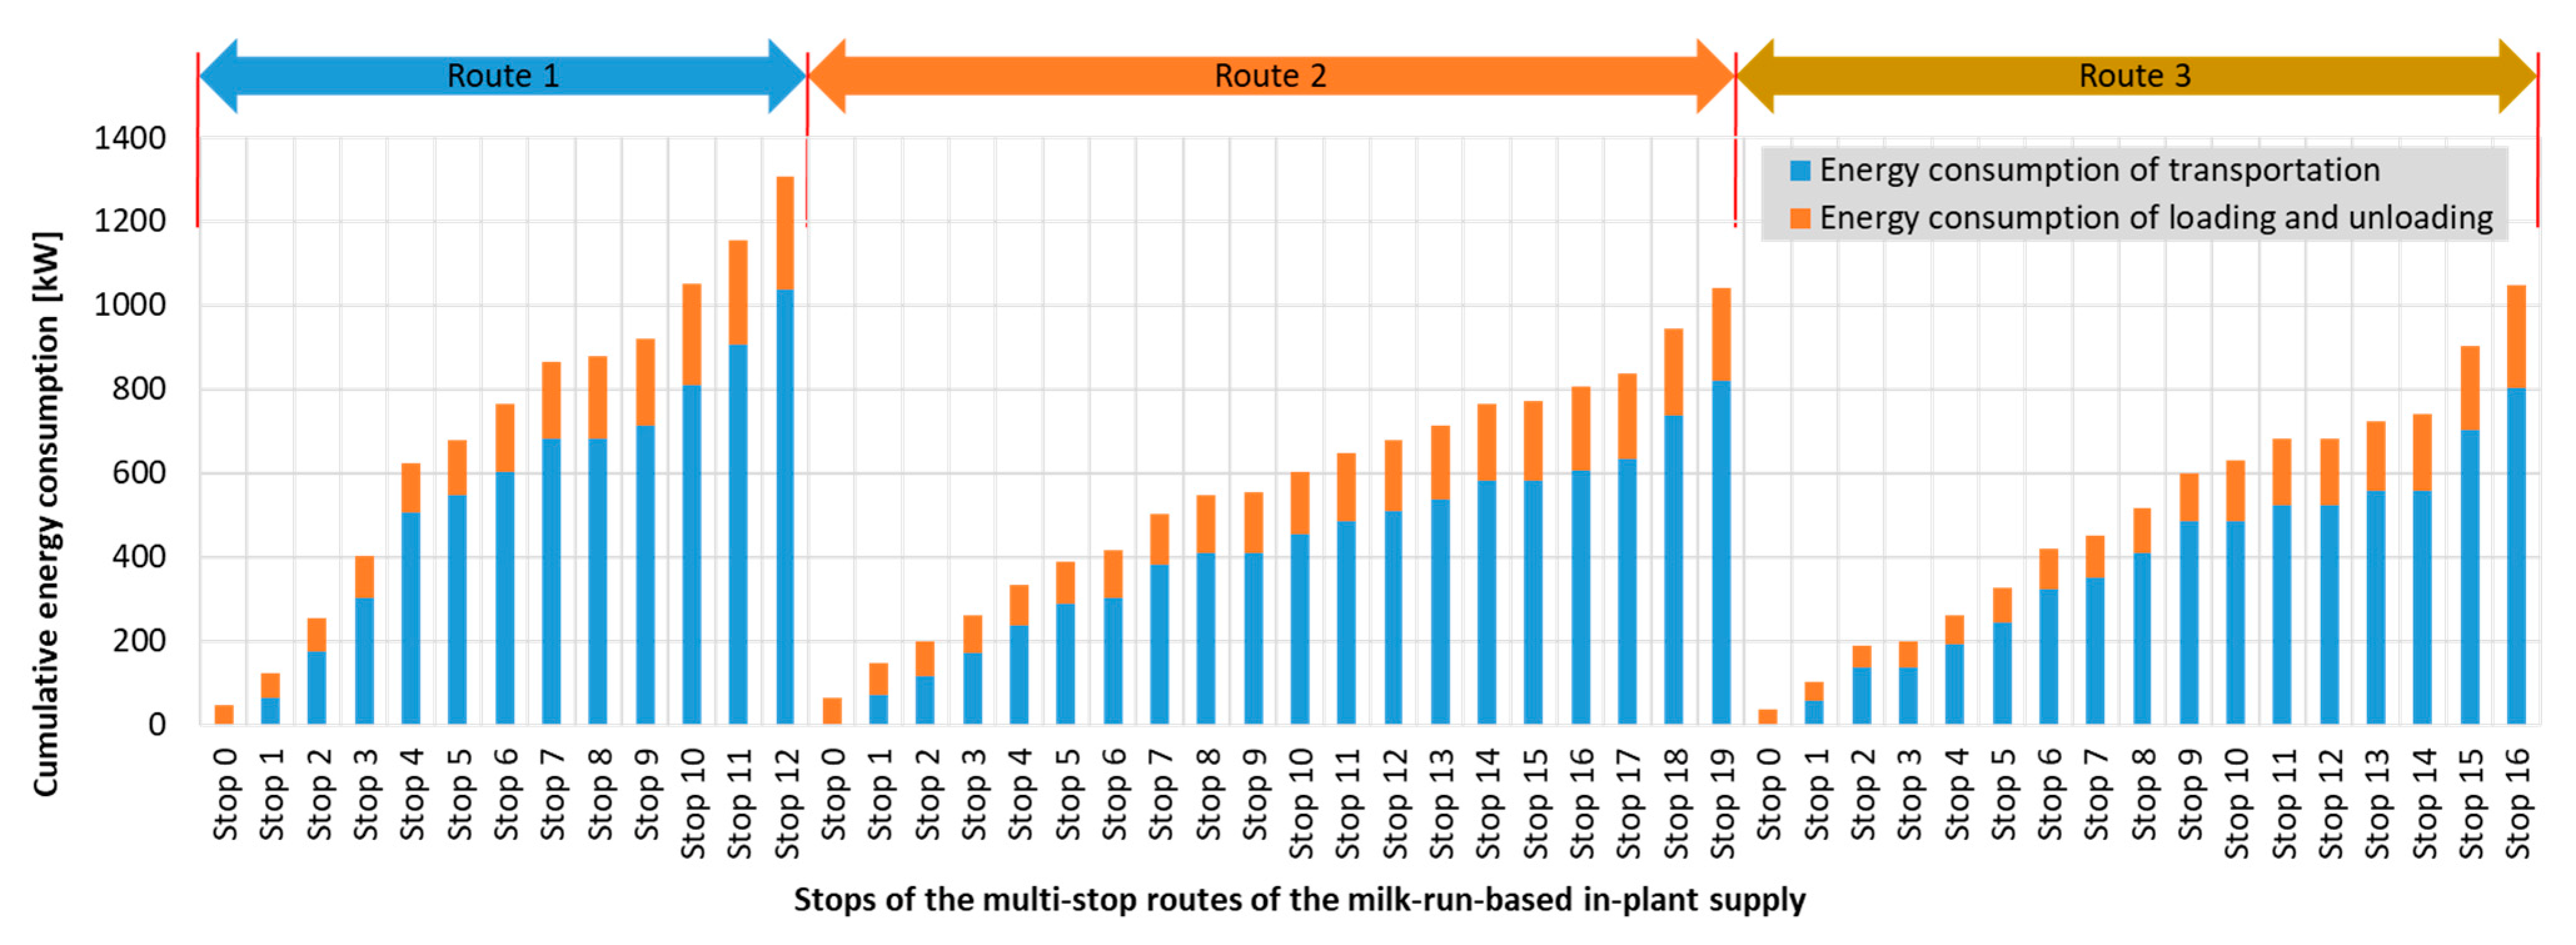
Figure 9.
The second route of the conventional milk-run-based in-plant supply including real-time supply demand.
Figure 9.
The second route of the conventional milk-run-based in-plant supply including real-time supply demand.
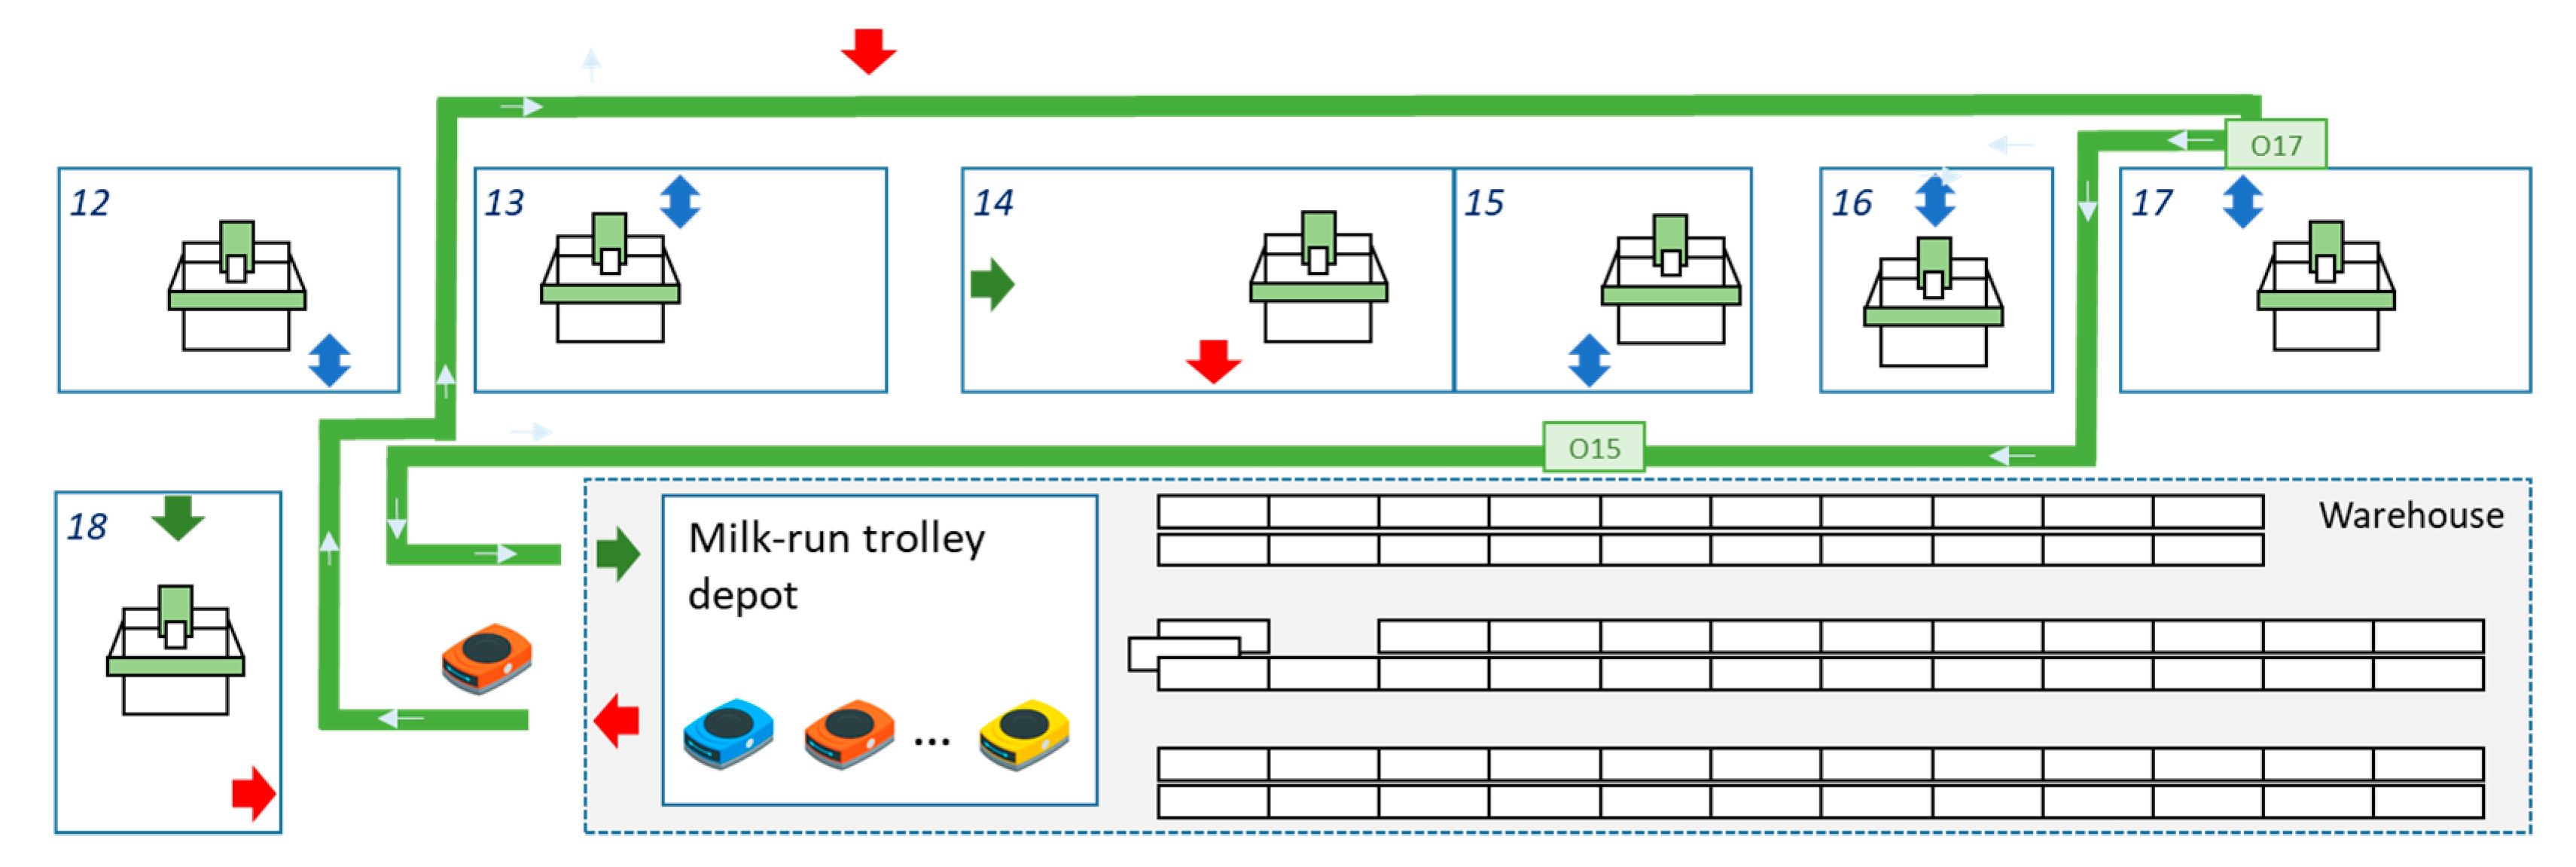
Figure 10.
The third route of the conventional milk-run-based in-plant supply including real-time supply demand.
Figure 10.
The third route of the conventional milk-run-based in-plant supply including real-time supply demand.
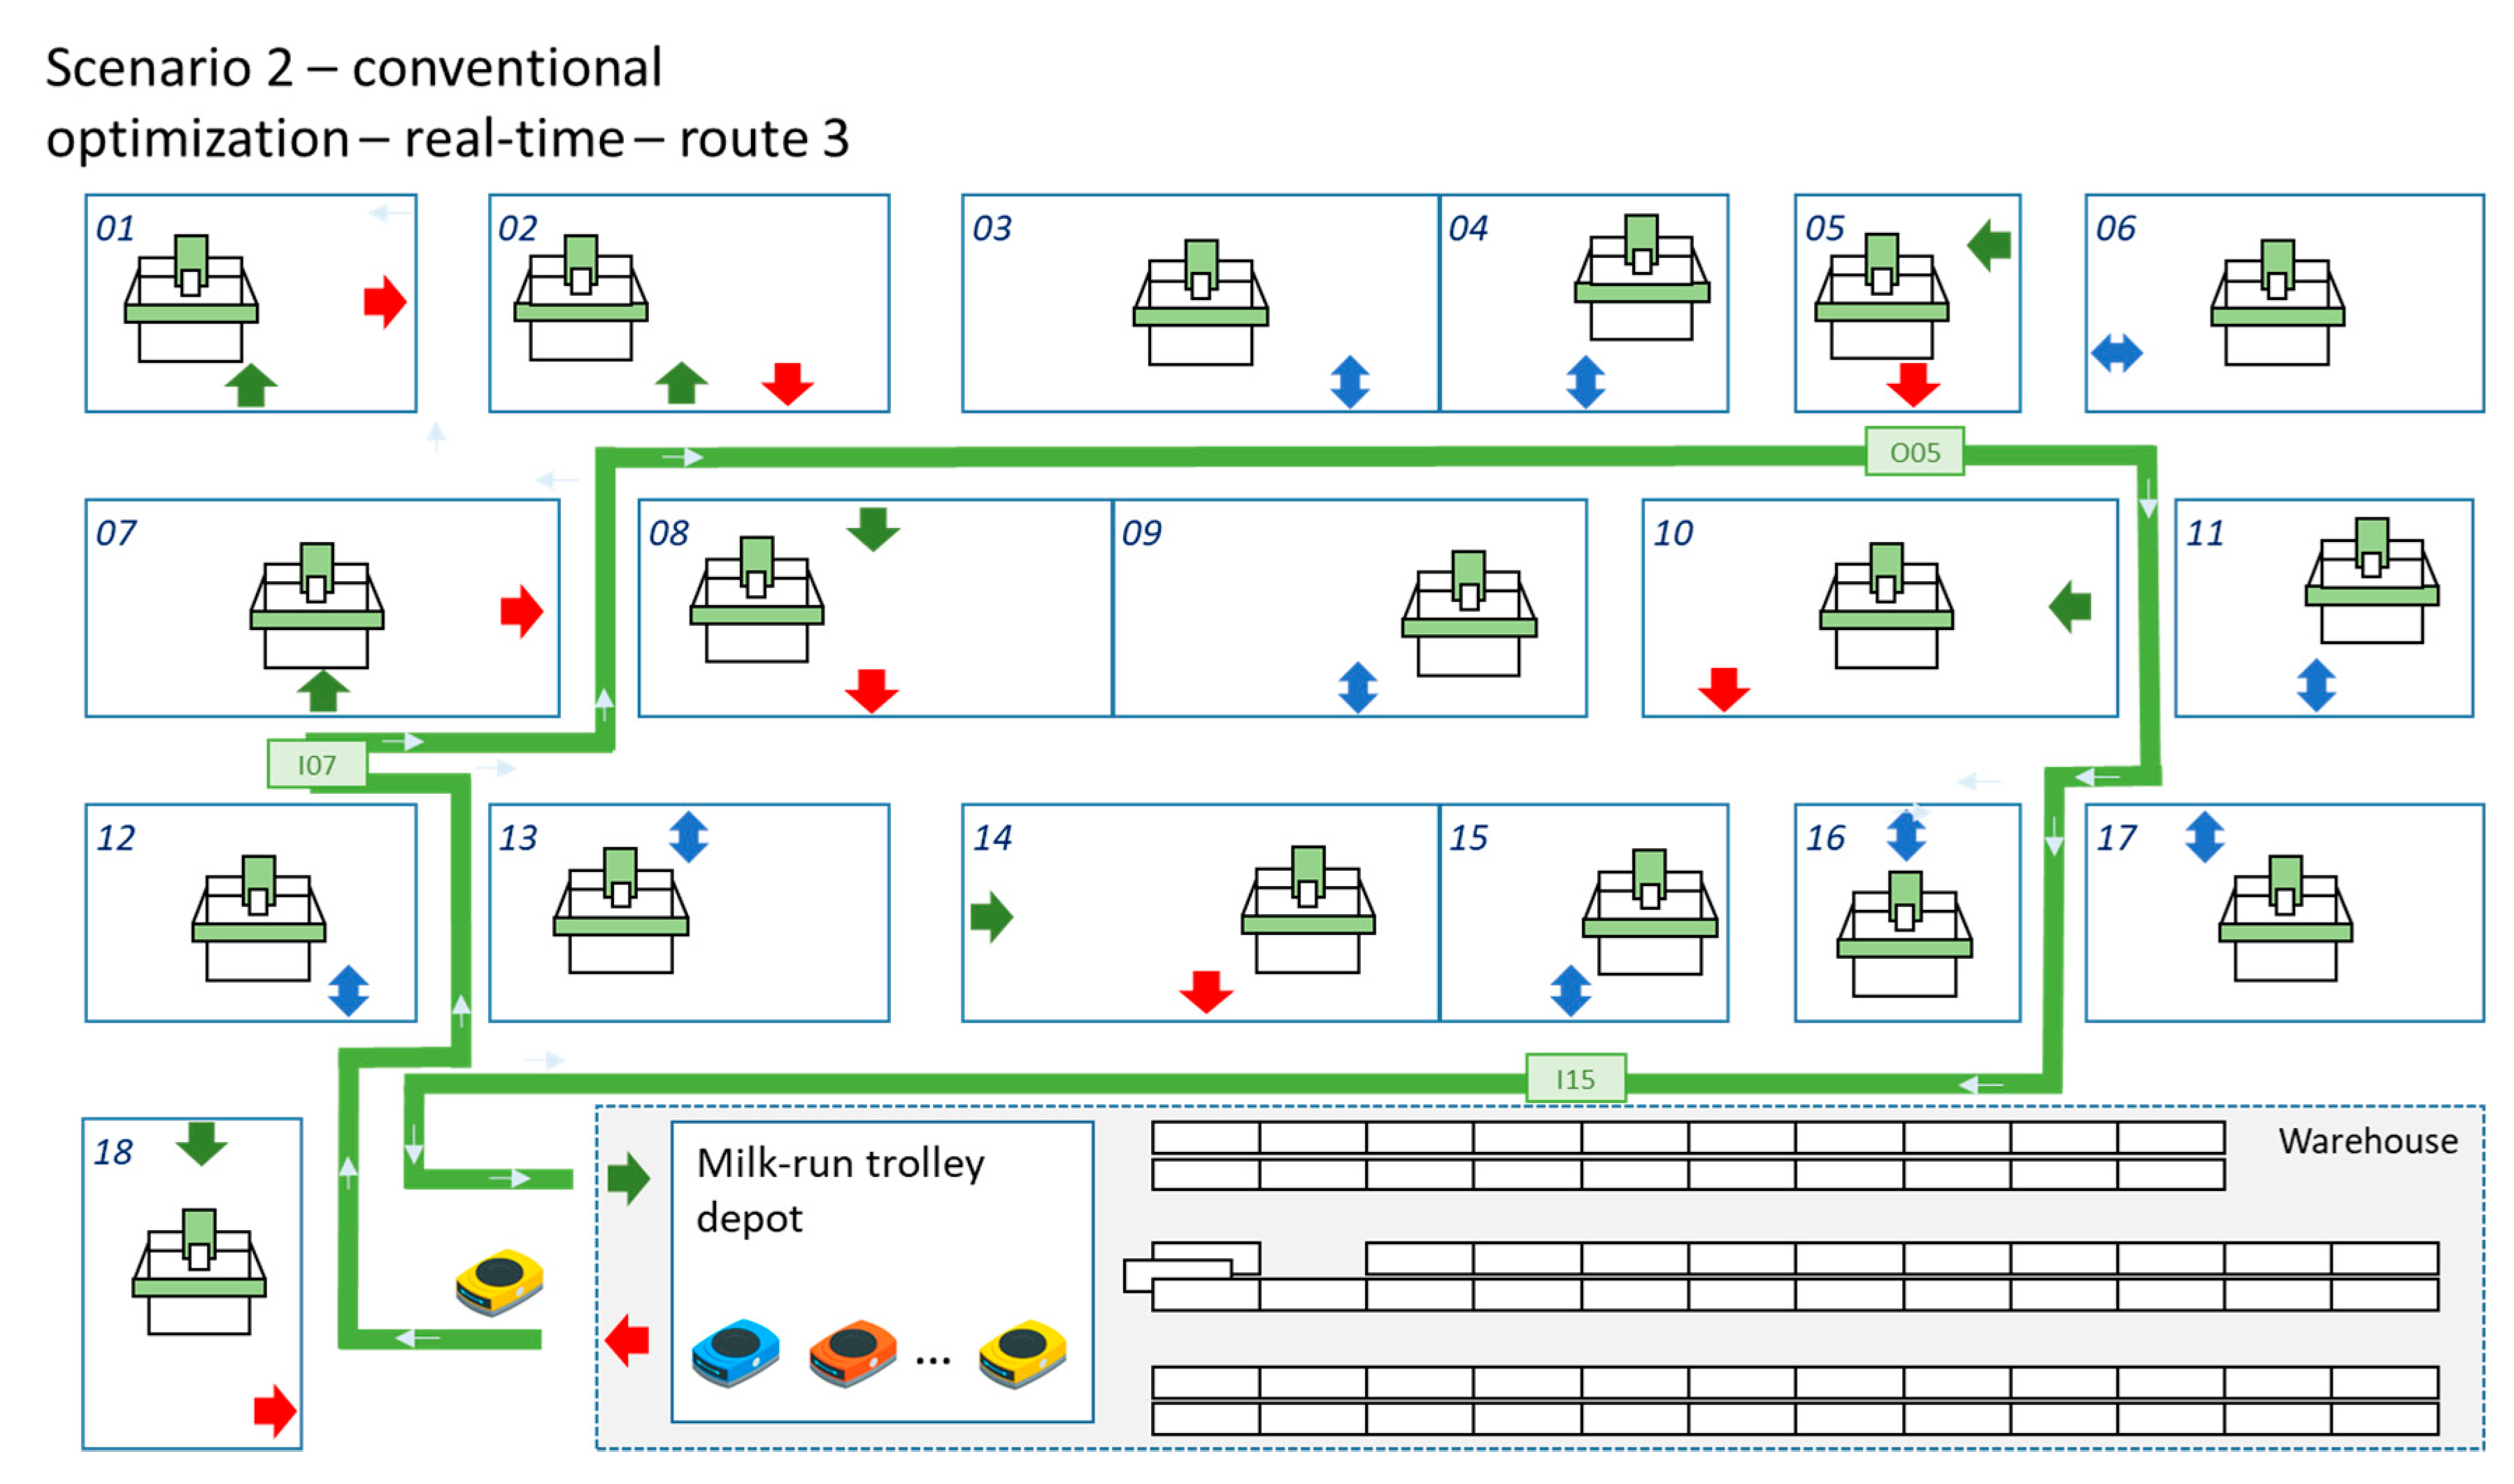
Figure 11.
The modified first route of the I4.0 technologies supported real-time milk-run-based in-plant supply including MES data-based supply demands and digital-twin-generated real-time supply demands. Red lines of the route represent the real-time added route segments.
Figure 11.
The modified first route of the I4.0 technologies supported real-time milk-run-based in-plant supply including MES data-based supply demands and digital-twin-generated real-time supply demands. Red lines of the route represent the real-time added route segments.
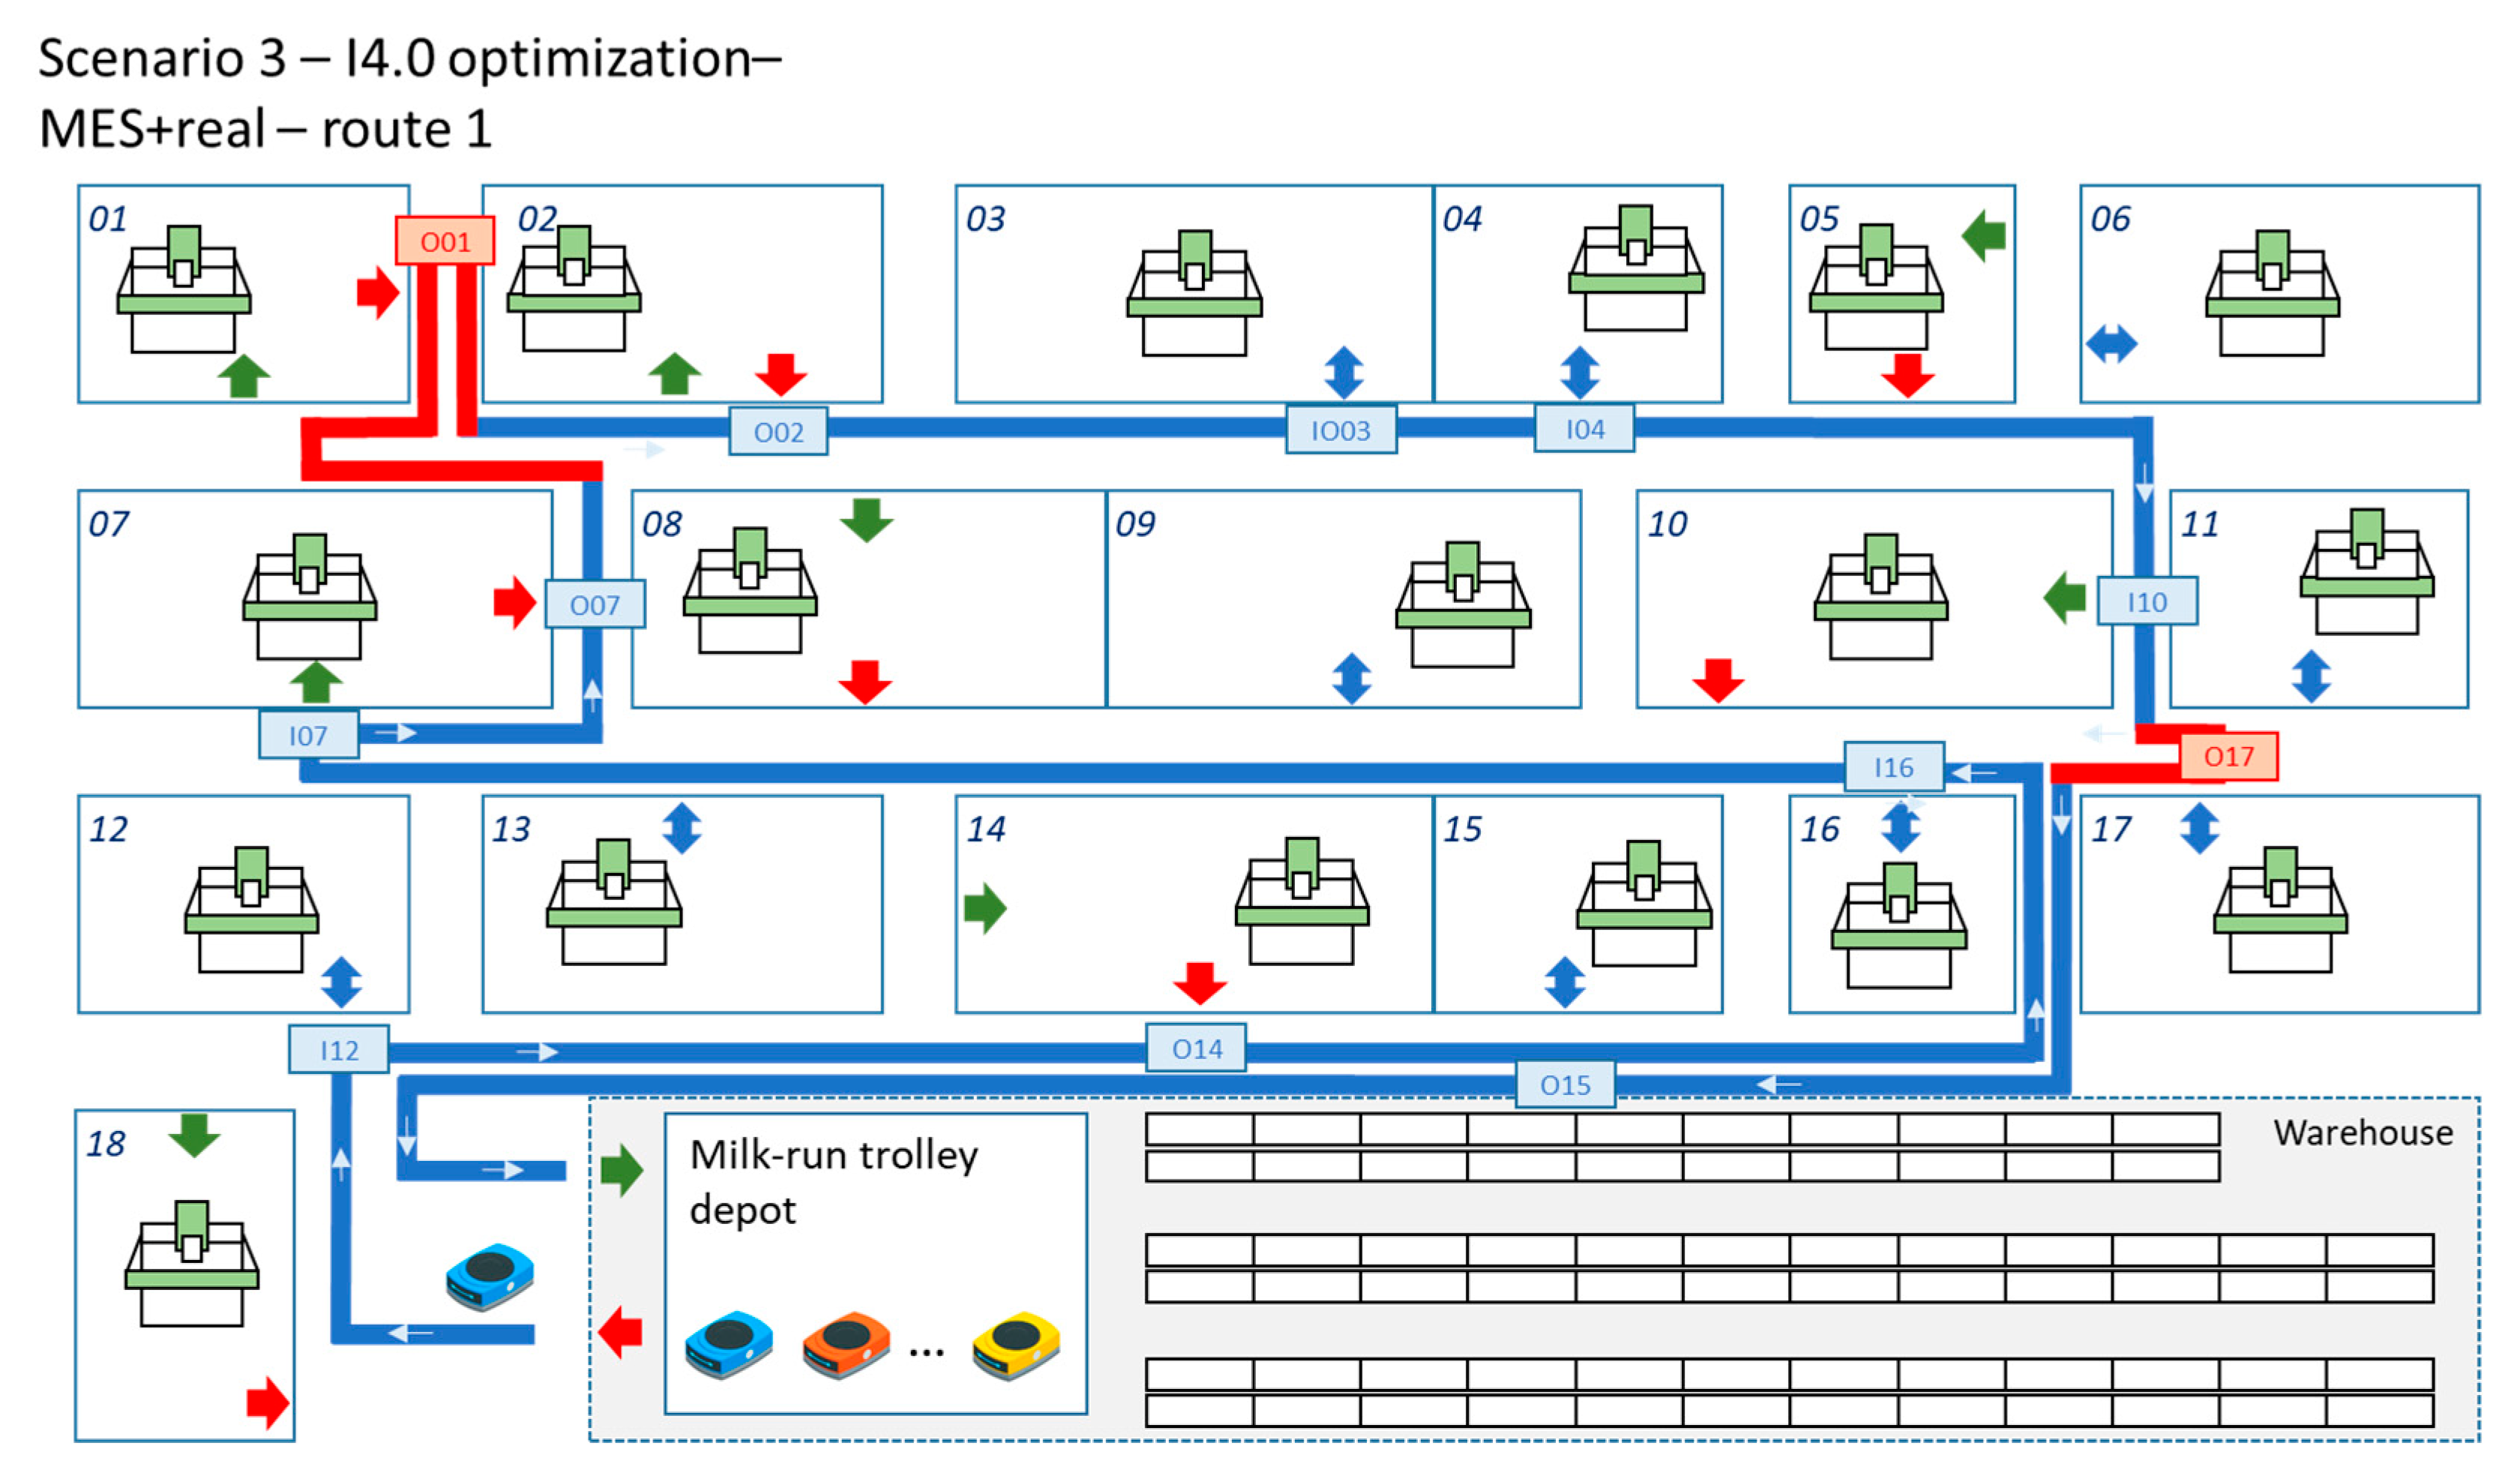
Figure 12.
The modified second route of the I4.0 technologies supported real-time milk-run-based in-plant supply including MES data-based supply demands and digital-twin-generated real-time supply demands. Red lines of the route represent the real-time added route segments.
Figure 12.
The modified second route of the I4.0 technologies supported real-time milk-run-based in-plant supply including MES data-based supply demands and digital-twin-generated real-time supply demands. Red lines of the route represent the real-time added route segments.
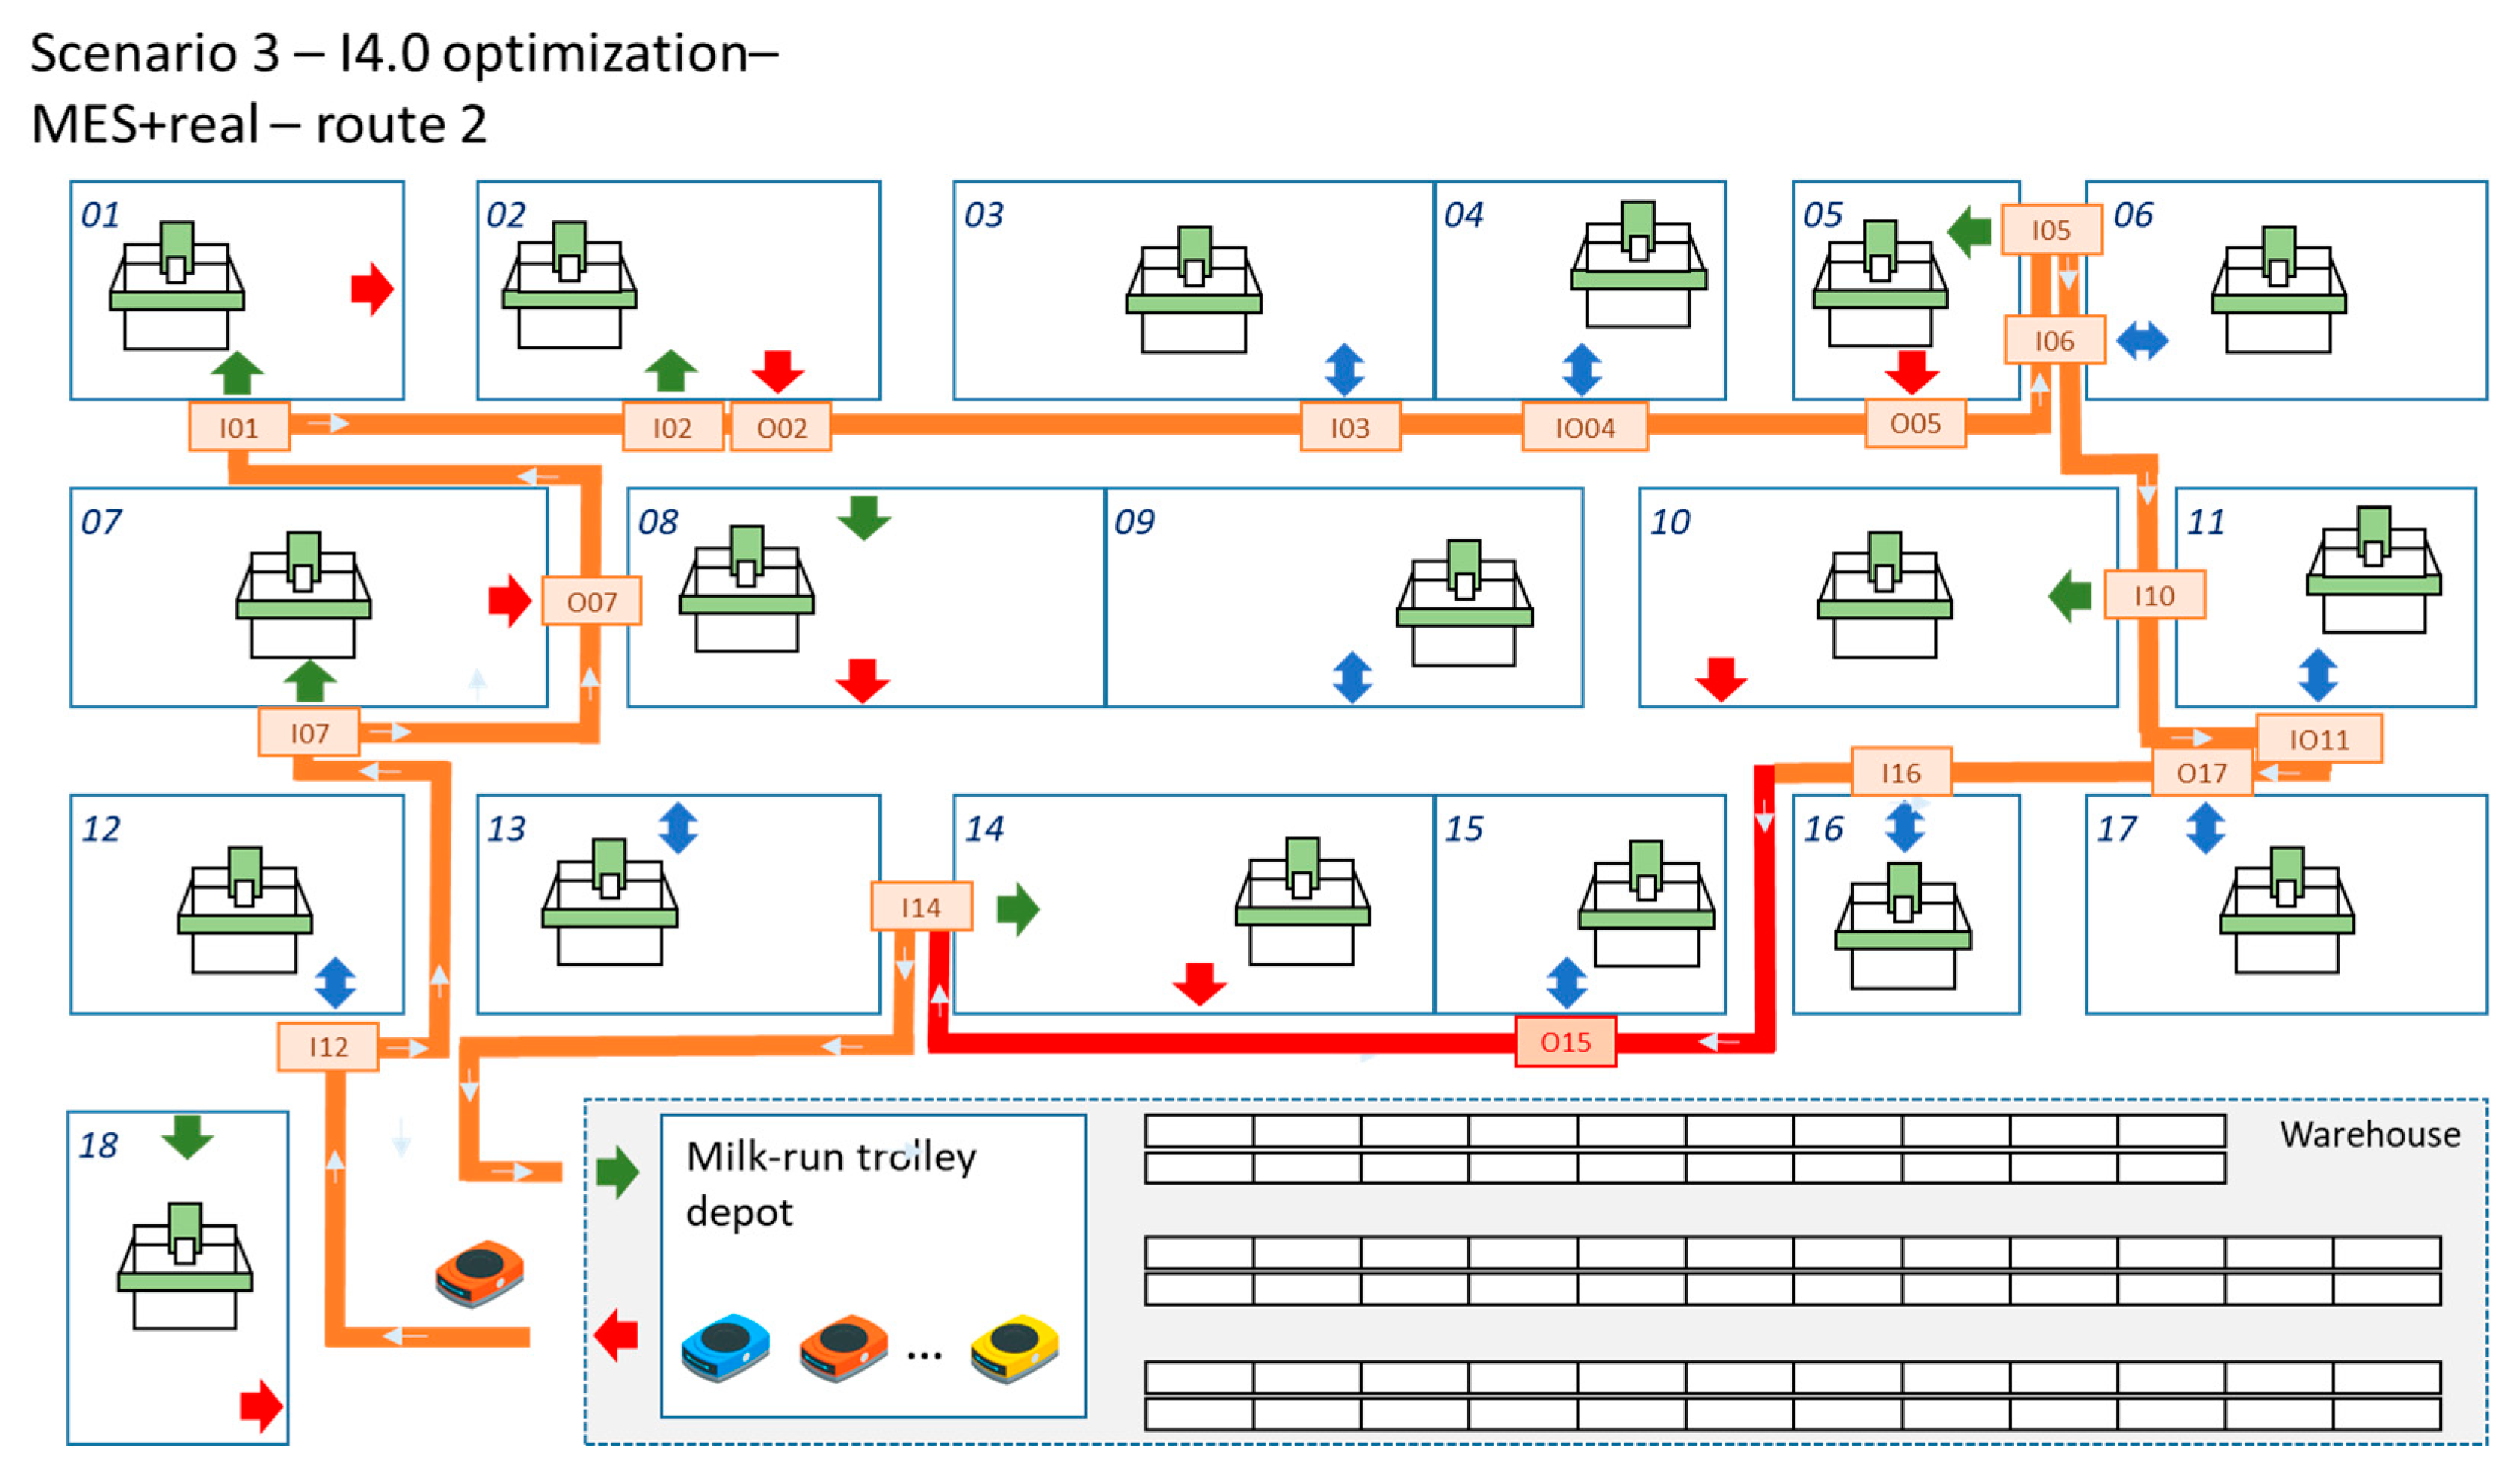
Figure 13.
The modified third route of the I4.0 technologies supported real-time milk-run-based in-plant supply including MES data-based supply demands and digital-twin-generated real-time supply demands. Red lines of the route represent the real-time added route segments.
Figure 13.
The modified third route of the I4.0 technologies supported real-time milk-run-based in-plant supply including MES data-based supply demands and digital-twin-generated real-time supply demands. Red lines of the route represent the real-time added route segments.
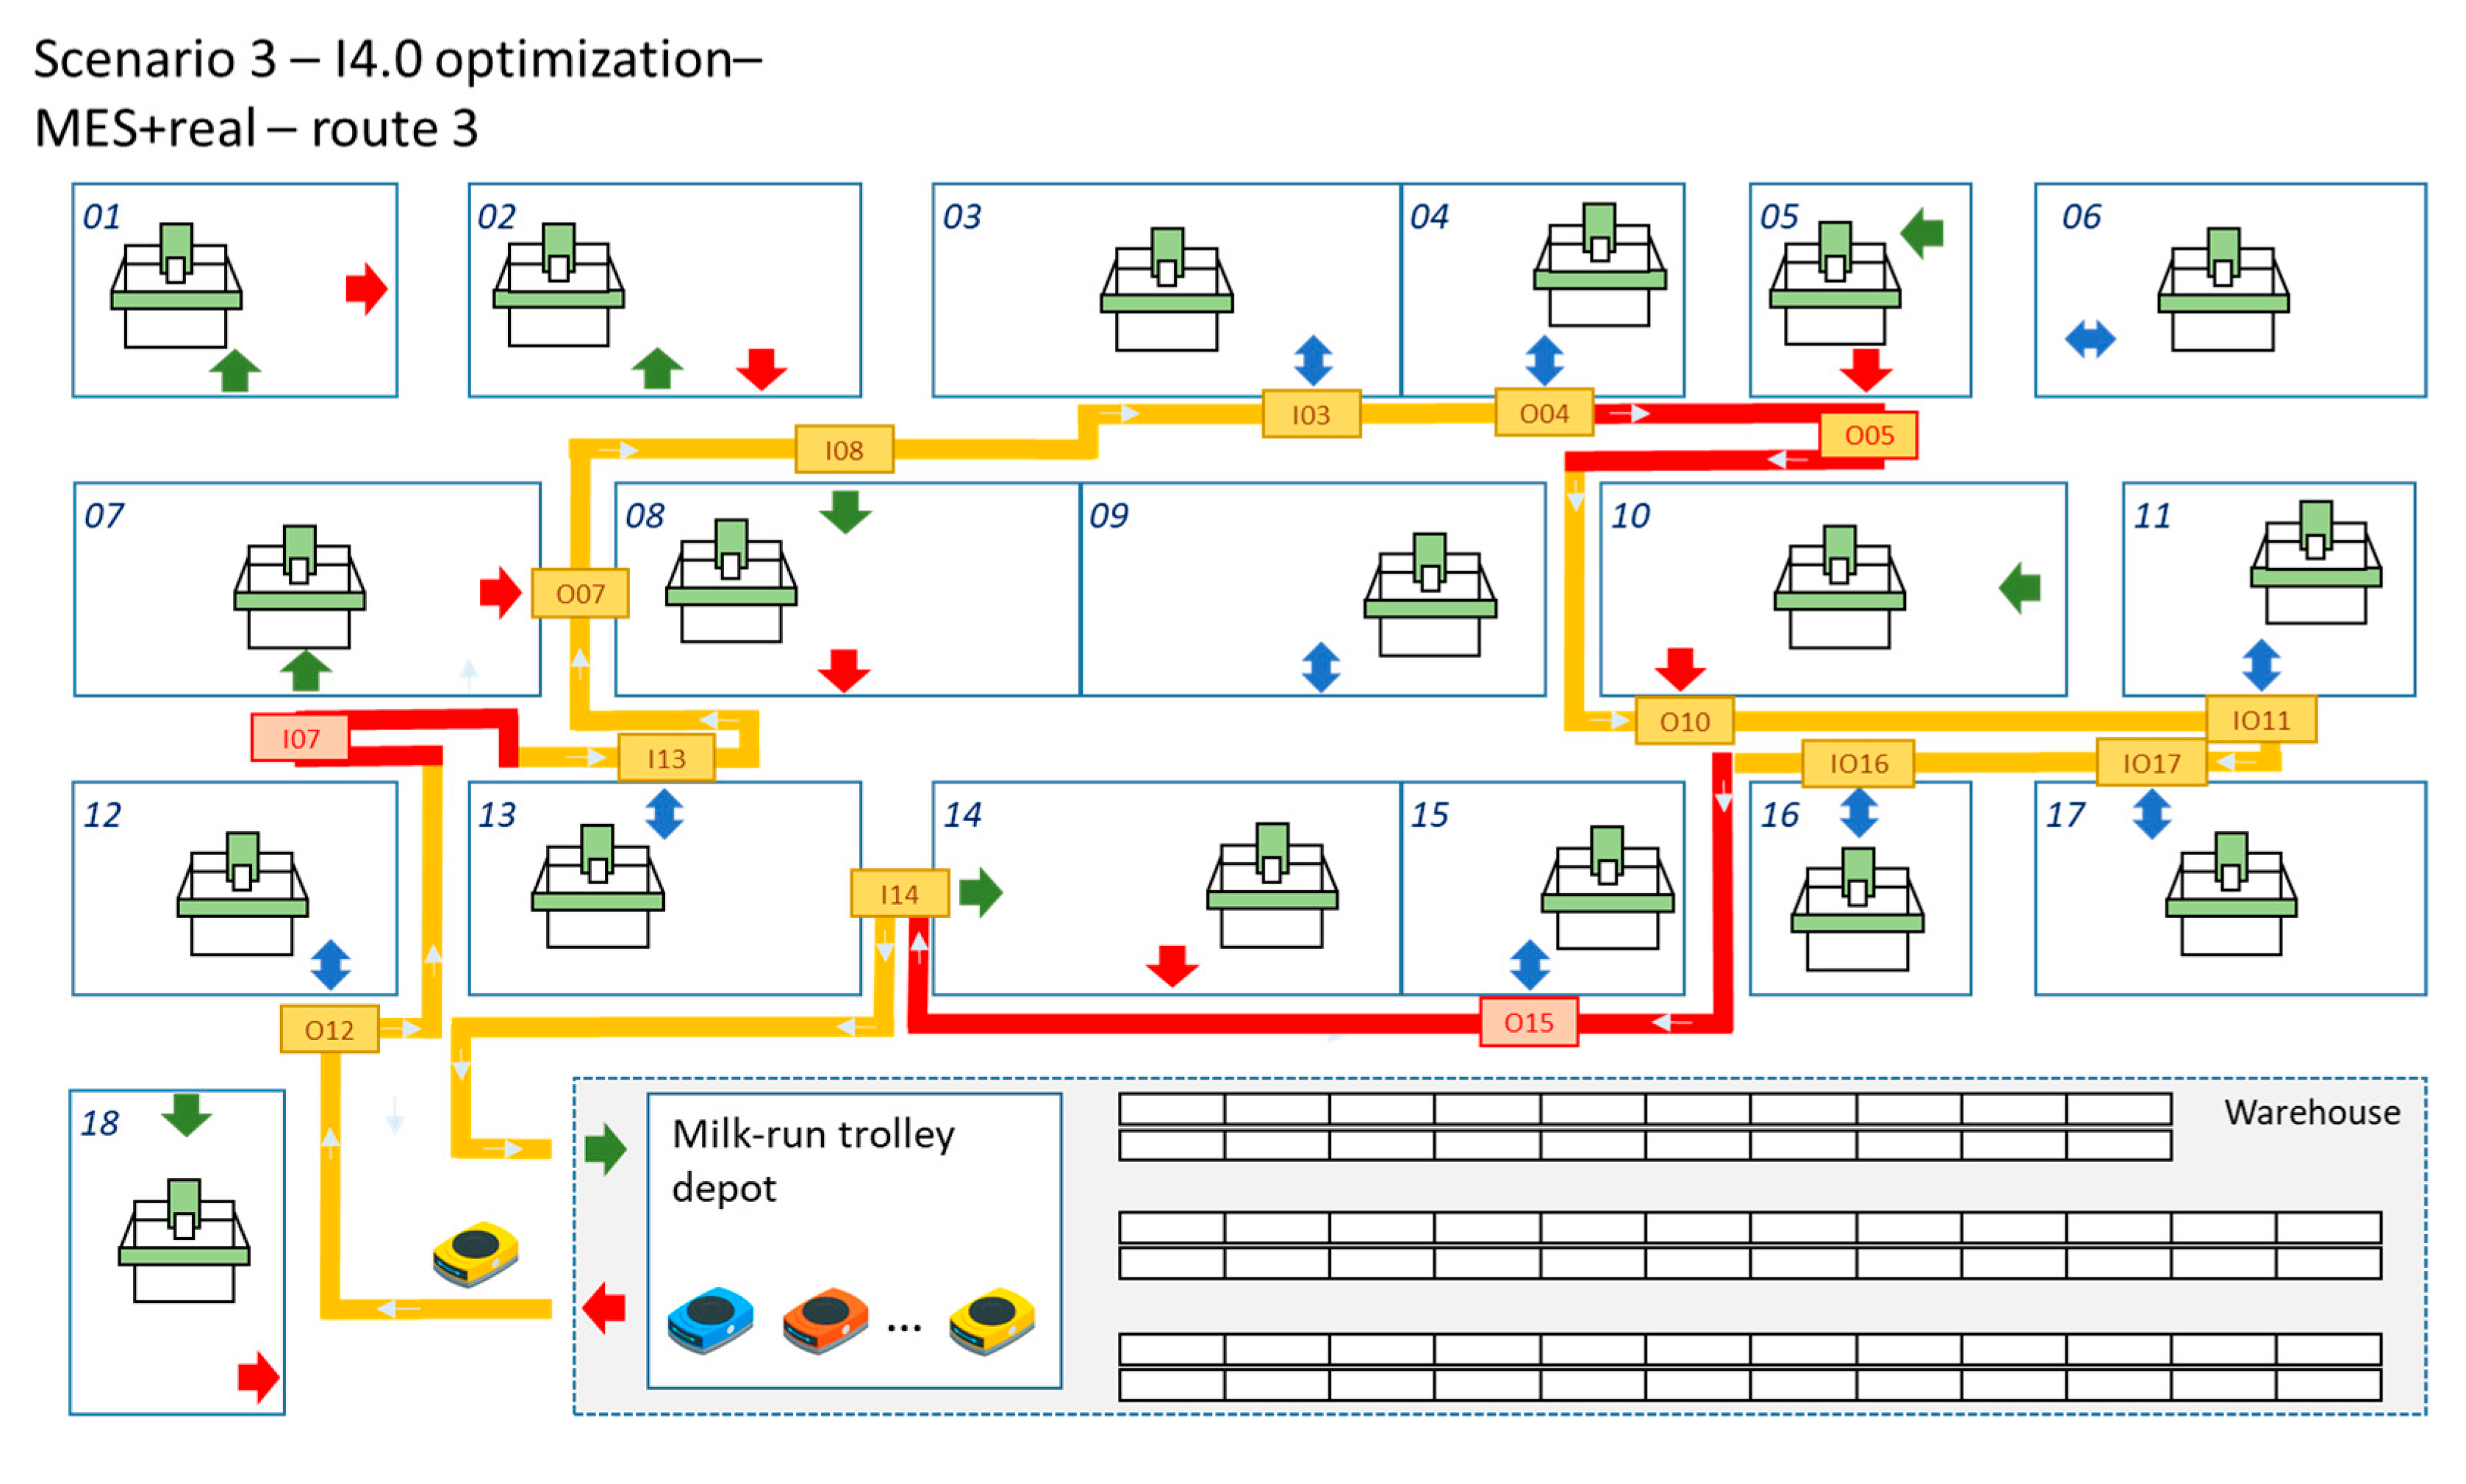
Figure 14.
The optimized loading of the three milk-run trolleys.
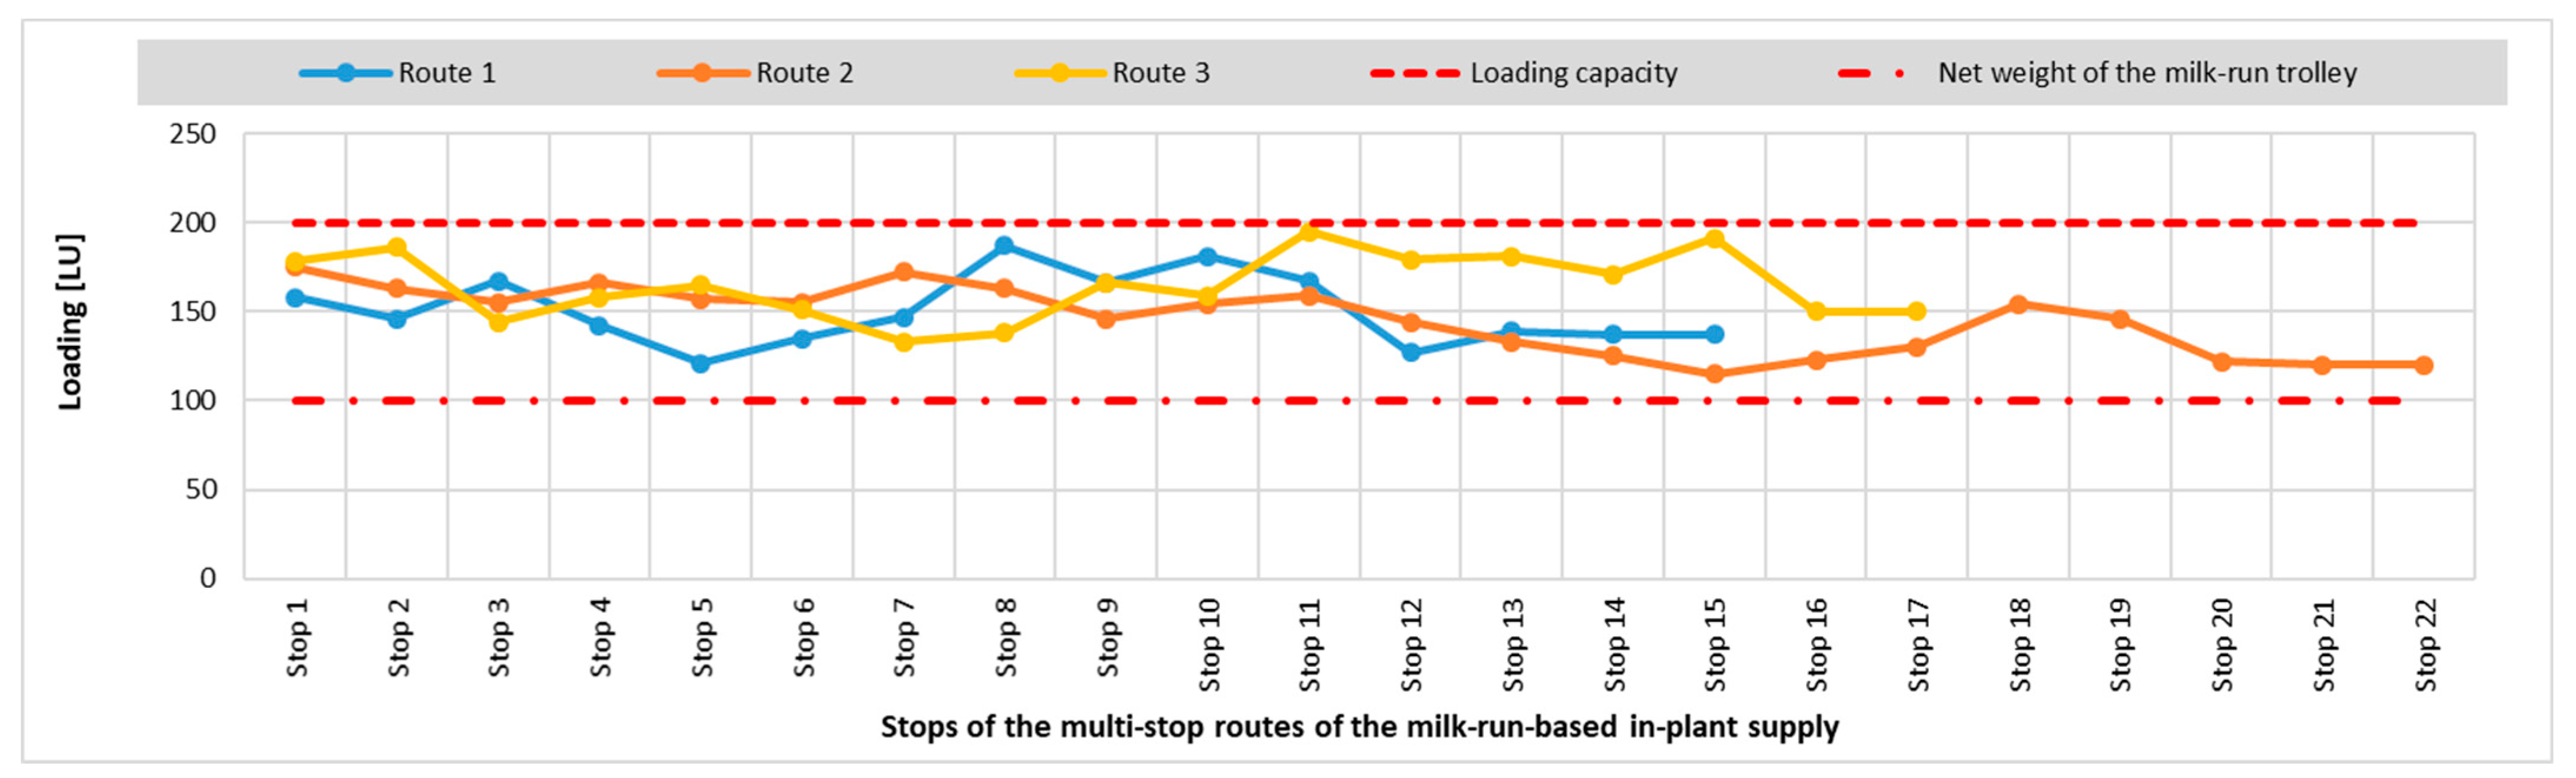
Figure 15.
The cumulative energy consumption of the three milk-run trolleys.

Table 3.
Numerical results of the scheduling of predefined specific in-plant material supply operations performed by the milk-run trolley within route 1.
Table 3.
Numerical results of the scheduling of predefined specific in-plant material supply operations performed by the milk-run trolley within route 1.
| S_ID * | C_ID 1 | Type 2 | From 3 | To 4 | LOAD 5 | CLO 6 | TFRAME 7 | TSCHED 8 | ECT 9 | ECH 10 | EC 11 |
|---|---|---|---|---|---|---|---|---|---|---|---|
| S_00 | C_00 | - | - | - | 100 | 158 | - | 3:27:36 | 49.5 | 49.5 | |
| S_01 | C_12 | LO | C_00 | - | 12 | 146 | 03:28:00–03:30:00 | 3:29:10 | 65.8 | 10.2 | 125.5 |
| S_02 | C_14 | UNLO | - | C_03 | 21 | 167 | 03:30:00–03:32:00 | 3:31:35 | 111.4 | 17.9 | 254.9 |
| S_03 | C_16 | LO | C_00 | - | 25 | 142 | 03:30:00–03:35:00 | 3:34:00 | 127.4 | 21.4 | 403.7 |
| S_04 | C_07 | LO | C_00 | - | 21 | 121 | 03:35:00–03:40:00 | 3:38:04 | 203.6 | 17.9 | 625.2 |
| S_05 | C_07 | UNLO | - | C_04 | 14 | 135 | 03:35:00–03:40:00 | 3:39:28 | 42.0 | 12.0 | 679.1 |
| S_06 | C_02 | UNLO | - | C_10 | 40 | 175 | 03:40:00–03:43:00 | 3:40:58 | 53.1 | 34.2 | 766.4 |
| S_07 | C_03 | LO | C_14 | - | 21 | 154 | 03:42:00–03:45:00 | 3:42:38 | 80.9 | 17.9 | 865.2 |
| S_08 | C_03 | UNLO | - | C_00 | 15 | 169 | 03:42:00–03:46:00 | 3:43:10 | 0.0 | 12.8 | 878.1 |
| S_09 | C_04 | LO | C_07 | - | 14 | 155 | 03:44:00–03:47:00 | 3:44:10 | 31.3 | 12.0 | 921.3 |
| S_10 | C_10 | LO | C_02 | - | 40 | 115 | 03:45:00–03:48:00 | 3:46:14 | 96.8 | 34.2 | 1052.2 |
| S_11 | C_15 | UNLO | - | C_00 | 10 | 125 | 03:46:00–03:50:00 | 3:48:50 | 95.7 | 8.5 | 1156.5 |
| S_12 | C_00 | - | - | - | 0 | 125 | - | 3:51:56 | 130.1 | 21.4 | 1307.9 |
* S_ID = Identification number of the stop of milk-run trolleys. 1 C_ID = Identification number of the assembly or manufacturing cell. 2 Type = Type of the material-handling operation at the assembly or manufacturing cell (LO = Loading and UNLO = Unloading). 3 From = Source of the components to be transported to the assembly or manufacturing cell. 4 To = Destination of the components loaded at a specific assembly or manufacturing cell. 5 LOAD = Load of the milk-run trolley in the loading unit [LU]. 6 CLO = Cumulative loading after passing the specific station in the loading unit. 7 TFRAME = Predefined time frame; it is not allowed to exceed this lower and upper limit of the delivery time window. 8 TSCHED = Scheduled arrival and departure times of the milk-run trolley at the assembly or manufacturing cells. 9 ECT = Transportation-related energy consumption of the milk-run trolley. 10 ECH = Material-handling-related (loading and unloading) energy consumption at the assembly or manufacturing cells. 11 EC = Total energy consumption including transportation and material-handling-related energy consumption.
Table 4.
Numerical results of the scheduling of predefined specific in-plant material supply operations performed by the milk-run trolley within route 2.
Table 4.
Numerical results of the scheduling of predefined specific in-plant material supply operations performed by the milk-run trolley within route 2.
| S_ID * | S_ID 1 | Type 2 | From 3 | To 4 | LOAD 5 | CLO 6 | TFRAME 7 | TSCHED 8 | ECT 9 | ECH 10 | EC 11 |
|---|---|---|---|---|---|---|---|---|---|---|---|
| S_00 | C_00 | - | - | - | 100 | 175 | - | 3:45:40 | - | 64.1 | 64.1 |
| S_01 | C_12 | LO | C_00 | - | 12 | 163 | 03:47:00–03:50:00 | 3:47:14 | 72.8 | 10.2 | 147.1 |
| S_02 | C_07 | LO | C_00 | - | 8 | 155 | 03:48:00–03:50:00 | 3:48:27 | 45.2 | 6.8 | 199.2 |
| S_03 | C_07 | UNLO | - | C_06 | 11 | 166 | 03:48:00–03:50:00 | 3:49:50 | 53.8 | 9.4 | 262.4 |
| S_04 | C_01 | LO | C_00 | - | 9 | 157 | 03:50:00–03:53:00 | 3:51:20 | 65.3 | 7.7 | 335.3 |
| S_05 | C_02 | LO | C_00 | - | 2 | 155 | 03:52:00–03:53:00 | 3:52:44 | 54.5 | 1.7 | 391.5 |
| S_06 | C_02 | UNLO | - | C_04 | 17 | 172 | 03:52:00–03:57:00 | 3:53:26 | 10.8 | 14.5 | 416.7 |
| S_07 | C_03 | LO | C_00 | - | 9 | 163 | 03:54:00–03:57:00 | 3:55:07 | 79.6 | 7.7 | 504.0 |
| S_08 | C_04 | LO | C_02 | - | 17 | 146 | 03:55:00–03:57:00 | 3:56:06 | 30.2 | 14.5 | 548.7 |
| S_09 | C_04 | UNLO | - | C_00 | 8 | 154 | 03:55:00–03:57:00 | 3:56:38 | 0.0 | 6.8 | 555.5 |
| S_10 | C_05 | UNLO | - | C_00 | 5 | 159 | 03:56:00–03:59:00 | 3:57:51 | 42.7 | 4.3 | 602.5 |
| S_11 | C_05 | LO | C_00 | - | 15 | 144 | 03:57:00–04:04:00 | 3:58:54 | 33.1 | 12.8 | 648.4 |
| S_12 | C_06 | LO | C_07 | - | 11 | 133 | 03:58:00–04:04:00 | 3:59:50 | 23.3 | 9.4 | 681.1 |
| S_13 | C_10 | LO | C_00 | - | 8 | 125 | 03:59:00–04:04:00 | 4:00:53 | 27.7 | 6.8 | 715.6 |
| S_14 | C_11 | LO | C_00 | - | 10 | 115 | 04:00:00–04:04:00 | 4:02:16 | 43.4 | 8.5 | 767.5 |
| S_15 | C_11 | UNLO | - | C_16 | 8 | 123 | 04:02:00–04:05:00 | 4:02:48 | 0.0 | 6.8 | 774.3 |
| S_16 | C_17 | UNLO | - | C_00 | 7 | 130 | 04:03:00–04:06:00 | 4:03:51 | 25.6 | 6.0 | 805.9 |
| S_17 | C_16 | LO | C_11 | - | 8 | 122 | 04:03:00–04:06:00 | 4:04:54 | 27.1 | 6.8 | 839.8 |
| S_18 | C_14 | LO | C_00 | - | 2 | 120 | 04:06:00–04:11:00 | 4:07:33 | 104.4 | 1.7 | 945.9 |
| S_19 | C_00 | - | - | - | 0 | 120 | - | 4:09:44 | 80.5 | 17.1 | 1043.5 |
* S_ID = Identification number of the stop of milk-run trolleys. 1 C_ID = Identification number of the assembly or manufacturing cell. 2 Type = Type of the material-handling operation at the assembly or manufacturing cell (LO = Loading and UNLO = Unloading). 3 From = Source of the components to be transported to the assembly or manufacturing cell. 4 To = Destination of the components loaded at a specific assembly or manufacturing cell. 5 LOAD = Load of the milk-run trolley in the loading unit [LU]. 6 CLO = Cumulative loading after passing the specific station in the loading unit. 7 TFRAME = Predefined time frame; it is not allowed to exceed this lower and upper limit of the delivery time window. 8 TSCHED = Scheduled arrival and departure times of the milk-run trolley at the assembly or manufacturing cells. 9 ECT = Transportation-related energy consumption of the milk-run trolley. 10 ECH = Material-handling-related (loading and unloading) energy consumption at the assembly or manufacturing cells. 11 EC = Total energy consumption including transportation and material-handling-related energy consumption.
Table 5.
Numerical results of the scheduling of predefined specific in-plant material supply operations performed by the milk-run trolley within route 3.
Table 5.
Numerical results of the scheduling of predefined specific in-plant material supply operations performed by the milk-run trolley within route 3.
| S_ID * | S_ID 1 | Type 2 | From 3 | To 4 | LOAD 5 | CLO 6 | TFRAME 7 | TSCHED 8 | ECT 9 | ECH 10 | EC 11 |
|---|---|---|---|---|---|---|---|---|---|---|---|
| S_00 | C_00 | - | - | - | 100 | 144 | 4:13:51 | 37.6 | 37.6 | ||
| S_01 | C_12 | UNLO | - | C_13 | 8 | 152 | 04:15:00–04:17:00 | 4:15:25 | 59.9 | 6.8 | 104.3 |
| S_02 | C_13 | LO | C_12 | - | 8 | 144 | 04:15:00–04:20:00 | 4:17:12 | 77.3 | 6.8 | 188.5 |
| S_03 | C_13 | UNLO | - | C_08 | 14 | 158 | 04:16:00–04:20:00 | 4:17:44 | 0.0 | 12.0 | 200.5 |
| S_04 | C_07 | UNLO | - | C_11 | 7 | 165 | 04:18:00–04:21:00 | 4:19:07 | 54.8 | 6.0 | 261.3 |
| S_05 | C_08 | LO | C_13 | - | 14 | 151 | 04:19:00–04:22:00 | 4:20:27 | 53.4 | 12.0 | 326.6 |
| S_06 | C_03 | LO | C_00 | - | 18 | 133 | 04:21:00–04:24:00 | 4:22:18 | 80.3 | 15.4 | 422.3 |
| S_07 | C_04 | UNLO | - | C_00 | 5 | 138 | 04:22:00–04:25:00 | 4:23:18 | 24.6 | 4.3 | 451.2 |
| S_08 | C_10 | UNLO | - | C_00 | 7 | 145 | 04:24:00–04:30:00 | 4:24:55 | 60.6 | 6.0 | 517.8 |
| S_09 | C_11 | LO | C_07 | - | 7 | 138 | 04:24:00–04:30:00 | 4:26:45 | 77.1 | 6.0 | 600.9 |
| S_10 | C_11 | UNLO | - | C_00 | 36 | 174 | 04:27:00–04:30:00 | 4:27:17 | 0.0 | 30.7 | 631.6 |
| S_11 | C_17 | LO | C_00 | - | 16 | 158 | 04:27:00–04:33:00 | 4:28:20 | 36.2 | 13.7 | 681.5 |
| S_12 | C_17 | UN | - | C_00 | 2 | 160 | 04:28:00–04:33:00 | 4:28:52 | 0.0 | 1.7 | 683.2 |
| S_13 | C_16 | LO | C_00 | - | 10 | 150 | 04:28:00–04:33:00 | 4:29:55 | 33.3 | 8.5 | 725.1 |
| S_14 | C_16 | UNLO | - | C_14 | 20 | 170 | 04:30:00–04:33:00 | 4:30:27 | 0.0 | 17.1 | 742.1 |
| S_15 | C_14 | LO | C_16 | - | 20 | 150 | 04:30:00–04:37:00 | 4:33:06 | 145.5 | 17.1 | 904.7 |
| S_16 | C_00 | - | - | - | 0 | 150 | 4:35:17 | 100.6 | 42.7 | 1048.0 |
* S_ID = Identification number of the stop of milk-run trolleys. 1 C_ID = Identification number of the assembly or manufacturing cell. 2 Type = Type of the material-handling operation at the assembly or manufacturing cell (LO = Loading and UNLO = Unloading). 3 From = Source of the components to be transported to the assembly or manufacturing cell. 4 To = Destination of the components loaded at a specific assembly or manufacturing cell. 5 LOAD = Load of the milk-run trolley in the loading unit [LU]. 6 CLO = Cumulative loading after passing the specific station in the loading unit. 7 TFRAME = Predefined time frame; it is not allowed to exceed this lower and upper limit of the delivery time window. 8 TSCHED = Scheduled arrival and departure times of the milk-run trolley at the assembly or manufacturing cells. 9 ECT = Transportation-related energy consumption of the milk-run trolley. 10 ECH = Material-handling-related (loading and unloading) energy consumption at the assembly or manufacturing cells. 11 EC = Total energy consumption including transportation and material-handling-related energy consumption.
Table 7.
Numerical results of the conventional optimization of real-time supply demands performed by the milk-run trolley within the additional route 5.
Table 7.
Numerical results of the conventional optimization of real-time supply demands performed by the milk-run trolley within the additional route 5.
| S_ID * | C_ID 1 | Type 2 | From 3 | To 4 | LOAD 5 | CLO 6 | TFRAME 7 | TSCHED 8 | ECT 9 | ECH 10 | EC 11 |
|---|---|---|---|---|---|---|---|---|---|---|---|
| S_00 | C_00 | - | - | - | 100 | 100 | - | 4:01:40 | 0.0 | 0.0 | |
| S_01 | C_17 | UNLO | - | C_15 | 24 | 124 | 04:03:00–04:06:00 | 4:06:29 | 173.4 | 20.5 | 193.9 |
| S_02 | C_15 | LO | C_17 | - | 24 | 100 | 04:03:00–04:08:00 | 4:08:44 | 86.0 | 20.5 | 300.5 |
| S_03 | C_00 | - | - | - | 0 | 100 | - | 4:11:50 | 104.1 | 0.0 | 404.5 |
* S_ID = Identification number of the stop of milk-run trolleys. 1 C_ID = Identification number of the assembly or manufacturing cell. 2 Type = Type of the material-handling operation at the assembly or manufacturing cell (LO = Loading and UNLO = Unloading). 3 From = Source of the components to be transported to the assembly or manufacturing cell. 4 To = Destination of the components loaded at a specific assembly or manufacturing cell. 5 LOAD = Load of the milk-run trolley in the loading unit [LU]. 6 CLO = Cumulative loading after passing the specific station in the loading unit. 7 TFRAME = Predefined time frame; it is not allowed to exceed this lower and upper limit of the delivery time window. 8 TSCHED = Scheduled arrival and departure times of the milk-run trolley at the assembly or manufacturing cells. 9 ECT = Transportation-related energy consumption of the milk-run trolley. 10 ECH = Material-handling-related (loading and unloading) energy consumption at the assembly or manufacturing cells. 11 EC = Total energy consumption including transportation and material-handling-related energy consumption.
Table 8.
Numerical results of the conventional optimization of real-time supply demands performed by the milk-run trolley within the additional route 6.
Table 8.
Numerical results of the conventional optimization of real-time supply demands performed by the milk-run trolley within the additional route 6.
| S_ID * | C_ID 1 | Type 2 | From 3 | To 4 | LOAD 5 | CLO 6 | TFRAME 7 | TSCHED 8 | ECT 9 | ECH 10 | EC 11 |
|---|---|---|---|---|---|---|---|---|---|---|---|
| S_00 | C_00 | - | - | - | 100 | 134 | - | 4:13:51 | 29.0 | 29.0 | |
| S_01 | C_07 | LO | C_00 | - | 34 | 100 | 04:15:00–04:17:00 | 4:16:06 | 93.0 | 29.0 | 151.0 |
| S_02 | C_05 | UNLO | - | C_15 | 21 | 121 | 04:20:00–04:30:00 | 4:20:44 | 166.5 | 17.9 | 335.5 |
| S_03 | C_15 | LO | C_05 | - | 21 | 100 | 04:22:00–04:35:00 | 4:23:23 | 103.5 | 17.9 | 456.9 |
| S_04 | C_00 | - | - | - | 0 | 100 | - | 4:25:38 | 69.4 | 0.0 | 526.3 |
* S_ID = Identification number of the stop of milk-run trolleys. 1 C_ID = Identification number of the assembly or manufacturing cell. 2 Type = Type of the material-handling operation at the assembly or manufacturing cell (LO = Loading and UNLO = Unloading). 3 From = Source of the components to be transported to the assembly or manufacturing cell. 4 To = Destination of the components loaded at a specific assembly or manufacturing cell. 5 LOAD = Load of the milk-run trolley in the loading unit [LU]. 6 CLO = Cumulative loading after passing the specific station in the loading unit. 7 TFRAME = Predefined time frame; it is not allowed to exceed this lower and upper limit of the delivery time window. 8 TSCHED = Scheduled arrival and departure times of the milk-run trolley at the assembly or manufacturing cells. 9 ECT = Transportation-related energy consumption of the milk-run trolley. 10 ECH = Material-handling-related (loading and unloading) energy consumption at the assembly or manufacturing cells. 11 EC = Total energy consumption including transportation and material-handling-related energy consumption.
Table 9.
Numerical results of the scheduling of predefined and real-time-generated specific in-plant material supply operations performed by the milk-run trolley within route 1. The colored rows represent the real-time added supply demands generated by the supervisory level using the results of the optimization based on the digital twin model.
| S_ID * | C_ID 1 | Type 2 | From 3 | To 4 | LOAD 5 | CLO 6 | TFRAME 7 | TSCHED 8 | ECT 9 | ECH 10 | EC 11 |
|---|---|---|---|---|---|---|---|---|---|---|---|
| S_00 | C_00 | - | - | - | 100 | 158 | - | 3:27:36 | 49.5 | 49.5 | |
| S_01 | C_12 | LO | C_00 | - | 12 | 146 | 03:28:00–03:30:00 | 3:29:10 | 65.8 | 10.2 | 125.5 |
| S_02 | C_14 | UNLO | - | C_03 | 21 | 167 | 03:30:00–03:32:00 | 3:31:35 | 111.4 | 17.9 | 254.9 |
| S_03 | C_16 | LO | C_00 | - | 25 | 142 | 03:30:00–03:35:00 | 3:34:00 | 127.4 | 21.4 | 403.7 |
| S_04 | C_07 | LO | C_00 | - | 21 | 121 | 03:35:00–03:40:00 | 3:38:04 | 203.6 | 17.9 | 625.2 |
| S_05 | C_07 | UNLO | - | C_04 | 14 | 135 | 03:35:00–03:40:00 | 3:39:28 | 42.0 | 12.0 | 679.1 |
| S_06 | C_01 | UNLO | - | C_17 | 12 | 147 | 03:40:00–03:42:00 | 3:40:54 | 50.0 | 10.2 | 739.3 |
| S_07 | C_02 | UNLO | - | C_10 | 40 | 187 | 03:40:00–03:43:00 | 3:42:25 | 57.8 | 34.2 | 831.3 |
| S_08 | C_03 | LO | C_14 | - | 21 | 166 | 03:42:00–03:45:00 | 3:44:05 | 86.5 | 17.9 | 935.7 |
| S_09 | C_03 | UNLO | - | C_00 | 15 | 181 | 03:42:00–03:46:00 | 3:44:37 | 0.0 | 12.8 | 948.5 |
| S_10 | C_04 | LO | C_07 | - | 14 | 167 | 03:44:00–03:47:00 | 3:45:37 | 33.5 | 12.0 | 994.0 |
| S_11 | C_10 | LO | C_02 | - | 40 | 127 | 03:45:00–03:48:00 | 3:47:41 | 104.3 | 34.2 | 1132.4 |
| S_12 | C_17 | LO | C_01 | - | 12 | 139 | 03:46:00–03:50:00 | 3:48:54 | 35.2 | 10.2 | 1177.9 |
| S_13 | C_15 | UNLO | - | C_00 | 10 | 137 | 03:46:00–03:50:00 | 3:49:56 | 88.1 | 8.5 | 1274.5 |
| S_14 | C_00 | - | - | - | 0 | 137 | - | 3:53:02 | 142.6 | 31.6 | 1448.7 |
* S_ID = Identification number of the stop of milk-run trolleys. 1 C_ID = Identification number of the assembly or manufacturing cell. 2 Type = Type of the material-handling operation at the assembly or manufacturing cell (LO = Loading and UNLO = Unloading). 3 From = Source of the components to be transported to the assembly or manufacturing cell. 4 To = Destination of the components loaded at a specific assembly or manufacturing cell. 5 LOAD = Load of the milk-run trolley in the loading unit [LU]. 6 CLO = Cumulative loading after passing the specific station in the loading unit. 7 TFRAME = Predefined time frame; it is not allowed to exceed this lower and upper limit of the delivery time window. 8 TSCHED = Scheduled arrival and departure times of the milk-run trolley at the assembly or manufacturing cells. 9 ECT = Transportation-related energy consumption of the milk-run trolley. 10 ECH = Material-handling-related (loading and unloading) energy consumption at the assembly or manufacturing cells. 11 EC = Total energy consumption including transportation and material-handling-related energy consumption.
Table 10.
Numerical results of the scheduling of predefined and real-time-generated specific in-plant material supply operations performed by the milk-run trolley within route 2. The colored rows represent the real-time added supply demands generated by the supervisory level using the results of the optimization based on the digital twin model.
| S_ID * | S_ID 1 | Type 2 | From 3 | To 4 | LOAD 5 | CLO 6 | TFRAME 7 | TSCHED 8 | ECT 9 | ECH 10 | EC 11 |
|---|---|---|---|---|---|---|---|---|---|---|---|
| S_00 | C_00 | - | - | - | 100 | 175 | - | 3:45:40 | - | 64.1 | 64.1 |
| S_01 | C_12 | LO | C_00 | - | 12 | 163 | 03:47:00–03:50:00 | 3:47:14 | 72.8 | 10.2 | 147.1 |
| S_02 | C_07 | LO | C_00 | - | 8 | 155 | 03:48:00–03:50:00 | 3:48:27 | 45.2 | 6.8 | 199.2 |
| S_03 | C_07 | UNLO | - | C_06 | 11 | 166 | 03:48:00–03:50:00 | 3:49:50 | 53.8 | 9.4 | 262.4 |
| S_04 | C_01 | LO | C_00 | - | 9 | 157 | 03:50:00–03:53:00 | 3:51:20 | 65.3 | 7.7 | 335.3 |
| S_05 | C_02 | LO | C_00 | - | 2 | 155 | 03:52:00–03:53:00 | 3:52:44 | 54.5 | 1.7 | 391.5 |
| S_06 | C_02 | UNLO | - | C_04 | 17 | 172 | 03:52:00–03:57:00 | 3:53:26 | 10.8 | 14.5 | 416.7 |
| S_07 | C_03 | LO | C_00 | - | 9 | 163 | 03:54:00–03:57:00 | 3:55:07 | 79.6 | 7.7 | 504.0 |
| S_08 | C_04 | LO | C_02 | - | 17 | 146 | 03:55:00–03:57:00 | 3:56:06 | 30.2 | 14.5 | 548.7 |
| S_09 | C_04 | UNLO | - | C_00 | 8 | 154 | 03:55:00–03:57:00 | 3:56:38 | 0.0 | 6.8 | 555.5 |
| S_10 | C_05 | UNLO | - | C_00 | 5 | 159 | 03:56:00–03:59:00 | 3:57:51 | 42.7 | 4.3 | 602.5 |
| S_11 | C_05 | LO | C_00 | - | 15 | 144 | 03:57:00–04:04:00 | 3:58:54 | 33.1 | 12.8 | 648.4 |
| S_12 | C_06 | LO | C_07 | - | 11 | 133 | 03:58:00–04:04:00 | 3:59:50 | 23.3 | 9.4 | 681.1 |
| S_13 | C_10 | LO | C_00 | - | 8 | 125 | 03:59:00–04:04:00 | 4:00:53 | 27.7 | 6.8 | 715.6 |
| S_14 | C_11 | LO | C_00 | - | 10 | 115 | 04:00:00–04:04:00 | 4:02:16 | 43.4 | 8.5 | 767.5 |
| S_15 | C_11 | UNLO | - | C_16 | 8 | 123 | 04:02:00–04:05:00 | 4:02:48 | 0.0 | 6.8 | 774.3 |
| S_16 | C_17 | UNLO | - | C_00 | 7 | 130 | 04:03:00–04:06:00 | 4:03:51 | 25.6 | 6.0 | 805.9 |
| S_17 | C_17 | UNLO | - | C_15 | 24 | 154 | 04:03:00–04:06:00 | 4:04:23 | 0.0 | 20.5 | 826.4 |
| S_18 | C_16 | LO | C_11 | - | 8 | 146 | 04:03:00–04:06:00 | 4:05:26 | 32.1 | 6.8 | 865.3 |
| S_19 | C_15 | LO | C_17 | - | 24 | 122 | 04:03:00–04:08:00 | 4:07:10 | 70.9 | 20.5 | 956.7 |
| S_20 | C_14 | LO | C_00 | - | 2 | 120 | 04:06:00–04:11:00 | 4:09:11 | 73.4 | 1.7 | 1031.8 |
| S_21 | C_00 | - | - | - | 0 | 120 | - | 4:11:22 | 80.5 | 17.1 | 1129.3 |
* S_ID = Identification number of the stop of milk-run trolleys. 1 C_ID = Identification number of the assembly or manufacturing cell. 2 Type = Type of the material-handling operation at the assembly or manufacturing cell (LO = Loading and UNLO = Unloading). 3 From = Source of the components to be transported to the assembly or manufacturing cell. 4 To = Destination of the components loaded at a specific assembly or manufacturing cell. 5 LOAD = Load of the milk-run trolley in the loading unit [LU]. 6 CLO = Cumulative loading after passing the specific station in the loading unit. 7 TFRAME = Predefined time frame; it is not allowed to exceed this lower and upper limit of the delivery time window. 8 TSCHED = Scheduled arrival and departure times of the milk-run trolley at the assembly or manufacturing cells. 9 ECT = Transportation-related energy consumption of the milk-run trolley. 10 ECH = Material-handling-related (loading and unloading) energy consumption at the assembly or manufacturing cells. 11 EC = Total energy consumption including transportation and material-handling-related energy consumption.
Table 11.
Numerical results of the scheduling of predefined and real-time-generated specific in-plant material supply operations performed by the milk-run trolley within route 3. The colored rows represent the real-time added supply demands generated by the supervisory level using the results of the optimization based on the digital twin model.
| S_ID * | S_ID 1 | Type 2 | From 3 | To 4 | LOAD 5 | CLO 6 | TFRAME 7 | TSCHED 8 | ECT 9 | ECH 10 | EC 11 |
|---|---|---|---|---|---|---|---|---|---|---|---|
| S_00 | C_00 | - | - | - | 100 | 178 | 4:13:51 | 66.6 | 66.6 | ||
| S_01 | C_12 | UNLO | - | C_13 | 8 | 186 | 04:15:00–04:17:00 | 4:15:25 | 74.1 | 6.8 | 147.5 |
| S_02 | C_07 | LO | C_00 | - | 34 | 152 | 04:15:00–04:17:00 | 4:16:38 | 51.6 | 29.0 | 228.2 |
| S_03 | C_13 | LO | C_12 | - | 8 | 144 | 04:15:00–04:20:00 | 4:18:11 | 63.3 | 6.8 | 298.3 |
| S_04 | C_13 | UNLO | - | C_08 | 14 | 158 | 04:16:00–04:20:00 | 4:18:43 | 0.0 | 12.0 | 310.2 |
| S_05 | C_07 | UNLO | - | C_11 | 7 | 165 | 04:18:00–04:21:00 | 4:20:07 | 54.8 | 6.0 | 371.0 |
| S_06 | C_08 | LO | C_13 | - | 14 | 151 | 04:19:00–04:22:00 | 4:21:27 | 53.4 | 12.0 | 436.4 |
| S_07 | C_03 | LO | C_00 | - | 18 | 133 | 04:21:00–04:24:00 | 4:23:18 | 80.3 | 15.4 | 532.1 |
| S_08 | C_04 | UNLO | - | C_00 | 5 | 138 | 04:22:00–04:25:00 | 4:24:17 | 24.6 | 4.3 | 561.0 |
| S_09 | C_05 | UNLO | 0 | C_15 | 21 | 159 | 04:20:00–04:30:00 | 4:25:30 | 38.3 | 17.9 | 617.2 |
| S_10 | C_10 | UNLO | - | C_00 | 7 | 166 | 04:24:00–04:30:00 | 4:27:14 | 77.2 | 6.0 | 700.4 |
| S_11 | C_11 | LO | C_07 | - | 7 | 159 | 04:24:00–04:30:00 | 4:29:05 | 88.3 | 6.0 | 794.7 |
| S_12 | C_11 | UNLO | - | C_00 | 36 | 195 | 04:27:00–04:30:00 | 4:29:37 | 0.0 | 30.7 | 825.4 |
| S_13 | C_17 | LO | C_00 | - | 16 | 179 | 04:27:00–04:33:00 | 4:30:40 | 40.6 | 13.7 | 879.6 |
| S_14 | C_17 | UN | - | C_00 | 2 | 181 | 04:28:00–04:33:00 | 4:31:12 | 0.0 | 1.7 | 881.4 |
| S_15 | C_16 | LO | C_00 | - | 10 | 171 | 04:28:00–04:33:00 | 4:32:15 | 37.7 | 8.5 | 927.6 |
| S_16 | C_16 | UNLO | - | C_14 | 20 | 191 | 04:30:00–04:33:00 | 4:32:47 | 0.0 | 17.1 | 944.6 |
| S_17 | C_15 | LO | C_05 | - | 21 | 170 | 04:22:00–04:35:00 | 4:34:30 | 92.8 | 17.9 | 1055.3 |
| S_18 | C_14 | LO | C_16 | - | 20 | 150 | 04:30:00–04:37:00 | 4:36:32 | 102.2 | 17.1 | 1174.6 |
| S_19 | C_00 | - | - | - | 0 | 150 | 4:39:41 | 159.6 | 42.7 | 1376.9 |
* S_ID = Identification number of the stop of milk-run trolleys. 1 C_ID = Identification number of the assembly or manufacturing cell. 2 Type = Type of the material-handling operation at the assembly or manufacturing cell (LO = Loading and UNLO = Unloading). 3 From = Source of the components to be transported to the assembly or manufacturing cell. 4 To = Destination of the components loaded at a specific assembly or manufacturing cell. 5 LOAD = Load of the milk-run trolley in the loading unit [LU]. 6 CLO = Cumulative loading after passing the specific station in the loading unit. 7 TFRAME = Predefined time frame; it is not allowed to exceed this lower and upper limit of the delivery time window. 8 TSCHED = Scheduled arrival and departure times of the milk-run trolley at the assembly or manufacturing cells. 9 ECT = Transportation-related energy consumption of the milk-run trolley. 10 ECH = Material-handling-related (loading and unloading) energy consumption at the assembly or manufacturing cells. 11 EC = Total energy consumption including transportation and material-handling-related energy consumption.
Table 12.
Comparison of the computational results of conventional and I4.0 technologies supported milk-run-based in-plant supply optimization in the case of MES data-based and real-time supply demands.
Table 12.
Comparison of the computational results of conventional and I4.0 technologies supported milk-run-based in-plant supply optimization in the case of MES data-based and real-time supply demands.
| R_ID 1 | ALRpD 2 | AECpD 3 | ALRpWU 4 | AECpWU 5 | AICpR 6 | CUT 7 | ADfTW 8 | TTfTW 9 |
|---|---|---|---|---|---|---|---|---|
| Scenario 1 | ||||||||
| Route 1 | 52.81 | 118.9 | 2.49 | 5.61 | 53 | 46.8% | 00:00:51 | 00:09:25 |
| Route 2 | 25.08 | 57.97 | 2.70 | 6.25 | 54 | 46.2% | 00:00:40 | 00:11:57 |
| Route 3 | 27.87 | 69.87 | 2.18 | 5.46 | 48 | 52.0% | 00:00:43 | 00:10:50 |
| Route 4 | 186.85 | 255.45 | 15.57 | 21.29 | 96 | 4.0% | 00:00:50 | 00:01:40 |
| Route 5 | 138.75 | 202.25 | 5.78 | 8.43 | 92 | 8.0% | 00:02:36 | 00:05:13 |
| Route 6 | 104.23 | 175.43 | 4.11 | 6.93 | 86 | 13.8% | 00:03:09 | 00:09:28 |
| Total | 89.27 | 146.65 | 5.47 | 8.99 | 72 | 28.4% | 00:01:28 | 00:48:33 |
| Scenario 2 | ||||||||
| Route 1 | 47.82 | 111.44 | 2.42 | 5.64 | 48 | 51.4% | 00:00:51 | 00:11:06 |
| Route 2 | 23.5 | 56.47 | 2.19 | 5.25 | 53 | 46.5% | 00:00:42 | 00:13:59 |
| Route 3 | 28.27 | 76.49 | 1.90 | 5.14 | 35 | 64.5% | 00:01:02 | 00:18:36 |
| Total | 33.19 | 81.47 | 2.17 | 5.34 | 45 | 54.2% | 00:00:52 | 00:43:42 |
1 R_ID = Route ID. 2 ALRpD = Average length of the required route per supply demand. 3 AECpD = Average energy consumption per supply demand. 4 ALRpWU = Average length of the required route per weight unit. 5 AECpWU = Average energy consumption per weight unit. 6 AICpR = Average idle capacity per route. 7 CUT = Capacity utilization of the milk-run trolley. 8 ADfTW = Average deviance from the average of the predefined time window. 9 TTfTW = Total deviance from the average of the predefined time window.
Disclaimer/Publisher’s Note: The statements, opinions and data contained in all publications are solely those of the individual author(s) and contributor(s) and not of MDPI and/or the editor(s). MDPI and/or the editor(s) disclaim responsibility for any injury to people or property resulting from any ideas, methods, instructions or products referred to in the content. |
© 2023 by the authors. Licensee MDPI, Basel, Switzerland. This article is an open access article distributed under the terms and conditions of the Creative Commons Attribution (CC BY) license (https://creativecommons.org/licenses/by/4.0/).
Share and Cite
MDPI and ACS Style
Akkad, M.Z.; Bányai, T. Energy Consumption Optimization of Milk-Run-Based In-Plant Supply Solutions: An Industry 4.0 Approach. Processes 2023, 11, 799. https://doi.org/10.3390/pr11030799
AMA Style
Akkad MZ, Bányai T. Energy Consumption Optimization of Milk-Run-Based In-Plant Supply Solutions: An Industry 4.0 Approach. Processes. 2023; 11(3):799. https://doi.org/10.3390/pr11030799
Chicago/Turabian StyleAkkad, Mohammad Zaher, and Tamás Bányai. 2023. "Energy Consumption Optimization of Milk-Run-Based In-Plant Supply Solutions: An Industry 4.0 Approach" Processes 11, no. 3: 799. https://doi.org/10.3390/pr11030799
Note that from the first issue of 2016, this journal uses article numbers instead of page numbers. See further details here.