
Variability in Physical Properties of Logging and Sawmill Residues for Making Wood Pellets
by
 , ,
, ,
Jun Sian Lee
1,
Hamid Rezaei
1 ,
,
Omid Gholami Banadkoki
1,
Fahimeh Yazdan Panah
1,2 and
Shahab Sokhansanj
1,3,* 1
Biomass and Bioenergy Research Group, Department of Chemical and Biological Engineering, University of British Columbia, Vancouver, BC V6T 1Z3, Canada
2
Wood Pellet Association of Canada, Vancouver, BC V0E 2S0, Canada
3
Department of Chemical and Biological Engineering, University of Saskatchewan, Saskatoon, SK S7N 5A9, Canada
*
Author to whom correspondence should be addressed.
Processes 2024, 12(1), 181; https://doi.org/10.3390/pr12010181
Submission received: 18 December 2023
/
Revised: 9 January 2024
/
Accepted: 10 January 2024
/
Published: 13 January 2024
(This article belongs to the Section Chemical Processes and Systems)
Abstract
:Wood pellets are a versatile ingredient to produce bioenergy and bioproducts. Wood pellet manufacturing in Canada started as a way of using the excess sawdust from sawmilling operations. With the recent dwindling availability of sawdust and the growth in demand for wood pellets, the industry uses more non-sawdust woody biomass as feedstock. In this study, woody biomass materials received from nine wood pellet plants in British Columbia (BC) and Alberta were analyzed for their properties, especially those used for fractionating feedstock to make pellets. Half of the feedstock received at the plants was non-sawdust. Moisture contents varied from 10 to 60% wet basis, with the hog having an average of 50%. Ash contents ranged from 0.3 to 4% dry basis and were highest in the hog fraction. Bulk density varied from 50 to 450 kg/m3, with shavings having the lowest bulk density. Particle density ranged from 359 kg/m3 for infeed mix to 513 kg/m3 for sawdust. In total, 25% of particles received were larger than 25 mm. The extraneous materials (sand, dirt) in the infeed materials ranged from 0.03% to 1.2%, except for one hog sample (8.2%). Plant operators use mechanical fractionation and blending to meet the required ash content. In conclusion, further instrumental techniques to aid in fractionation should be developed.
1. Introduction
Wood pellets, a densified form of biomass fuel, are a widely traded commodity to replace coal in power generation and heating applications. They are also used as an ingredient to produce sustainable aviation fuels via thermochemical processes. Similar to the production of lignocellulosic bio-composites, wood particles are pressed and extruded through a die having cylindrical holes to form wood pellets [1]. The current world trade in wood pellets is estimated at over 30 million tonnes and is increasing at a rate of more than 10% per year [2]. One of the international standards developed by the International Standards Organization (ISO 17225-2) [3] specifies the grades of pellets for large-scale power production (industrial grades) based on the pellet dimensions, minimum durability, maximum ash content, fines content, and moisture content, as listed in Table 1. The producers and users of wood pellets use the standard as a guide in establishing mutually binding trade agreements on the pellet quality produced and delivered [4].
Canada has more than 40 operating wood pellet production plants [5]. These plants are situated in a variety of latitudes and regions. Therefore, each plant has assessed a region-specific set of forest and sawmill residues that are economically available. Before the 2010s, wood pelleting facilities were traditionally established near the sawmilling operations to utilize excess sawdust. As a result, the average production capacity of a pellet plant at the time was about 25,000 tonnes per year [6]. In recent years, the economy of scale has pushed the sizes of commercial pellet plants to hundreds of thousands of tonnes of capacity [7]. These large plants acquire their feedstock from logging residues to make up for the shortfall in the available sawmill residues [8]. The logging residues are highly heterogeneous in their physical and chemical compositions. Naimi et al. [9] measured the properties of logging residues obtained from the field in the interior region of British Columbia, Canada. The authors showed that even for samples obtained at the same site, the moisture content varied from 20% to 40%, ash content differed from 1% to 5%, bulk density ranged from 174 to 215 kg/m3, and high heating value varied from 18 to 21 MJ/kg. These variabilities in raw material qualities made the handling of the woody materials difficult for bioenergy applications and resulted in inferior-quality products. Fractionating and blending the heterogeneous feedstock to meet the grades as specified in ISO 17225-2 (Table 1) is a challenge and an opportunity to improve the quality [10].
Information on the properties of raw feedstock is critical for the design and operation of cleaning and sorting of the biomass before size reduction and drying. Numerous commercial devices have been developed for cleaning and sorting solid waste material. The wood pellet industry has adopted a number of these devices to lessen the variability among particle sizes and to eliminate contaminants like stones and ferrous objects. These stones and ferrous objects can generate explosion-causing sparks upon impact with hammers in the hammer mill. The finely ground biomass entering the pellet press dies must be free from corrosive objects. Badger [11] suggested the use of scalping rolls or disk screens with vibratory screens to eliminate oversized materials which include bark pieces, rocks, metal, and other foreign objects. The heavier objects drop off the infeed flow in air-density separators. Smaller, lighter contaminants may still find their way into the infeed fiber stream based on the configurations of the density separator [12]. Various forms of magnets are used along the flow to remove ferrous objects frequently found on the logged forest floors. The material is ground in a hammer mill to a smaller size, of around 8 mm, before entering the dryer [13].
Objective
The objective of this research is to characterize the range of physical properties a pellet plant receives. Particle size, density, and non-woody extraneous material (contaminants) content are the obvious physical properties that would guide the selection of the existing mechanical separation devices.
2. Materials
Eight wood pellet plants in British Columbia and one in Alberta supplied 30 batches of infeed woody biomass to the research laboratory at the University of British Columbia during the summer of 2021. The received materials were of six types: shavings, sawdust, hog, bush grind, wood chips, and a blend (Figure 1). The plants provided a brief description of each sample, as follows. Shavings are bark-free, clean, and dry white wood flakes. Sawdust is the leftover after milling, trimming, and routing processes. Hog is a sawmill residue produced from debarking and scalping oversized logs. Bush grind is a logging residue that is chipped in the logging area. Bush grind contains a high fraction of oversized materials, such as pieces of branch wood, bark pieces, and chips. Wood chips are bark-free pulpwood or undersize logs that are chipped at or near a pellet plant. The blend is a mixture of the previously mentioned infeed materials with unknown composition. Three batches of wood pellet samples (one batch from each plant) were also received from three different plants.
The pellet plants were requested to identify the relative proportions of each of the infeed types they regularly process. Table 2 is a summary of the responses from four plants, showing the diversity of materials that each plant receives. Shavings and sawdust make up the largest proportion for plants 1 to 3, together accounting for more than 40% of the infeed material received. Plant 4 receives 58% of its infeed as hog. Bush grind makes up 34% of infeed for plant 3.
Pellet plant operators supplied the flowsheets they follow to process their infeed material. Figure 2 is the process flow for Plant 4. A typical process flow begins by rejecting oversize materials and removing small impurities by using scalping rolls and a vibratory screen. Magnetic rolls and air density separators remove ferrous materials and heavy foreign objects such as metals and rocks. In spite of cleaning the biomass repeatedly using density separators and screens, the output materials still contain sand and stones. Blending of the feedstock takes place either before fractionation or after fractionation. In some cases, blending sawdust and shavings with other woody biomass may take place after drying. Before entering the dryer, the infeed materials are ground on a coarse hammer mill (also called a green hammer mill) to meet the particle size distribution required by the dryer manufacturer. The dried materials are further ground in preparation for pelletization.
3. Methods
For moisture content determination, a sublot of 50 g from replicates of each sample was dried at 105 °C over 12 h in a convection oven. For ash measurement, the oven-dried samples were ground in a lab-scale knife mill (Thomas Scientific, Swedesboro, NJ, USA, Thomas Wiley Mini50 Mill; Model: 3383-L10) to pass through a 4 mm mesh sieve. Two grams of the ground samples were combusted in a muffle furnace (Thermo Scientific, Swedesboro, NJ, USA, Model: Lindberg/Blue M Moldatherm) at 575 °C for 3 h to obtain the ash contents, in accordance with the ISO 18122 test standard [15]. The gross calorific value of dry ground materials was measured using a bomb calorimeter (Parr Instrument, Moline, IL, USA, Model: 6100 Isoperibol). One gram of ground material was combusted in a pure oxygen environment in a bomb vessel to determine the calorific value, in accordance with ISO 18125 [16]. For bulk density determination, all received materials were poured into a cube box (100 mm × 100 mm × 100 mm) until the materials overflowed. The excess materials were removed using a plastic scraper with a straight edge. The mass of materials in the filled container was obtained by weighing on an electronic balance to a precision of 0.1 g. Particle density was measured using the water displacement method, 1 to 3 g of samples being submerged into 100 mL of water for about 10 s, to minimize the water uptake by the pieces. The change in volume of water, and the mass of the samples, were then used to calculate particle density. To determine the size distribution of each sample, a sieve shaker (Retsch, Haan, Germany, Model: AS 200) installed with round sieve sizes of 4 mm, 8 mm, 16 mm, 32 mm, and 48 mm was used. The sieves were arranged from the smallest to the largest size. The shaker subjected the samples to a circulating movement for 5 min at 200 rpm. The mass retained on each sieve was weighed and used to determine the percentage fraction of each size. All quality measurements were performed in three replicates for each sample.
The amount of bark was determined by visually inspecting the as-received samples. Large brown pieces were considered bark pieces and were separated manually from the sample. Figure 3 shows the different materials and bark pieces (marked as Hog in Figure 3) that were separated from the hog. The bark content is calculated as the percentage of the mass of the bark over the mass of the sample.
ISO 19743 [17] specifies a method for the determination of the content of heavy extraneous materials larger than 3.15 mm by using sink-and-float separation combined with elutriation. The test biomass was transferred into the water container. The container was filled with water up to the brim. The solids and water were stirred manually for at least 30 s to wet all materials, and then the solids were allowed to rest for approximately 5 s to let the heavy material sink. The floating solids were removed by hand. The remaining solids in the water were emptied onto a 3.15 mm round sieve. The biomass particles on the sieves were removed, leaving only heavy extraneous materials. The content of the heavy extraneous materials was calculated by dividing the dry weight of the obtained heavy materials by the dry weight of the original sample and was thus expressed as a percentage on a dry mass basis.
The smoking temperature for the biomass was measured using the thermogravimetric technique. The temperature was first ramped from 25 to 105 °C at a heating rate of 10 °C/min. Then the temperature was kept at 105 °C for 10 min, and finally, it was ramped from 105 to 300 °C at a heating rate of 5 °C/min. We plotted mass loss rate versus treatment temperature. For the sake of consistency, the temperature at which the mass loss rate reached 0.01%/°C was noted as the smoking temperature [18].
Statistical Analysis
One-way ANOVA analyses and multiple comparisons using t-tests were performed on the measured values of moisture content, ash content, bulk density, particle density, gross calorific value, and smoking temperature using the Microsoft Excel data analysis package.
4. Results
Table 3 lists the mean and standard deviation of measurements for 30 samples (except smoking temperature n = 20 and particle density n = 10) for each sample type. The moisture contents of the sawdust and hog were the highest, being 44% wb (wet mass basis) and 50% wb, respectively, and having no difference statistically. Shavings were the least moist (11%) among the samples. The variability in moisture content within the individual types of infeed material ranged from 14 to 52%. The statistically similar mean moisture contents of chips, bush grind, and infeed mix ranged from 27% to 39% wb. Some of the kiln-dried wood chips from a partnering sawmill had a moisture content lower than 20%.
Hog had the largest mean ash content, at 2.8%, and was statistically different from all other infeed materials (Table 3). Hog had a high bark content of 25 to 55%, while sawdust had a relatively lower bark content of 5 to 15% (Table 4). Ash content in clean stem wood was lower, at 0.2–1.0%, than its bark content (2–5%). According to Nosek, Holubcik, and Jandacka [19], the bark content partly determined the ash content of the materials. It is plausible to assume that pieces of rock and soil were lifted from the earth during loading operations.
Bulk density varied from 73 kg/m3 for shavings to 279 kg/m3 for wood chips (Table 3). The large variability in bulk density can result in challenges in feeding a calculated mass ratio of a blend to meet the constituents of pellets. Sawdust, bush grind, and infeed mix had statistically similar bulk densities. The mean gross calorific value (GCV) in the dry basis of the six types of infeed was around 20.1 MJ/kg (dry). Hog’s calorific value was statistically higher, at 20.6 MJ/kg (dry), than any other feedstock. The onset of smoking temperature was lower than the ignition temperatures for woody materials, measured using ASTM E2021-06 (2010) at 285–315 °C [20]. The lowest smoking temperature was 158 °C for hog. Smoking temperatures of sawdust, shavings, chips, bush grind, and infeed mix were not statistically different.
Particle density ranged from 359 kg/m3 for infeed mix to 513 kg/m3 for sawdust. Wood chips, hog, and bush grind had statistically the same particle densities. This result indicates that it may not be possible to separate these three types of woody infeed via air density separators, since their densities were essentially the same.
4.1. Particle Size before and after Hammer Milling
Based on information from the dryer manufacturers STELA Laxhuber GmbH (Laxhuberplatz 1, D-84323 Massing, Germany) and PRODESA Group (Edificio Plaza Center, 20, 3ª Planta, 50197 Zaragoza, Spain), the average allowable particle size in belt dryers is 8 to 10 mm. The minimum and maximum allowable sizes are 0.5 mm and 50 mm, respectively. Particles having sizes less than 0.5 mm are undesirable because they easily entrain in the drying air and tend to fall through the dryer belt perforations. The maximum size limit of 50 mm is set to prevent blocking the dryer screw conveyor and causing uneven drying, since larger particles may not dry completely [21]. Figure 4 shows the particle size distribution in mass percentages of the six types of infeed. In total, 80% of the infeed mix particles were smaller than 16 mm. Shavings had 47% of particles smaller than 16 mm. A total of 74% of bush grind and 65% of wood chips were larger than 16 mm.
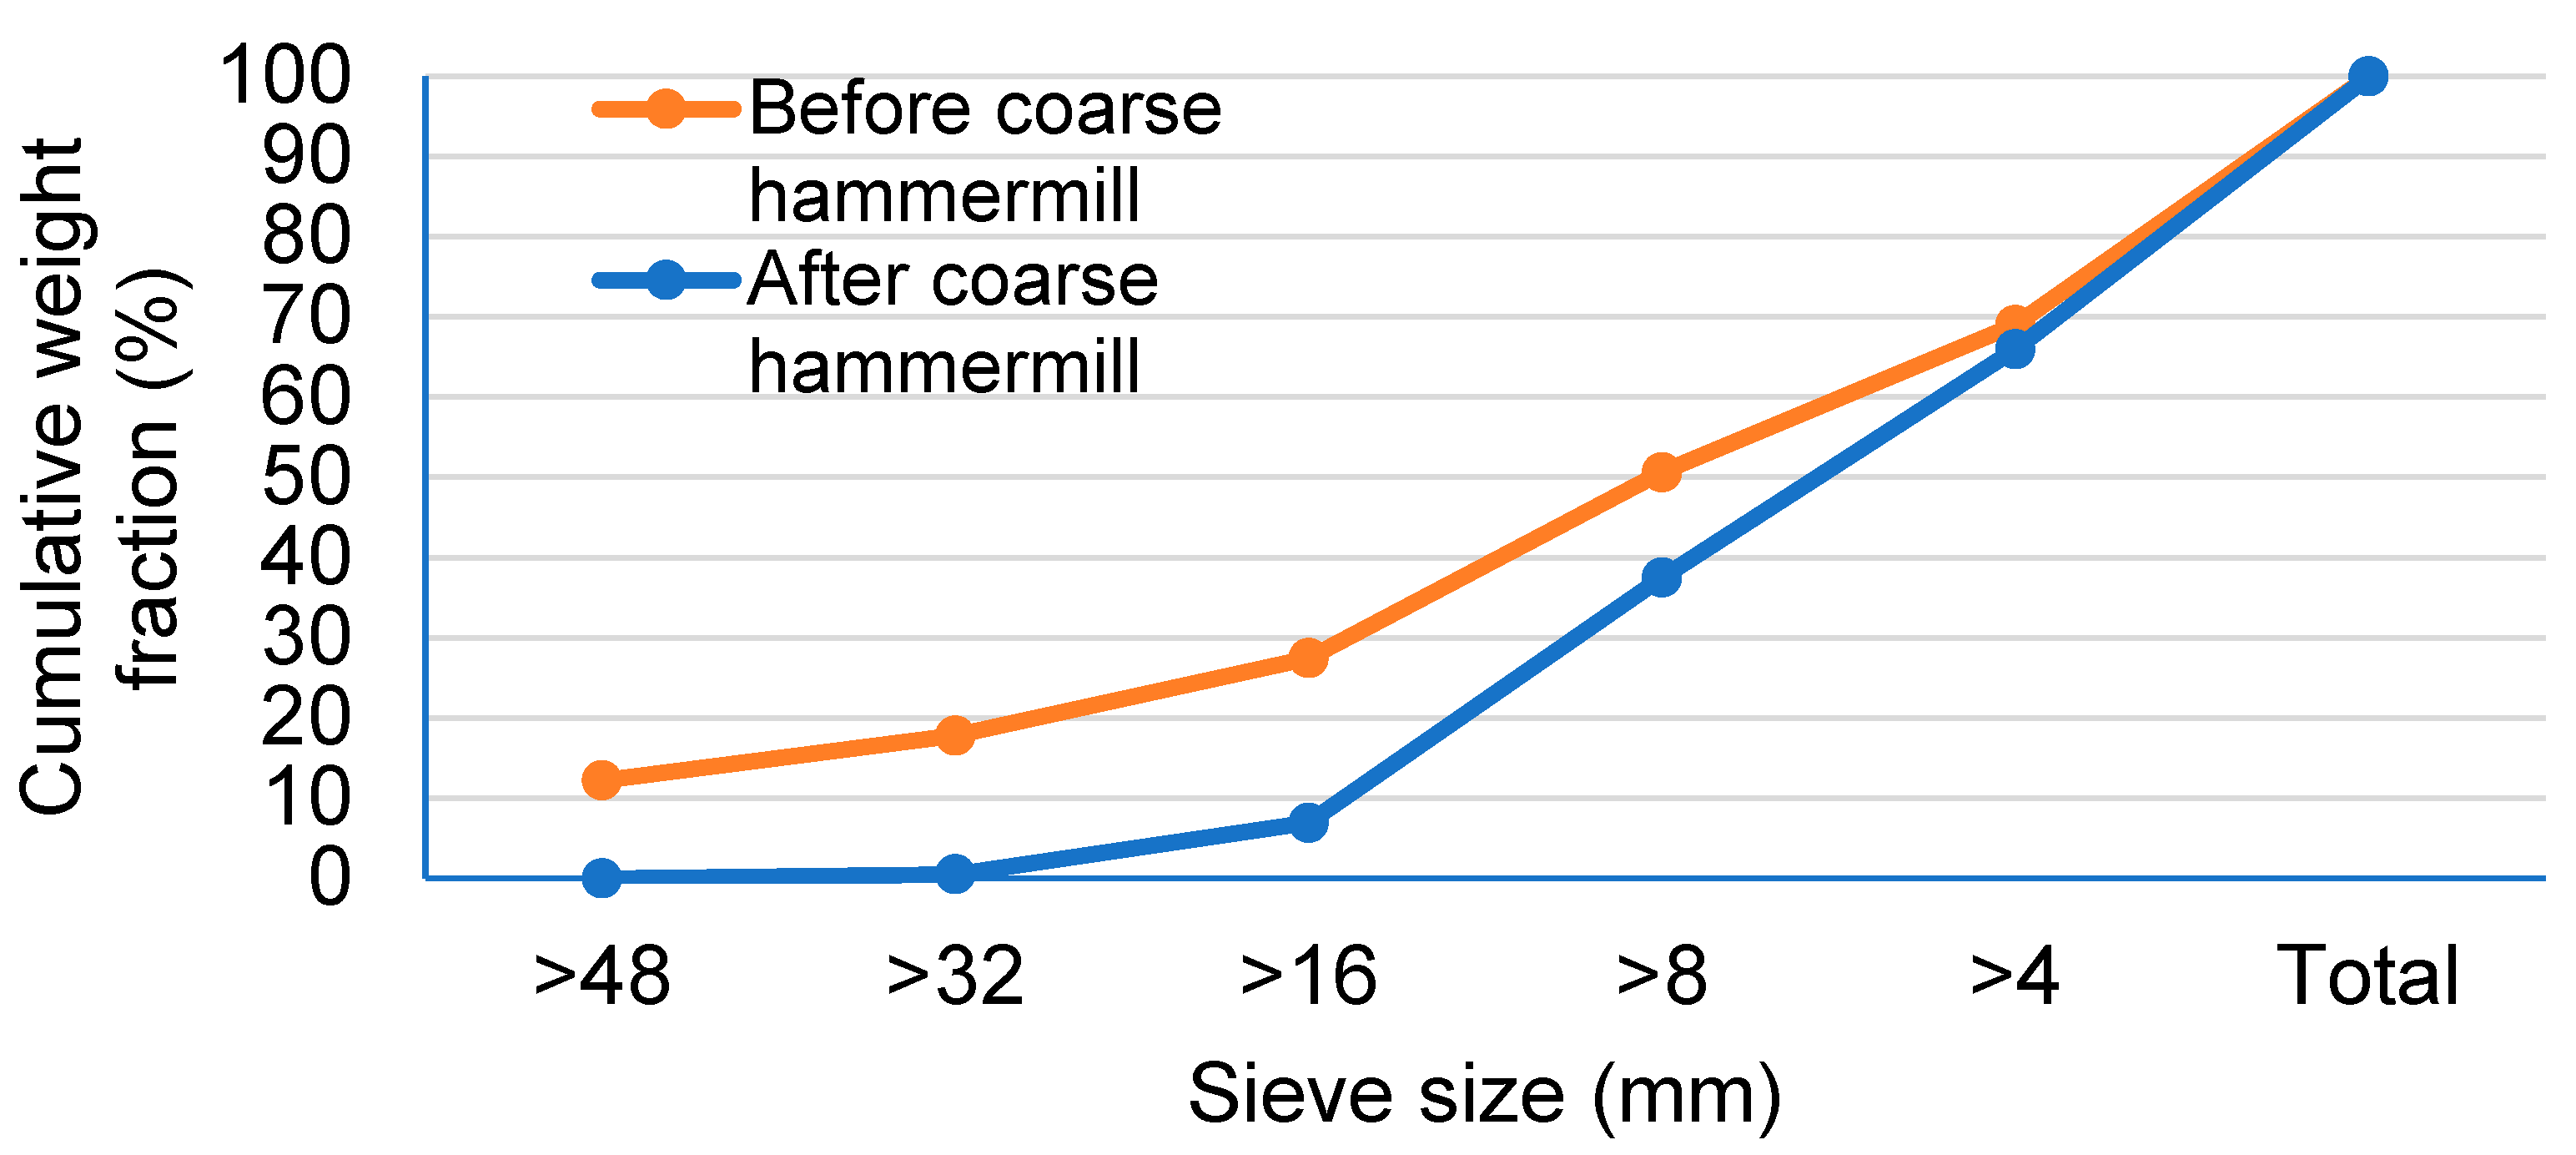
Figure 5 shows the mass percentage of six size fractions of infeed biomass before hammer milling and the size fractions of the infeed mix after hammer milling. The percentages of 16 to 32 mm and 32–48 mm size fractions were reduced by at least half due to the hammer milling. The fractions smaller than 16 mm increased from 72% to 92%.
4.2. Impurities and Bark in Feedstock
The sample submitted to the lab did not contain non-woody material other than a small amount of dirt or small storage. Table 4 lists the bark contents of the samples separated manually from the infeed material. The hog fraction had the most bark, followed by the bush grind and sawdust. The shavings did not contain bark.
The hog had a high percentage of extraneous material of up to 8%. The EM contents of sawdust, bush grind, and infeed mix were 1% or less, indicating that they were nearly free from soil and stone particles. Not all extraneous materials among biomass particles were detectable with the naked eye. Small particles which are denser than wood tend to accumulate in smaller size fractions after sieving. Stones in a size fraction smaller than 3.15 mm were identified in the microscopic image of hog, marked with a circle in Figure 6. Since the ISO 19743 standard is limited to size fractions larger than 3.15 mm, these extraneous materials cannot be detected using the method specified by the test standard [17].
5. Discussion
The current fractionation method is based on the size and density of feedstock particles and the use of magnets to remove ferrous materials. To the knowledge of the authors, no other means of fractionation, like automated visual inspection or spectral analysis, for fractionation of material for ash and moisture content are employed at present. The ash in biomass comes from two sources: (a) biogenic ash, that is, the minerals that are a natural part of the plant cellular structure; and (b) minerals that come from external sources like soil particles that are picked up during harvest and handling [22]. According to Werkelin et al. [23], the variations in ash-forming matter between the different constituents of a tree (stem, bark, branches, shoots, and foliage) were large. The ash content in the wood tissues (0.2–0.7%) was low compared to the ash content in the bark tissues (1.9–6.4%) and in the foliage (2.4–7.7%). Lindström et al. [24] determined that the biogenic constituents of ash from woody biomass were Si, Ca, Mg, K, and P but that these also came from sand and soil contamination. The authors added sand particles (around 0.2 mm) to feedstock being used to make pellets. They found that the simulated contamination of between 2 and 4% sand, by mass basis, in the sample increased the formation of slag in the wood pellet combustion chamber. As shown in Table 3, samples having higher bark content were observed to also contain higher content of extraneous materials. These extraneous materials, in the form of sand and stone particles, are a nuisance in the thermal applications of wood pellets.
Table 5 lists the averages of hog content and the five quality parameters of pellets produced at three plants—Plant 1, Plant 2, and Plant 4, as indicated in Table 2. The listed properties met the minimum or maximum values of the international quality standard listed in Table 1. Pellets of similar properties and species may be blended before they are shipped to consumers. The average ash content of the three plants was 1%, indicating that pellets could be classified within grade I2. Compared to Table 3, the ash content of the pellets was nearly the same as that of sawdust. This low ash content implied that high-ash extraneous materials were removed during the mechanical fractionation. In Plant 4, where the infeed materials contained a high percentage of hog, the pellets’ ash content was 1.9%, which was higher than the other two plants. Hog could consist of as much as 55% bark, which has higher ash content than stem wood. With the increase in hog content, the bulk density increased slightly from 633 kg/m3 to 655 kg/m3, while the smoking temperature decreased slightly from 167 °C to 162 °C. Compared to wood pellets reported by other researchers [25], the pellets tested in this research had higher gross calorific values of roughly 20 MJ/kg in dry basis.
As a result of our study, the removal of infeed contaminants is recommended to ensure clean feedstock enters a belt dryer [13]. The belt dryer manufacturers have assumed that the infeed fiber flows into a dryer free of contaminants. Therefore, the fire risk evaluations and the internal safety controls are based on this unrealistic assumption. As pellet plants diversify their infeed fiber sourcing to encompass wider and more varied sources, the content of extraneous contaminants rises. As a result, more low-quality, highly contaminated feedstock such as bush grind and hog fiber are added to the infeed mix. Some pellet plants’ existing infeed systems cannot cope with processing the full range of infeed types—from clean shavings to contaminated hog. They may fail to remove a significant portion of contaminants from the infeed, which results in pellets having inferior qualities, limiting their commercial values. The application of innovative instrumentation and control systems is recommended to minimize contaminants in the feedstock.
6. Conclusions
The reported research quantifies the range of feedstock material types and characteristics that arrived at the gate of several wood pellet plants surveyed in BC and Alberta. The key findings and recommendations are as follows:
- Almost half of the feedstock types were non-sawdust, such as hog, chipped wood, and bush grind. The highly variable biomass arriving at the gate of the pant needed to be sorted out.
- The presence of small sand and stone particles was associated with bark content. The hog fraction had the highest ash content because of its high bark and extraneous material content.
- The application of ISO Standard 19743 to estimate the extraneous material (material other than biomass) content failed to account for small sand particles that may remain in the bark. Modification of this standard may be required.
- The current fractionation of feedstock is based on size and density detected using mechanical devices. To the knowledge of the authors, advanced instrumental techniques such as spectral analysis and automated vision are not employed and therefore should be developed.
Author Contributions
Conceptualization, H.R.; Methodology, J.S.L. and O.G.B.; Formal analysis, J.S.L.; Investigation, J.S.L. and O.G.B.; Resources, H.R. and F.Y.P.; Data curation, J.S.L.; Writing—original draft, J.S.L.; Writing—review & editing, S.S.; Visualization, J.S.L.; Supervision, S.S.; Project administration, H.R. and F.Y.P.; Funding acquisition, F.Y.P. and S.S. All authors have read and agreed to the published version of the manuscript.
Funding
This research was funded by Mitacs Accelerate program with grant number IT28210 together with the Wood Pellet Association of Canada. The APC was funded by the same organizations.
Data Availability Statement
Data are contained within the article.
Acknowledgments
We are grateful to Pinnacle Renewable Energy (currently Drax Group Canada), Pacific Bioenergy, Canfor Energy, and Premium Pellet for providing us with samples.
Conflicts of Interest
The authors declare no conflict of interest.
References
- Ibrahim, H.; Farag, M.; Megahed, H.; Mehanny, S. Characteristics of Starch-Based Biodegradable Composites Reinforced with Date Palm and Flax Fibers. Carbohydr. Polym. 2014, 101, 11–19. [Google Scholar] [CrossRef] [PubMed]
- Strauss, W. Wood Pellet Markets Outlook: A Look at the Pellet Export Markets in 2022 and Beyond. Canadian Biomass Magazine, 2022. [Google Scholar]
- ISO 17225-2; Solid Biofuels—Fuel Specifications and Classes Part 2: Graded Wood Pellets. International Organization for Standardization: Geneva, Switzerland, 2021.
- ST 1001:2022; Wood Pellets—Requirements for Companies, 1st ed.; Bioenergy Europe/DEPI ENplus®. Bioenergy Europe: Brussels, Belgium, 2022.
- Watters, A.; Hayes, P. Wood Pellets for Heat and Power; United States Department of Agriculture: Ottawa, ON, Canada, 2021; pp. 1–7.
- Spelter, H.; Toth, D. North America’s Wood Pellet Sector; U. S. Department of Agriculture, Forest Service, Forest Products Laboratory: Madison, WI, USA, 2009; pp. 1–21.
- Visser, L.; Hoefnagels, R.; Junginger, M. Wood Pellet Supply Chain Costs—A Review and Cost Optimization Analysis. Renew. Sustain. Energy Rev. 2020, 118, 109506. [Google Scholar] [CrossRef]
- Bull, G.; Bennett, B.; Thrower, J.; Williams, J. Wood Pellets in BC—Wood Biomass Used in the Industry. 2022. Available online: https://pellet.org/resources/wpac-fibre-study-british-columbia-pellets-are-responsibly-sourced/ (accessed on 22 December 2023).
- Naimi, L.; Oveisi, E.; Sokhansanj, S.; Sowlati, T.; Lau, A.; Bi, X.; Jim Lim, C.; Melin1, S.; Igathinathane, C.; Skea, D.; et al. The Performance (Quality) of Size Reduction of Woody Biomass; ASABE: St. Joseph, MI, USA, 2009. [Google Scholar]
- Adam, R.; Pollex, A.; Zeng, T.; Kirsten, C.; Röver, L.; Berger, F.; Lenz, V.; Werner, H. Systematic Homogenization of Heterogenous Biomass Batches—Industrial-Scale Production of Solid Biofuels in Two Case Studies. Biomass Bioenergy 2023, 173, 106808. [Google Scholar] [CrossRef]
- Badger, P.C. Processing Cost Analysis for Biomass Feedstocks ORNL/TM-2002/199; Oak Ridge National Laboratory: Oak Ridge, TN, USA, 2002; pp. 1–52.
- Tchobanoglous, G.; Kreith, F. (Eds.) Handbook of Solid Waste Management, 2nd ed.; McGraw-Hill Education: New York, NY, USA, 2002; ISBN 978-0-07-135623-7. [Google Scholar]
- Wood Pellet Association Canada. Safer Operation of Direct Heated Belt Dryers; Final Report; Wood Pellet Association Canada: New York, NY, USA, 2022. [Google Scholar]
- Lee, J.S.; Rezaei, H.; Gholami Banadkoki, O.; Yazdan Panah, F.; Sokansanj, S. Quality Infeed: Characterization and Pre-Treatment of Residues for Making Wood Pellets. Canadian Biomass Magazine, 2023. [Google Scholar]
- ISO 18122; Solid Biofuels—Determination of Ash Content. International Organization for Standardization: Geneva, Switzerland, 2012.
- ISO 18125; Solid Biofuels—Determination of Calorific Value. International Organization for Standardization: Geneva, Switzerland, 2017.
- ISO FDIS 19743; Solid Biofuels—Determination of Content of Heavy Extraneous Materials Larger than 3.15 Mm. International Standards Organization: Geneva, Switzerland, 2016.
- Rezaei, H.; Lim, J.; Sokhansanj, S. Comparison of Drying Rates of Ground Western Red Cedar with Hemlock, Birch, Aspen, and Spruce/Pine/Douglas Fir. Appl. Eng. Agric. 2020, 36, 159–165. [Google Scholar] [CrossRef]
- Nosek, R.; Holubcik, M.; Jandacka, J. The Impact of Bark Content of Wood Biomass on Biofuel Properties. BioResources 2016, 11, 44–53. [Google Scholar] [CrossRef]
- Dhiman, J.; Shrestha, A.; Fasina, O.; Adhikari, S.; Via, B.; Gallagher, T. Physical, Ignition, and Volatilization Properties of Biomass Feedstock Dusts. Trans. ASABE 2015, 58, 1425–1437. [Google Scholar] [CrossRef]
- Alamia, A.; Ström, H.; Thunman, H. Design of an Integrated Dryer and Conveyor Belt for Woody Biofuels. Biomass Bioenergy 2015, 77, 92–109. [Google Scholar] [CrossRef]
- Peng, Y.; Lau, A.K. Improving the Quality of Crop Residues by the Reduction of Ash Content and Inorganic Constituents. J. Biobased Mater. Bioenergy 2020, 14, 209–219. [Google Scholar] [CrossRef]
- Werkelin, J.; Skrifvars, B.-J.; Hupa, M. Ash-Forming Elements in Four Scandinavian Wood Species. Part 1: Summer Harvest. Biomass Bioenergy 2005, 29, 451–466. [Google Scholar] [CrossRef]
- Lindström, E.; Öhman, M.; Backman, R.; Boström, D. Influence of Sand Contamination on Slag Formation during Combustion of Wood Derived Fuels. Energy Fuels 2008, 22, 2216–2220. [Google Scholar] [CrossRef]
- Moya, R.; Rodríguez-Zúñiga, A.; Tenorio, C.; Valdez, J.; Valaert, J. Pellets Evaluation Made from Tropical-Climate Agricultural and Forestry Crops of Costa Rica with a Domestic Stove. Waste Biomass Valorization 2015, 6, 1037–1046. [Google Scholar] [CrossRef]
Figure 1.
Images of the six groups of infeed materials tested in this paper. This image was previously published in Canadian Biomass Magazine [14].
Figure 1.
Images of the six groups of infeed materials tested in this paper. This image was previously published in Canadian Biomass Magazine [14].

Figure 2.
Process flow of infeed biomass in Plant 4 (Table 2). This diagram was previously published in Canadian Biomass Magazine [14].
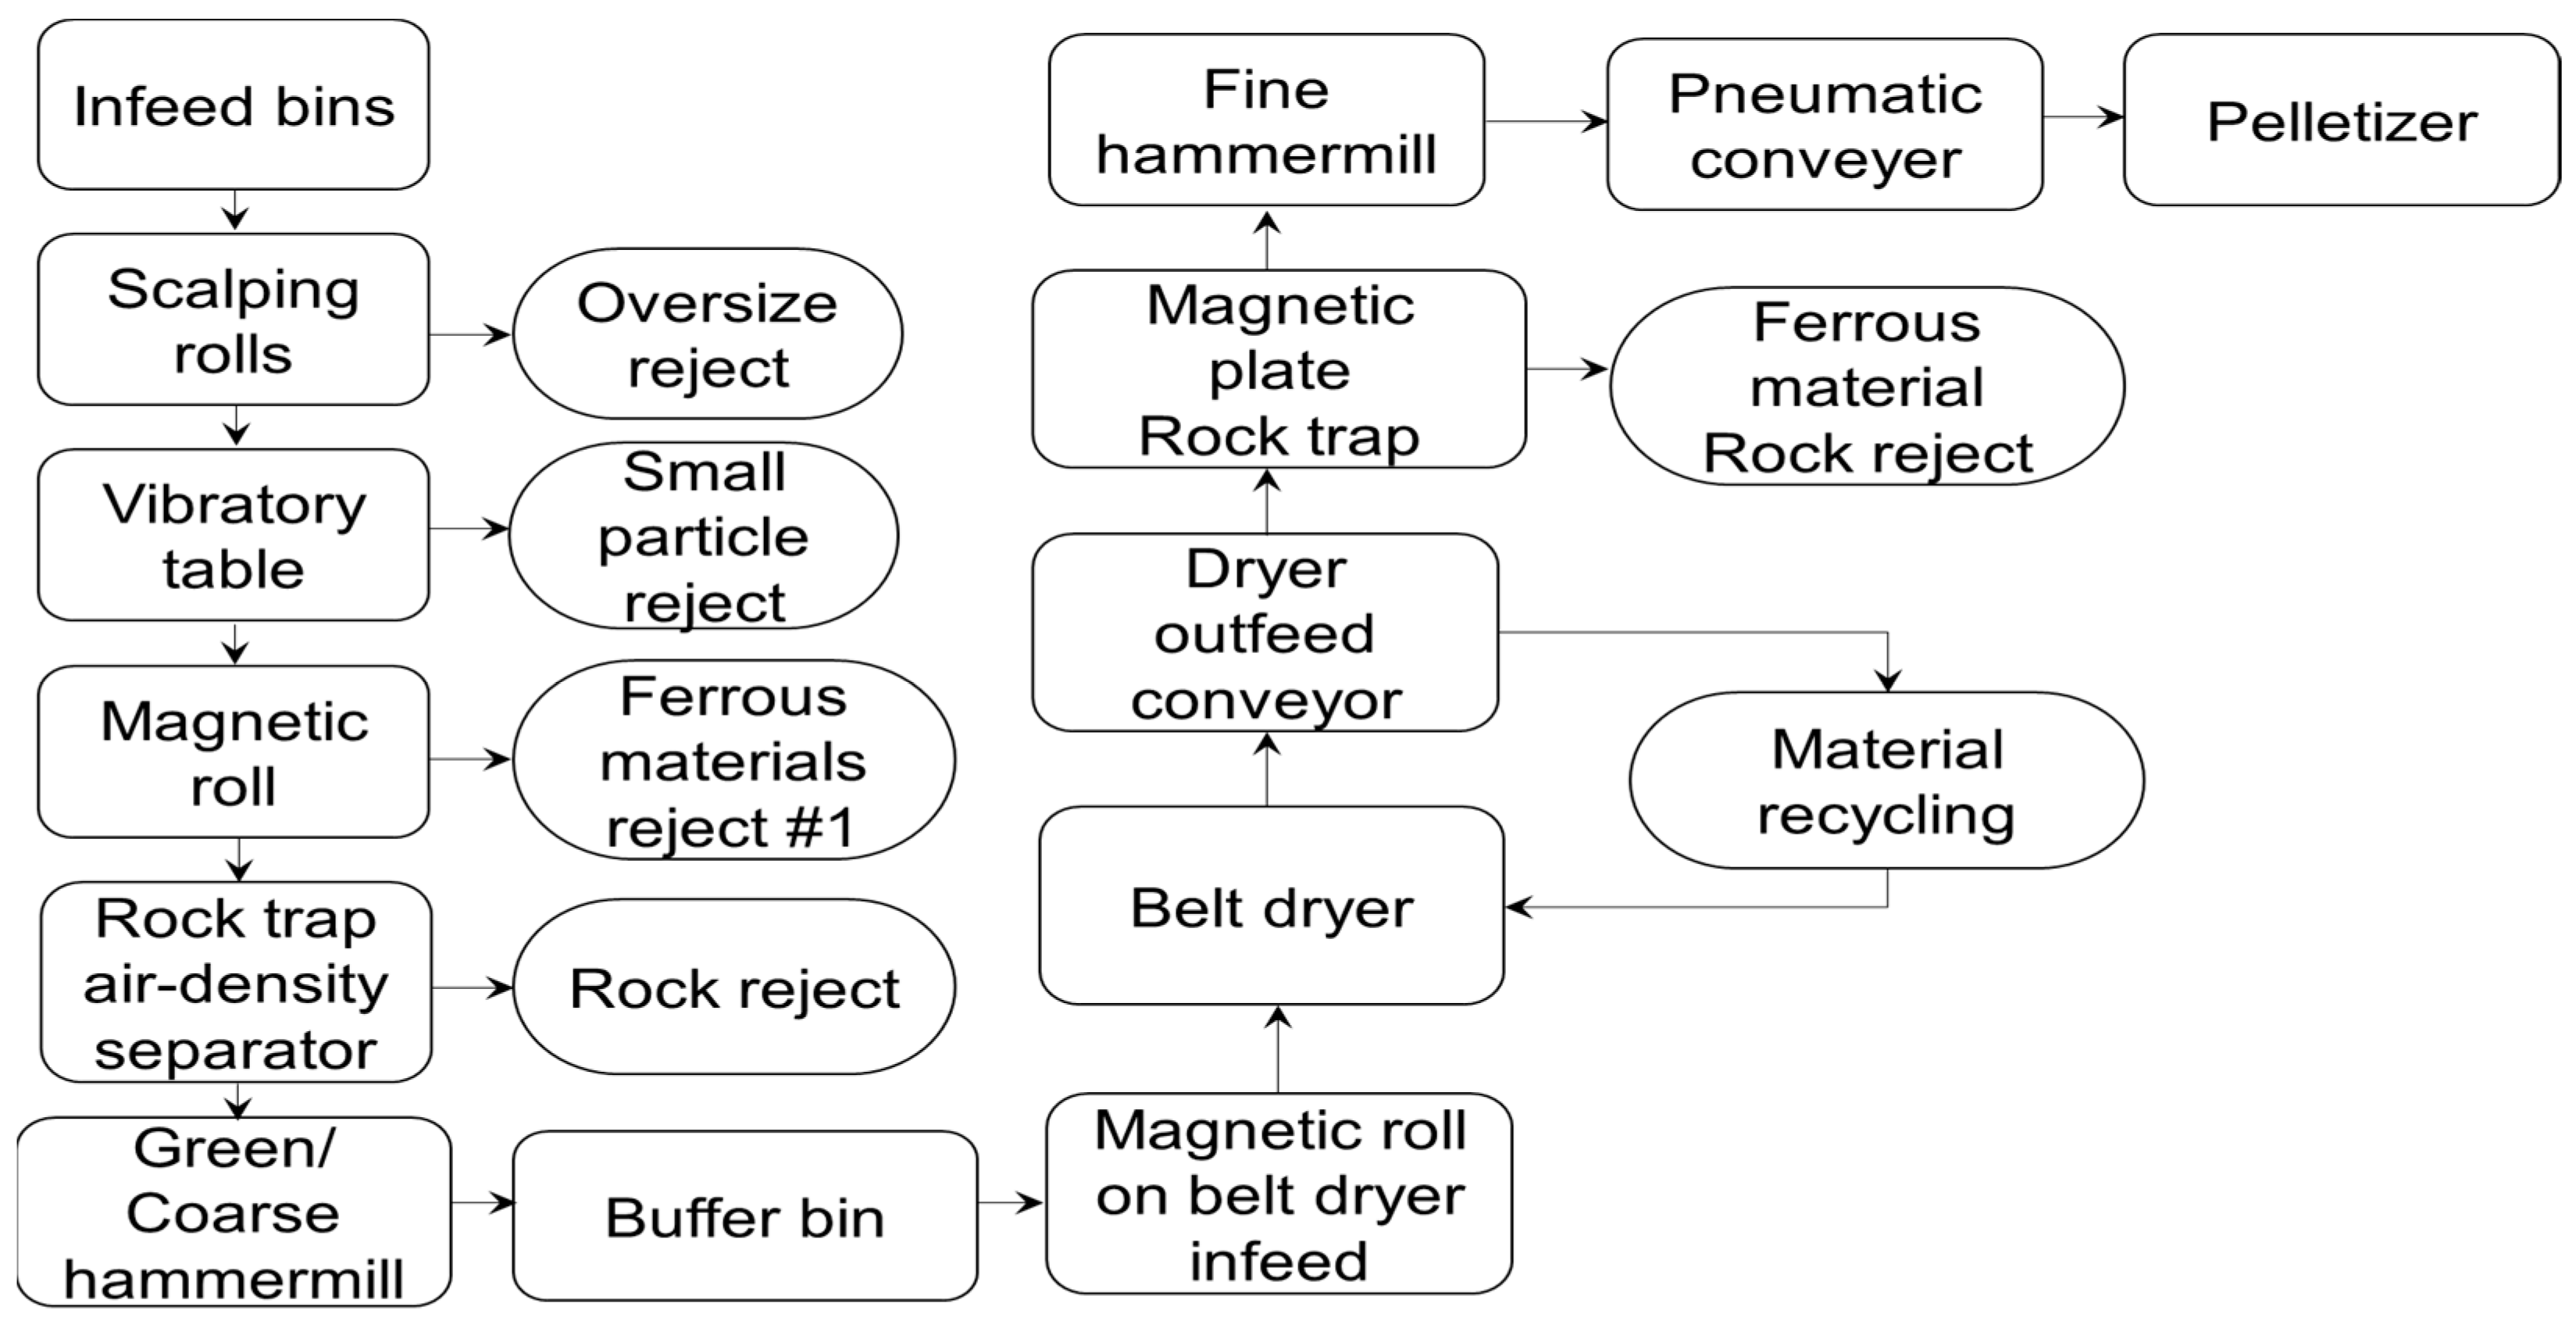
Figure 3.
Images of the six groups of infeed materials taken at a close distance. The bark pieces had a distinct brown color.
Figure 3.
Images of the six groups of infeed materials taken at a close distance. The bark pieces had a distinct brown color.
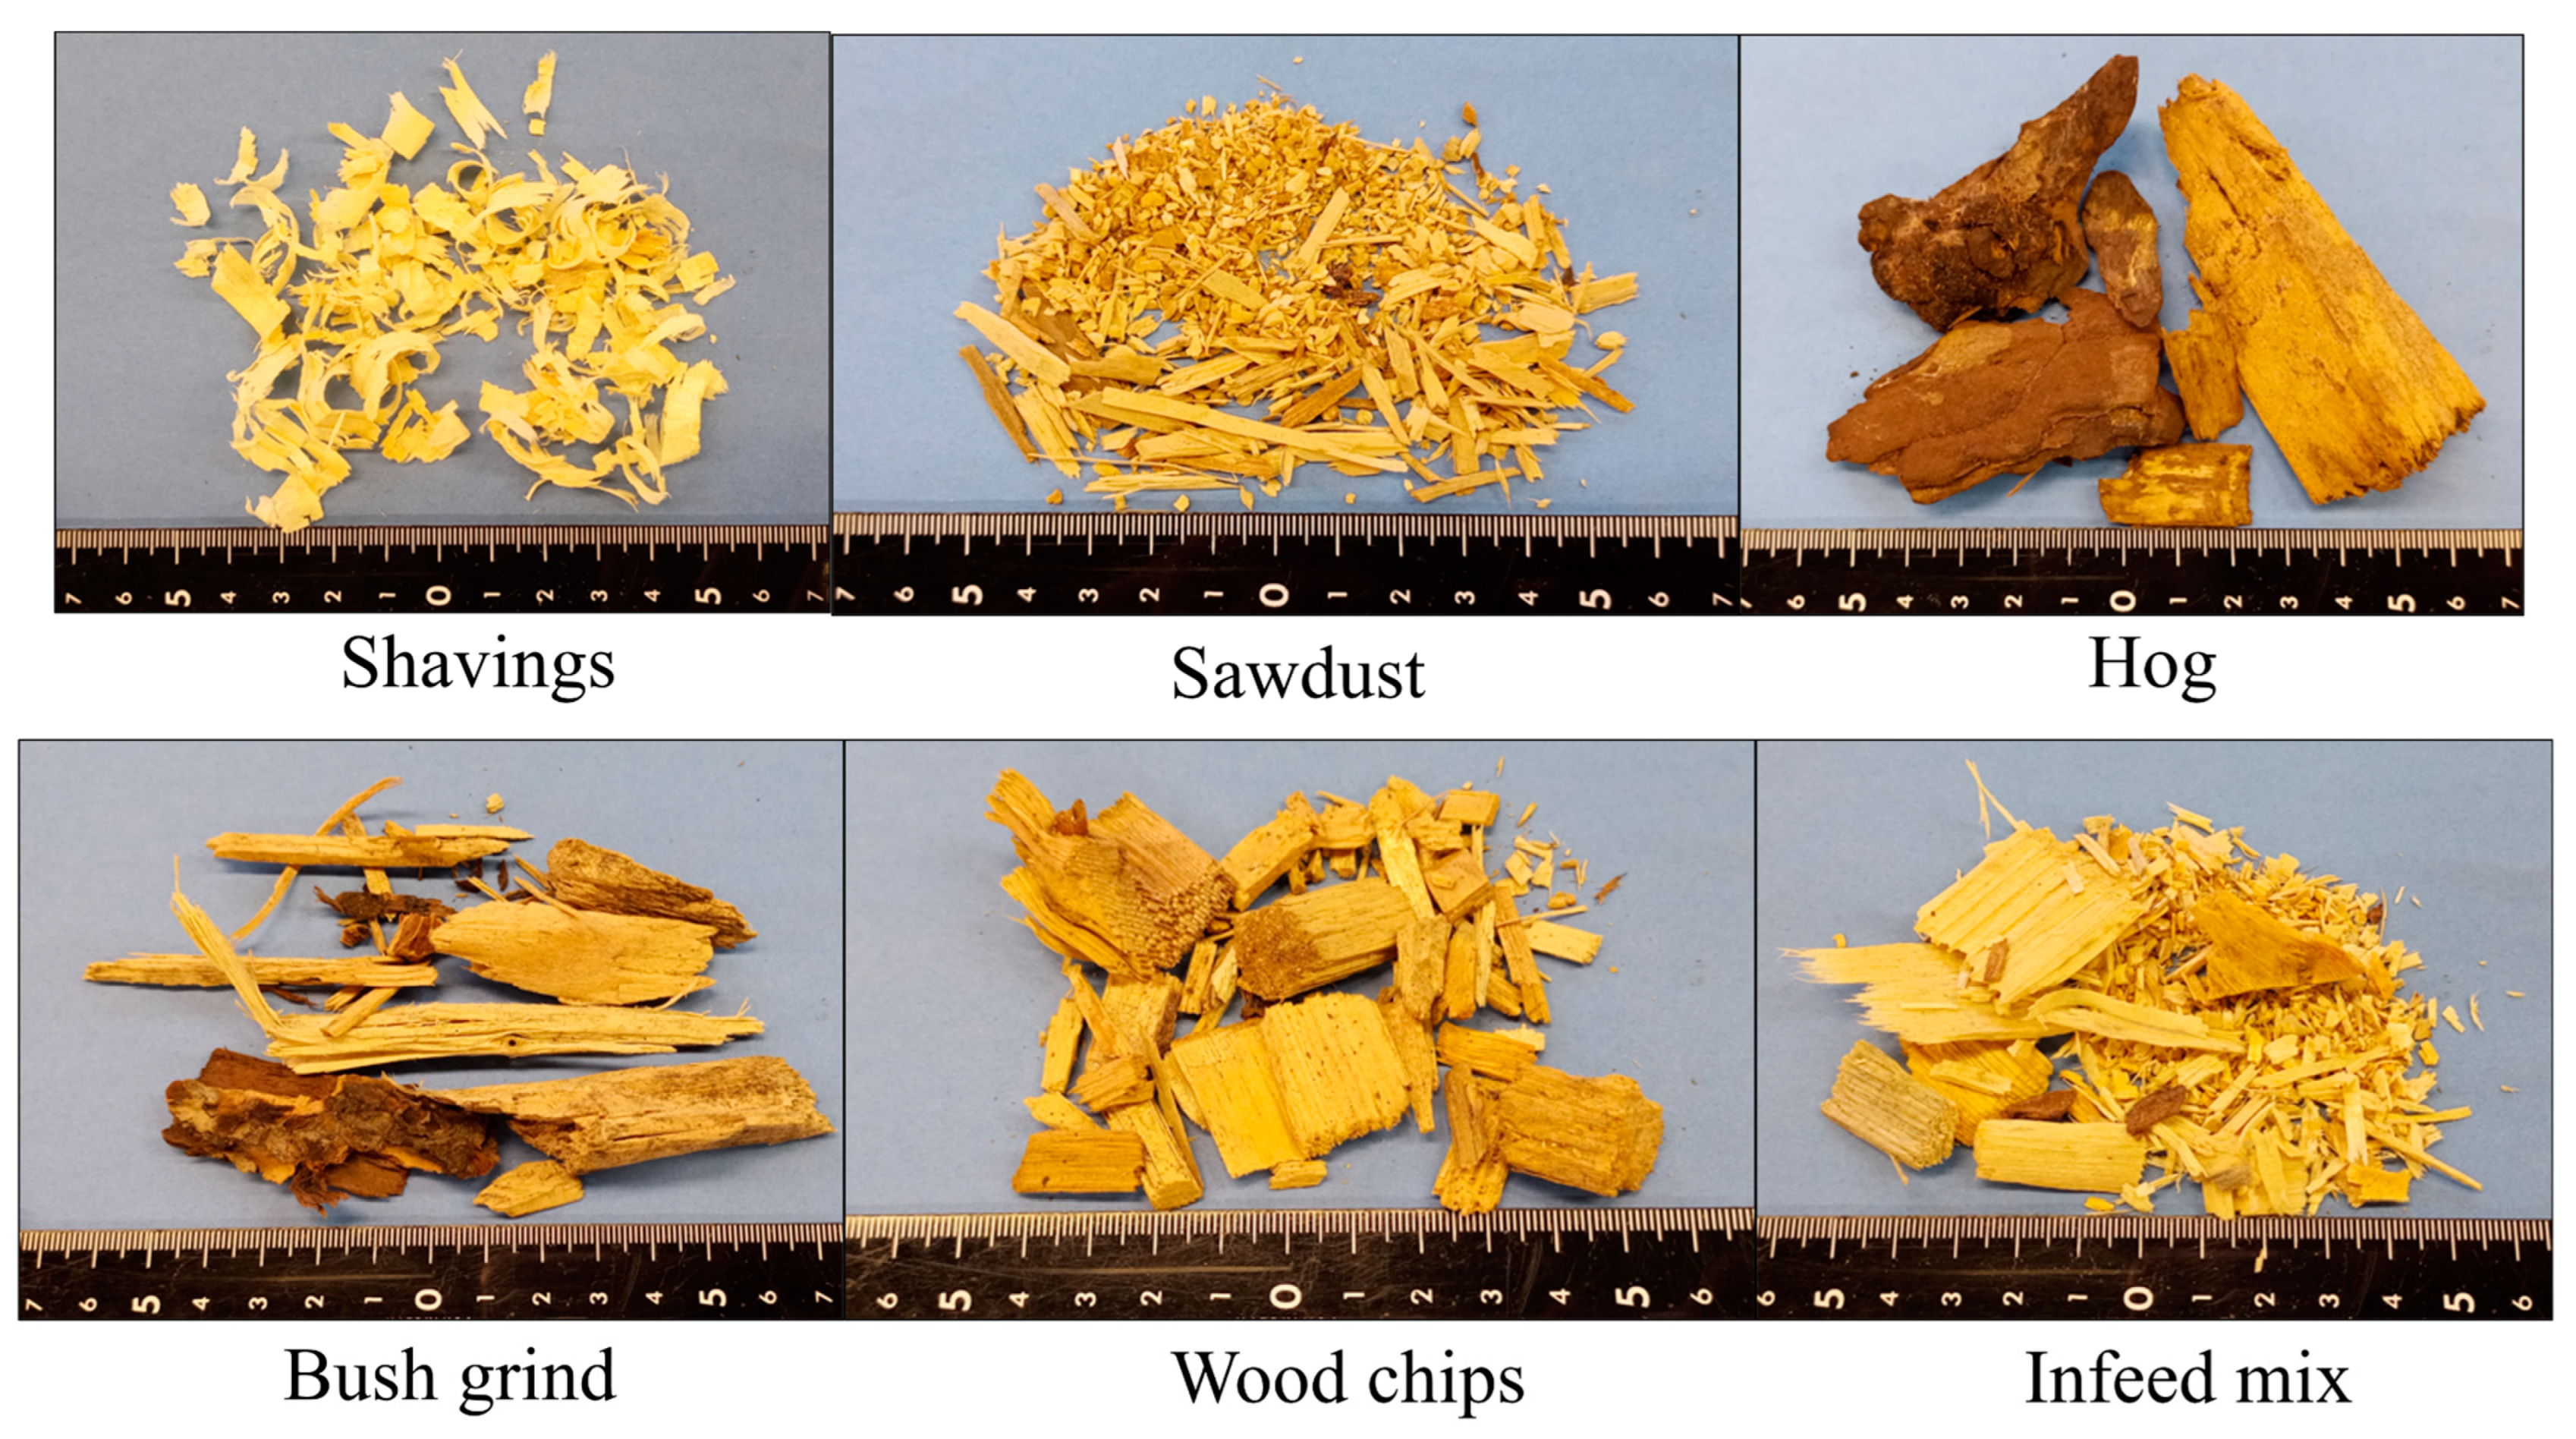
Figure 4.
Particle size distribution of the six types of infeed prior to hammer milling. This figure was previously published in Canadian Biomass Magazine [14].
Figure 4.
Particle size distribution of the six types of infeed prior to hammer milling. This figure was previously published in Canadian Biomass Magazine [14].
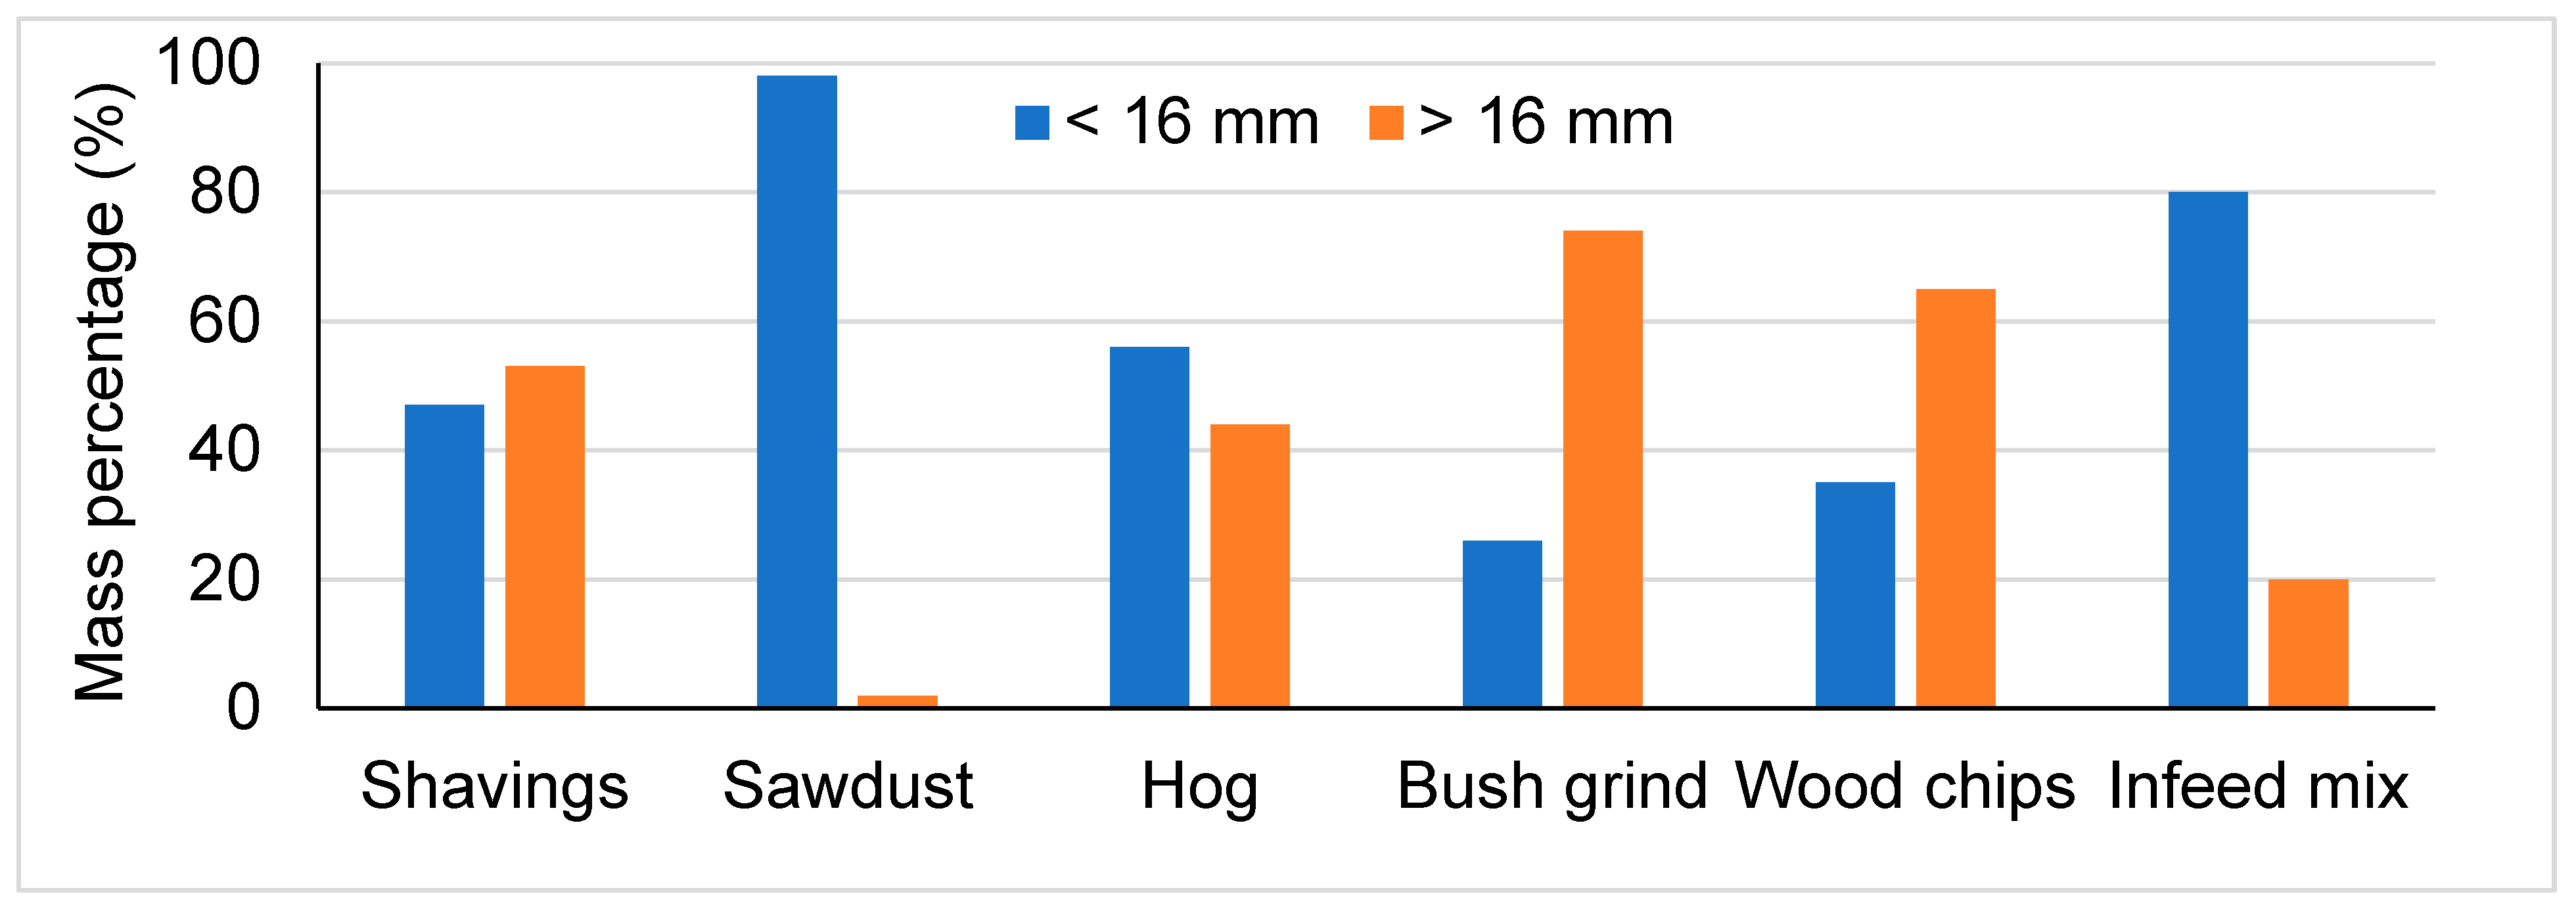
Figure 5.
Cumulative mass fraction distribution of a sample of particles before and after passing through the coarse hammer mill.
Figure 5.
Cumulative mass fraction distribution of a sample of particles before and after passing through the coarse hammer mill.

Figure 6.
Image of sawdust particles smaller than 3.15 mm. Red arrows are drawn to point out the small stone and bark particles that were detected under the microscope. The white background is blank white.
Figure 6.
Image of sawdust particles smaller than 3.15 mm. Red arrows are drawn to point out the small stone and bark particles that were detected under the microscope. The white background is blank white.


Table 1.
Physical properties of pellets specified for industrial applications, extracted from ISO 17225-2.
Table 1.
Physical properties of pellets specified for industrial applications, extracted from ISO 17225-2.
| Property | Unit | I1 | I2 | I3 |
|---|---|---|---|---|
| Diameter, D | mm | 6 ± 1 | 6 ± 1 | 6 ± 1 |
| Length, L | mm | 3.15 < L ≤ 40 | 3.15 < L ≤ 40 | 3.15 < L ≤ 40 |
| Moisture, M | % wb | M ≤ 10 | M ≤ 10 | M ≤ 10 |
| Ash, A | % db | A ≤ 1.0 | A ≤ 1.5 | A ≤ 3.0 |
| Mechanical durability, DU | % | 97.5 ≤ DU ≤ 99.0 | 97.0 ≤ DU ≤ 99.0 | 96.5 ≤ DU ≤ 99.0 |
| Fines, F | % | F ≤ 4.0 | F ≤ 5.0 | F ≤ 6.0 |
| Gross calorific value, Q | MJ/kg | Q ≥ 18 | Q ≥ 18 | Q ≥ 18 |
| Bulk density, BD | kg/m3 | BD ≥ 600 | BD ≥ 600 | BD ≥ 600 |
Table 2.
Infeed composition as a percentage of total mass from four wood pellet plants in BC.
| Type | Plant 1 | Plant 2 | Plant 3 | Plant 4 |
|---|---|---|---|---|
| Shavings | 30 | 23 | 35 | 5 |
| Sawdust | 46 | 19 | 20 | 7 |
| Hog | 3 | 0 | 9 | 58 |
| Bush grind | 11 | 2 | 34 | 0 |
| Wood chips | 0 | 37 | 0 | 0 |
| Unknown blend | 10 | 20 | 2 | 30 |
Table 3.
Mean moisture, ash, bulk density, particle density, gross calorific values (determined at oven-dried states), and onset smoking temperature of the received and analyzed samples. n is the number of samples for all types of tested samples. Values in brackets are standard deviations. The superscripts a, b, c, and d signify statistical differences in values at α = 0.05. For example, values labelled with a are statistically different than values labelled with b. This table was previously published in Canadian Biomass Magazine [14].
| Type | m.c. (% wb) 1 | Ash (% db) 2 | Bulk Density (kg/m3) | Particle Density (kg/m3) | Gross Calorific Value MJ/kg (Dry) | Smoking Temperature (°C) 3 |
|---|---|---|---|---|---|---|
| n = 30 | n = 30 | n = 30 | n = 10 | n = 30 | n = 20 | |
| Sawdust | 44 a (6) | 1.0 a (0.7) | 232 a (53) | 513 a (24) | 20.2 a (0.8) | 164 a (9) |
| Shavings | 11 b (3) | 0.4 ab (0.2) | 73 b (29) | 489 b (21) | 20.0 a (0.5) | 162 a (6) |
| Chips | 27 c (14) | 0.4 b (0.1) | 279 c (74) | 453 c (84) | 20.1 a (0.5) | 162 ab (7) |
| Hog | 50 a (9) | 2.8 c (1.4) | 270 c (76) | 445 c (91) | 20.6 b (1.0) | 158 b (6) |
| Bush grind | 32 c (11) | 1.7 a (1.0) | 209 a (62) | 471 c (53) | 20.3 a (0.3) | 172 ab (6) |
| Infeed mix | 39 c (14) | 1.2 a (0.7) | 231 c (70) | 359 d (66) | 20.2 a (0.5) | 167 ab (4) |
1 wet mass basis. 2 dry mass basis. 3 Smoking temperature is the minimum temperature at which feedstock particles start to devolatilize and generate visible smoke.
Table 4.
The percentage of heavy and larger than > 3.15 mm extraneous materials (%EM) in the infeed material and bark content.
Table 4.
The percentage of heavy and larger than > 3.15 mm extraneous materials (%EM) in the infeed material and bark content.
| Infeed Type | %EM (db) | Bark Content (% wt) |
|---|---|---|
| Sawdust | 0.04–1.12 | 5–15 |
| Hog | 0.03–8.24 | 25–55 |
| Bush grind | 0.10–0.93 | 20–30 |
| Infeed mix | 0.05–0.63 | 15–20 |
Table 5.
Quality parameters of wood pellets received from three plants. The values are averages.
| Parameters | Plant 1 (n = 5) | Plant 2 (n = 5) | Plant 4 (n = 5) | Averages (n = 15) |
|---|---|---|---|---|
| Hog content (% wt.) | 3 | 9 | 58 | |
| m.c. (% wb) | 5.0 | 3.6 | 6.4 | 5.0 |
| Ash (% db) | 0.3 | 0.9 | 1.9 | 1.0 |
| Bulk density (kg/m3) | 633 | 645 | 655 | 644 |
| Gross calorific value (MJ/kg dry) | 19.9 | 20.0 | 20.1 | 20.0 |
| Smoking temperature (°C) | 167 | 165 | 162 | 165 |
Disclaimer/Publisher’s Note: The statements, opinions and data contained in all publications are solely those of the individual author(s) and contributor(s) and not of MDPI and/or the editor(s). MDPI and/or the editor(s) disclaim responsibility for any injury to people or property resulting from any ideas, methods, instructions or products referred to in the content. |
© 2024 by the authors. Licensee MDPI, Basel, Switzerland. This article is an open access article distributed under the terms and conditions of the Creative Commons Attribution (CC BY) license (https://creativecommons.org/licenses/by/4.0/).
Share and Cite
MDPI and ACS Style
Lee, J.S.; Rezaei, H.; Gholami Banadkoki, O.; Yazdan Panah, F.; Sokhansanj, S. Variability in Physical Properties of Logging and Sawmill Residues for Making Wood Pellets. Processes 2024, 12, 181. https://doi.org/10.3390/pr12010181
AMA Style
Lee JS, Rezaei H, Gholami Banadkoki O, Yazdan Panah F, Sokhansanj S. Variability in Physical Properties of Logging and Sawmill Residues for Making Wood Pellets. Processes. 2024; 12(1):181. https://doi.org/10.3390/pr12010181
Chicago/Turabian StyleLee, Jun Sian, Hamid Rezaei, Omid Gholami Banadkoki, Fahimeh Yazdan Panah, and Shahab Sokhansanj. 2024. "Variability in Physical Properties of Logging and Sawmill Residues for Making Wood Pellets" Processes 12, no. 1: 181. https://doi.org/10.3390/pr12010181
Note that from the first issue of 2016, this journal uses article numbers instead of page numbers. See further details here.