
Test and Analysis of the Heat Dissipation Effect of the Spindle Heat Conductive Path Based on the IPTO Algorithm
by
 , ,
, ,
Yang Li
1,*,
Zhongting Liu
2,
Lei Li
2,
Jingyao Tian
2,
Zhaoyang Hou
2,
Wanhua Zhao
1 and
Wenwu Wu
3 1
State Key Laboratory for Manufacturing Systems Engineering, Xi’an Jiaotong University, Xi’an 710054, China
2
School of Mechanical Engineering, Xi’an Jiaotong University, Xi’an 710054, China
3
Key Lab of NC Machine Tools and Integrated Manufacturing Equipment of the Education Ministry & Key Lab of Manufacturing Equipment of Shaanxi Province, Xi’an 710048, China
*
Author to whom correspondence should be addressed.
Processes 2024, 12(1), 4; https://doi.org/10.3390/pr12010004
Submission received: 27 July 2023
/
Revised: 29 August 2023
/
Accepted: 11 September 2023
/
Published: 19 December 2023
(This article belongs to the Special Issue High-Performance Machining Processes: From Mechanisms to Equipment)
Abstract
:In this paper, in order to reduce the spindle temperature rise and enhance the spindle heat dissipation capability, a top complementary heat conductive path of the spindle based on the IPTO algorithm was designed. In order to verify the heat dissipation effect of the heat conductive path, an experimental test platform was constructed. Experiments on the thermal characteristics of water-cooled and air-cooled heat conductive paths with different volume proportions were conducted to test the temperature rise of the spindle and analyze the effect of the heat conductive path with different volume proportions on the temperature distribution of the spindle. The heat conductive path with the optimal volume proportion was determined and the heat dissipation effect of the heat conductive path was verified.
1. Introduction
At the moment, with the rapid development of industry, the requirements for parts are getting higher and higher. The machining accuracy of the machine tool directly determines the accuracy of the parts. At present, there are many factors affecting machining accuracy, such as geometric errors, errors caused by cutting forces and thermal errors, etc. Among them, the influence of thermal errors accounted for a relatively obvious proportion, which can reach up to 70% [1,2,3]. Yan Liang [4] found in the experiment that in the process of high-speed high precision machining, when the electric spindle ran at high speed, the heat was generated by the friction between the spindle bearing and the electric spindle. Excessive temperature would affect the spindle rotating accuracy and can cause serious bearing failure [5]. At the same time, materials, sizes and structures of the spindle were different, which led to uneven heat distribution and caused uneven thermal deformation, resulting in large radial and axial runout and thermal errors. Therefore, the spindle thermal characteristics have a large impact on machining accuracy.
Cooling and heat dissipation are commonly used methods to reduce the thermal error of the spindle. Traditionally, a cooling water jacket is used for heat dissipation of the spindle [6,7,8]. By installing the water jacket outside the bearing, the heat generated by the machine tool spindle is taken away in the form of convection and the temperature is reduced. Replacing the steel materials in the spindle with the low coefficient of thermal expansion materials and composite steel materials is another way to enhance the spindle’s heat dissipation [9].
Transferring heat by conduction along certain paths was widely used in the field of electronic devices to enhance chip heat dissipation. Those paths were filled with high thermal conductivity materials so that the heat generated at each point was effectively transferred to its boundaries [10,11]. In recent years, this method has also been applied in the field of machine tools. Specifically, the heat conductive path was constructed along the radial direction on the bearing housing and spindle shell, with one end linked to the outer ring of the bearing and the other end linked to the external cooling system of the spindle, and the path was filled with high thermal conductivity materials to allow the internal heat of the spindle to be output to the bearing housing and the external part of the shell through this path [12]. The current study showed that this method has good thermal conductivity, but there was not sufficient research on the structure of the thermal conductivity path, which should be designed in some way.
The difference in the shape and size parameters of the heat conductive path directly affected the magnitude of the thermal resistance and thus the heat dissipation effect [13,14]. A large number of scholars have studied the specific geometric parameters of the structure by means of topology optimization [15]. Baotong Li et al. [16] specified the heat conductive paths with the help of scalar field ridges. Qiyin Lin et al. [17] proposed a bionic hierarchical generation design algorithm inspired by leaf vein growth and used the EFG method to discretize the design domain. Shuhao Wu et al. [18] developed a topological complementary optimization model for transient heat conduction problems with a regional temperature control function as the design objective. The variable density method was a common method for topology complement optimization of continuum structures and was widely used in engineering fields [19,20,21]. M P Bendsoe and O Sigmund [22] analyzed different material’s intermediate density penalty methods and finally proposed an isotropic penalty microstructure model for solids.
A large number of scholars have attempted to study the topology optimization of structures using the PTO algorithm. Yifei Zhang [23] applied the PTO algorithm to optimize the multiphase material position by solving the proportion of flexibility occupied by each phase of material. Zahur Ullah [24] proposed the maximum entropy-based PTO algorithm for the problem of minimum flexibility and stress constraints of structures. Structural optimization of MBB beams, cantilever beams and L-brackets was conducted according to this method. The PTO algorithm can effectively update the design variables iteratively to improve the computational efficiency and accuracy of the results. But the topology structure obtained according to this algorithm is sometimes flawed. On this basis, Hui Wang [25] further improved and proposed the IPTO algorithm, and applied the algorithm to optimize the structure of the cantilever beam and verified the reliability of the algorithm.
In this paper, we proposed to construct heat conductive paths and fill them with high thermal conductivity materials to enhance the dissipation of the spindle. Based on the IPTO algorithm, the optimal distribution of heat conductive paths was calculated. The thermal characteristics of the thermal path were tested, and the heat dissipation effect of the heat conductive path was verified.
2. Topology Structural Design Based on IPTO Algorithm
2.1. Centralized Thermal Conductivity Model
When the spindle is rotating at high speed, a lot of heat is generated at the internal bearing. The heat is difficult to export to the outside quickly, resulting in a large temperature difference between the inside and outside, which may cause the bearing to become stuck and damaged. In order to solve this problem, heat conductive paths [12] are proposed to be built in the design area of the front and rear bearing housing, which were filled with high thermal conductivity material helping transfer the heat from the inside to the outside directly. In order to obtain the optimal distribution of high thermal conductivity materials, the discrete mathematical model (Equation (1)) of the topological optimization algorithm was chosen as the solution for the location of the material distribution [26]:
where C is the heat dissipation weakness and denotes the objective function. x is the cell design variable. T denotes the temperature vector within the design domain. is the volume of the cell. V0 is the total volume of the design domain. f denotes the material body fraction ratio. xmin and xmax are the upper and lower boundary values of the discrete cell xe, respectively.
IPTO [Improved Proportional Topology Optimization] is a corrected proportional optimization algorithm [27]. The algorithm is capable of filtering out variables that conform to the normal distribution and then corrects for them. The corrected variables are used as design parameters and the process is repeated iteratively. The SIMP(Solid Isotropic Material with Penalization) model [28] was used in the specific structure solution of this paper to screen the computational results of each discrete cell. The design parameter was pseudo-density. Pseudo-density was virtual density. When the material density was greater than the lower limit of the set density, the pseudo density was 1. At this time, the unit will be filled with high thermal conductivity materials. In this algorithm, an iterative cycle of density variables was solved for discrete cells according to Equation (2):
where and are the discrete cell density variable obtained from the previous iteration and the current iteration of the main cycle density variable update, α is the scale factor.
Based on the above analysis, the material distribution was solved with the help of COMSOL software. A circular model was established, and copper was chosen as the high thermal conductivity material. The triangular unit was used to divide the ring, and the temperature conditions were added according to Figure 1, which were derived from the specific working conditions and theoretical analysis.
Supposing the volume proportion V of high thermal conductivity material was set to 40%, the material distribution was solved according to the IPTO algorithm and the iteration process was shown in Figure 2a. It can be seen that when the number of iterations reached 50 times, the temperature tended to stabilize. The stabilized structure was the required heat conductive paths (black branch) as shown in Figure 2b. It can be seen from Figure 2b, that the number of main branches was 16, and the shape of the branches was not exactly the same, with some having multiple levels of branches and some having no branches.
2.2. Ring-Shaped Model of Heat Conductive Path
The spindle was normally supported by two sets of angular contact bearings at the front and rear, respectively. Supposing the bearing is NSK 7010C angular contact ball bearing, its contact angle was 15° and the size was 50 × 80 × 16 mm. Assuming that the total axial preload force was 300 N and the lubrication method was grease lubrication, the relevant parameters are shown in Table 1.
As the design area, the front and rear bearing housing were simplified as a ring-shaped model to construct the heat conductive paths. The ordinary model and the model with heat conductive paths containing the topology structure are shown as Figure 3a,b, respectively. The inner diameter was equal to the outer diameter of the bearing. And the material of the substrate was structural steel, which was a common material for spindle bearing housing. The ordinary ring-shaped model (see Figure 3a) consists of pure structural steel and the model with heat conductive path (see Figure 3b) consists of substrate and heat conductive paths with the topology structure which were filled with copper. The relevant parameters of the ring-shaped model are shown in Table 2.
3. Experimental Verification of the Heat Dissipation Effect
An experimental test platform was built to test the heat dissipation effect. The ring-shaped model of heat conductive paths with topology structure was used as the research object, and the model without heat conductive paths was used as the control group. Their temperature fields under certain thermal boundary conditions were tested separately, and the average and maximum temperature of the model were used as the index to evaluate the heat dissipation effect.
3.1. Experimental Testing Platform for the Heat Dissipation Effect of Heat Conductive Path
3.1.1. Experimental Platform
In order to improve the heat dissipation efficiency, heat conductive paths with topology structure were built in the radial direction on the bearing housing shell. One end of the heat conductive path was in direct contact with the outer ring of the spindle bearing, and the other end of the heat conductive path was in contact with the cooling water jacket. By using the heat conductive paths, the heat could be transferred from the heat source in the form of heat conduction directly to the outside of the spindle for cooling. The testing platform for the heat dissipation effect of the heat conductive path was built and is shown in Figure 4. On the testing platform, the cooling water jacket ⑧ was supported by a fixed V-shaped iron ②, and the ring-shaped testing sample was placed inside the cooling water jacket. In order to replace the testing samples conveniently, the disc specimen and the cooling water jacket adopted a clearance fit. The heating ring ⑨ was installed in the inner ring of the testing sample, which was used to simulate the internal heat source of the spindle to generate heat. The power of the heating ring was controlled by the PID temperature control box ⑥. The cooling water jacket was controlled by the chiller ④ to provide constant temperature boundary for the testing sample. The temperature baffle ③ was placed outside the cooling water jacket to prevent interference to the infrared thermal imaging camera. During the experiment, on the one hand, the infrared thermal imaging camera ① lens was used to test the temperature distribution of the sample, and its testing results can be uploaded to the PC terminal in real time ⑦. On the other hand, the PT100 temperature sensor was installed on the end surface of the ring-shaped testing sample to test the changing process of the temperature. The data was transmitted to the multi-data recorder ⑤, and the testing results were saved and shown in real time on the PC.
For the specific experimental implementation shown in Figure 5, the devices were first connected according to the scheme. After the connection, all instruments were turned on. The infrared camera and multi-channel data recorder measured the temperature. The chiller cooled the cooling water jacket to ensure the constant temperature boundary of 25 °C, and the PID temperature control box heated the heating ring to provide the heat source. After the thermal steady state was reached, the data were recorded. Specific experimental methods were described in Section 3.2.1 and Section 3.3.1.
3.1.2. Experimental Instruments
- (1)
- Infrared thermal imager
The FLIR infrared thermal imager was used to display the distribution of the testing sample in real time, and to record the temperature value of all pixel points in the current shooting picture. By adjusting the infrared thermal imager to be horizontal, the lens was facing the end face of the testing sample directly, and the error caused by lens deflection during shooting could be effectively reduced. The distance between the infrared thermal imager and the testing sample was also needed to be adjusted ensuring that the whole end face of the testing sample was within the image. Infrared thermal imager was shown in Figure 6.
Within the range of −20 to 100 °C, the shooting accuracy of the infrared thermal imager is ±1 °C, which can meet the requirements of experimental tests. The parameters of the FLIR infrared thermal imager were listed in Table 3.
- (2)
- Temperature Collector
In order to obtain the temperature rise process of the testing sample, temperature sensors were adopted as well. The TP700 multi-channel data recorder can convert the analog signal collected by the temperature sensor into a digital signal, which was displayed in real-time by a computer. According to the testing results, the trend of temperature rising was obtained, and it was determined if the sample had reached a steady state. The PT100 thermocouple was a magnetic suction type which was easy to install and uninstall. The testing accuracy is within ±1 °C and the testing sensitivity is 0.01 °C. The multi-channel data recorder and temperature sensor are shown in Figure 7.
- (3)
- Cooling water jacket
The cooling water jacket ⑧ in Figure 5 was controlled by a chiller, which can manually set the temperature to provide a constant temperature boundary for the testing sample, as shown in Figure 8.
- (4)
- Heating device
The fully enclosed spring heating ring was adopted as the heater in Figure 5, and the parameters are shown in Table 4.
The heat generation of the heating ring was controlled by a PID temperature control box, as shown in Figure 9a. There were three control modes: automatic control, manual control, and self-tuning mode. The manual control mode can manually set the output power to heat the heating ring at a constant power. The parameters of the PID temperature control box are shown in Table 5 below.
- (5)
- Thermal conductive and insulating materials
In order to minimize the influence of contact thermal resistance on the thermal conductivity of the model, heat conductive silicone grease was used to coat the assembly surface of the testing sample sufficiently. The thermal conductivity of heat conductive silicone grease was 11.8 W−1·m−1K−1, which can reduce the contact thermal resistance and play a lubricating role. It effectively prevented the part surface from scratching and damage during assembly. Coating the wall of the heat conductive path with cobalt oxide as the main component and thermal conductivity was 0.025 W−1·m−1K−1, which can effectively isolate heat transfer along the axis. At the same time, the front and rear end surfaces of the testing sample need to be filled with thermal insulation coating as well.
3.2. Water Cooling Experiment
3.2.1. Experimental Plan
The testing object of the water-cooling experiment was the assembly sample inside the cooling water jacket, as shown in Figure 10. The assembly consists of three parts; from the inside to the outside were the heating ring, the ring-shaped model, and the cooling water jacket.
During the test, the PID temperature control box was used to control the heating power stay in a constant value and the outer cooling water jacket provided a constant temperature boundary. At the same time, in order to reduce the uneven heating problem and the impact of the thermal resistance, a uniform and sufficient amount of thermally conductive silicone grease was applied. The temperature of the end face of the testing sample was tested with an infrared thermal imager. The average temperature of circular dot array around the heating ring was used as an index to evaluate the thermal conductivity ability of the testing model. The PT100 temperature sensor was used to record the temperature rise of the disc and monitor whether it reached the thermal steady state. The temperature of the room was kept at 25 °C to reduce the influence of environmental temperature variation.
The specific steps for experiment are:
- Assemble the ordinary testing sample, the heating ring, and the cooling water jacket. Then use thermal conductive silicone grease to fill the assembly gaps of the test pieces to enhance thermal conduction and use insulation paint to coat the surface of the test pieces and wait for solidification, which can enhance insulation performance.
- Connect the heating ring to the PID temperature control box, the cooling water jacket, and the oil cooler.
- Adjust the position and angle of the infrared thermal imager and fix its position after focusing.
- Connect the infrared thermal imager to the PC terminal. Then debug and calibrate it.
- Install a temperature sensor and connect it to a multi-channel data recorder to monitor the temperature changes in real time and record the time from the start of heating to the steady state.
- The heating ring, controller and testing instrument were all powered on. A PID temperature control box was used to control the heating ring to output a constant power of P = 292 W. The oil cooler circulates coolant to the cooling water jacket, which made the cooling water jacket provide a 25 °C constant temperature boundary.
- Use the FLIR infrared thermal imager to test the temperature changes of the entire testing sample and quantitatively analyze the temperature of the pixel points.
- After completely cooling down, without changing the position of the infrared thermal imager, replace the ordinary sample with the sample with a heat conductive path and repeat above steps.
3.2.2. Testing Results and Analysis
- (1)
- Analysis of experimental data of the model with or without heat conductive paths
Before the experiment, check whether the thermal insulation coating and the thermal conductive silicone grease were evenly applied. The thermal images under the initial state of the model with or without heat conductive paths are shown in Figure 11. Both discs had reached 25 °C and the temperature distribution was uniform.
According to the experimental steps in Section 3.2.1, the testing was conducted. When it reached the thermal steady state, the temperature field distributions of the ring-shaped testing samples observed by the infrared thermal imager are shown in Figure 12. Due to the machining error of the heating ring, it cannot be heated uniformly, so the average temperature Tcircle of one circle of the inner diameter of the sample (black circle in the figure) was taken as the criteria for evaluation.
From the above figure, it can be seen that the average temperature Tcircle of the inner ring of the sample without the heat conductive path was 48.6 °C, and the average temperature Tcircle of the inner ring of the disc with the copper volume proportion of 40% was 41.5 °C. The temperature decreased by 7.1 °C. Because the fit between the disc model and the cooling water jacket was a gap fit, there is a large gap at the top. This led to a more sufficient cooling below than above, resulting in uneven temperature field distribution.
The following Figure 13 shows the temperature rise of the temperature sensor. From the test results, it can be seen that at the beginning the temperature rose rapidly. After a certain period of time the temperature rise rate decreased and finally reached the thermal steady state. Taking 99% of the maximum temperature as the standard for reaching the thermal steady state, it can be seen that the maximum temperature of the sample without the heat conductive path was 42.6 °C, and it took 1378 s to reach the steady state. The maximum temperature of the disc with the heat conductive path (40% copper volume proportion) was 35.8 °C and the time to thermal steady state time was 1117 s. Compared with the former, the maximum temperature of the latter decreased by 6.8 °C and the thermal steady state time was shortened by 261 s.
According to the testing results of the temperature rise and the temperature field distribution, it can be seen that the heat conductive path constructed by the topology structures obtained through the IPTO optimization algorithm can significantly improve the thermal conductive ability, thus reducing the temperature rise and the warm-up time.
- (2)
- The effect of copper volume proportion on the heat dissipation effect of the heat conductive path
The copper volume proportion in the topology structure of the disc with the heat conductive path was selected as V∈[30%, 50%], and the thermal steady-state water cooling experiments were conducted for different volume proportion discs, respectively, and the experimental results are shown in Figure 14.
From the above figure, it can be seen that when the copper volume proportion increased, the maximum temperature rise of the model gradually decreased, the maximum temperature rise of the disc with 30% copper volume proportion was 37.5 °C and the thermal steady state time was 1135 s; the maximum temperature rise of the disc with 50% copper volume proportion was 33.8, and the thermal steady state time was 1100 s. After the disc reached thermal stability, the temperature field distribution of the disc can be obtained through an infrared thermal imager, as shown in Figure 15.
According to Figure 12 and Figure 13, it can be seen that the average temperature Tcircle of the sample without heat conductive paths was 48.6 °C. The average temperature Tcircle of the sample with 30%, 40% and 50% copper volume proportion was 44.9 °C, 41.5 °C and 40.8 °C. Compared with the samples without heat conductive paths, the corresponding decrease in the inner circle temperature of the samples with three different copper volume proportions was 3.7 °C, 7.1 °C and 7.9 °C. It indicated that the maximum temperature rise after thermal steady state decreased as the copper volume proportion increases, but this decreasing trend diminished after the copper volume proportion exceeded 40%.
3.3. Air Cooling Experiment
3.3.1. Experimental Plan
In order to study the temperature distribution on the surface of the outer ring of the ring-shaped testing sample, multiple temperature sensors were arranged. Considering the limitation of the cooling water jacket on the temperature sensor measurement points, the cooling water jacket needed to be removed for air cooling experiments. The material of the table was 45 steel material, whose thermal conductivity was much larger than that of air. In order to reduce the testing error, the testing sample was placed on a wooden block instead of on the table directly. The testing assembly and temperature sensor installation position was shown in Figure 16 below. In order to make sure that the most of the heat was transferred from inside to outside along the radial direction and reduce the loss along the axial direction, the front and rear end surfaces needed to be evenly coated with adiabatic coating.
During the air-cooling experiment, there was only convective heat exchange between the outer ring and the air as there was no cooling effect of the cooling water jacket. The temperature of the inner ring of the sample would rise quickly when it was heated. In order to complete the experiment safely, the output power of the temperature control box needed to be changed to 12% and the actual heating power was 44 W.
The specific steps of the experiment are:
- Apply heat insulating coating evenly on the front and back faces of the ordinary testing sample, assemble the testing sample and heating ring, connect the heating ring to the PID temperature control box;
- Install temperature sensors along the circumference of the outer circle of the testing sample and connect to the multi-channel data acquisition instrument;
- The heating ring, controller and test instrument were all turned on, and the PID temperature control box was used to control the heating ring with a constant power output of P = 44 W;
- The temperature changed points and the time required for the sample to reach steady state were recorded;
- After completely cooling the machine, replace the ordinary sample with the one with heat conductive paths and repeat the above steps.
3.3.2. Testing Results and Analysis
According to the above steps, the temperature of the outer ring surface of the sample with different copper volume proportions was tested, and the temperature rise measured by the front-end temperature sensor is shown in Figure 17. Similarly, taking 99% of the highest temperature was the criterion for evaluating if it reaches the steady state.
From the figure above, it can be seen that the maximum temperature of the sample without the heat conductive path was 32.7 °C and the thermal steady state time was 139 min. The maximum temperature of the sample with the copper volume proportion of 30% was 32.2 °C and the thermal steady state time was 125 min. The maximum temperature of the sample with the copper volume proportion of 40% was 31.3 °C and the thermal steady state time was 120 min. The maximum temperature of the sample with the copper volume proportion of 50% was 28.9 °C and the thermal steady state time was 117 min.
Based on the data measured by three other sensors arranged along the circumference of the outer ring of the testing sample, the maximum, minimum and average temperatures can be obtained, as shown in Figure 18.
From the figure above, it can be seen that the average temperature of the outer ring of the sample without the heat conductive path was 32.2 °C under the thermal steady state. The average temperature of the outer ring of the sample with the copper volume proportion of 30%, 40% and 50% was 32.1 °C, 31.4 °C and 28.3 °C. The difference between the maximum temperature of the sample without and with heat conductive paths (the copper volume proportion of 30%, 40% and 50%) was 0.2 °C, 0.4 °C and 3.3 °C. Comparing with the water-cooling experiment, the temperature drop after using the heat conductive paths was not significant. But it can still be seen that with the increase in the volume proportion of copper in the heat conductive paths, the temperature rise decreased. It meant that with the heat conductive paths the heat dissipation was enhanced.
4. Conclusions
In this paper, the topology structure of the heat conductive path was constructed based on the IPTO algorithm. The heat conductive path can efficiently export the heat inside the spindle from inside to outside. And the spindle heat dissipation could be enhanced, the spindle temperature rise can be reduced, and the time required to reach the thermal equilibrium state could be shortened. The following conclusions can be drawn from the results of the experiments, which were conducted with water and air cooling:
- Under water-cooled conditions, the maximum average temperature of the inner ring of the ring-shaped testing sample without the heat conductive path was 48.6 °C, and the time to reach thermal steady state was 1378 s; the average temperature of the inner ring of the sample with the heat conductive path (40% copper volume proportion) was 41.5 °C, and the time to reach thermal steady state was 1117 s. Compared with the former, the temperature was reduced by 7.1 °C, and the time required for thermal equilibrium was shortened by 261 s. Under the air-cooling condition, comparing with the sample without the heat conductive path, the temperature of the sample with heat conductive path (40% copper volume proportion) was reduced by 2.4 °C, and the time required for thermal equilibrium was shortened by about 20 min. In summary, the heat conductive path can effectively reduce the temperature rise and enhance the heat dissipation of the spindle.
- As the copper volume proportion increased, the maximum temperature of the disc after thermal stabilization decreased gradually. But after the copper volume proportion exceeded 40%, the trend decreased. It indicated that when the ratio of high thermal conductivity materials reached a certain value, the difference in thermal conductivity brought by different topology structures was no longer obvious, and the effect brought by the structural optimization had been overshadowed by the high thermal conductivity properties of the material at this time.
Author Contributions
Methodology, L.L.; Validation, J.T.; Formal analysis, Z.H.; Data curation, W.W.; Writing—original draft, Y.L.; Writing—review & editing, Z.L.; Project administration, W.Z. All authors have read and agreed to the published version of the manuscript.
Funding
This research was funded by the National Natural Science Foundation of China, grant number 52275509; the National Natural Science Foundation of Shaanxi Province, grant number 2022JQ-487; and the Key-Area Research and Development Program of Guangdong Province Grant, grant number 2020B090927002.
Data Availability Statement
There is no new data were created, or the data is unavailable due to privacy or ethical restrictions.
Conflicts of Interest
The authors declare no conflict of interest. The funders had no role in the design of the study; in the collection, analyses, or interpretation of data; in the writing of the manuscript; or in the decision to publish the results.
References
- Pahk, H.; Lee, S.W. Thermal Error Measurement and Real Time Compensation System for the CNC Machine Tools Incorporating the Spindle Thermal Error and the Feed Axis Thermal Error. Int. J. Adv. Manuf. Technol. 2002, 20, 487–494. [Google Scholar] [CrossRef]
- Wang, B.M.; Mei, X.S.; Wu, Z.X.; Zhu, F. Dynamic modeling for thermal error in motorized spindles. Int. J. Adv. Manuf. Technol. 2015, 78, 1141–1146. [Google Scholar] [CrossRef]
- Liu, J.L.; Ma, C.; Wang, S.L. Data-driven thermally-induced error compensation method of high-speed and precision five-axis machine tools. Mech. Syst. Signal Process. 2020, 138, 106538. [Google Scholar] [CrossRef]
- Liang, Y. Analysis of the change of spindle temperature of CNC lathe and its effect on machining accuracy. Sci. Technol. Vis. 2022, 32, 23–26. [Google Scholar]
- Chen, K.; Zhou, J.Z.; Jing, L.P. Analysis and calculation of thermal performance of high-speed electric spindle. World Manuf. Eng. Mark. 2022, 5, 64–67. [Google Scholar]
- Li, Y.; Chen, G.H.; Xia, M.; Liu, D.Q.; Zuo, Q.J. Design of Water Cooler for Spindle Thermal Control. Mach. Tool Hydraul. 2023, 51, 95–100. [Google Scholar]
- Wu, M.Y.; Li, B.W.; Sun, Y.J.; Jiang, W.Q.; Cheng, Y.N. Experimental Research on Cooling System of High-speed Motorized Spindle. Mach. Tool Hydraul. 2021, 49, 56–62. [Google Scholar]
- Jiao, Y.L. Study on Thermal Characteristics of New Laminated Cooling Water Jacket for High-speed Motorized Spindle. Master’s Thesis, Xi’an University of Technology, Xi’an, China, 2020. [Google Scholar]
- Wen, M.F.; Zhong, J.L.; Peng, B.Y.; Wang, P.J.; Wang, Z.X. Analysis on Thermal Structure Coupling and Material Selection of High Speed Motorized Spindle. Mach. Tool Hydraul. 2023, 51, 158–163. [Google Scholar]
- Li, H.L.; Cao, B.Y. Topology optimization of the volume-to-point heat conduction problem at micro- and nano-scale. Acta Phys. Sin. 2019, 68, 18–28. [Google Scholar] [CrossRef]
- Wei, S.H.; Chen, L.G.; Sun, F.R. “Volume-Point” heat conduction constructal optimization with entransy dissipation minimization objective based on rectangular element. Sci. China Ser. E Technol. Sci. 2008, 51, 1283–1295. [Google Scholar] [CrossRef]
- Li, Y.; Yu, M.L.; Bai, Y.M.; Hou, Z.Y.; Zhang, H.J.; Wu, W.W. A heat dissipation enhancing method for the high-speed spindle based on heat conductive paths. Adv. Mech. Eng. 2023, 15, 167675. [Google Scholar] [CrossRef]
- Zhang, H.; Zhang, D.L.; Zhang, X.G.; Mao, B. Optimal Design and Analysis of Thermal Topology of Two-dimensional Structures Based on Variable Density Method. Intern. Combust. Engine Parts 2023, 11, 23–26. [Google Scholar]
- Da Silva, A.K.; Vasile, C.; Bejan, A. Disc cooled with high-conductivity inserts that extend inward from the perimeter. Int. J. Heat Mass Transf. 2004, 47, 4257–4263. [Google Scholar] [CrossRef]
- Zhou, M.D.; Lazarov, B.S.; Wang, F.W.; Sigmund, O. Minimum length scale in topology optimization by geometric constraints. Comput. Methods Appl. Mech. Eng. 2015, 293, 266–282. [Google Scholar] [CrossRef]
- Li, B.T.; Hong, J.; Li, G.G.; Ge, L.H. On identifying optimal heat conduction topologies from heat transfer paths analysis. Int. Commun. Heat Mass Transf. 2018, 90, 93–102. [Google Scholar] [CrossRef]
- Lin, Q.Y.; Liu, L.; Wang, J.H.; Yan, K.; Guo, J.K. A Bionic Hierarchy Generative Design for Conductive Heat Transfer. J. Heat Transf. 2020, 142, 4047832. [Google Scholar] [CrossRef]
- Wu, S.H.; Zhang, Y.C.; Liu, S.T. A topology optimization model for conducting paths design of cooling structures considering transient effect. Chin. J. Comput. Mech. 2018, 35, 547–551. [Google Scholar]
- Deaton, J.D.; Grandhi, R.V. A survey of structural and multidisciplinary continuum topology optimization: Post 2000. Struct. Multidiscip. Optim. 2014, 49, 1–38. [Google Scholar] [CrossRef]
- Ji, X.T. Topology Optimization Design of Heat Sink Structure Based on Variable Density Method. Master’s Thesis, Hebei University of Technology, Tianjin, China, 2021. [Google Scholar]
- Ding, M.; Geng, D.; Zhou, M.D.; Lai, X.M. Topology Optimization Strategy of Structural Strength Based on Variable Density Method. J. Shanghai Jiaotong Univ. 2021, 55, 764–773. [Google Scholar]
- Bendsoe, M.P.; Sigmund, O. Material interpolation schemes in topology optimization. Arch. Appl. Mech. 1999, 69, 635–654. [Google Scholar] [CrossRef]
- Zhang, Y.F. Structural Topology Optimization Based on Proportional Topology Optimization Method. Master’s Thesis, Xidian University, Xi’an, China, 2018. [Google Scholar]
- Ullah, Z.; Ullah, B.; Khan, W.; Islam, S.U. Proportional topology optimization with maximum entropy-based meshless method for minimum compliance and stress constrained problems. Eng. Comput. 2022, 38, 5541–5561. [Google Scholar] [CrossRef]
- Wang, H. Research on Topology Optimization of Uncertain Continuum Structure. Ph.D. Thesis, Southwest Jiaotong University, Chengdu, China, 2017. [Google Scholar]
- Chen, Y.P.; Gao, L.; Xiao, M. Topology optimization design of heat dissipation structures based on variable density method. Comput. Integr. Manuf. Syst. 2018, 24, 117–126. [Google Scholar]
- Wang, H.; Cheng, W.M.; Zhai, S.C.; Peng, Q.H. Reliability-based topology optimization of continuum structure with the IPTO algorithm. Mod. Manuf. Eng. 2021, 12, 105–111. [Google Scholar]
- Huang, G.M.; Liu, M.M.; Yang, H.L.; Zhang, H.Y.; Fan, Y.F.; Xie, F.; Ge, S.L. Lightweight Design of Transmission Gear of an Aircraft Gun Ammunition Box based on SIMP Material Interpolation Model. J. Mech. Transm. 2019, 43, 55–58. [Google Scholar]
Figure 1.
Temperature conditions.
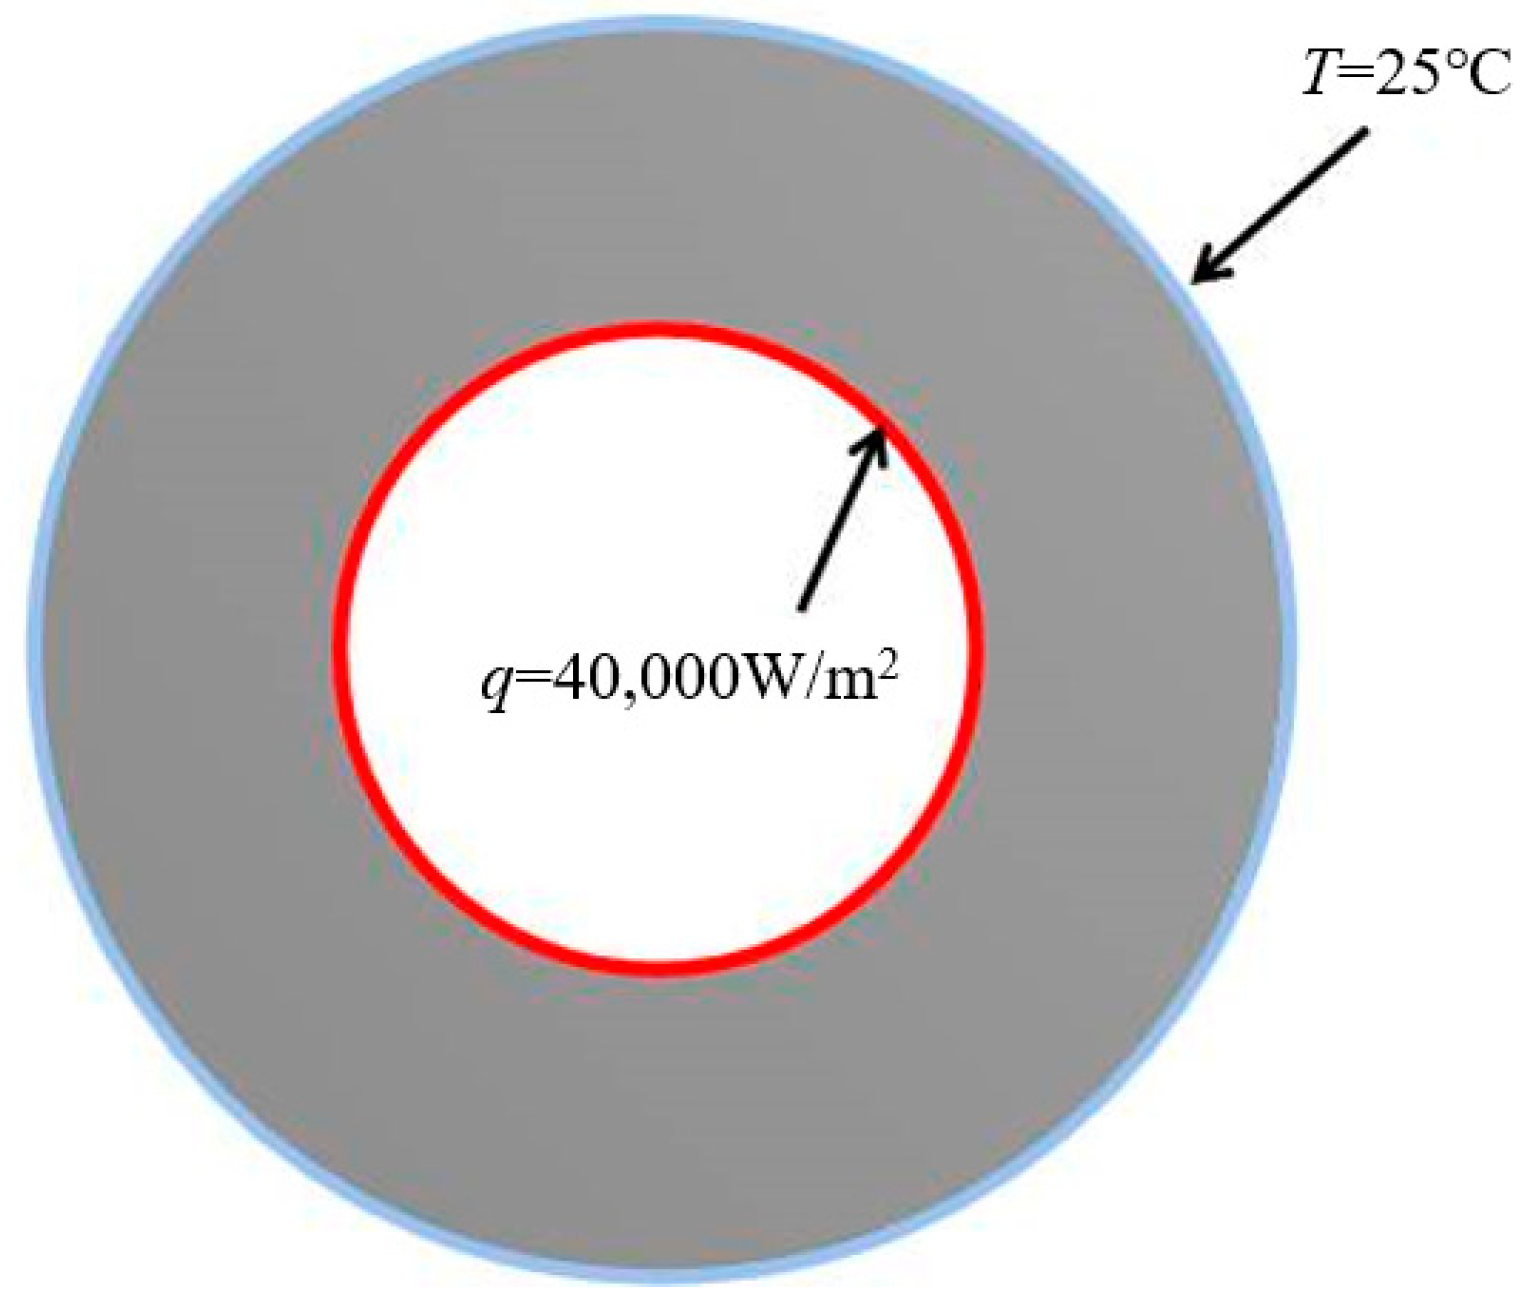
Figure 2.
Solution results: (a) Iterative process; (b) Topological structure of heat conductive paths based on IPTO algorithm.
Figure 2.
Solution results: (a) Iterative process; (b) Topological structure of heat conductive paths based on IPTO algorithm.
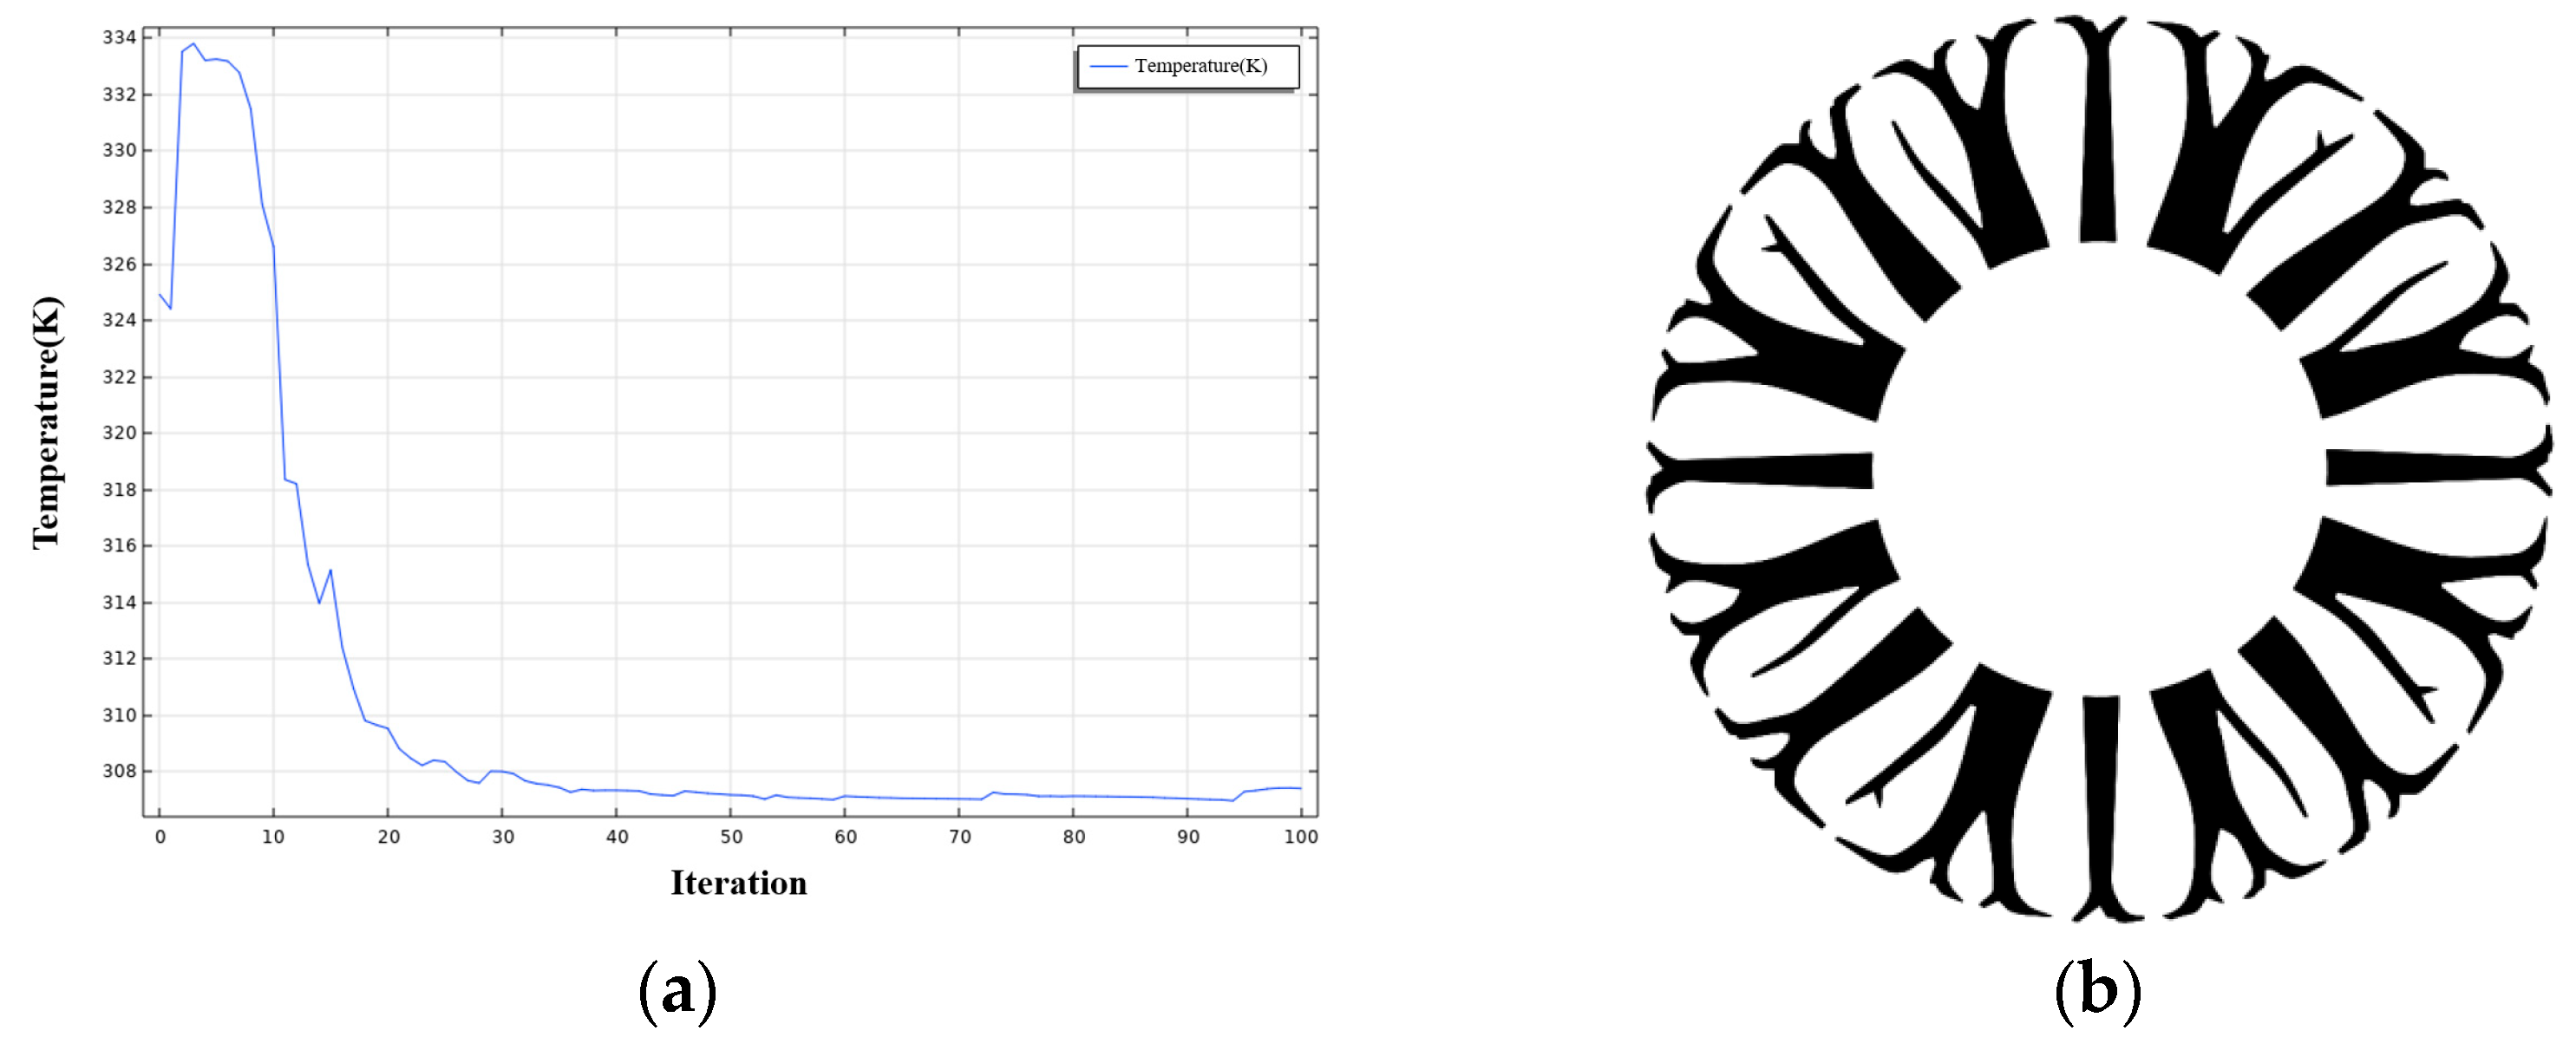
Figure 3.
Ring-shaped model: (a) Ordinary model (pure matrix material); (b) Model with heat conductive path (copper volume proportion 40%).
Figure 3.
Ring-shaped model: (a) Ordinary model (pure matrix material); (b) Model with heat conductive path (copper volume proportion 40%).
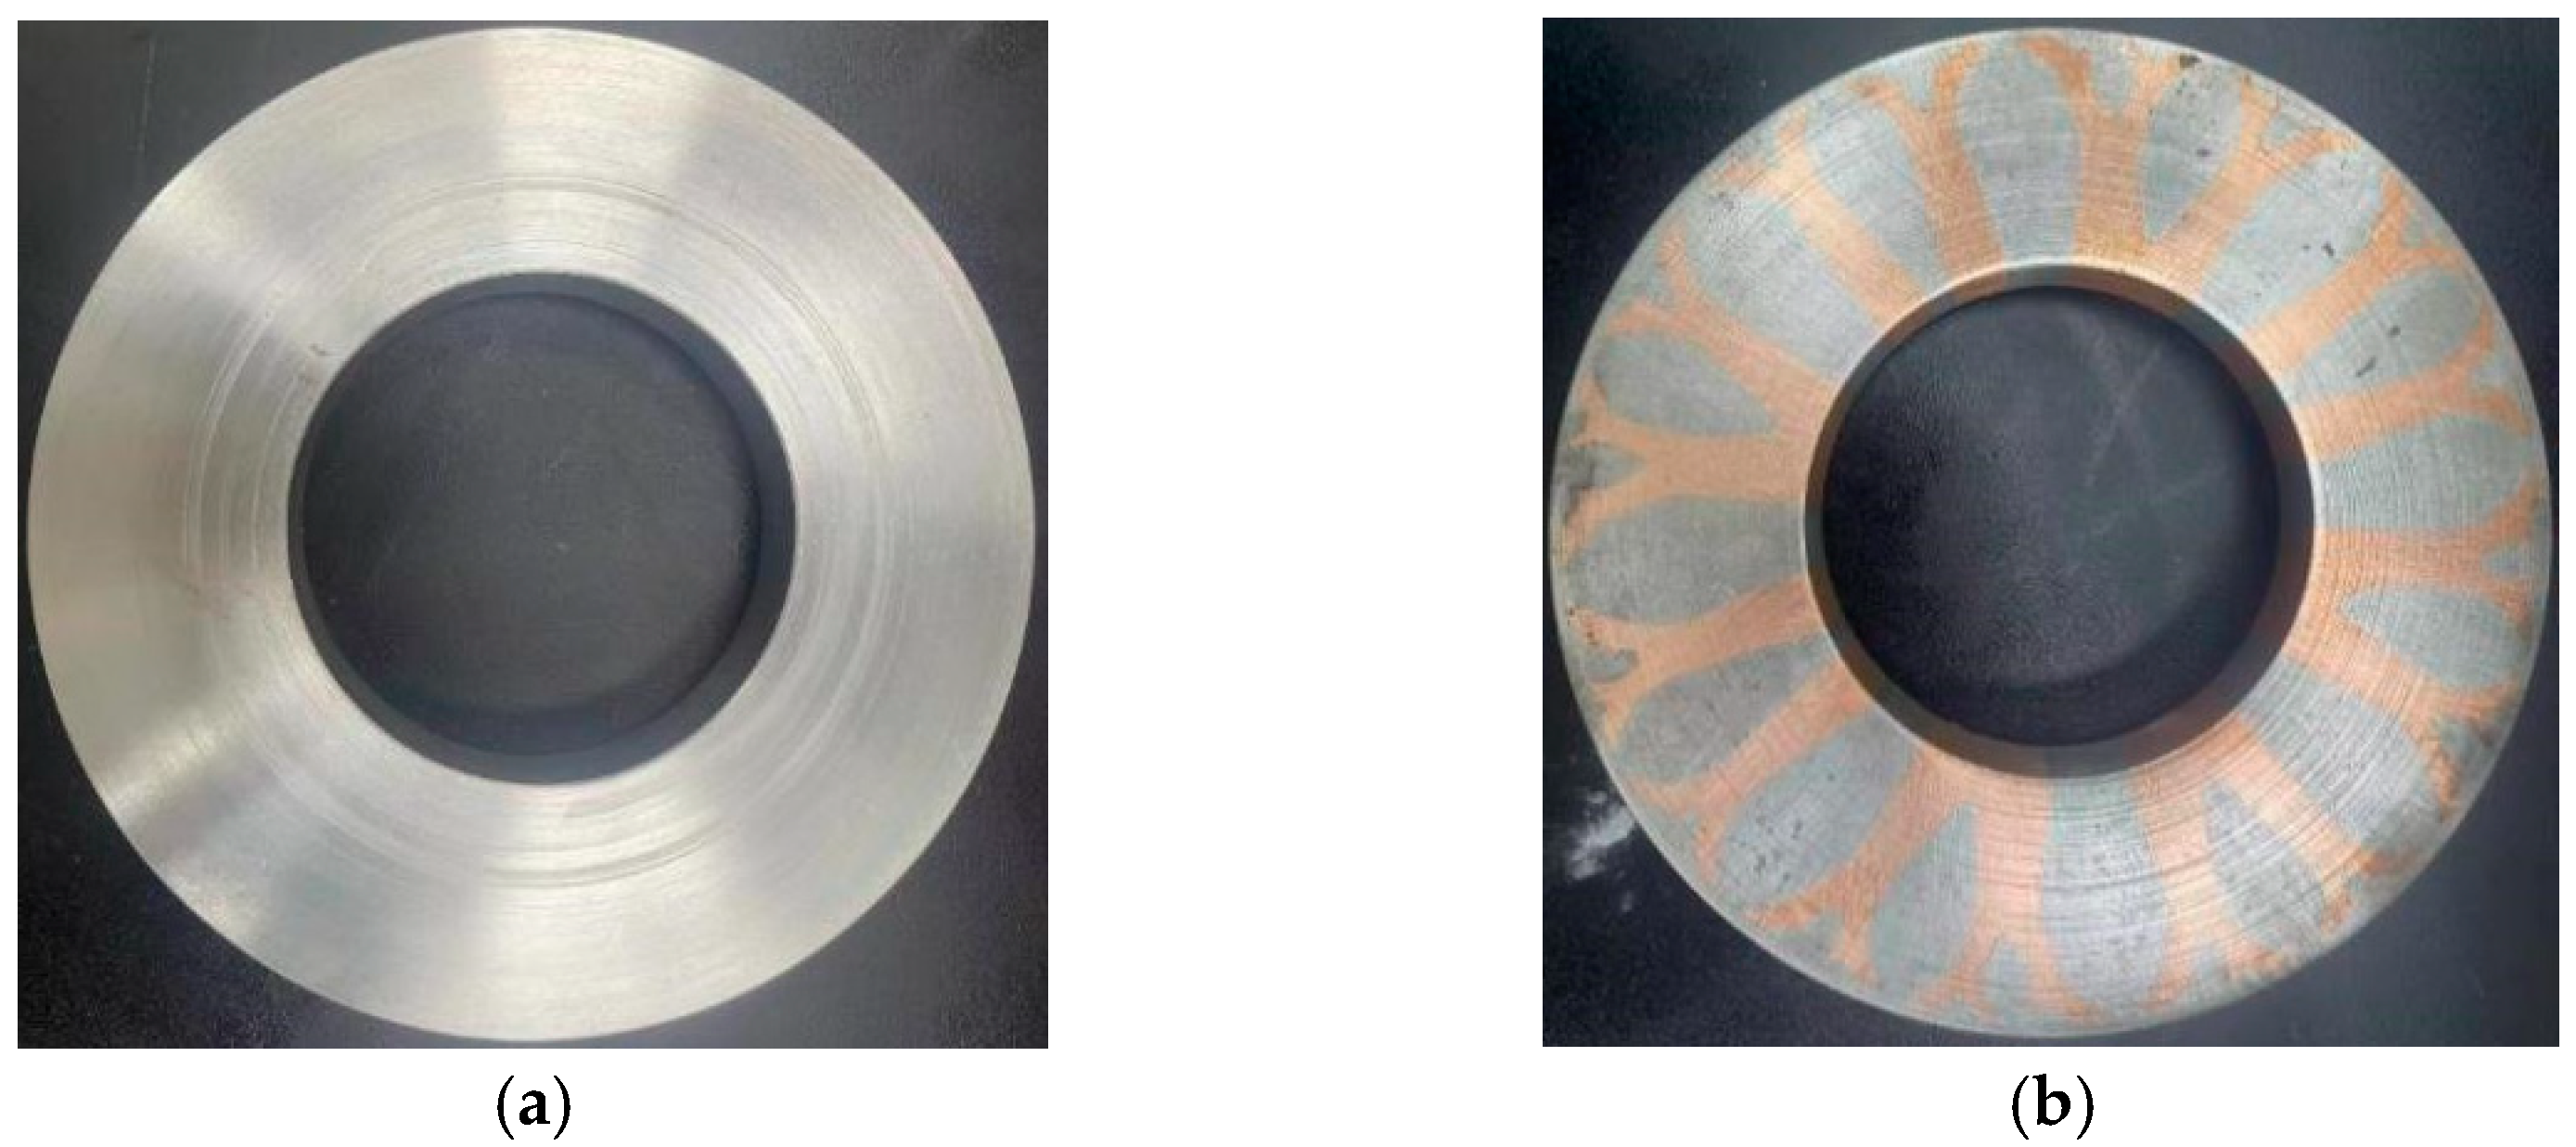
Figure 4.
Experimental test platform for heat dissipation effect of heat conductive path.
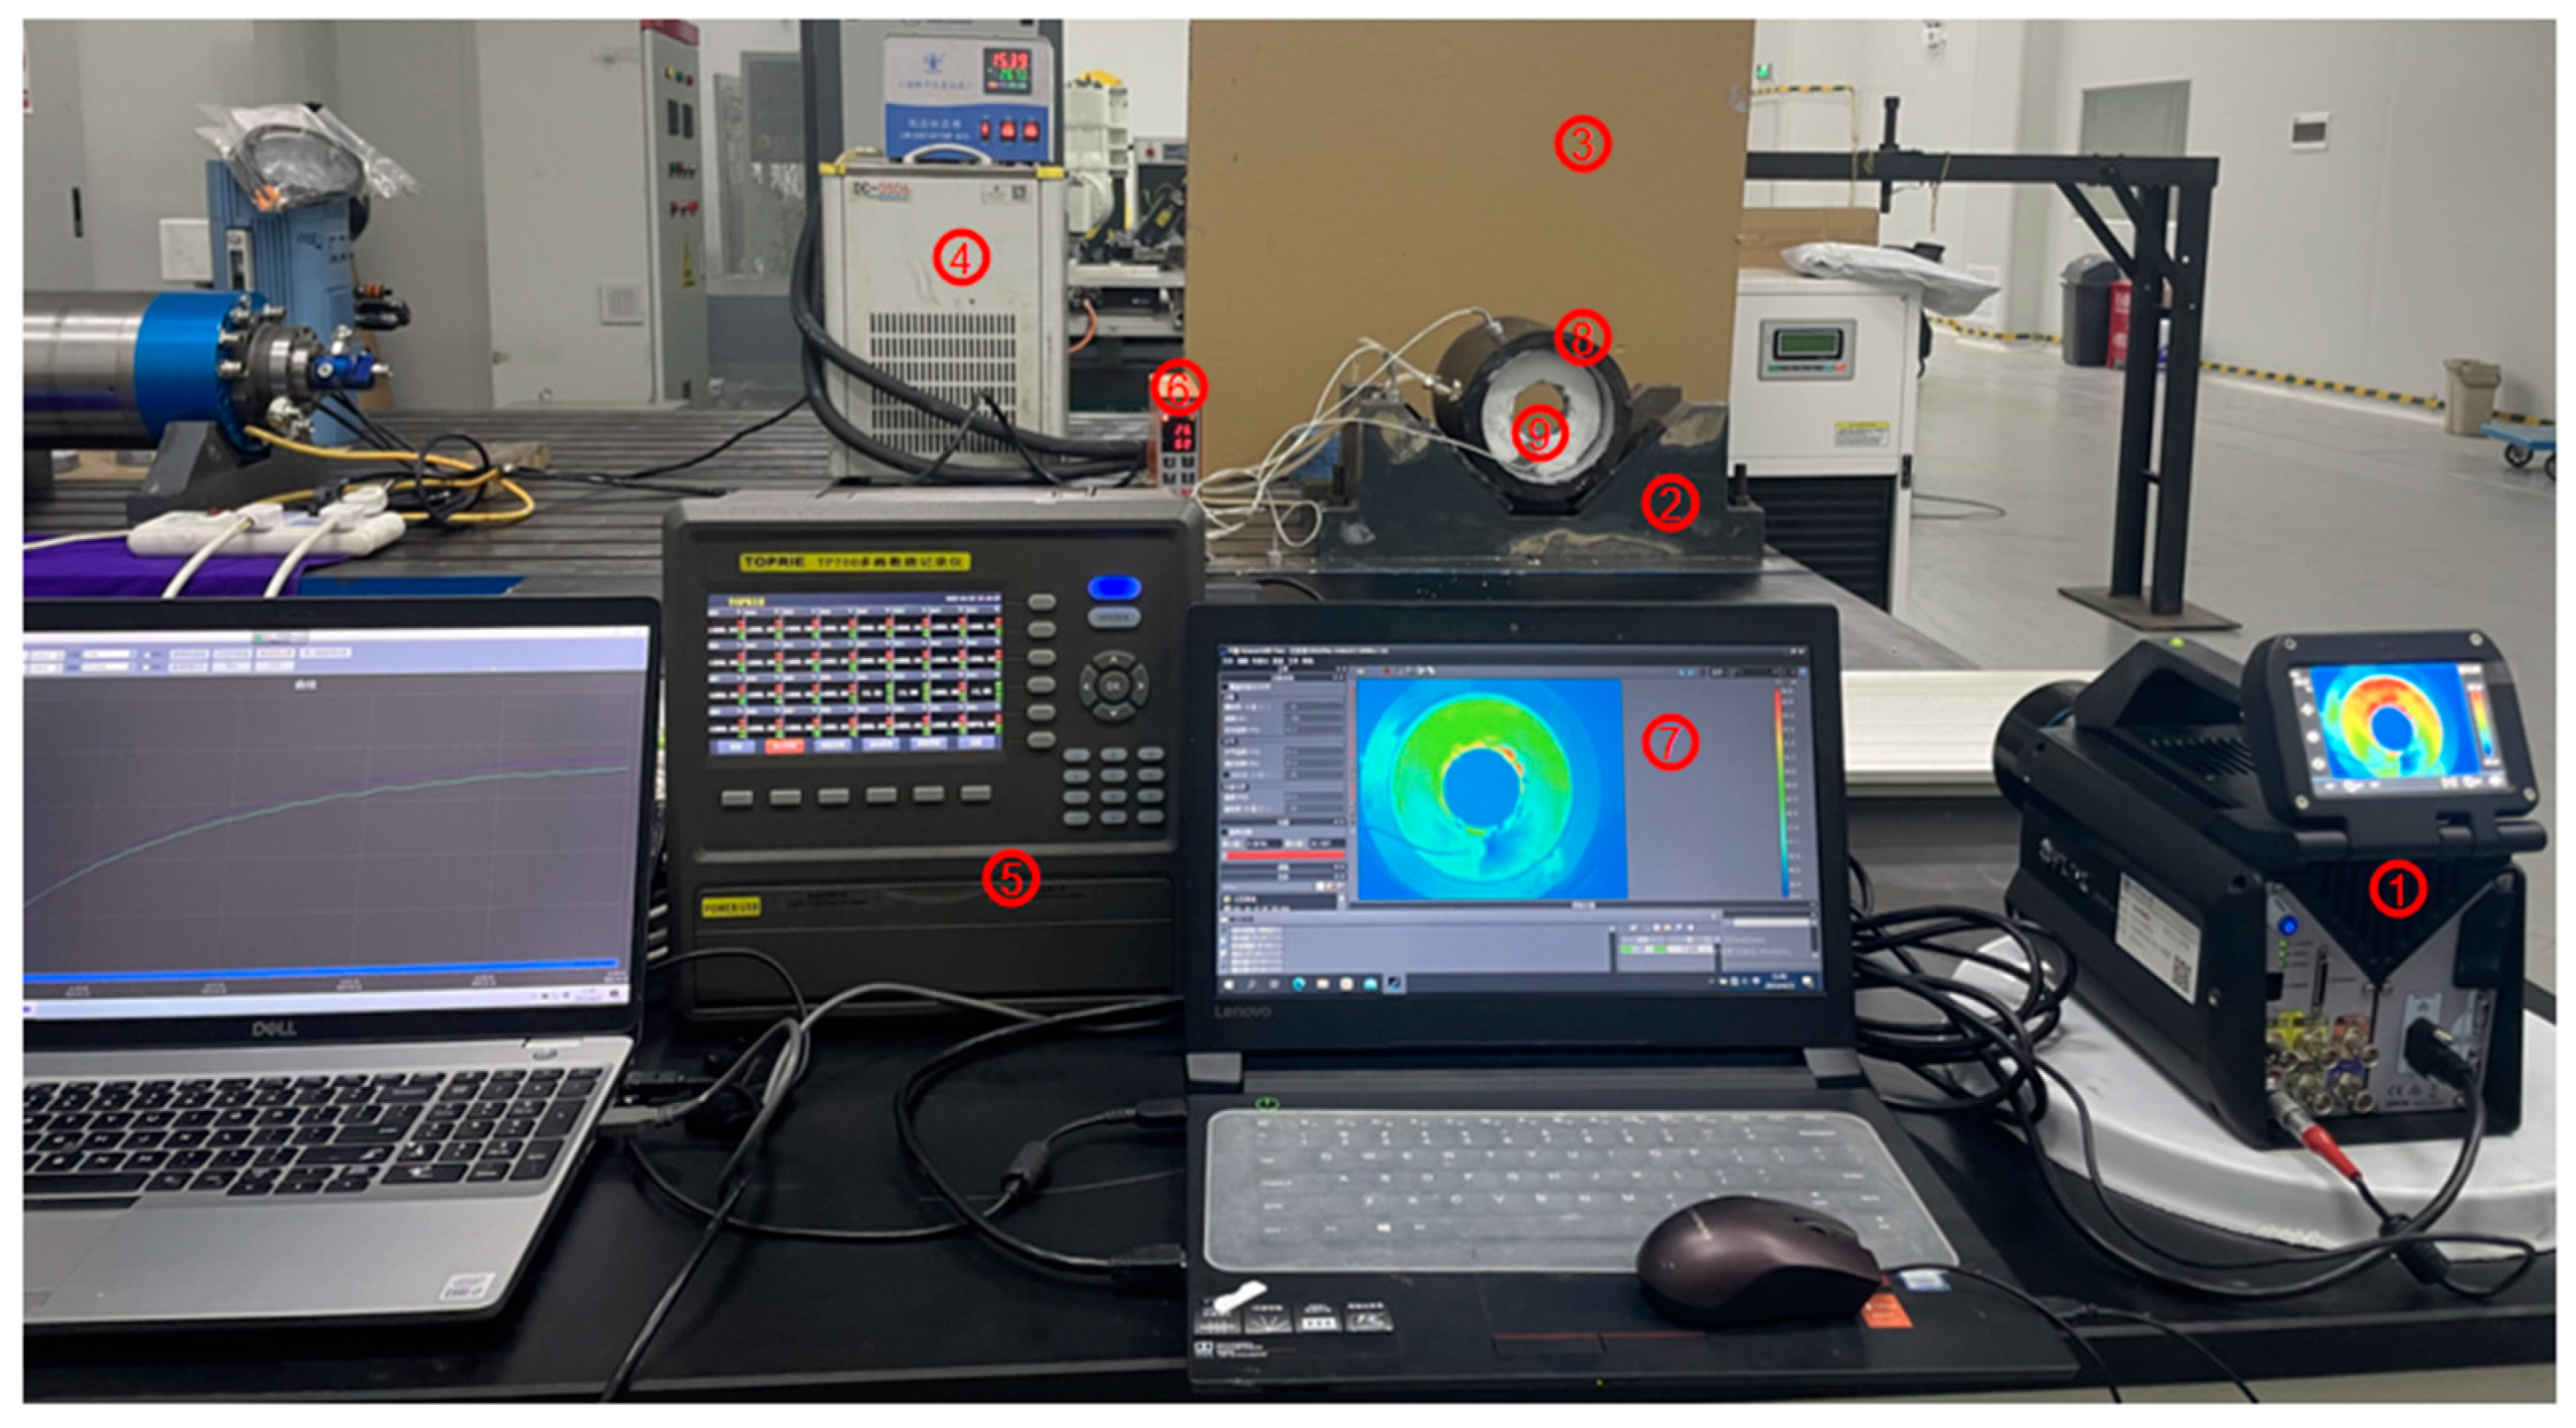
Figure 5.
The schematic for the experimental apparatus.
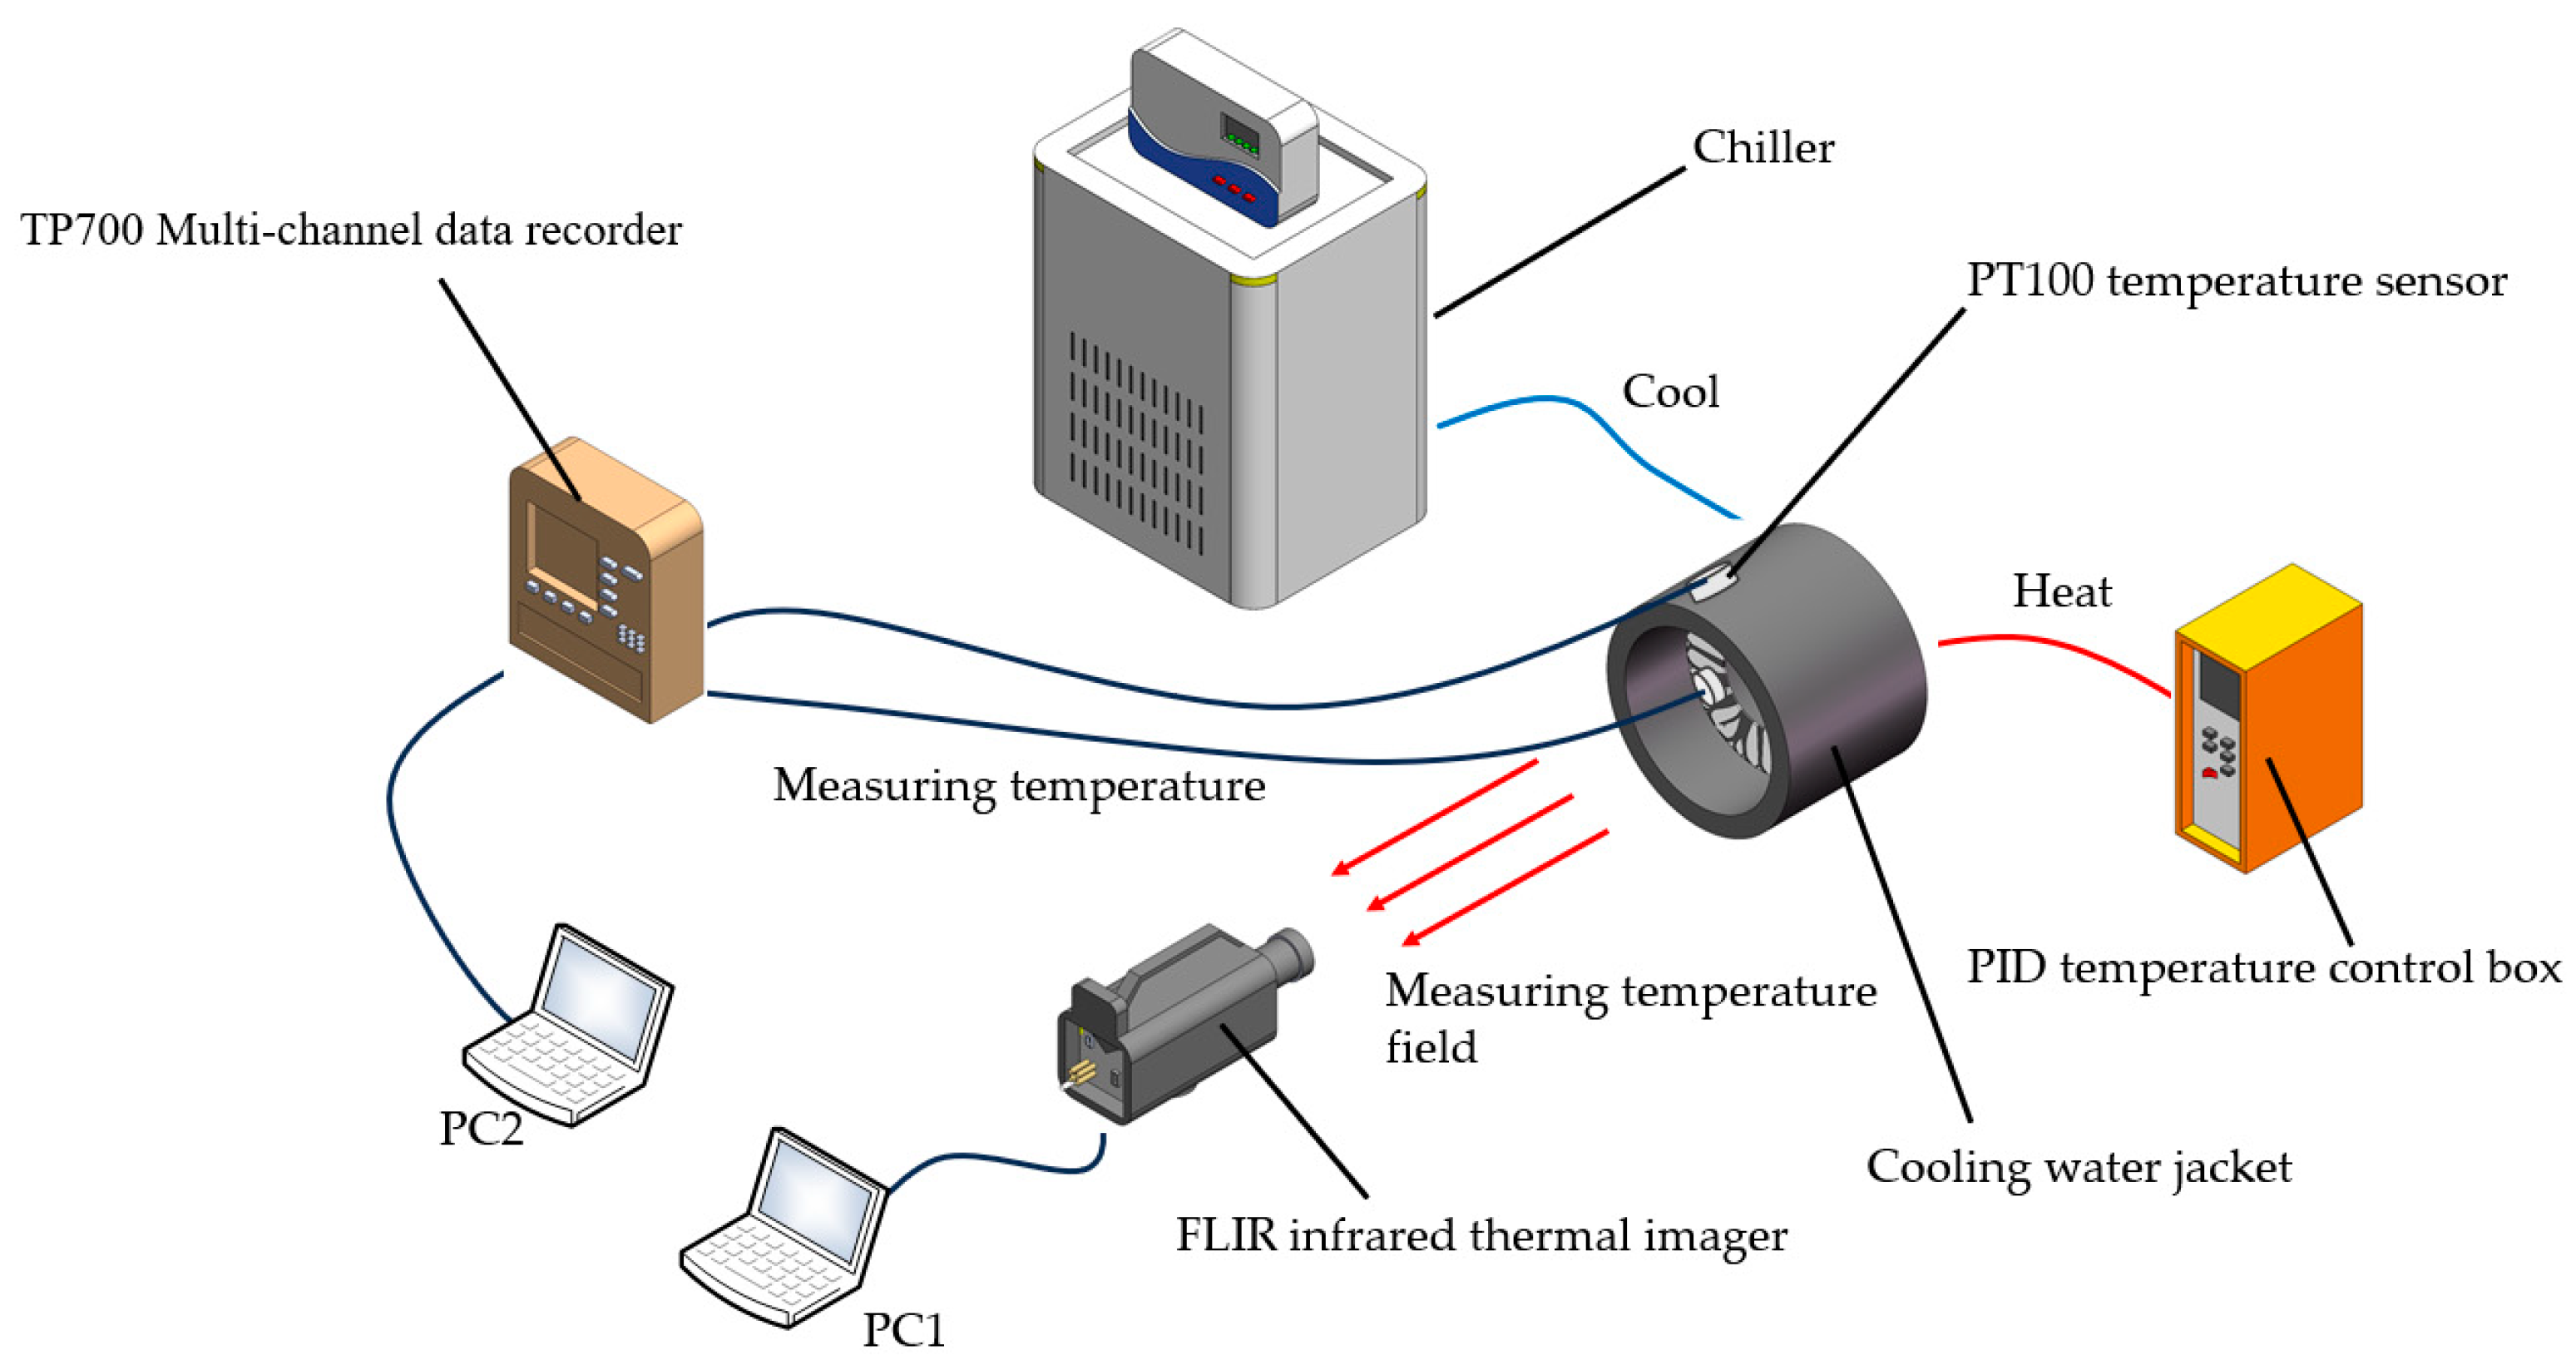
Figure 6.
FLIR infrared thermal imager.
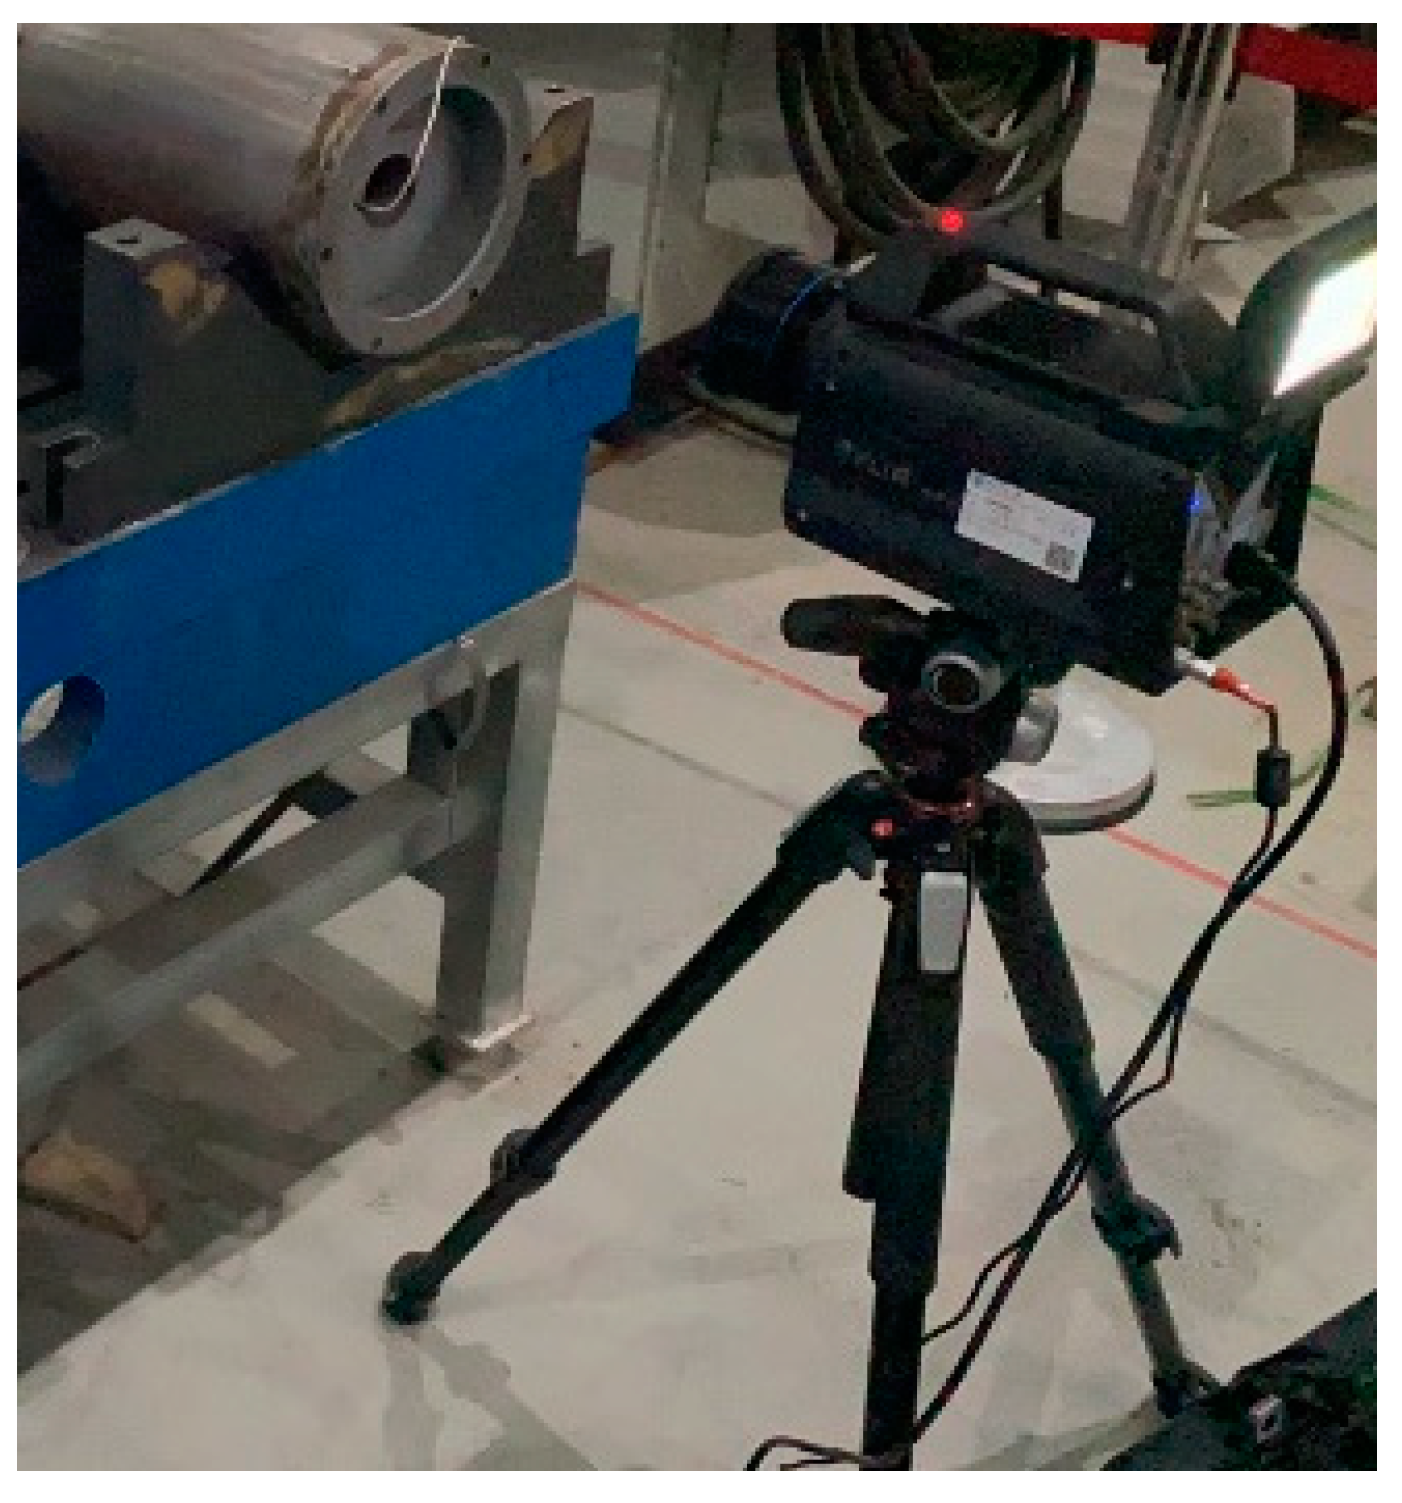
Figure 7.
Multi-channel data recorder and temperature sensor: (a) TP700 Multi-channel data recorder; (b) PT100 temperature sensor.
Figure 7.
Multi-channel data recorder and temperature sensor: (a) TP700 Multi-channel data recorder; (b) PT100 temperature sensor.

Figure 8.
Cooling system: (a) Chiller; (b) Cooling water jacket.
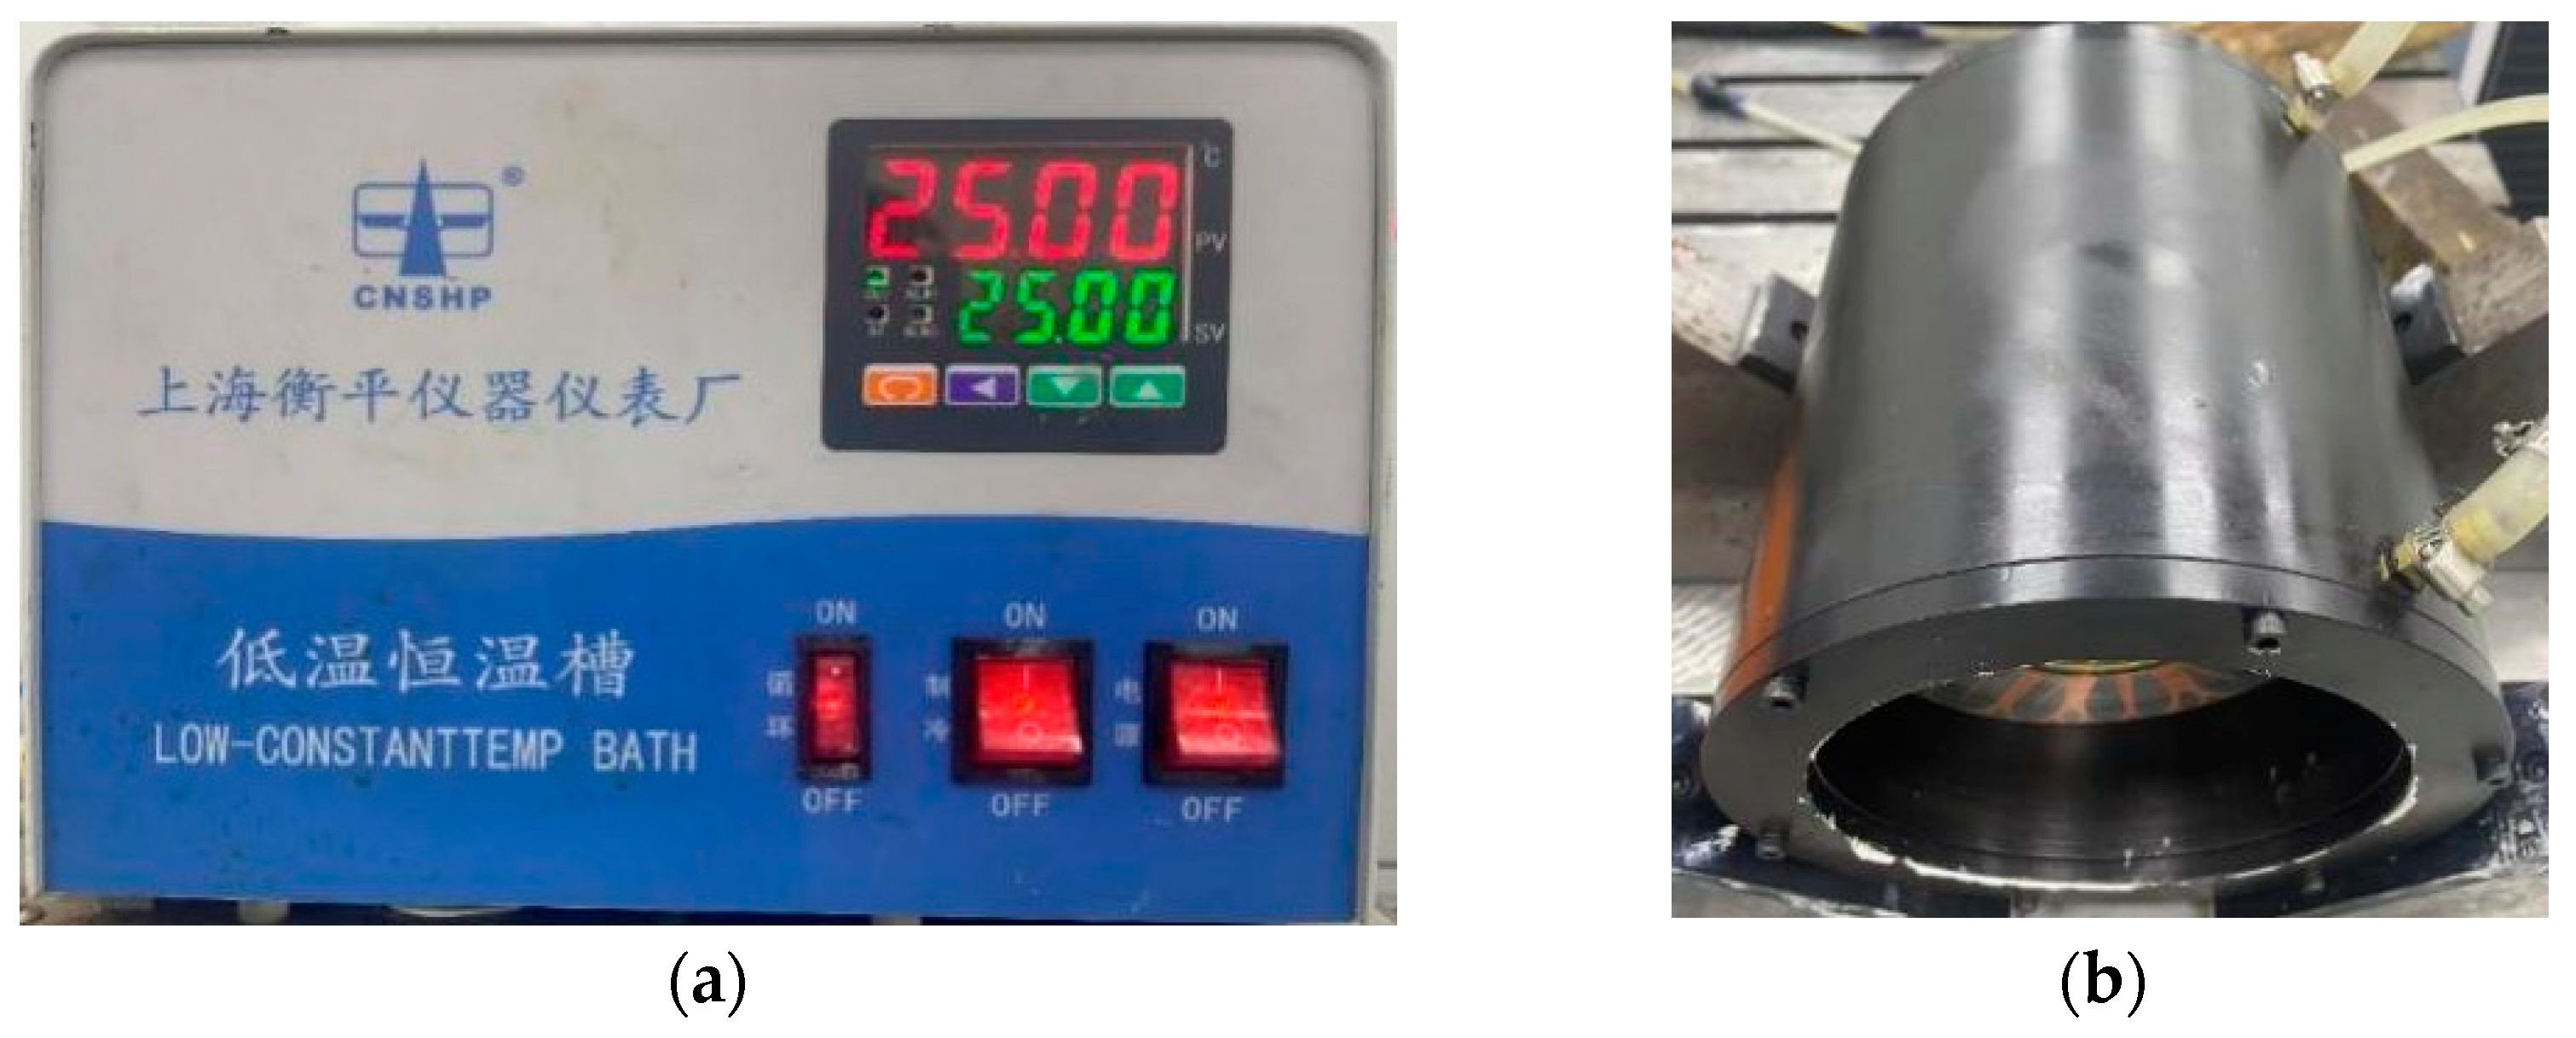
Figure 9.
PID temperature control box and heating ring: (a) PID temperature control box; (b) Heating ring.
Figure 9.
PID temperature control box and heating ring: (a) PID temperature control box; (b) Heating ring.

Figure 10.
Temperature test position for disc assembly.

Figure 11.
Initial temperature field distribution of testing samples: (a) The model without heat conductive path; (b) The model with the heat conductive paths with copper volume proportion of 40%.
Figure 11.
Initial temperature field distribution of testing samples: (a) The model without heat conductive path; (b) The model with the heat conductive paths with copper volume proportion of 40%.

Figure 12.
Thermal steady state temperature field distribution of testing samples: (a) The model without the heat conductive path; (b) The model with the heat conductive paths with copper volume proportion of 40%.
Figure 12.
Thermal steady state temperature field distribution of testing samples: (a) The model without the heat conductive path; (b) The model with the heat conductive paths with copper volume proportion of 40%.
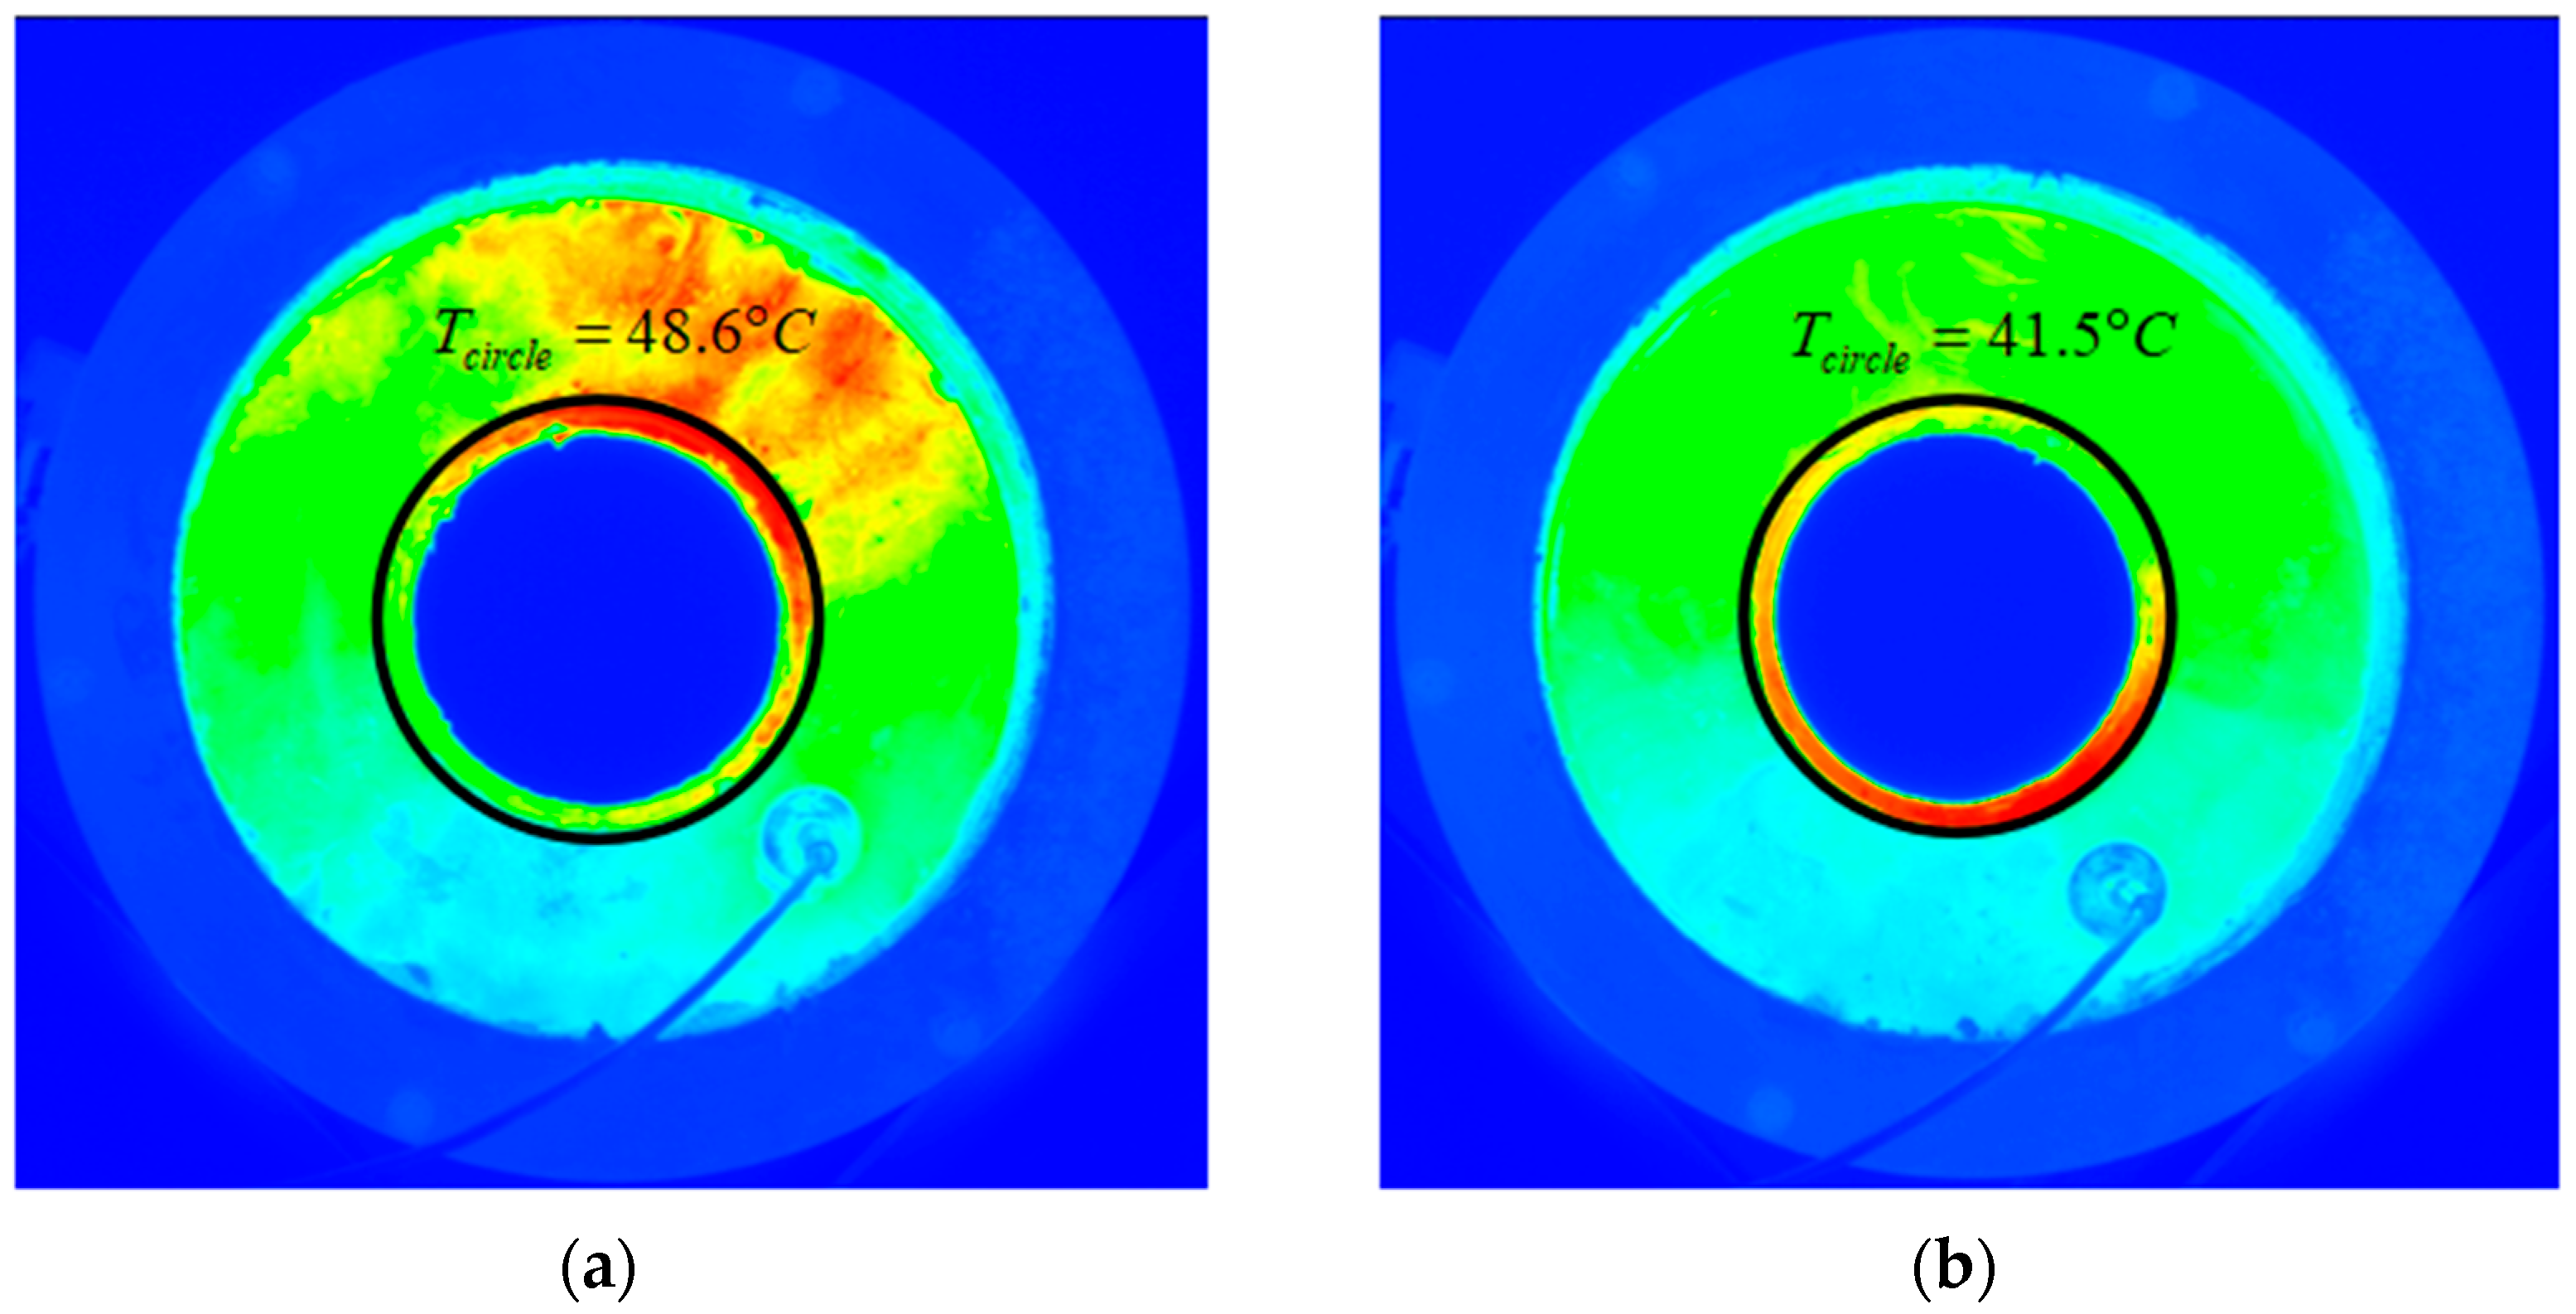
Figure 13.
Comparison of temperature rise and the steady state time.
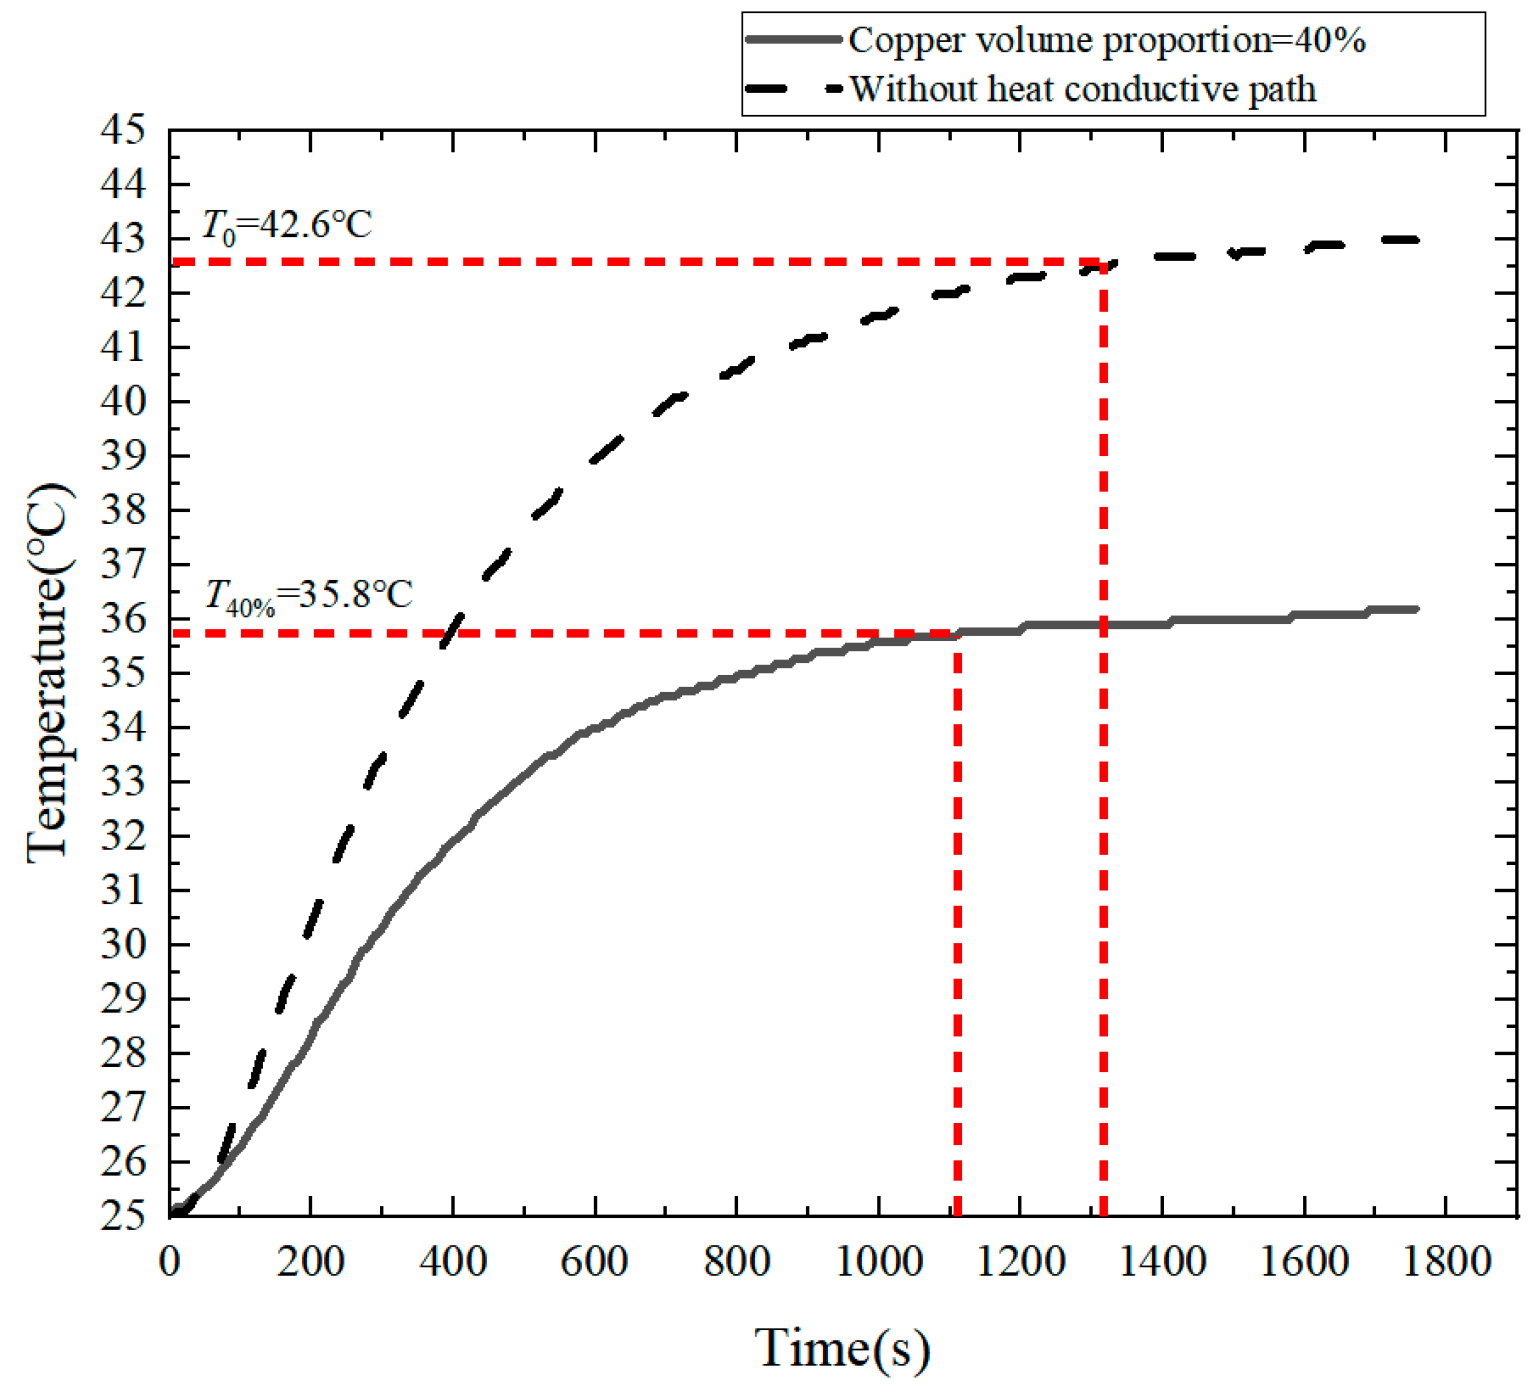
Figure 14.
Temperature rise of heat conductive paths with different copper volume proportion based on IPTO algorithm.
Figure 14.
Temperature rise of heat conductive paths with different copper volume proportion based on IPTO algorithm.
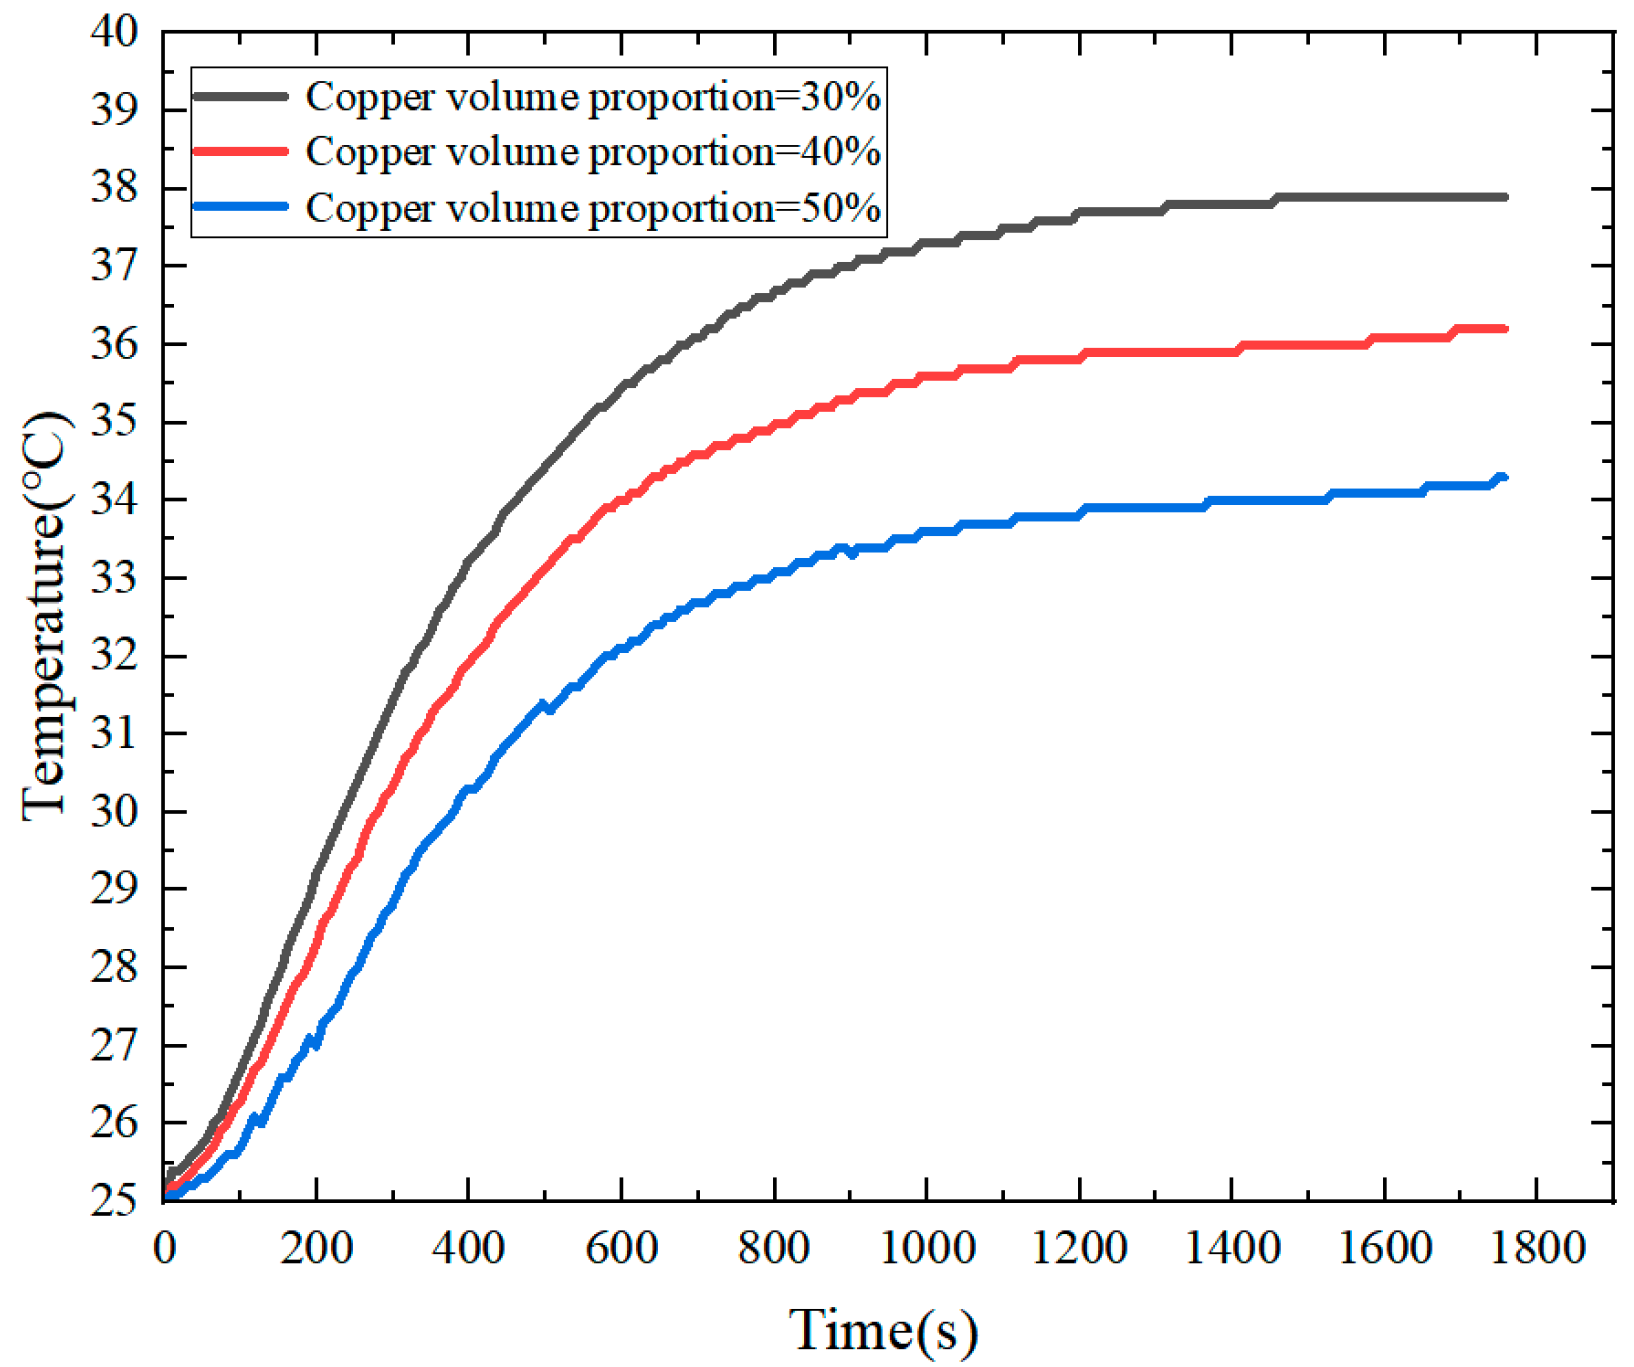
Figure 15.
Temperature rise of heat conductive paths with different copper volume proportion based on IPTO algorithm: (a) Copper volume proportion of 30%; (b) Copper volume proportion of 50%.
Figure 15.
Temperature rise of heat conductive paths with different copper volume proportion based on IPTO algorithm: (a) Copper volume proportion of 30%; (b) Copper volume proportion of 50%.
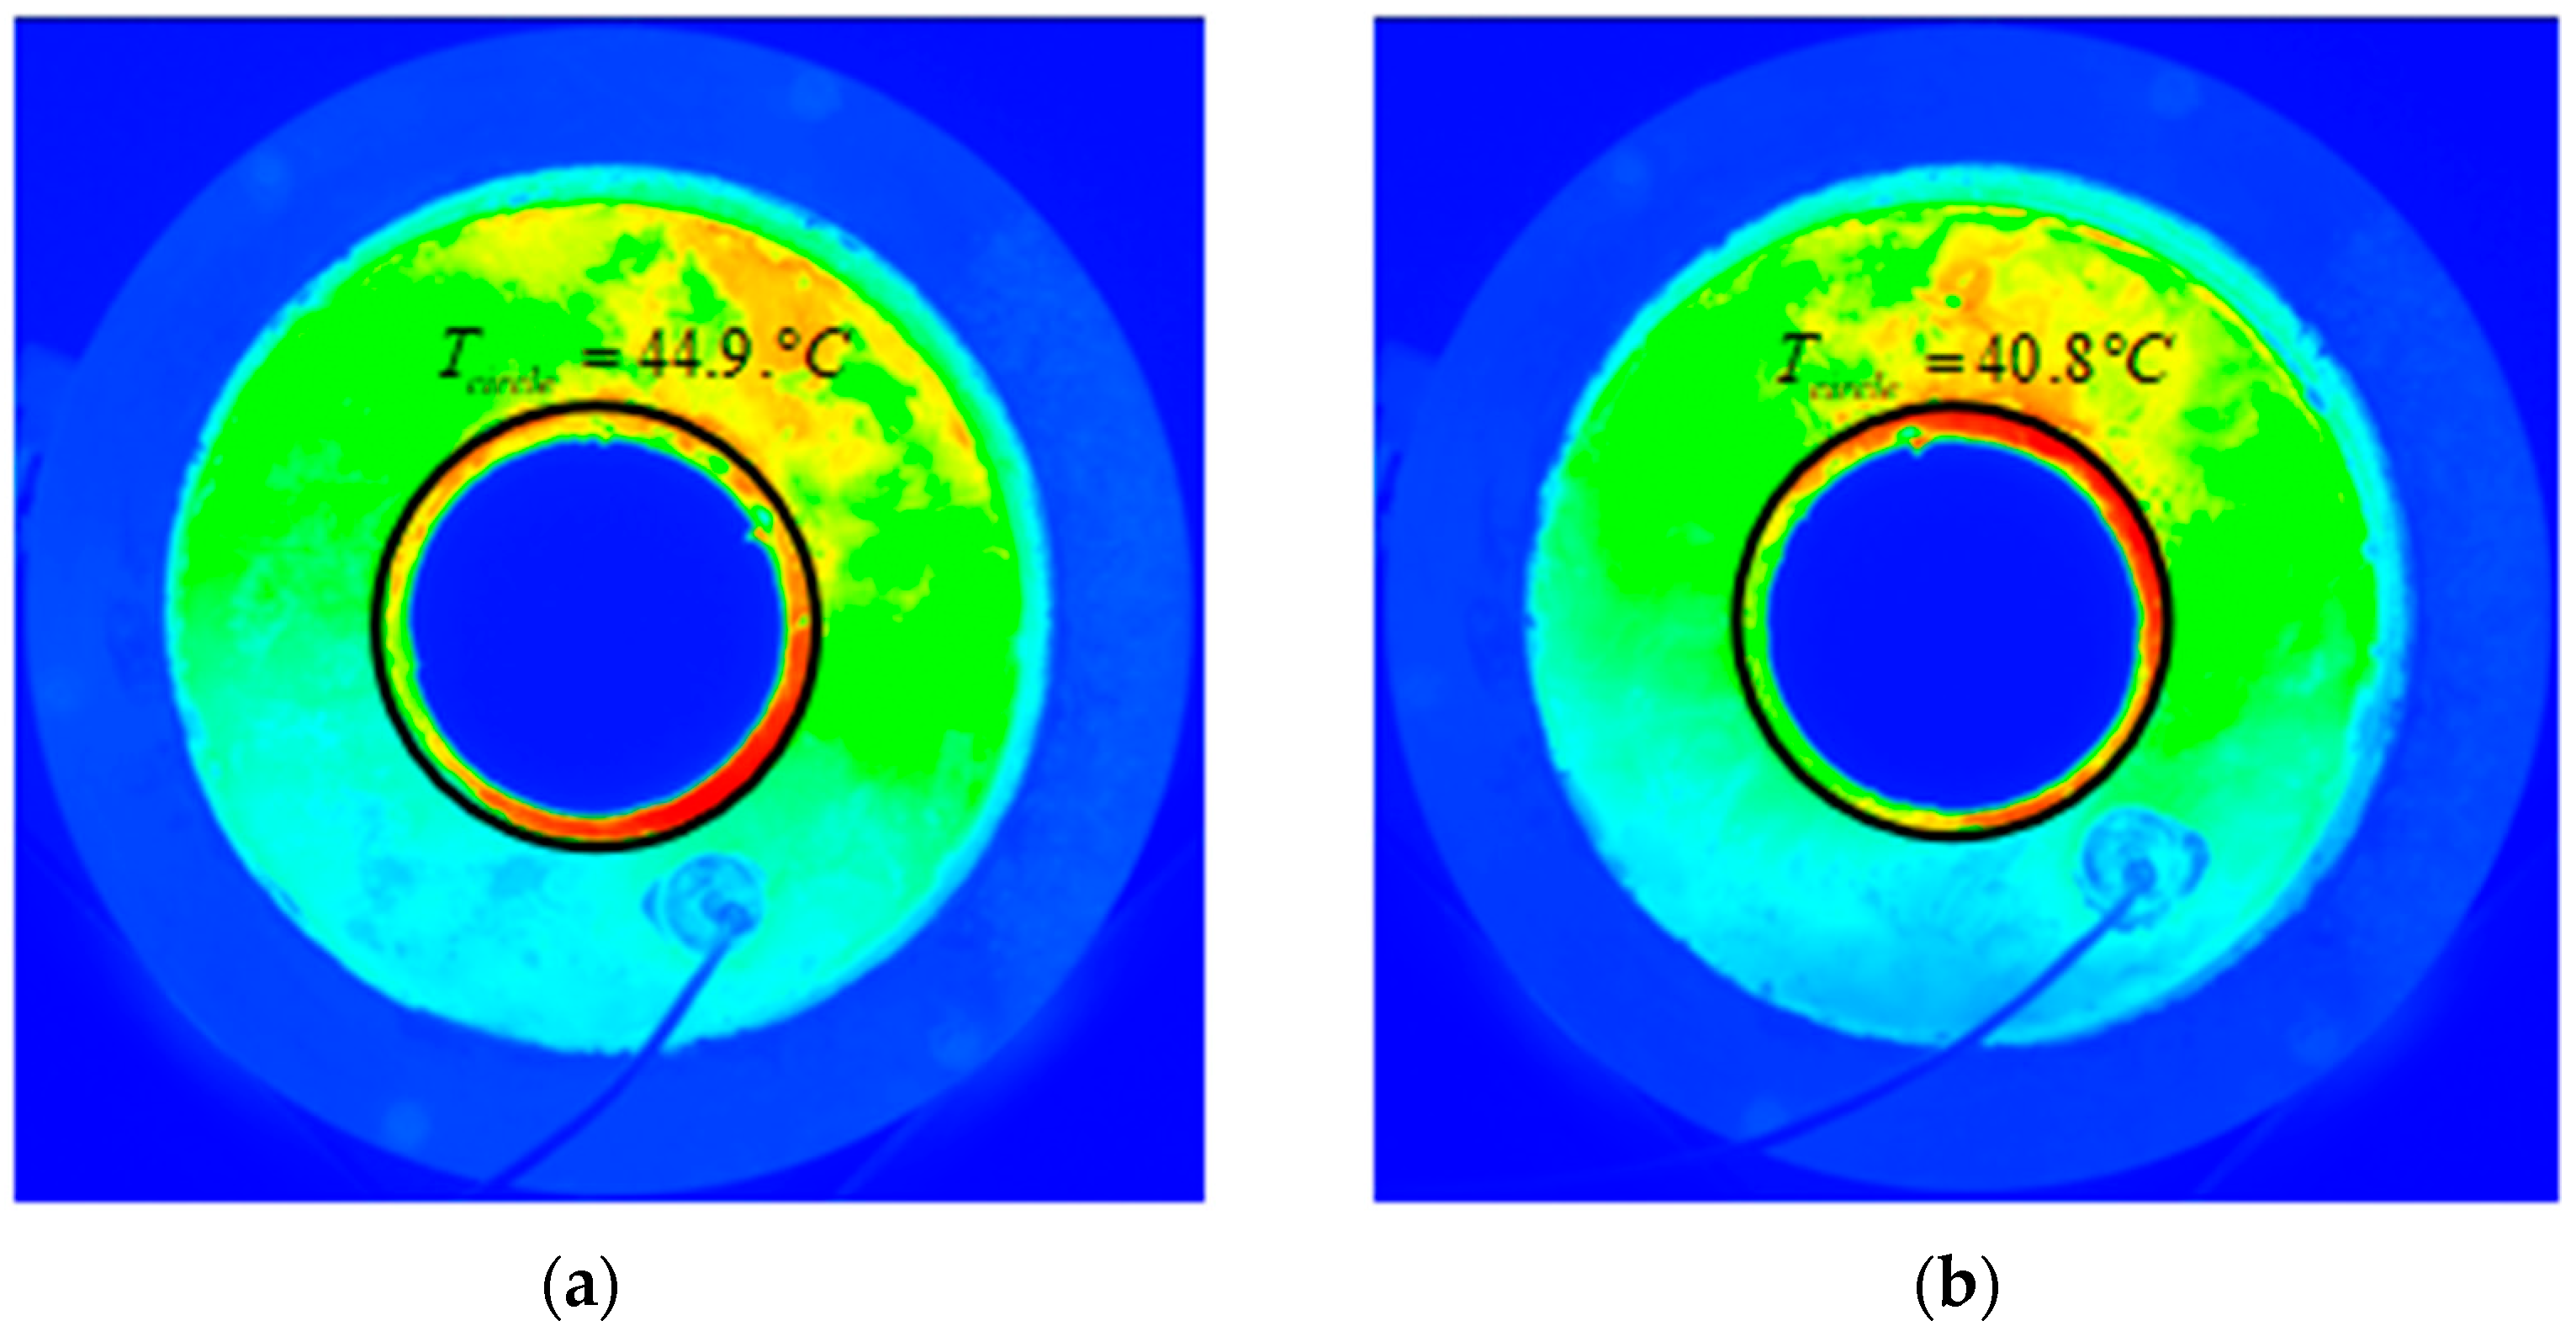
Figure 16.
Test diagram of disc assembly for air cooling test.
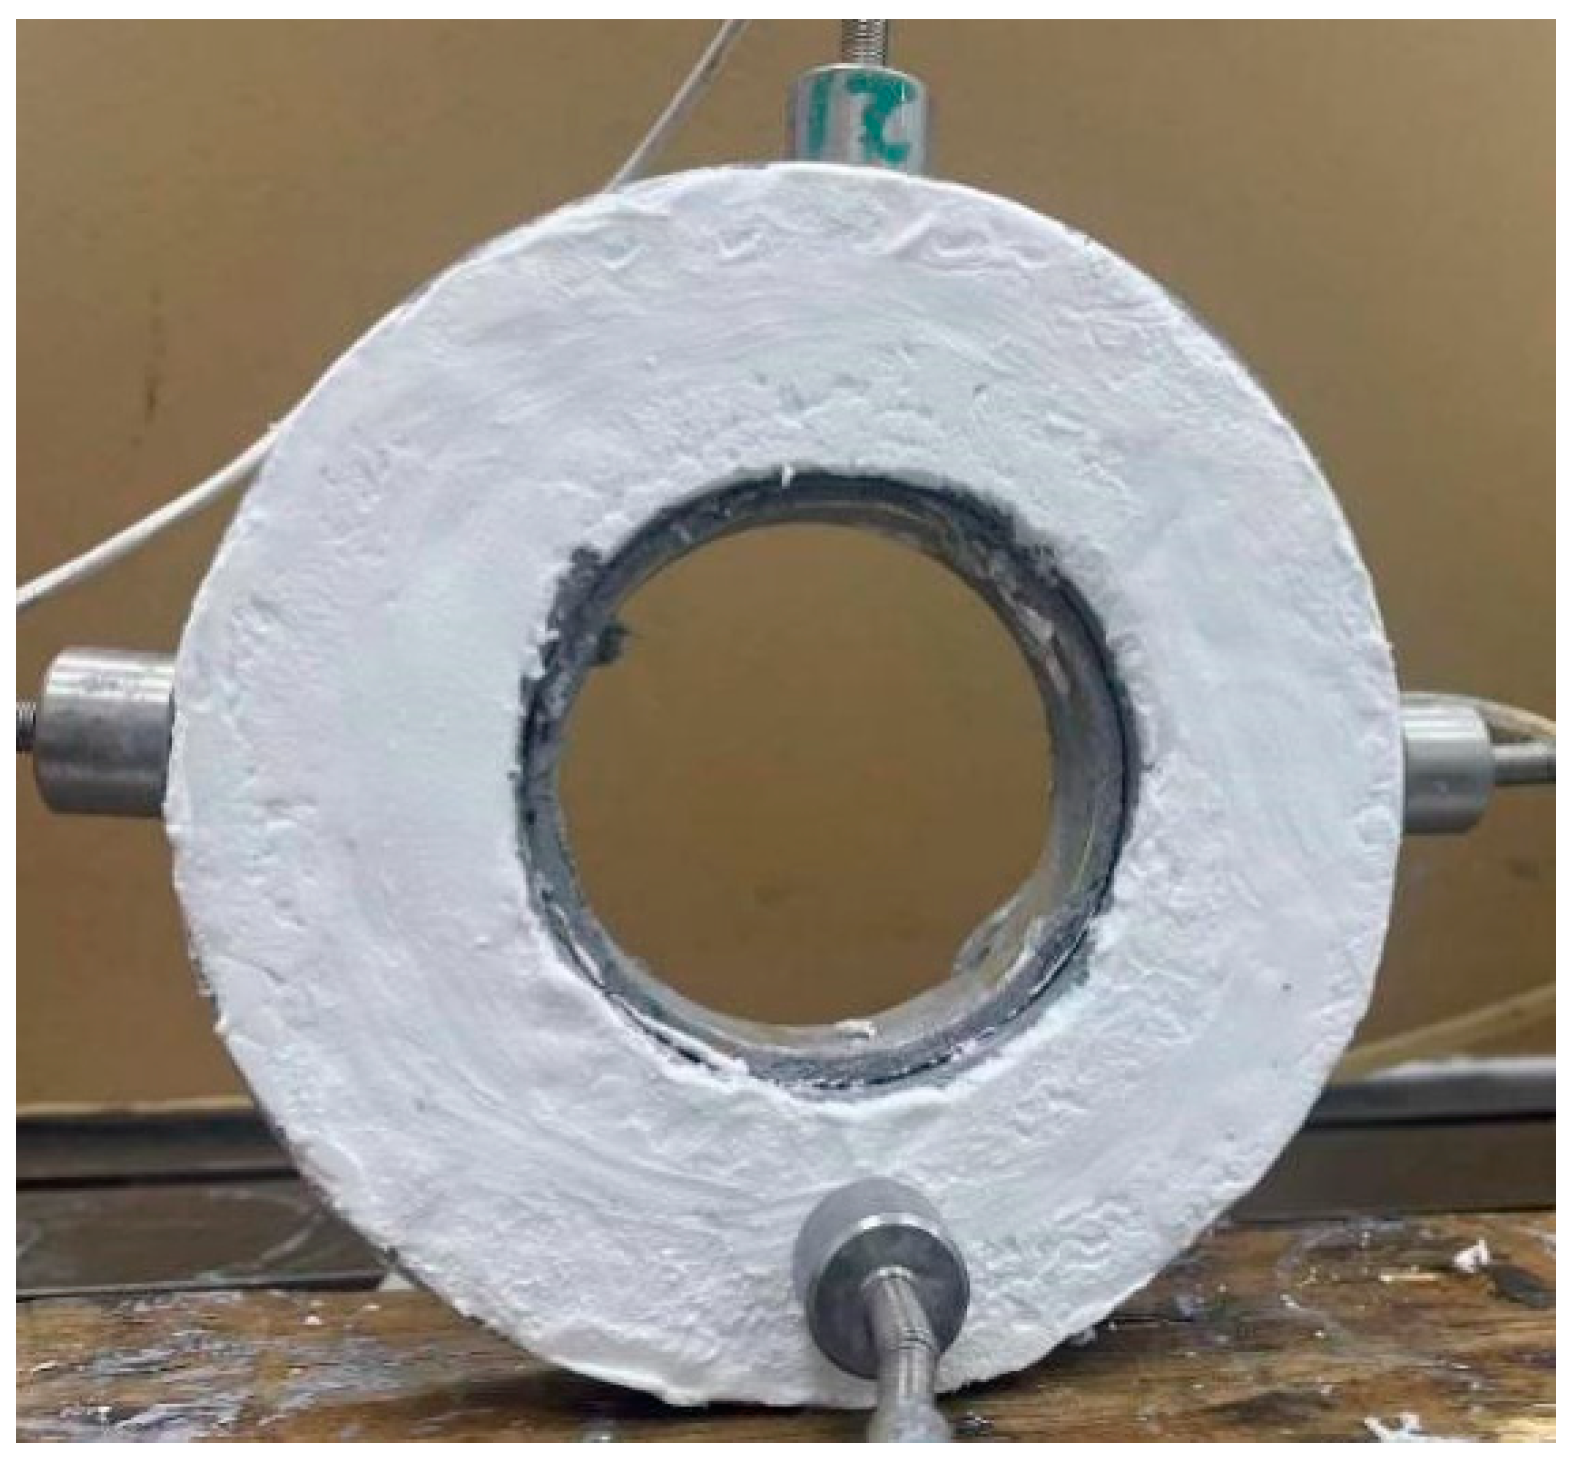
Figure 17.
Temperature change curve of the front end of the disc.
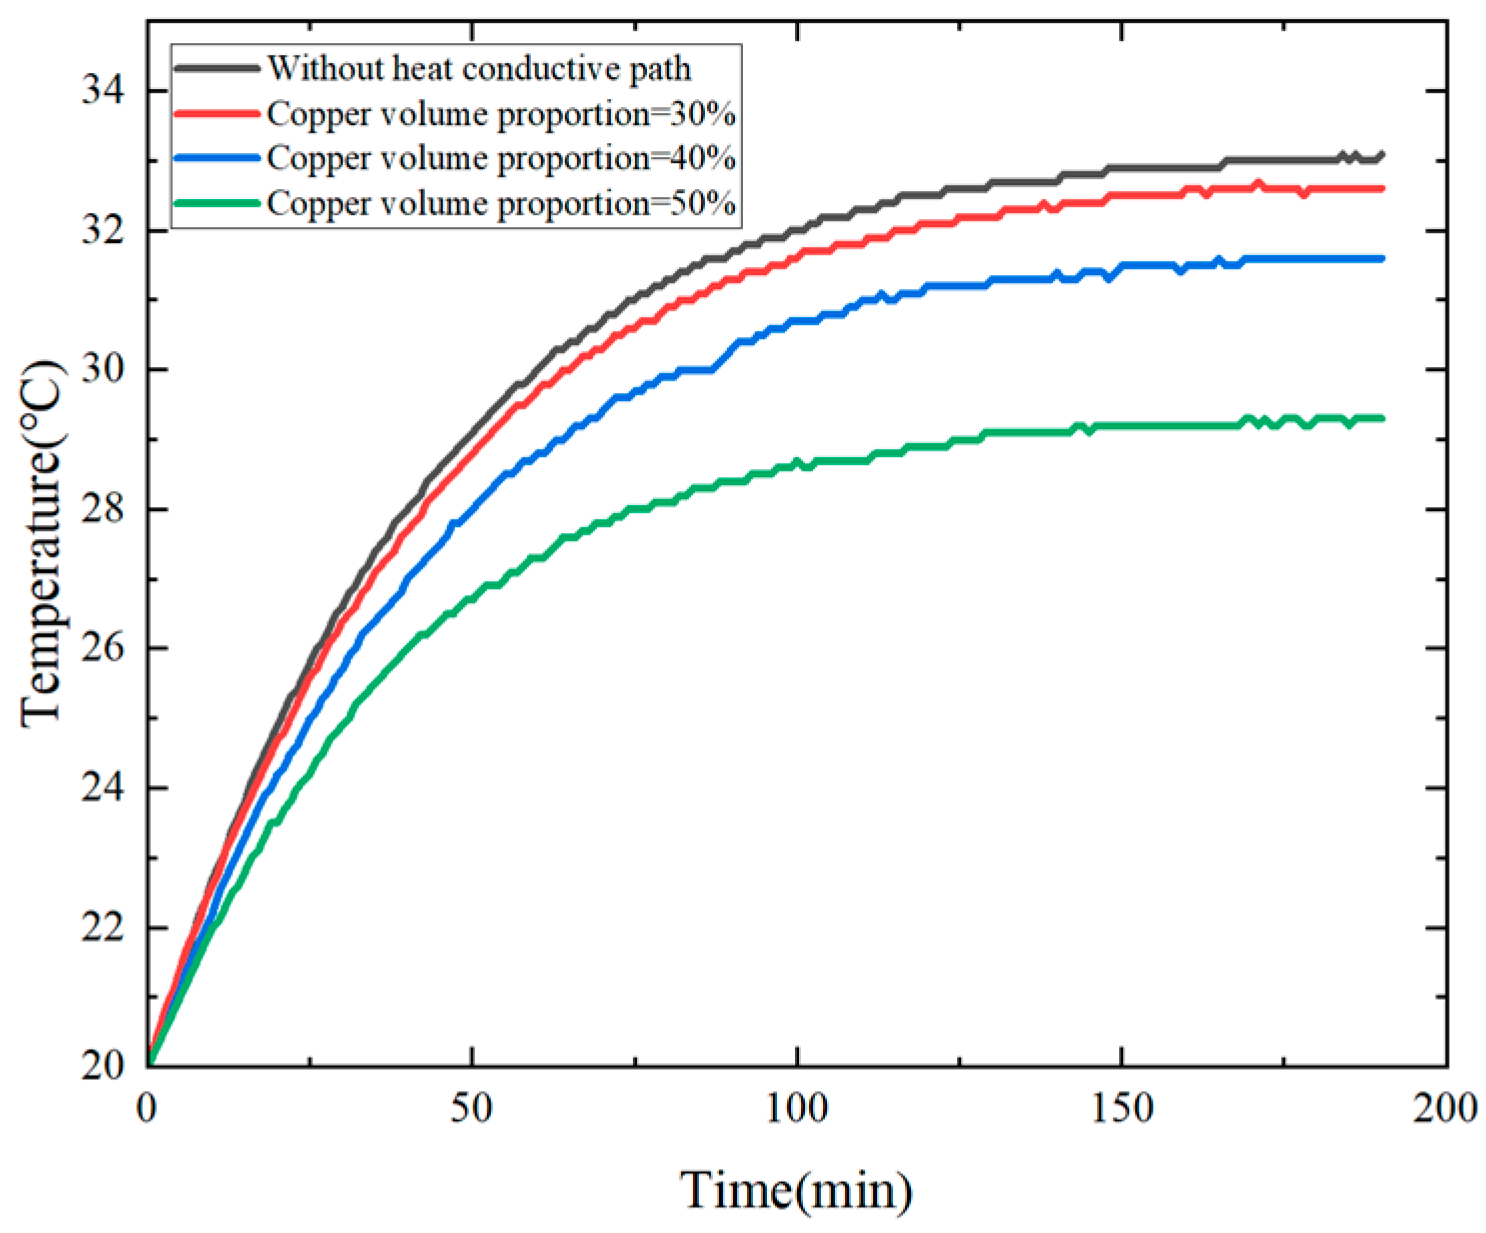
Figure 18.
Temperature data at steady state.


Table 1.
Parameters of angular contact ball bearing (7010C) r.
| Inner Diameter/d | Outer Diameter/D | Width/B | Highest Running Speed (Oil Lubrication) | Weight | C0r |
|---|---|---|---|---|---|
| 50 mm | 80 mm | 16 mm | 17,700 r/min | 0.259 kg | 21.9 kN |
Table 2.
Structural size and material parameters.
| Thickness d | Inner Radius r1 | Outer Radius r2 | Steel Thermal Conductivity k0 | Steel Thermal Conductivity k1 |
|---|---|---|---|---|
| 0.032 m | 0.08 m | 0.04 m | 50 W·m−1K−1 | 401 W·m−1K−1 |
Table 3.
FLIR infrared thermal imager parameters.
| Infrared Resolution | Measuring Range | Accuracy | Thermal Sensitivity | Frame Rate (Full Frame) | Integration Time (at the Lowest Frame Rate) |
|---|---|---|---|---|---|
| Minimum 640 × 512 | 4–1500 °C | ±1 °C or 1% | <25 mK | >145 Hz | <2 μs |
Table 4.
Heating ring parameters.
| Width d | Inner Radius | Outer Radius | Maximum Power | Material |
|---|---|---|---|---|
| 0.032 m | 0.04 m | 0.035 m | 650 W | Steel (Heating coil inside it) |
Table 5.
PID temperature control box parameters.
| Input Voltage | Temperature Sensor | Temperature Range | Ambient Temperature | Output Load |
|---|---|---|---|---|
| AC 220 V | Accuracy ± 0. 5% | 0–600 °C | 0–55 °C | 100–3600 W |
Disclaimer/Publisher’s Note: The statements, opinions and data contained in all publications are solely those of the individual author(s) and contributor(s) and not of MDPI and/or the editor(s). MDPI and/or the editor(s) disclaim responsibility for any injury to people or property resulting from any ideas, methods, instructions or products referred to in the content. |
© 2023 by the authors. Licensee MDPI, Basel, Switzerland. This article is an open access article distributed under the terms and conditions of the Creative Commons Attribution (CC BY) license (https://creativecommons.org/licenses/by/4.0/).
Share and Cite
MDPI and ACS Style
Li, Y.; Liu, Z.; Li, L.; Tian, J.; Hou, Z.; Zhao, W.; Wu, W. Test and Analysis of the Heat Dissipation Effect of the Spindle Heat Conductive Path Based on the IPTO Algorithm. Processes 2024, 12, 4. https://doi.org/10.3390/pr12010004
AMA Style
Li Y, Liu Z, Li L, Tian J, Hou Z, Zhao W, Wu W. Test and Analysis of the Heat Dissipation Effect of the Spindle Heat Conductive Path Based on the IPTO Algorithm. Processes. 2024; 12(1):4. https://doi.org/10.3390/pr12010004
Chicago/Turabian StyleLi, Yang, Zhongting Liu, Lei Li, Jingyao Tian, Zhaoyang Hou, Wanhua Zhao, and Wenwu Wu. 2024. "Test and Analysis of the Heat Dissipation Effect of the Spindle Heat Conductive Path Based on the IPTO Algorithm" Processes 12, no. 1: 4. https://doi.org/10.3390/pr12010004
Note that from the first issue of 2016, this journal uses article numbers instead of page numbers. See further details here.