Article

Apple Pomace-Derived Cationic Cellulose Nanocrystals for PFAS Removal from Contaminated Water

1
Department of Chemical Engineering, SUNY College of Environmental Science and Forestry, Syracuse, NY 13210, USA
2
Department of Chemistry & Biomolecular Science, Clarkson University, Potsdam, NY 13699, USA
3
Department of Chemistry and Biochemistry, University of Texas at Dallas, Richardson, TX 75080, USA
4
Analytical and Technical Services, SUNY College of Environmental Science and Forestry, Syracuse, NY 13210, USA
*
Author to whom correspondence should be addressed.
These authors contributed equally to this work.
Processes 2024, 12(2), 297; https://doi.org/10.3390/pr12020297
Submission received: 5 January 2024 / Revised: 24 January 2024 / Accepted: 26 January 2024 / Published: 30 January 2024

Abstract

:
Per- and poly-fluoroalkyl substances (PFAS) are concerning contaminants due to their ubiquity, persistence, and toxicity. Conventional PFAS water treatments such as granular activated carbon are limited by low adsorption rates and capacities. Carbon-based nano-adsorbents with enhanced surface areas address these limitations but are hindered by their high cost and toxicity. Cellulose nanocrystals (CNC) are promising PFAS adsorbents due to sustainable sourcing, large surface areas, and amenable surface properties. In this study, CNC was synthesized from the agro-food waste, apple pomace (APCNC), and coated with Moringa oleifera cationic protein (MOCP) aqueous extract to produce MOCP/APCNC for the removal of perfluorooctanoic acid (PFOA) from water. APCNC and MOCP/APCNC were manufactured, characterized, and utilized in PFOA batch adsorption kinetics and equilibrium trials. APCNC was successfully produced from apple pomace (AP) and determined through characterization and comparison to commercial CNC (CCNC). APCNC and MOCP/APCNC exhibited rapid PFOA adsorption, approaching equilibrium within 15 min. MOCP coatings inverted the MOCP/CNC surface charge to cationic (−15.07 to 7.38 mV) and enhanced the PFOA adsorption rate (2.65 × 10⁻³ to 5.05 × 10⁻³ g/mg/s), capacity (47.1 to 61.1 mg/g), and robustness across varied water qualities. The sustainable sourcing of APCNC combined with a green surface coating to produce MOCP/CNC provides a highly promising environmentally friendly approach to PFAS remediation.

1. Introduction

Per- and poly-fluoroalkyl substances (PFAS) have been used extensively since the 1950s for various industrial and commercial applications [1]. The high durability and water solubility of PFAS cause aquatic environmental persistence [2]. PFAS is released into the environment through industrial discharges, landfills, and consumer products [3]. PFAS exposure, specifically to perfluorooctanesulfonic acid (PFOS) and perfluorooctanoic acid (PFOA), has been associated with cancer, immunotoxicity, liver damage, and neurodevelopmental effects [4]. These growing health concerns have stimulated national efforts to remove PFAS from drinking water. In March 2023, the Biden administration announced the first-ever national PFAS regulations mandating public water utilities to test the concentration levels for six different PFAS chemicals and warn the public if these levels exceed the set limits (four parts per trillion (ppt) for PFOA). Increased awareness of the presence and risks of PFAS-contaminated water has spurred the development of PFAS remediation technologies.
Various technologies have been investigated for aqueous PFAS remediation. There is an urgent need to develop scalable, cost-effective, and sustainable PFAS water treatments. Adsorption technologies using activated carbon, biomaterials, minerals, ion exchange resins, and nanomaterials are widely explored [5,6,7]. Granular activated carbon (GAC) and anion exchange resins (AEX) are the most common adsorbents because of high removal efficiencies due to elevated specific surface areas [8]. Adsorption is used for PFAS-contaminated water due to low energy demand, simple operation, and economic feasibility [9]. Nanomaterials are excellent adsorbents due to their high specific surface area and reactivities [10,11]. However, the implementation of nanomaterials to remove PFAS is hindered by high costs, toxicities, and low biodegradability [12]. Cellulose nanocrystals (CNC) represent a sustainable alternative with a comparatively negligible carbon footprint and toxicity [13]. CNCs have unique mechanical, optical, and chemical properties, including high surface area, high aspect ratio (lengths from 150–300 nm and widths from 5–10 nm), and modifiable surface groups that make them attractive water treatment [14].
While wood is the most common source material for CNC, alternatives such as agro-food processing waste can also be used to lower the production cost and simultaneously address the issue of waste management for agro-food processing industries [15]. Several million tons of organic waste and low-value co-products are generated annually by agro-food industries. Most of these streams are rich in carbohydrates, proteins, and other nutrients but are currently underutilized. Conventionally, these streams are used as animal feed or are disposed of at landfills [16]. Disposal of these waste streams is an economic burden to food industries and at the same time causes several environmental problems, such as greenhouse gas emissions and groundwater contamination. These waste streams can be processed using a biorefinery approach where the cellulose fraction can be used for CNC production and the remaining fractions can be used for other applications. This provides a low/zero cost feedstock for CNC production, economic benefits to the industry, and addresses environmental issues associated with waste disposal [17].
Apple pomace (AP), a waste stream produced from the processing of apples into juices, ciders, and jellies, is a promising feedstock for CNC production. AP consists of the left-over seeds, stems, skins, and pulp from the juicing process and contains up to 25% cellulose [18]. AP accounts for up to 30% of the input apple mass and only about 20% of pomace is used for animal feed; the remainder is sent for composting [16]. A significant cellulose content in AP makes it a cost-effective substrate for CNC production, which can be used for aqueous PFAS remediation in an environmentally friendly manner. Like other cellulosic nanomaterials, APCNC derived from sustainable resources (AP) tends to be biodegradable. When APCNC is used in PFAS remediation, it can break down naturally over time, minimizing the persistence of materials in the environment. Sustainable sourcing of AP also involves practices that reduce the carbon footprint of the entire supply chain. This includes using eco-friendly cultivation methods, minimizing energy-intensive processing, and opting for transportation methods with lower emissions. A lower carbon footprint of APCNC further contributes to the overall environmental sustainability of PFAS remediation.
To enhance PFAS removal capacity, CNC surfaces are grafted or coated with synthetic chemicals, reducing material sustainability, and increasing material costs and toxicity. For water treatments, CNC surface modifications enhance the electrostatic affinity of the targeted pollutant to the adsorbent. While synthetic coatings are highly effective, more sustainable and cost-effective CNC surface modification agents are needed. Here, PFAS retention on CNC derived from AP (APCNC) was tested. In a novel approach, the surface charge of APCNC was inverted using Moringa oleifera cationic protein (MOCP) extracted from Moringa oleifera (MO) seeds as a sustainable CNC coating. The MOCP non-covalently bonded with the negative surface charges (hydroxyl and sulfonate groups) present in APCNC, making the MOCP-coated APCNC adsorbent (MOCP/APCNC) cationic. The cationic surface charge of MOCP/APCNC adsorbent induces electrostatic interactions between the targeted PFAS and adsorbent during water treatment. Previous studies reported the use of MOCP in decentralized water treatments as a cationic coagulant to reduce turbidity and remove bacteria [19]. Unlike conventional synthetic cationic CNC coating agents, MOCP is naturally occurring and biodegradable. This study investigates the application of MOCP coatings onto APCNC for PFAS remediation. The specific objectives of this study were to synthesize APCNC from AP, functionalize APCNC with MOCP extract to produce MOCP/APCNC, and characterize the batch adsorption behavior of PFOA onto APCNC and MOCP/APCNC at various environmental conditions.
The novelty of the study is the demonstration of nanocellulose-based adsorbents for PFAS remediation. Fast PFAS uptake at high capacities alongside sustainable sourcing makes CNC-based adsorbents highly competitive against existing technologies. This was also the first-ever demonstration of MOCP coatings on nanocellulose to enhance target solute affinity, highlighting a safe, sustainable, and environmentally friendly alternative to synthetic cationic polyelectrolyte coatings. MOCP coatings were shown to enhance PFOA surface retention, exhibiting the potential for bio-based adsorbent coatings to enhance PFAS treatment efficiencies. APCNC was produced from AP following a protocol that can be successfully applied to a wide variety of agro-food waste products, enabling potential large-scale implementation with diverse feedstock for PFAS remediation in an environmentally friendly way.

2. Materials and Methods

2.1. Materials

AP was procured from Beak and Skiff 1911 Distillery in Lafayette, NY. AP was dried in a convection oven set at 50 °C to reduce the moisture below 10%. Dried AP was ground to pass through a 10-mesh (2 mm sieve opening) using a Wiley mill. AP powder was stored at 4 °C until further processing. MO seeds were obtained from Vedic Secrets (East Brunswick, NJ, USA). Commercial cellulose nanocrystals (CCNC) in powder form were obtained from CelluForce (Windsor, QC, Canada).
Reagent-grade hydrochloric acid (HCl), sodium hydroxide (NaOH), sodium hypochlorite (NaOCl), and sulfuric acid (H2SO4) were purchased from Sigma-Aldrich (St. Louis, MO, USA). Perfluorooctanoic acid (PFOA), 96% purity, CAS No. 335-67-1, was purchased from Sigma-Aldrich (St. Louis, MO, USA) and prepared into stock solutions using Milli-Q water. Reagent-grade sodium chloride and humic acid were used to spike PFOA solution ionic strength and dissolved organic matter, respectively. Protein quantification was conducted using the Bradford protein assay (Bradford Reagent) with bovine serum albumin (BSA) standards purchased from Thermo Fisher Scientific (Waltham, MA, USA).

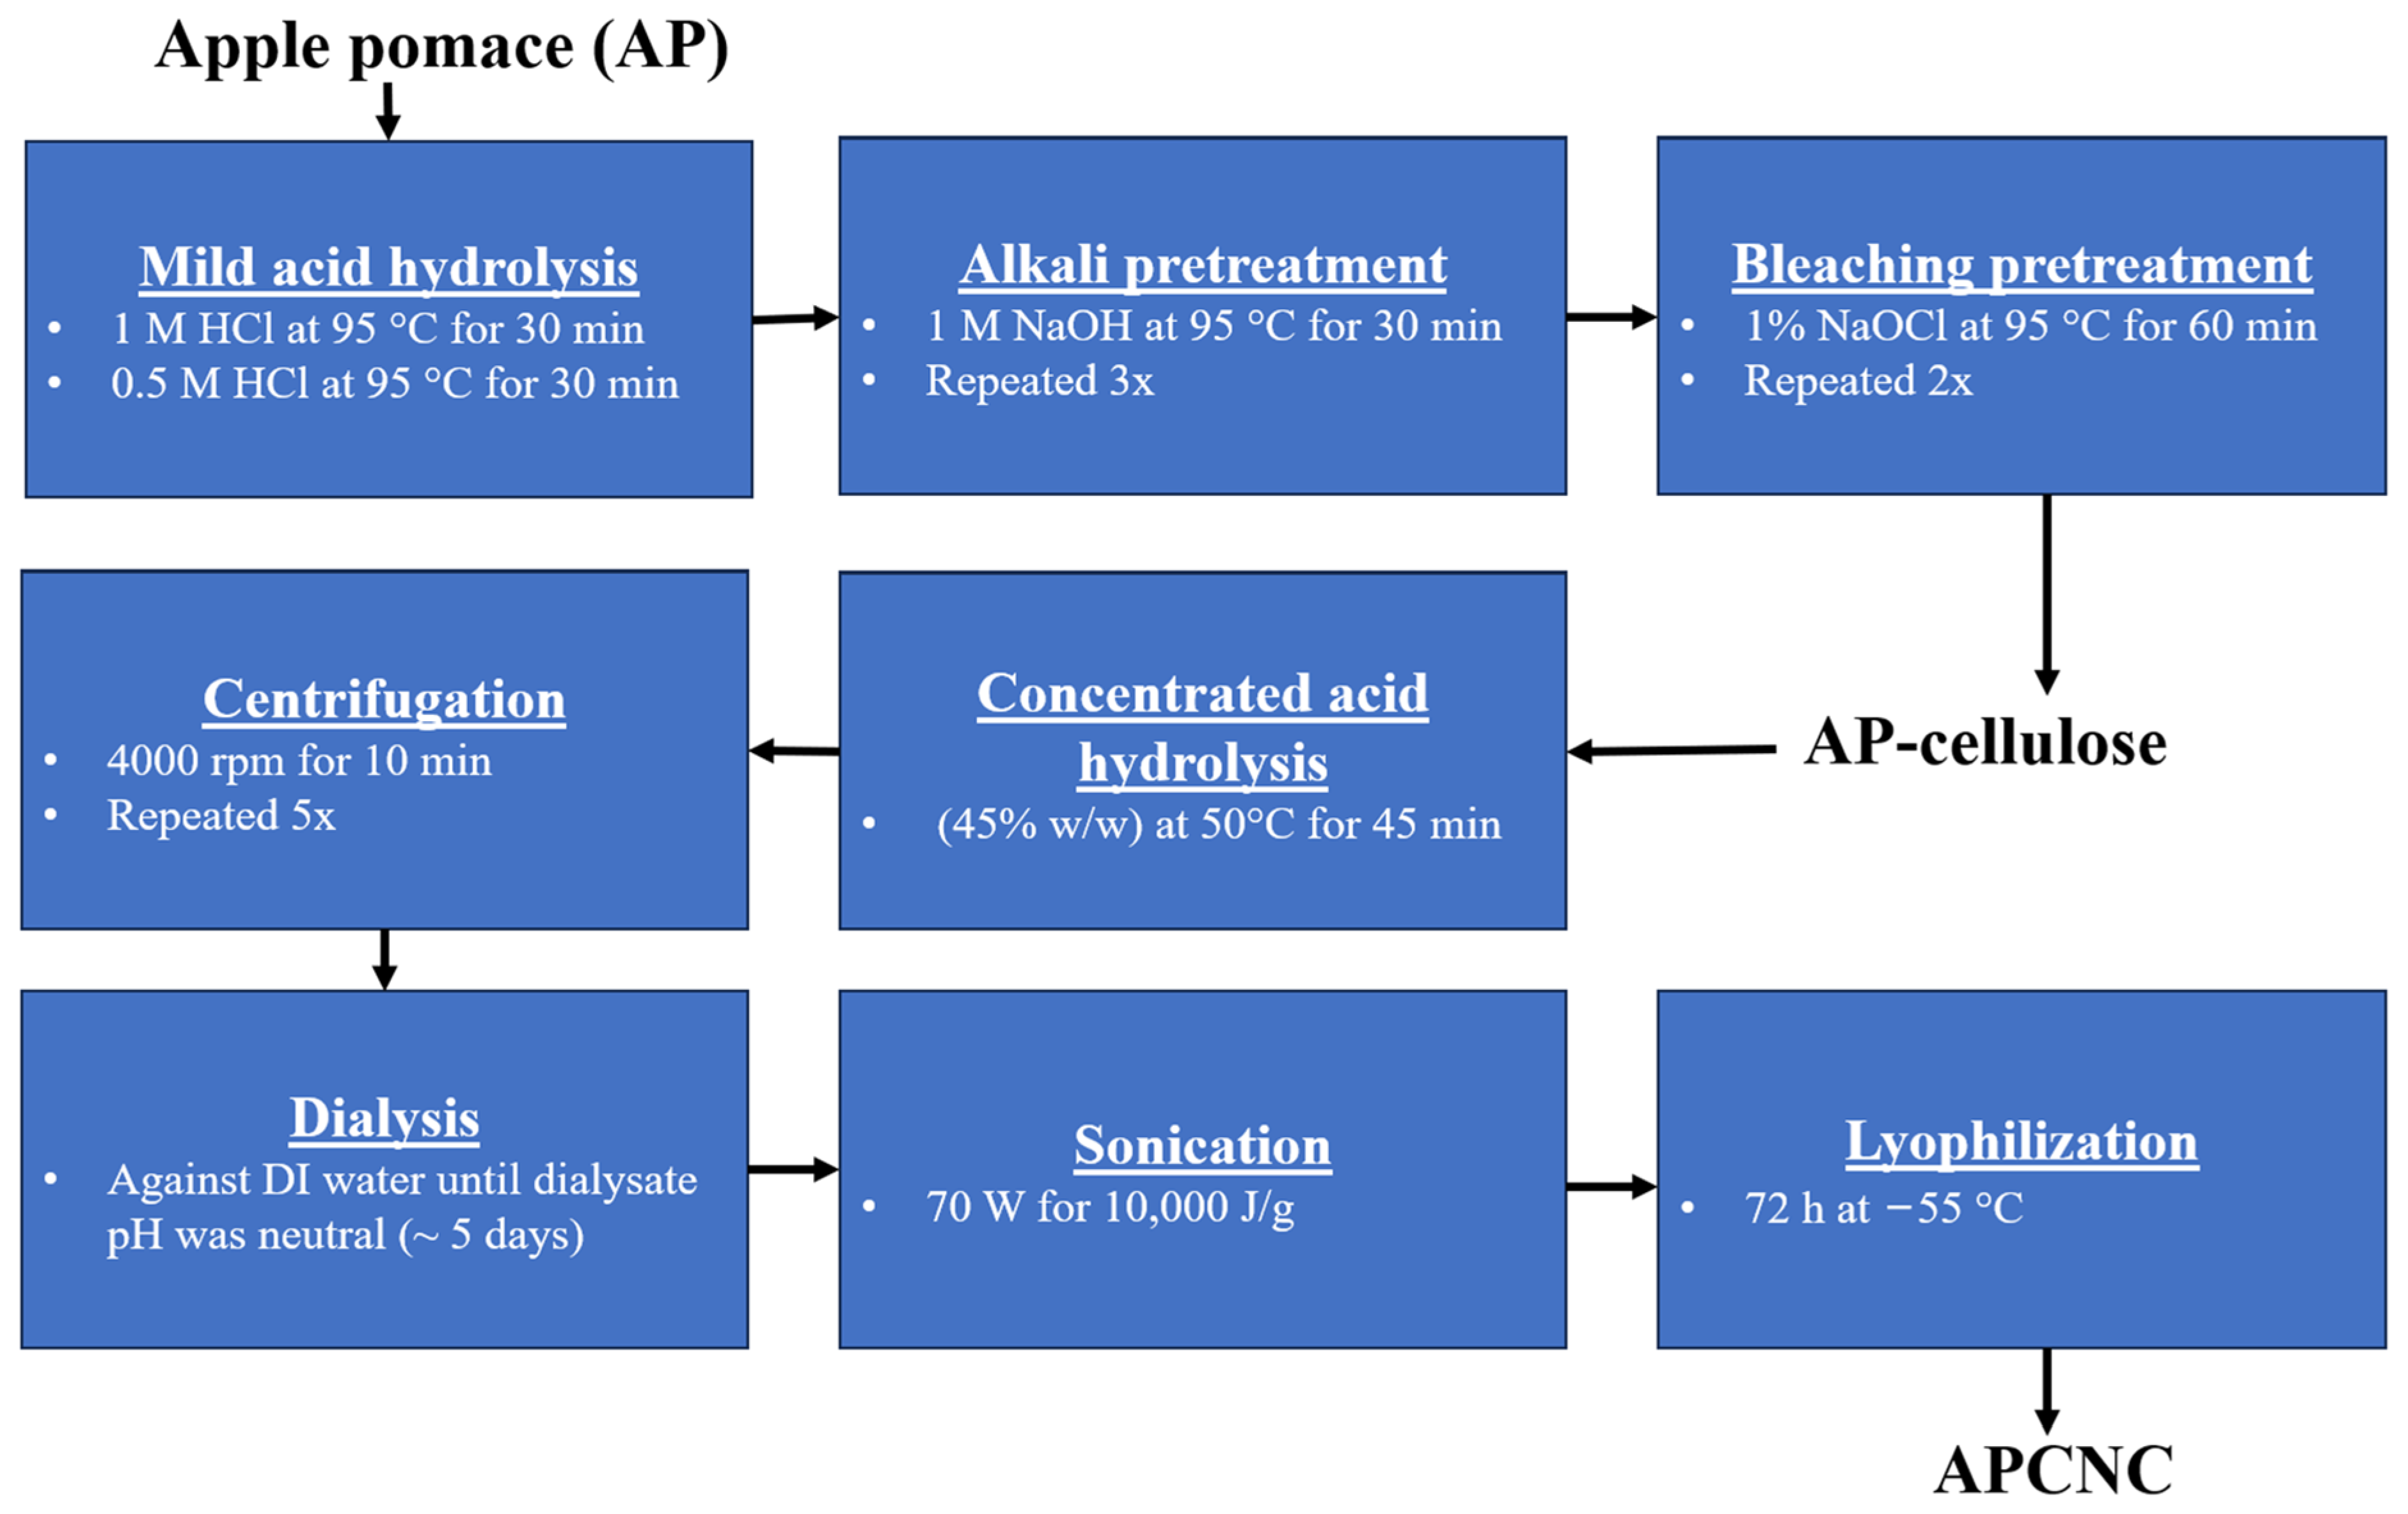
2.2. Isolation of Cellulose from AP

AP contains cellulose, hemicellulose, and lignin, along with soluble sugars, inorganics, extractives, and moisture. To synthesize CNC from AP (APCNC), cellulose was first isolated. To extract cellulose from AP, the protocols of Melikoğlu et al. (2020) and Szymanska-Chargot et al. (2019) were followed with small alterations [20,21]. An overall schematic for the extraction of cellulose and CNC from AP is given in Figure 1.
First, soluble sugars from milled AP were extracted using a hydrothermal washing step. In total, 100 g of dry-milled AP was added to 0.002 m3 of DI water heated to 95 °C and mixed for 30 min. The aqueous-extracted AP was recovered by vacuum filtration. The sugar content of the filtrate was determined using high-performance liquid chromatography (HPLC). Aqueous-extracted AP was subjected to two rounds of mild acid hydrolysis (1 M HCl followed by 0.5 M HCl held at 95 °C for 30 min, each) to remove acid-soluble hemicellulose and pectin. After mild acid hydrolysis, lignin and remaining hemicelluloses were removed from acid-pretreated AP by the alkali pretreatment step (1 M NaOH heated to 95 °C for 30 min, repeated three times). Finally, bleaching was conducted to remove residual lignin from alkali-pretreated AP (1% NaOCl heated to 95 °C for 60 min, repeated twice). The washed cellulose was dried for 24 h at 50 °C in a convection oven. Afterward, the final weight of AP-cellulose was measured to determine the overall yield.

2.3. Synthesis of APCNC from AP-Cellulose

The cellulose extracted from apple pomace was ground into a fine powder using a coffee grinder to increase the surface area available for the subsequent treatment. APCNC was produced following the protocol listed by Melikoğlu et al. (2019) [21]. AP-cellulose (10 g) was added to a 0.0002 m3 solution of H2SO4 (45% w/w) heated to 50 °C and mixed for 45 min. APCNC was removed from the acidic solution by a series of centrifugation and washing steps, followed by membrane dialysis (Figure 1). The neutralized suspension was placed in a beaker inside an ice bath and sonicated using a Misonix sonicator (Farmingdale, NY, USA) at 70% amplitude for 10,000 J/g [22], to disaggregate/fully disperse APCNC. Following sonication, the suspension was frozen at −20 °C overnight and then lyophilized at −55 °C for 72 h. The final weight of APCNC was measured to determine the extraction yield.

2.4. MOCP Extraction and Coating onto CCNC and APCNC

MO cationic protein (MOCP) aqueous extracts were coated onto APCNC to enhance PFOA removal efficiency by cationizing APCNC. The extraction procedure and process conditions were chosen based on previous studies using MO [23,24,25,26]. The MO seeds were manually dehulled, ground, and extracted in DI water. Jung et al. (2018) observed that the cationic charge of MOCP decreased with increasing extraction time [23]. Therefore, to maximize MOCP extract cationic charge, a quick extraction time of 5 min was applied in this study. After extraction, MOCP suspensions were clarified by sequential filtration through a glass fiber filter (1.5 μm) and a 0.2 μm cellulose acetate membrane [25]. APCNC or CCNC were added to MOCP extracts and mixed for 15 min, separated by centrifugation at 4000 rpm for 10 min, washed with DI water, re-separated by centrifugation to remove unbound MOCP, and lyophilized to recover MOCP/CCNC or MOCP/APCNC. No study has directly investigated the effect of MO extract loading mass on MOCP surface coating. In this study, loading ratios of 5–100 mg MO/mL demineralized (DI) water were applied. To coat APCNC, MOCP was extracted at the highest loading level of 100 mg/mL in 40 mL of DI water and coated onto APCNC, using the previously described method.

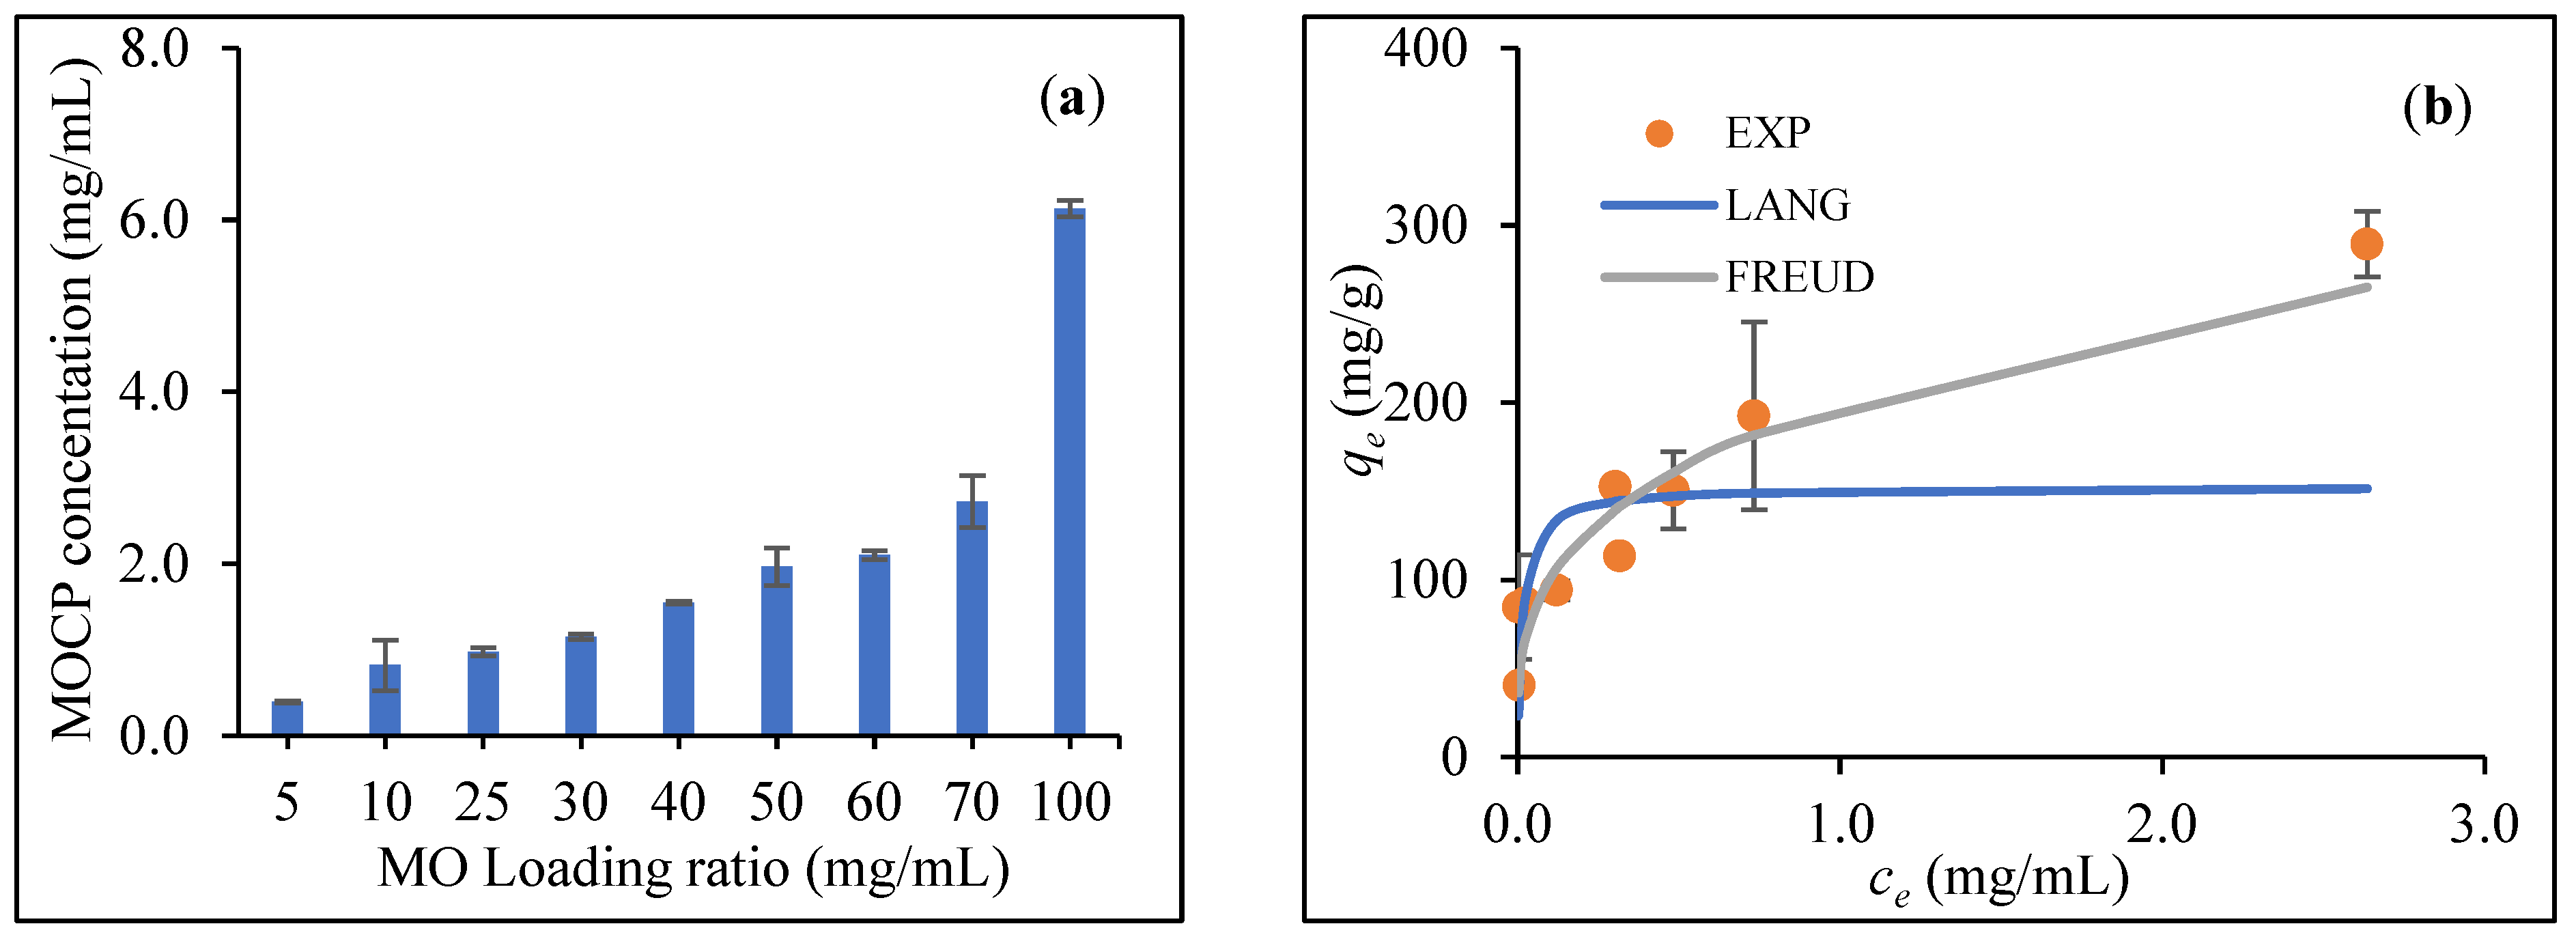
Analysis of the Equilibrium Uptake of MOCP onto CCNC

To investigate the effect of MOCP concentration on APCNC coating, a series of experiments were conducted using CCNC as a model substrate. MO seeds were extracted at loading ratios of 5, 10, 25, 30, 40, 50, 60, 70, and 100 mg MO/mL DI water. After clarification, the protein concentration of the suspension was analyzed. MOCP extracts (40 mL) from varying MO loading levels were introduced to 0.4 g of CCNC, mixed for 15 min, and separated following the previously described protocol. An aliquot of supernatant was taken to assess the final (equilibrium) solution concentration of MOCP after adsorption. Adsorption efficiency was quantified by the uptake ratio given in Equation (1).
q e = V ( c i c e ) m a d s
where the adsorption uptake ratio at equilibrium ( q e ) was calculated in terms of the solution volume ( V ), initial ( c i ) and equilibrium ( c e ) adsorbate concentrations, and adsorbent mass ( m a d s ). Initial and equilibrium MOCP extract concentrations were quantified using the Bradford assay [27].
Equilibrium MOCP adsorption onto CCNC was studied using the Langmuir and Freundlich equilibrium models. The Langmuir model assumes adsorbates and adsorbents interact in an ideal manner on a homogenous surface and in a reversible fashion. The Langmuir adsorption equilibrium equation and its linearized form are given by Equations (2) and (3), respectively.
q e = q m a x K L   c e 1 + K L c e
1 q e = 1 K L q m 1 c e + 1 q m
where  q m a x  is the maximum theoretical adsorption capacity and  K L  is the Langmuir equilibrium rate constant. The Freundlich model was developed to study adsorption on rough and multi-site surfaces by describing the degree of adsorbent surface heterogeneity. The Freundlich adsorption equilibrium model and its linearized form are given by Equations (4) and (5), respectively.
q e = K f C e 1 n
ln q e = ln K f + 1 n l n C e
where  K f  is the Freundlich equilibrium rate constant and the fitted constant  1 n  represents the degree of surface heterogeneity. Model constants were obtained by fitting the experimental data from MOCP adsorption onto CCNC to the linear form of adsorption isotherm Equations (3) and (5). Experimental MOCP/CCNC adsorption data were fitted to equilibrium models to predict the maximum adsorption capacity and equilibrium adsorption rate constant of MOCP onto CNC-based adsorbents.

2.5. Characterization of AP, AP-Cellulose, APCNC, and MOCP/APCNC

2.5.1. Chemical Composition of AP

The chemical composition (cellulose, hemicellulose, lignin, and extractives) of AP and AP-cellulose were analyzed following the NREL Laboratory Analytical Procedure [28]. The moisture and ash contents of AP were determined gravimetrically. The extractive content was determined using the Soxhlet extraction apparatus and samples were first extracted for 8 h using DI water, followed by 16 h using ethanol (95%). The extractive content was gravimetrically determined by the change in sample mass after extraction. Two-step sulfuric acid hydrolysis was conducted to quantify the acid-soluble lignin (UV absorbance at 205 nm), acid-insoluble lignin (gravimetric analysis), and structural sugars (HPLC analysis of the hydrolysate) in the samples [28].

2.5.2. HPLC Analysis

The sugar content of AP, AP-cellulose, and AP hydrothermal extract was determined by HPLC with HyperREZ™ XP Carbohydrate H + LC column (Thermo Fisher Scientific, MA, USA) at 50 °C with 5 mM sulfuric acid at 0.6 mL/min, the refractive index at 35 °C, and UV detection at 210 nm [29]. Glucose and xylose quantification were conducted through a comparison of the sample to the external standard peak areas.

2.5.3. Scanning Electron Microscopy (SEM)

The morphological/structural changes in AP through pretreatment and APCNC extraction from AP-cellulose were visually investigated by scanning electron microscopy (SEM) with a JSM-IT100 (JOEL, Tokyo, Japan). AP, AP-cellulose, and APCNC were dispersed into separate 0.1% DI water suspensions by sonication, deposited onto small circles of aluminum foil, and vacuum dried at 50 °C overnight [30]. Samples were initially sputter-coated with gold before imaging. A constant 11 mm working distance and high vacuum were maintained during the SEM analysis.

2.5.4. Fourier-Transform Infrared Spectroscopy (FTIR)

The surface chemical functional groups of AP, AP-cellulose, APCNC, MOCP/APCNC, and CCNC were analyzed by FTIR. FTIR was used to assess the effect of AP treatment on AP-cellulose composition and to compare the surface functional groups of CCNC, APCNC, and MOCP/APCNC. The FTIR spectra were obtained by a PerkinElmer Frontier (Waltham, MA, USA) using the attenuated total reflectance (ATR) technique operating between wavenumbers of 4000–500 cm−1. Samples were obtained after 64 scans.

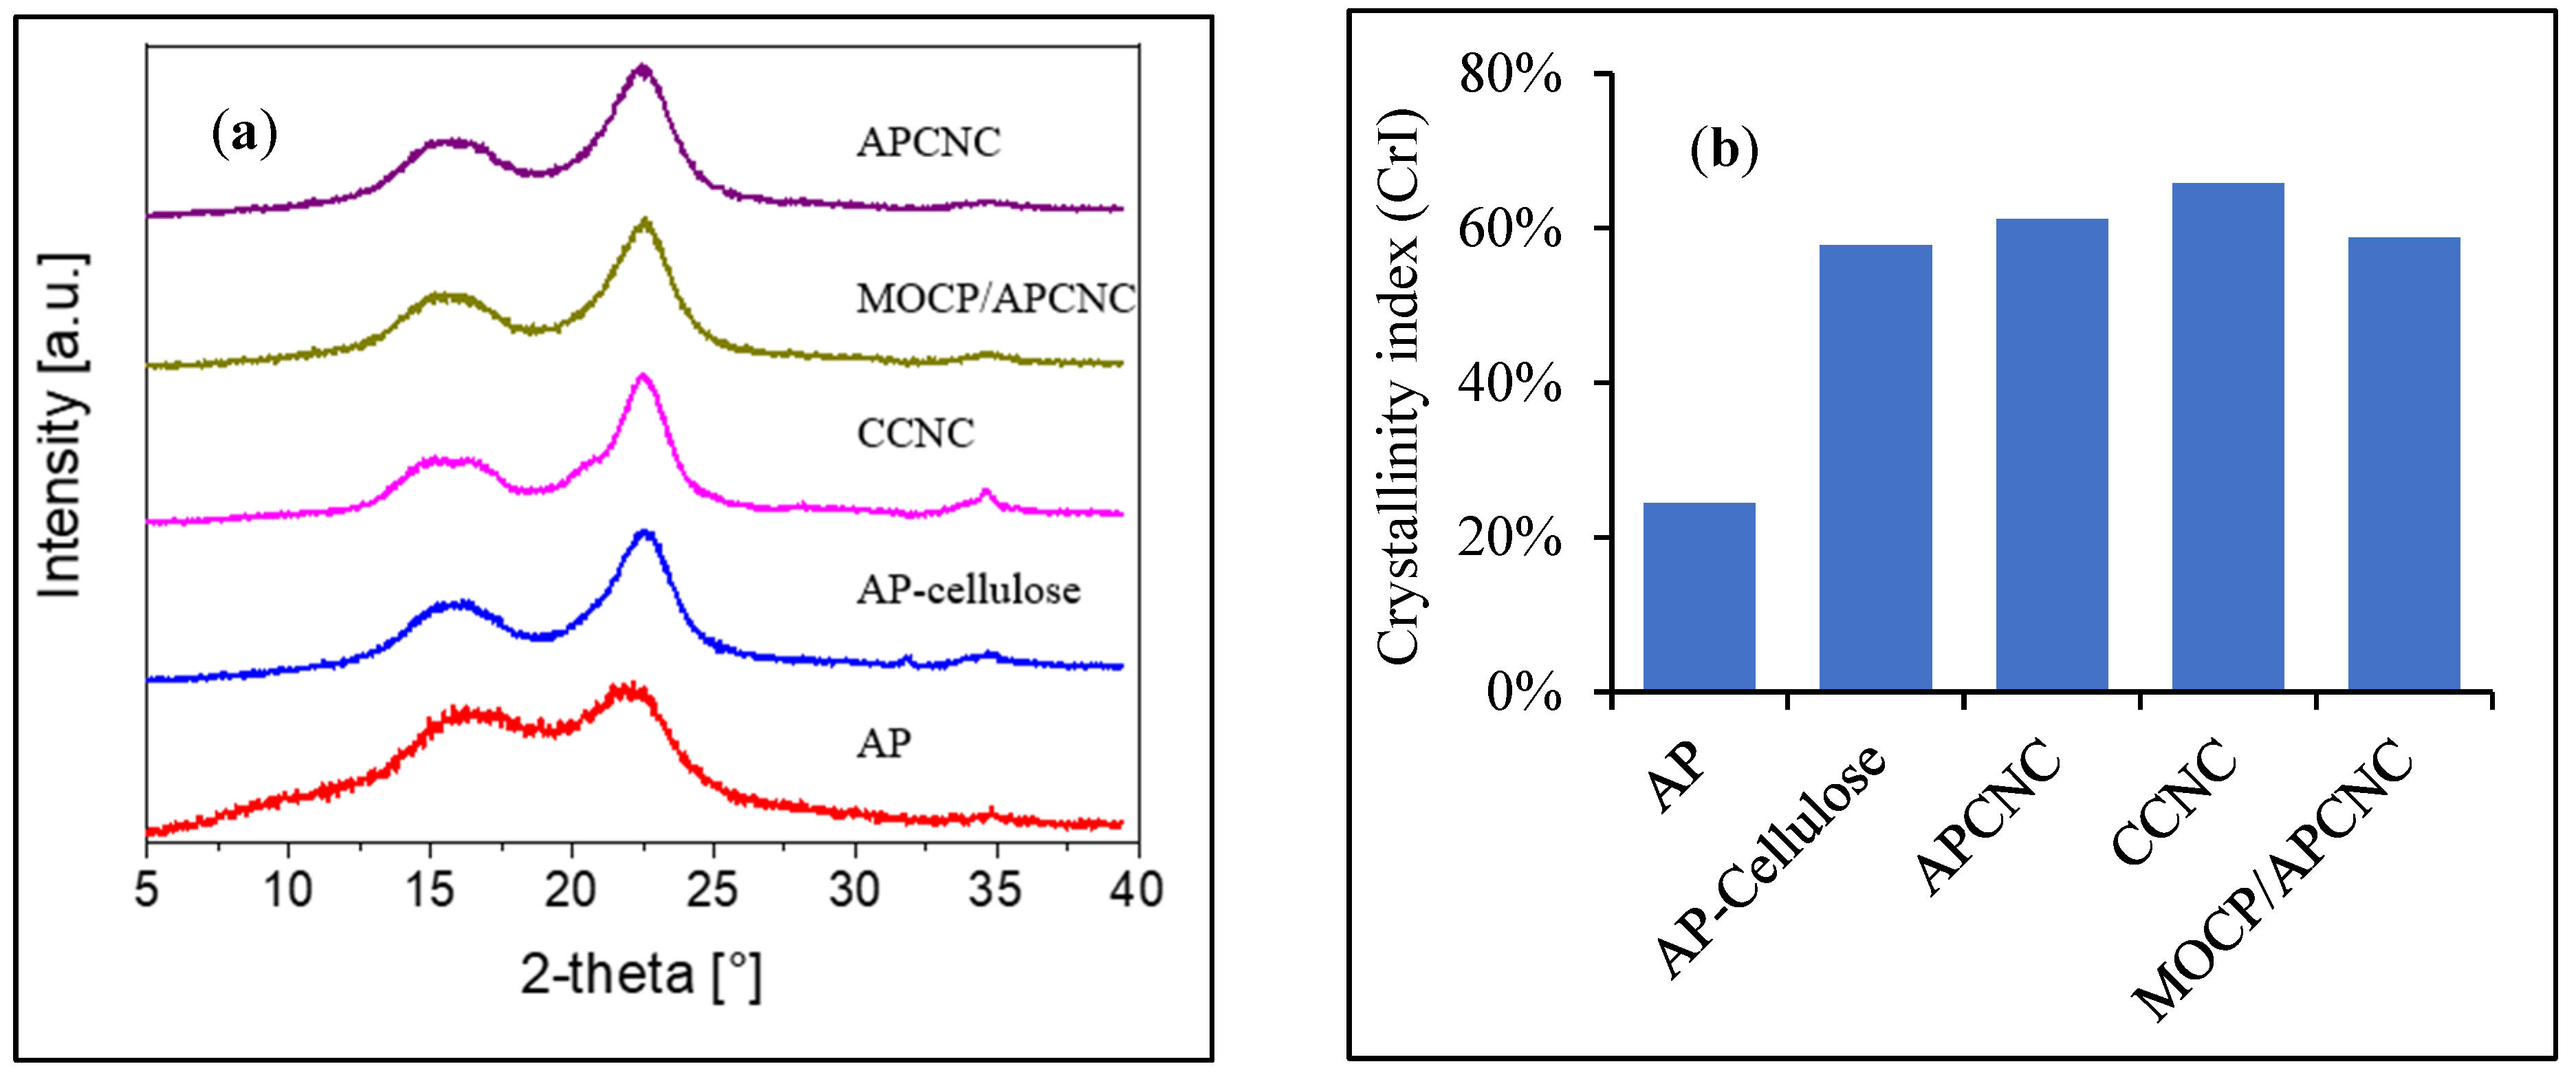
2.5.5. Powder X-ray Diffraction (PXRD)

The change in sample crystallinity was used to assess the efficacy of AP-cellulose and APCNC extraction. The X-ray diffraction patterns of AP, AP-cellulose, APCNC, MOCP/APCNC, and CCNC were obtained at room temperature using a D2 Phaser diffractometer (Bruker, Bremen, Germany). The instrument was equipped with a copper-sealed tube that emitted X-rays with a wavelength of 1.54178 Å. To conduct the analysis, powdered samples were evenly spread on low-background discs. The crystallinity index (CrI) was calculated from the ratio of the 002 peak height ( I 002 ) to the minimum height ( I A M ) [31].
C r I % = I 002 I A M I 002 100 %
I 002  is the maximum intensity of the (002) lattice diffraction peak and  I A M  is the intensity scattered by the amorphous regions of the sample.

2.5.6. Thermogravimetric analysis (TGA)

The thermal stabilities of AP, AP-cellulose, APCNC, MOCP/APCNC, and CCNC were tested by TGA using a Q50 thermogravimetric analyzer (TA Instruments, Newcastle, DE, USA). TGA was conducted under a nitrogen atmosphere with a temperature profile between 20–500 °C. Platinum crucibles were used for TGA in a dynamic nitrogen atmosphere (50 mL/min) under a rate of heating of 3 °C/min.

2.5.7. Brunauer–Emmet–Teller (BET) Surface

The specific surface areas of AP, AP-cellulose, APCNC, MOCP/APCNC, and CCNC were estimated through a collection of N2 adsorption isotherms using a Micromeritics ASAP2020 surface area and pore analyzer (Norcross, GA, USA) and application of the BET adsorption model. To obtain reasonable isotherms, samples were activated at 30, 50, or 120 °C for 10, 12, or 15 h before data collection. Adsorption under the pressure of 0.005–0.2 bar was used for the calculation of the BET surface area.

2.5.8. Dynamic Light Scattering (DLS) and Zeta Potential Analysis

The hydrodynamic diameter and zeta potential of APCNC, MOCP/APCNC, and CCNC were analyzed to confirm the nanoscale dimensions of APCNC and the cationic surface charge of MOCP/APCNC [32]. DLS estimated the hydrodynamic diameter and zeta potential analysis estimated the colloidal particle surface charge. DLS and zeta potential analysis was performed using a Malvern Zetasizer (Malvern, Malvern Hills, UK). Zeta potential was calculated by the Smoluchowski equation in Malvern software v7.01. Samples were dispersed in a 0.1% suspension through sonication for 10,000 J/g [22]. Before analysis, samples were filtered through a 0.2 μm cellulose acetate membrane to remove debris. DLS and zeta potential analysis was conducted in triplicate for each sample at 25 °C and around pH of 7.0.

2.6. Batch Adsorption on PFOA onto APCNC and MOCP/APCNC

PFOA was chosen as a model PFAS solute due to its widespread usage and its recognition as one the most studied/regulated PFAS species [33]. Stock solutions of 1500 ppm (mg/L) PFOA were prepared using Milli-Q water and stored at room temperature in a high-density polyethylene (HDPE) container. All experimental measurements were conducted with triplicate controls and samples. The adsorbent dosage in all experiments was 5 mg APCNC or MOCP/APCNC/mL of PFOA solution. For adsorption kinetics trials, the working volume was 40 mL Inside 50 mL centrifuge tubes, otherwise, the working volume was set to 1.6 mL inside 2 mL microcentrifuge tubes. After the introduction of the adsorbent into PFOA solutions, samples were mixed end-over-end in a rotating incubator set to 25 °C. At chosen time points, samples were collected for PFOA analysis through centrifugation (10,000 rpm for 5 min) followed by filtration through a 0.2 μm nylon membrane.
The samples were analyzed following EPA Method 537.1 [34]. Samples were prepared by dilution to within the linear range of the PFOA standard curve, which was between 0.2 and 480 ppb. After dilution, 20 μL of internal standard (100 ppb PFOA) was added and then samples were vortexed to ensure homogeneity before measurement by HPLC coupled with triple quadrupole mass spectroscopy (HPLC-MS system).

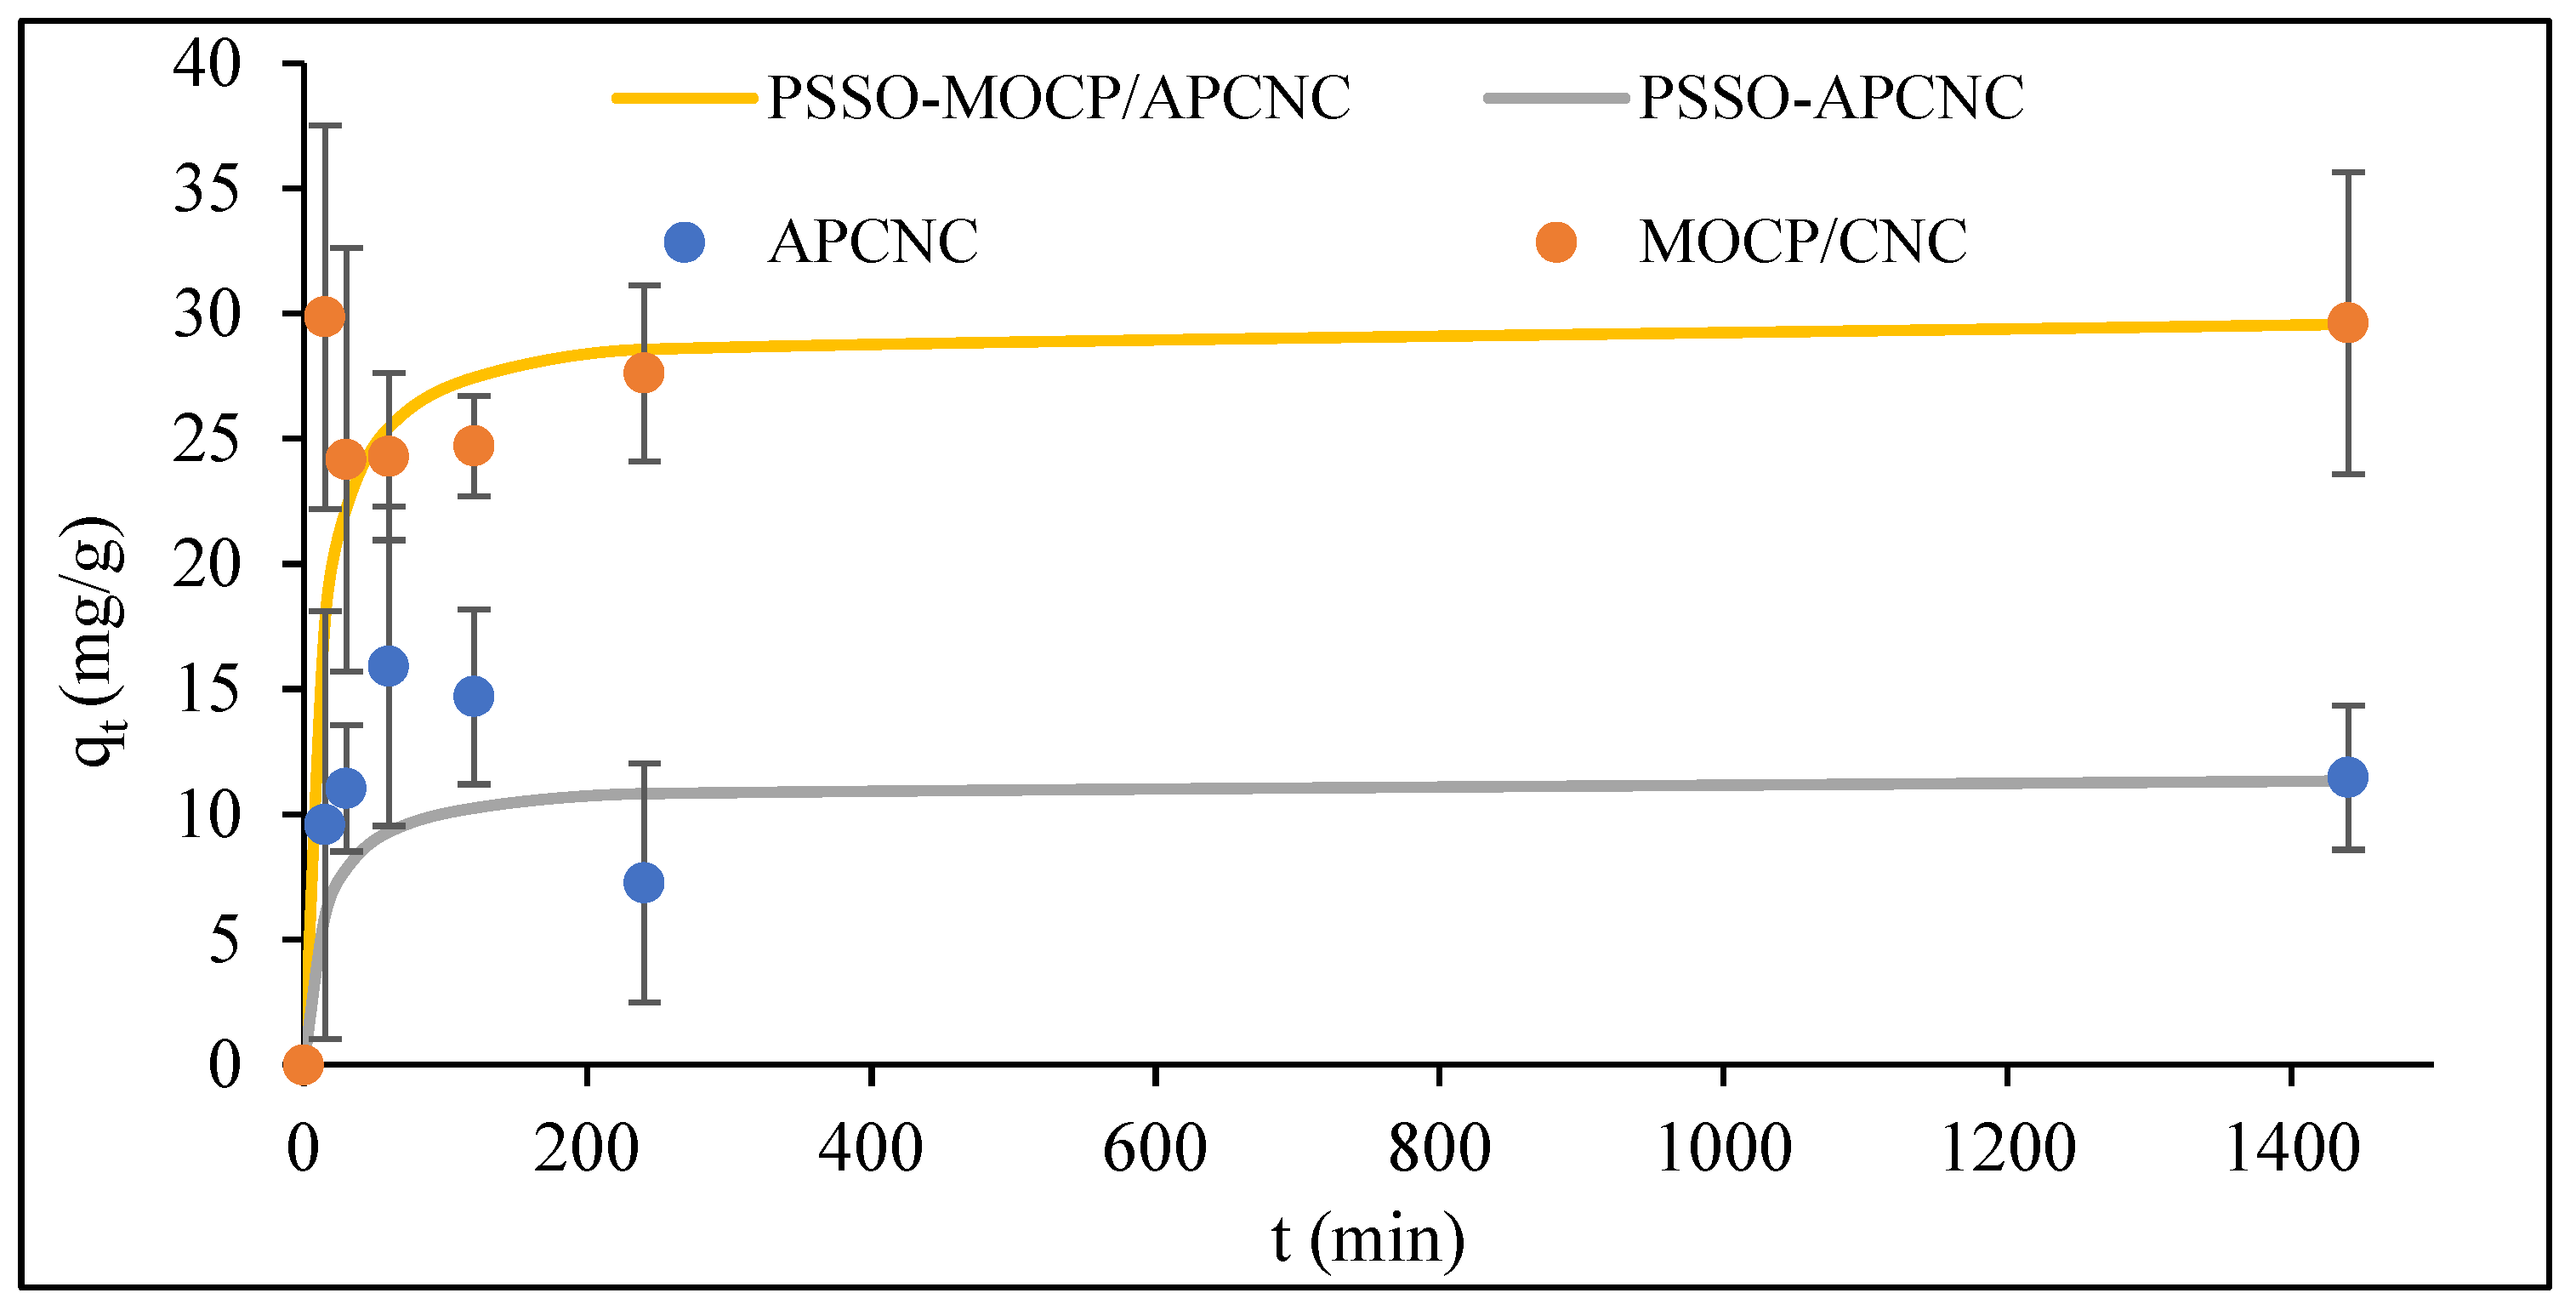
2.6.1. Batch PFOA Adsorption Kinetics

Adsorption kinetics experiments were conducted to analyze the adsorption rate of PFOA onto APCNC and MOCP/APCNC. Adsorbents were added to a 500 ppm PFOA solution, agitated, and sampled at 0, 0.25, 0.5, 1, 2, 4, and 24 h to assess the dynamics of PFOA adsorption onto APCNC and MOCP/APCNC.
Adsorption kinetics of PFOA onto APCNC and MOCP/APCNC were studied using the pseudo-second order (PSSO) rate model. The PSSO model assumes that the adsorption rate is controlled by chemical adsorption and that adsorption capacity is proportional to the number of available adsorption sites. The PSSO model in its differential and linear form are given in Equations (7) and (8), respectively.
d q t d t = k 2 ( q e q t ) 2
t q t = 1 k 2 q e 2 + 1 q e t
where  q t  is the uptake ratio at a given time point,  q e  is the uptake ratio at equilibrium,  t  is the time point, and  k 2  is the PSSO adsorption rate constant. The constants were obtained by fitting the experimental data from the PFOA adsorption kinetics studies using APCNC or MOCP/APCNC to the linearized PSSO model Equation (8).

2.6.2. Batch PFOA Equilibrium Adsorption and Isotherm Experiments

The equilibrium uptake ratio of PFOA to APCNC or MOCP/APCNC was determined for starting PFOA concentrations ranging from 10 ppb to 1500 ppm. The starting concentrations tested included 10, 50, 250, and 500 ppb, as well as 5, 100, 300, 500, 750, 1250, and 1500 ppm PFOA. The previously described Freundlich equilibrium model Equation (4) was fitted to the PFOA equilibrium adsorption data. Due to the linear nature of the reported results, the Henry equilibrium adsorption model was also employed [35]. The Henry adsorption equilibrium model is a simplification of the Freundlich model for a completely homogenous surface (( 1 / n )  = 1), where adsorption equilibrium coverage is directly correlated to equilibrium solution concentration. The Henry adsorption model is given by Equation (9).
q e = K H c e
where  K H  is the Henry law adsorption equilibrium constant, which was fitted through simple linear regression to the experimental data after setting the y-intercept to zero. Alongside the equilibrium uptake ratio, the PFOA removal efficiency under different starting conditions was calculated for comparison purposes using Equation (10).
R % = c i c e c i 100 %

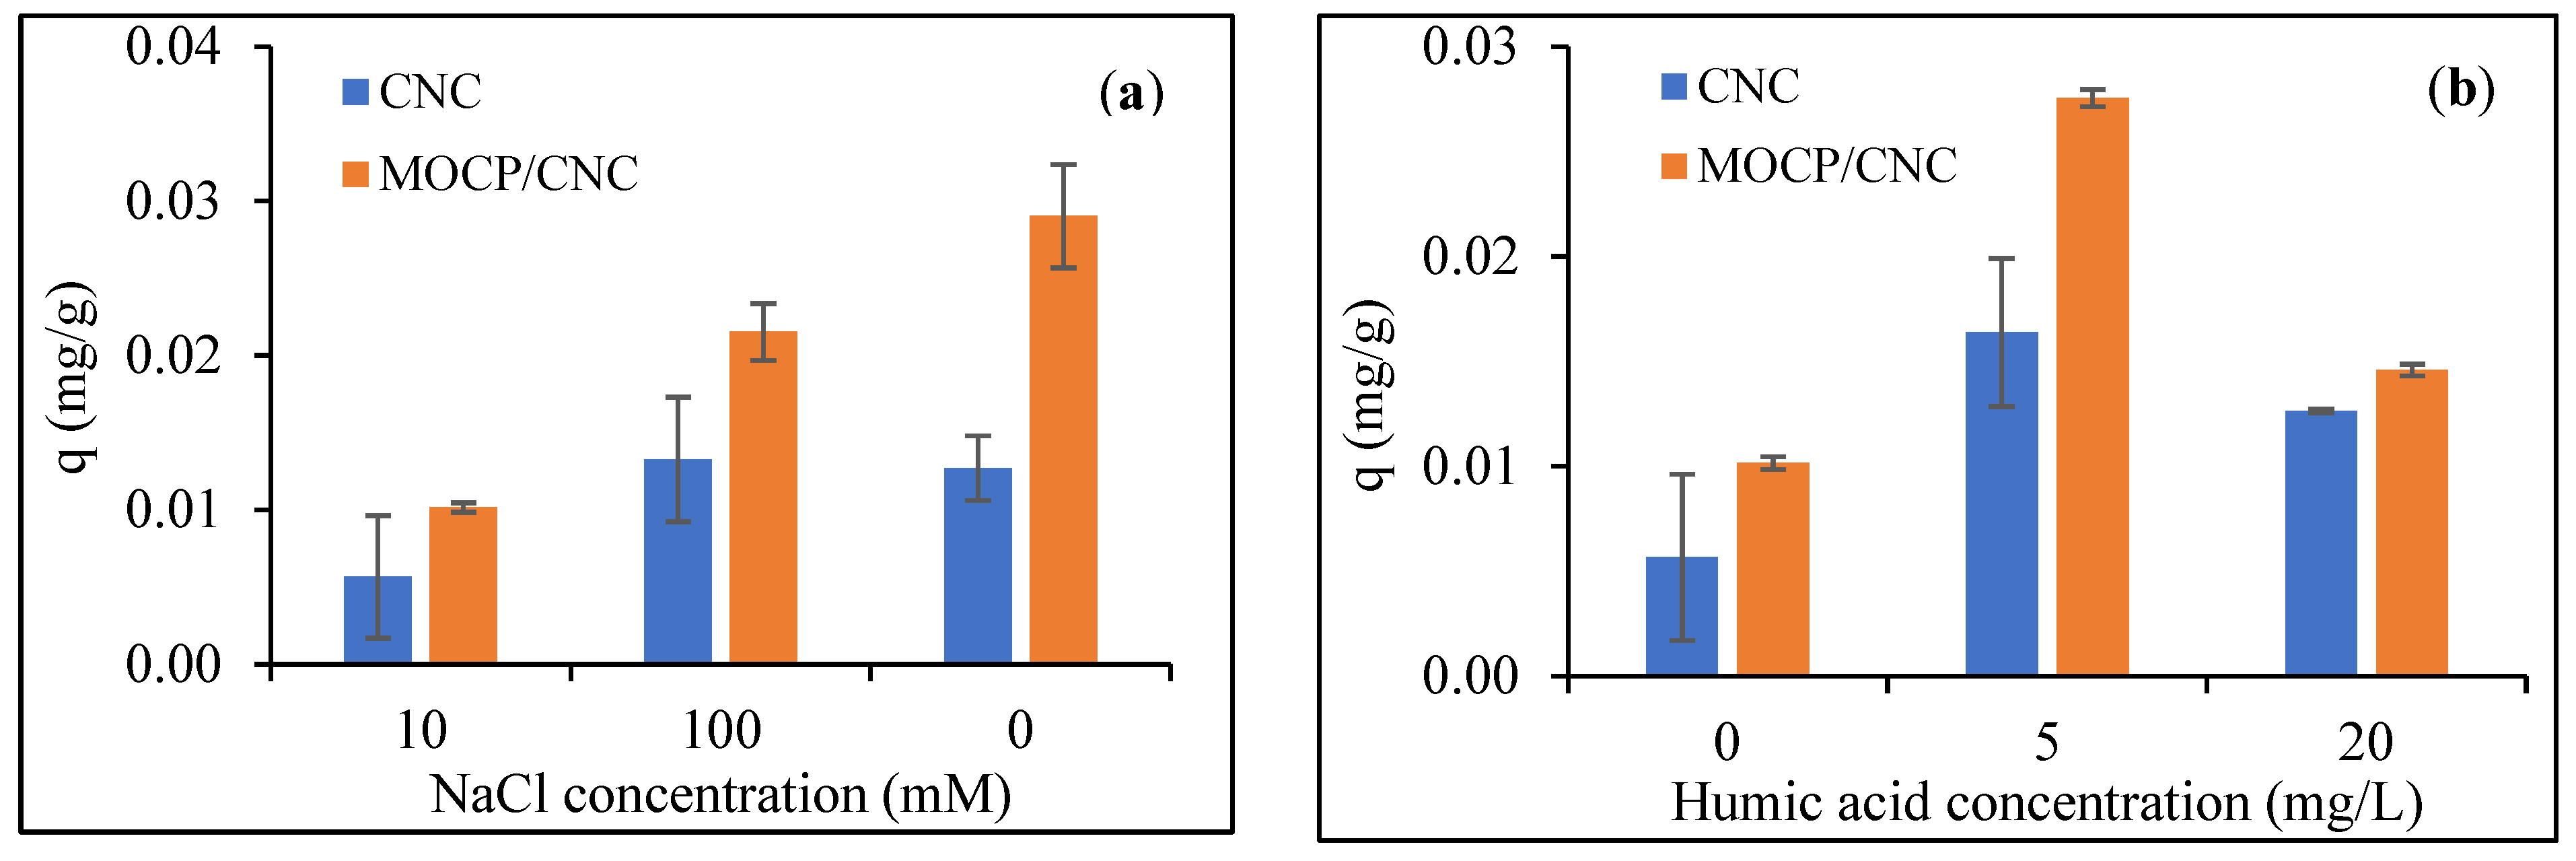
2.6.3. Effects of Ionic Strength and Dissolved Organic Matter on PFOA Adsorption

To analyze the robustness of APCNC adsorbents in more realistic water conditions, PFOA solutions were spiked with sodium chloride (NaCl) or humic acid to represent elevated solution ionic strength or dissolved organic matter, respectively. For investigations into the effect of ionic strength on PFOA adsorption, 500 ppb PFOA solutions were spiked with 10 mM and 100 mM NaCl. For investigations into the effect of dissolved organic matter on PFOA adsorption, humic acid was used as a model solute [36] and was spiked into 500 ppb PFOA solutions up to concentrations of 5, 10, 20, and 50 mg/L. Spiked samples were mixed with 5 mg/mL APCNC or MOCP/APCNC for 24 h before separation and analysis of residual PFOA concentration.

3. Results and Discussion

3.1. Synthesis of APCNC from AP

The high extractive content of AP (42.5%) was attributed to the presence of pectin and soluble sugars [20]. Most of these extractives are recovered in the hot water washing step of the cellulose extraction process which could serve as a potential feedstock in a biorefinery context [16]. The cellulose content in the AP was 14.6%. AP cellulose content has been reported to be as low as 8% [16] or as high as 34% [21]. The hemicellulose and lignin contents (8.2% and 16.3%) were found within the range reported in the literature [20,21]. The diverse composition of AP suggested the potential co-production of multiple value-added bioproducts alongside APCNC.
The first step in the AP-cellulose extraction process was hydrothermal washing to remove soluble components. The mass loss after hot water washing was 47.05%, which closely matched the AP extractives content. The total reducing sugars in the hot water extract were 12.40 g/L. After hot water washing, mild acid, alkali, and bleaching pretreatments were conducted in sequence. The AP-cellulose yield on an extractive-free AP was 23.94%. Based on the AP cellulose content, the cellulose recovery was estimated as 86.8%, which closely matched the yield (86.1%) reported by Melikoğlu et al. (2019) [21].
During the APCNC production process, the yield after the sulfuric acid hydrolysis of the AP-cellulose was 49.1%, which is similar to the yield reported for other agro-food waste: passion fruit skins (58.1%), onion skins (48.6%), and grape pomace (20.96%) [37,38,39]. Differences in CNC yield could be attributed to the varied extraction conditions applied.

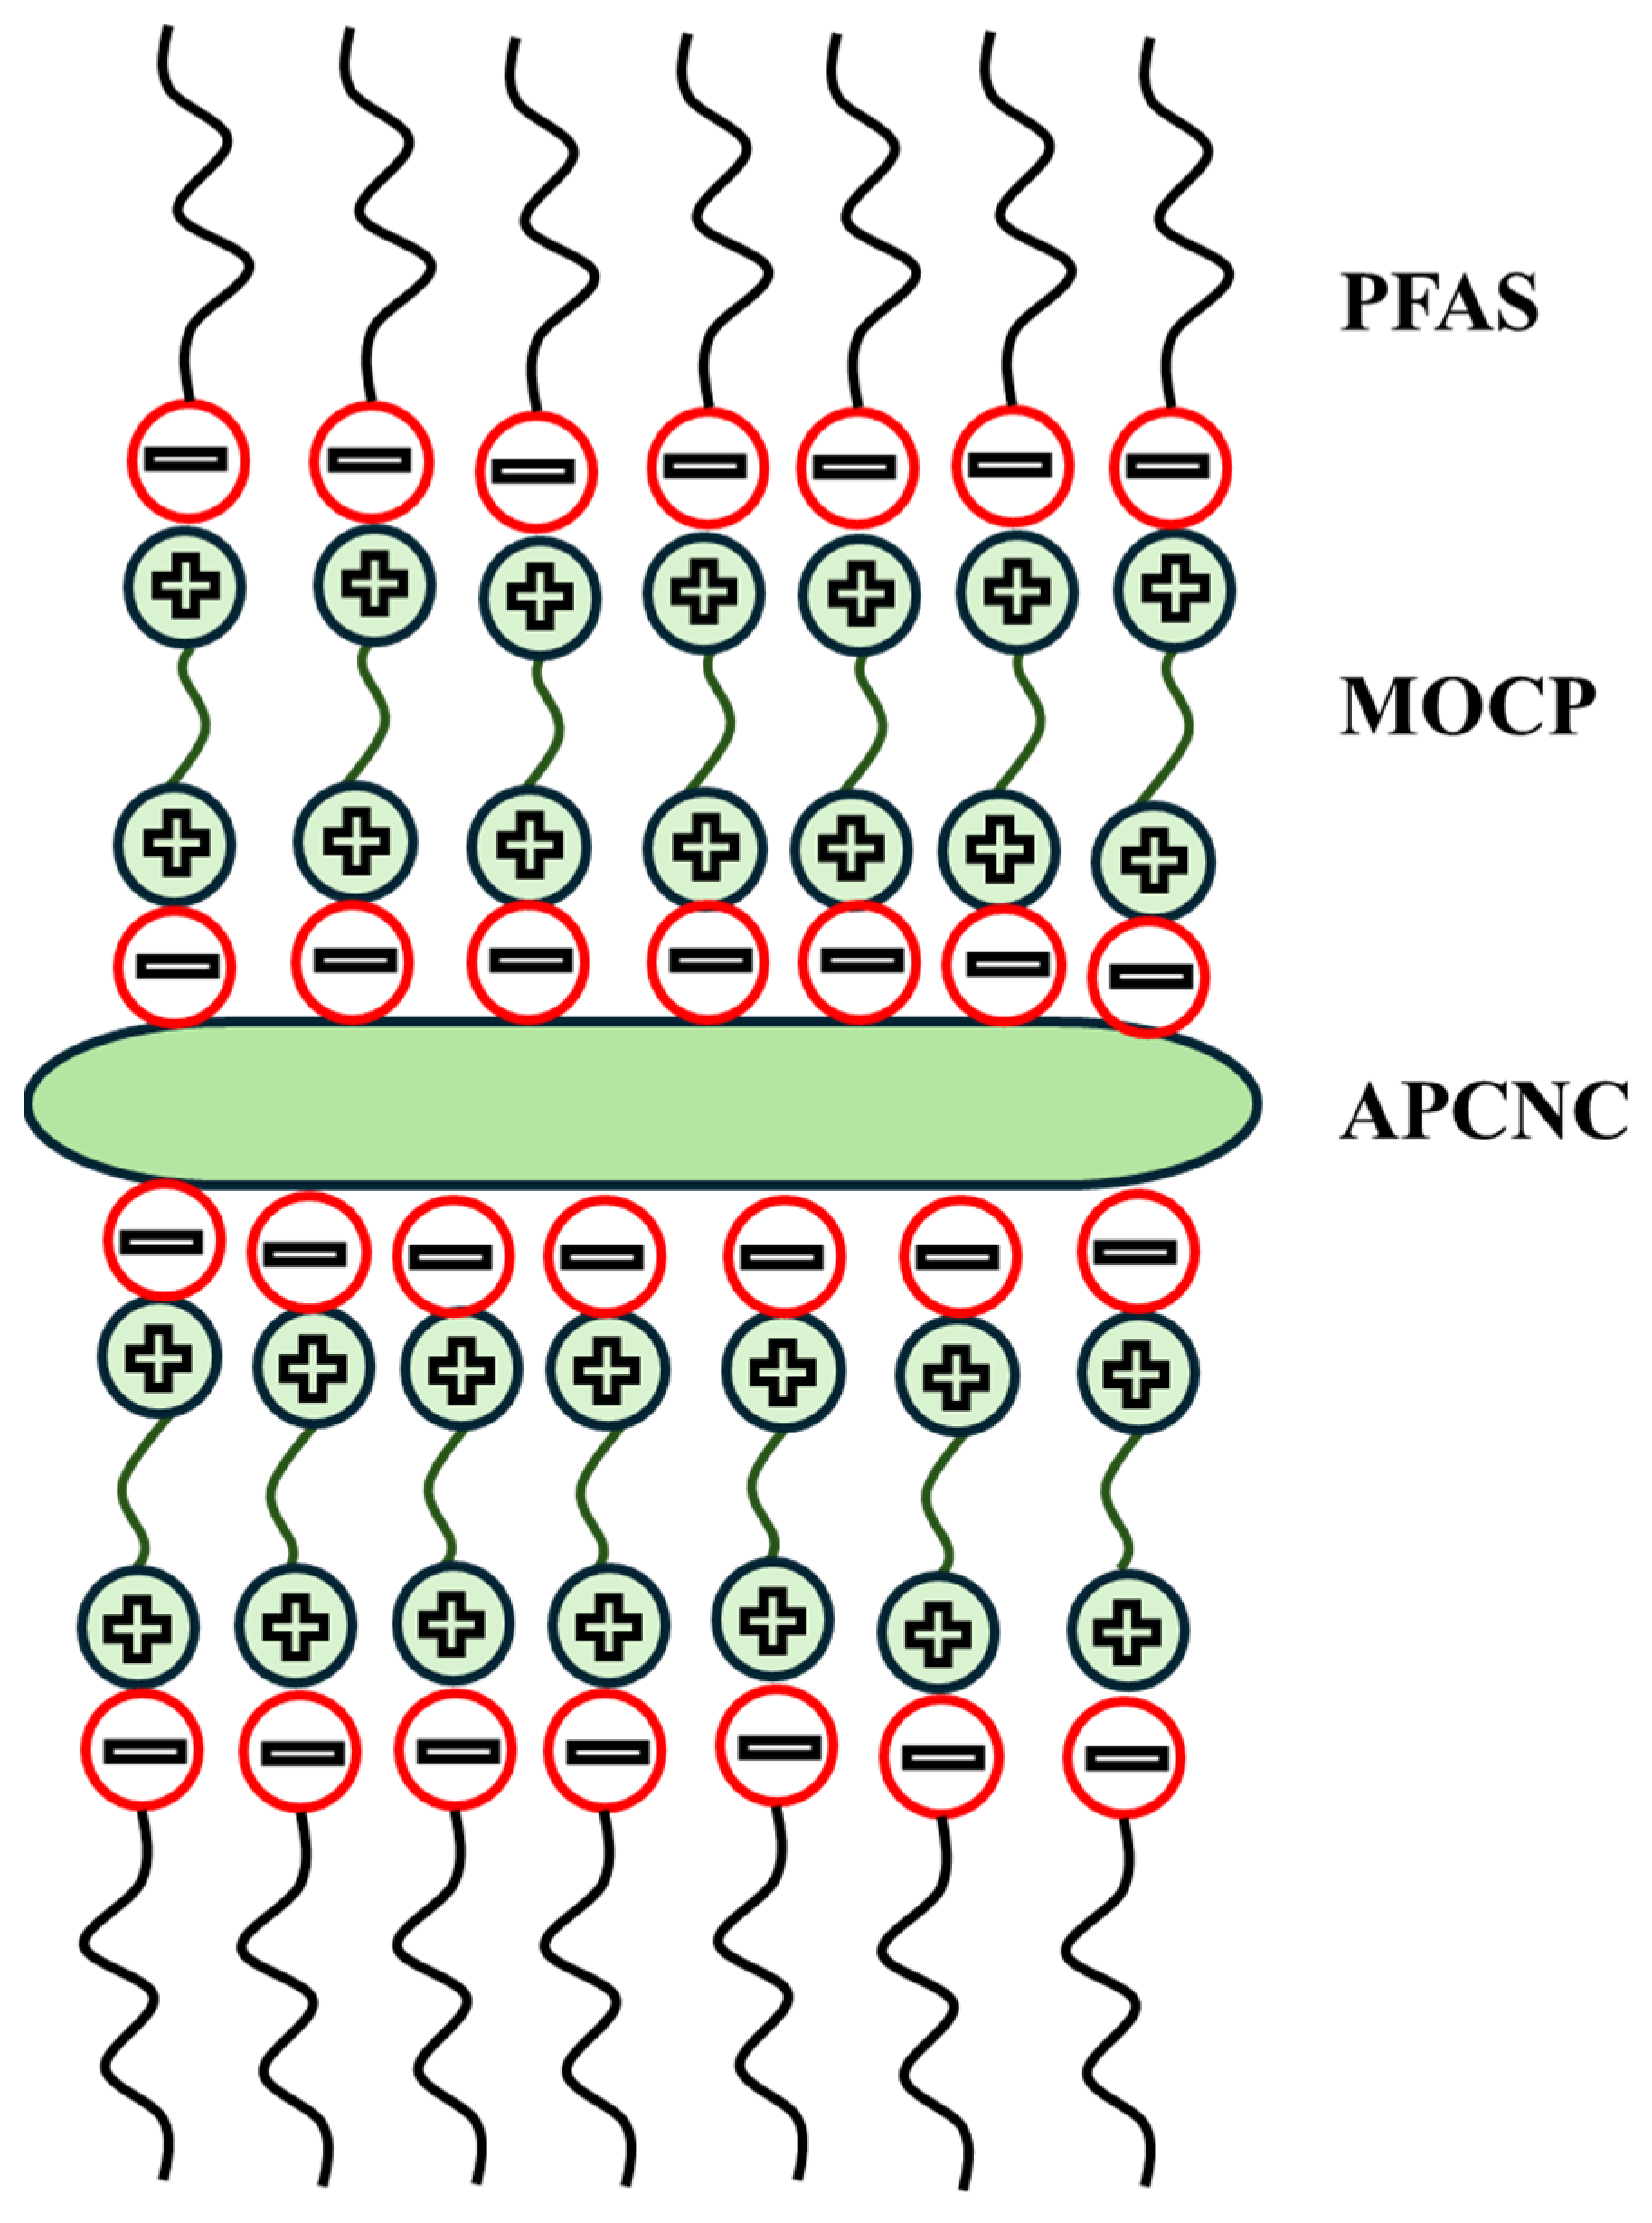
3.2. Cationization of CNC with MOCP Coating

The effect of MOCP extraction conditions on protein concentration was studied by varying the mass ratio of ground MO to DI water [37]. To control MOCP extraction concentration and maintain a cationic surface charge, the MO loading ratio was varied instead of the extraction time. The effect of the MO loading ratio on the MOCP extract protein concentration is shown in Figure 2a. MOCP concentration steadily increased with the increasing loading ratio. The maximum MOCP protein concentration obtained was 6.2 mg/mL from a loading level of 100 mg/mL DI water. At the maximum MOCP concentration, the extraction yield in terms of the mass of protein in the suspension to the initial mass of MO seed extracted was 49.6 mg/g, significantly higher than the previously reported value of 14.6 mg/g [40]. Variations in the reported MOCP concentration can be attributed to the extraction solvent, extraction time, MO pretreatment, and MO composition. The mean protein content of MO seeds was given as 19% [41], indicating that a protein extraction efficiency of around 33% was achieved. The surface charge of the 100 mg/mL MOCP extract was confirmed as cationic (8.53 ± 0.99 mV) by zeta potential analysis. MOCP extract concentrations were shown to strongly correlate to the MO loading ratio, providing significant insight into the selection of coating conditions for MOCP attachment onto APCNC and other adsorbent surfaces.
MOCP was previously coated onto clay [42], sand [24,26], and cellulose fibers [43], as a cost-effective and sustainable treatment to enhance the retention of water pollutants during packed bed filtration. MOCP coatings were shown to enhance solute retention by adjusting the adsorbent’s surface charge [24,26]. However, no investigation focused on the effect of extraction conditions on MOCP uptake onto adsorbent surfaces. In this study, set amounts of CCNC were coated with MOCP extracts of varying initial concentrations. Figure 2b illustrates the equilibrium MOCP concentration against the equilibrium MOCP uptake ratio onto CCNC. The maximum reported equilibrium uptake ratio was 289.5 mg/g. Experimental equilibrium MOCP uptake onto CCNC data was fitted by the Langmuir and Freundlich equilibrium models, which were plotted alongside the experimental results. The Langmuir model significantly underestimated the MOCP equilibrium uptake ratios at elevated initial concentrations (151.5 vs. 289.5 mg/g). The Freundlich model yielded smaller deviations at elevated starting concentrations (265.1 vs. 289.5 mg/g). Significant MOCP adsorption was reported onto CCNC surfaces due to the high surface area and electrostatic interactions between anionic CCNC and cationic MOCP.
Table 1 lists the fitted Langmuir and Freundlich equilibrium model constants for MOCP adsorption onto CCNC. The Langmuir maximum equilibrium adsorption uptake value (152.54 mg/g) was lower than multiple experimental equilibrium uptake ratios, indicating that the maximum equilibrium adsorption capacity of MOCP onto CCNC was not reached. The Freundlich model better predicted equilibrium uptake values at higher starting concentrations and possessed a slightly higher R2 (0.934) than the Langmuir model (0.915). Since the value of the Freundlich fitted constant n (3.382) was significantly larger than 1, the data did not behave like a linear adsorption isotherm, where n = 1. In future studies, the maximum equilibrium adsorption capacity of MOCP onto CCNC can be determined by reducing the CCNC loading ratio and maintaining the MOCP initial concentration. Maximum MOCP adsorption capacity was not ascertained here but modeling the MOCP adsorption equilibrium onto CCNC can be applied to optimize surface coating conditions.

3.3. Characterization of AP, AP-Cellulose, APCNC, and MOCP/APCNC

The effects of pretreatment and acid hydrolysis on the morphology of AP, cellulose-AP, and APCNC were visualized using SEM imaging, shown in Figure S1 (Supplementary Information). The impact of treatments on particle size was apparent, as the diameter of AP reduced from 300 μm to ~10 μm for AP-cellulose and to <1 μm for APCNC. AP had a heterogeneous surface due to the presence of cellulose, hemicelluloses, lignin, and pectin. After pretreatment removed the non-cellulosic components of the biomass, the visibility of the high aspect ratio fibers increased. Further reduction in particle size is evident, which can be attributed to the degradation of the amorphous regions through the acid-catalyzed breakdown of the β-1,4-glucopyranose linkage [44]. The lack of clarity in APCNC structure from SEM images was previously reported [21,32] and attributed to small particle dimensions and the effect of sample preparation conditions. The larger crystals present in APCNC were caused by drying-induced agglomeration [45]. SEM imaging confirmed the production of APCNC from AP-cellulose and AP-cellulose from AP.
The surface chemical functional groups of AP, AP-cellulose, APCNC, CCNC, and MOCP/APCNC were analyzed through FTIR, with the superimposed spectrums provided in Figure S2 (Supplementary Information). Melikoğlu et al. (2019) reported spectral bands for AP at 3350, 2860–2927, 1748, 1650, 1530, 1259, 1160, and 900 cm−1. Here, AP exhibited peaks at 3325, 2825–2925, 1745, 1660, 1605, 1225, and 1030 cm−1, showing a high degree of similarity in chemical functionality with the previously studied sample. The primary lignocellulosic components of AP are cellulose, hemicellulose, and lignin. FTIR was used to validate the overarching objective of pretreatment: the removal of non-cellulosic components from biomass. Characteristic bands of cellulose functional groups were previously reported at the following wavelengths: OH (4000–2995 cm−1), H-C-H (2890 cm−1), Fiber-OH (1640 cm−1), and C-O-C (1270–1232 cm−1 and 1170–1082 cm−1) [46]. The OH, C-H-H, Fiber-OH, and C-O-C bands were visible in all samples, indicating that cellulose structure was preserved through the pretreatment, extraction, and coating. The characteristic bands of hemicelluloses were reported as: OH (1108 cm−1, 4000–2995 cm−1), H-C-H (2890 cm−1), and C=O (1765–1715 cm−1) [21]. For lignin, characteristic peaks were identified at 1730–1700, 1632, 1613, 1450, 1430, 1270-1232, and 700–900 cm−1 [21]. From Figure S2 (Supplementary Information), the peaks were observed in AP spectra at 1748 and 1259 cm−1 and the stretching at 1530 cm−1 indicated the presence of cellulose, hemicellulose, and lignin [21], respectively. For APCNC, peaks were observed at 3300, 2920-2815, 1660, 1310, and 1020 cm−1. Similar spectra were produced by APCNC and CCNC, indicating a high degree of similarity in surface composition. For MOCP/APCNC, no discernable new peaks were detected. Previously, MOCP extract was reported to display FTIR peaks at 1635 and 3472 cm−1 from the -OH, and -NH protein functional groups [47]. The presence of MOCP on MOCP/APCNC could not be confirmed by FTIR analysis. Successful isolation of AP-cellulose from AP and successful production of APCNC were affirmed by FTIR analysis.
The effect of pretreatment, CNC extraction, and MOCP coating on material crystallinity was analyzed by PXRD and compared against CCNC, shown in Figure 3. The XRD patterns are displayed in Figure 3a. Crystalline peaks were exhibited for all samples at 2-theta = 16.1°, 22°, and 34.7°, which were attributed to the cellulose I structure present in all samples [32]. The CrI values of AP, AP-cellulose, APCNC, CCNC, and MOCP/APCNC were 24, 58, 61, 66, and 59%, respectively, plotted in Figure 3b. Crystallinity increased after the removal of non-cellulosic components and further increased when amorphous regions of cellulose were dissolved during acid hydrolysis to produce APCNC. The crystallinity index of APCNC was comparable but slightly lower than CCNC. MOCP coating slightly reduced the crystallinity of APCNC. Reduction in the crystallinity of MOCP/APCNC provided evidence of the successful change in surface morphology after coating [42]. Increased crystallinity after pretreatment and APCNC extraction corroborated findings in the literature [21,31]. However, the increase in crystallinity after APCNC extraction was less significant here than what was previously reported. Melikoğlu et al. (2019) reported CrI values of 45, 67, and 78% for AP, AP-cellulose, and APCNC, respectively [21]. Differences in crystallinity can be attributed to differences in starting material and treatment conditions. Szymanska-Chargot et al. (2017) tested the crystallinity of cellulose derived from various feedstocks and reported the following values of CrI: apple (51.34%), tomato (48.97%), cucumber (53.61%), and carrot pomace (68.73) [16]. PXRD analysis verified the successful removal of non-crystalline components of biomass during pretreatment and the successful coating of MOCP onto APCNC.
The thermal stabilities of AP, AP-cellulose, APCNC, CCNC, and MOCP/APCNC were analyzed using TGA, with the resulting mass loss curves shown superimposed in Figure S3 (Supplementary Information). The corresponding curves represented the sample weight loss during continuous heating. The initial weight loss at around 100–120 °C can be attributed to the evaporation of moisture. Yang et al. (2007) performed TGA on samples of cellulose, hemicellulose, and lignin and found that hemicellulose decomposition occurred gradually between 220–315 °C, cellulose decomposed sharply between 315–400 °C, and lignin slowly decomposed throughout the entire temperature range up to 900 °C [48]. The greater levels of mass loss at lower temperatures but lower levels of mass loss at higher temperatures for AP can be attributed to the presence of lignin and hemicelluloses which were mostly removed by the subsequent pretreatment. Cellulose degradation starting at around 300 °C was reported for all samples, with the sharpest mass loss occurring for CCNC, indicating its high purity and that residual lignocellulosic impurities may be present in APCNC. Similar thermal stability profiles were produced for AP-cellulose and APCNC, with the mass loss occurring slightly more sharply for APCNC than AP-cellulose, which can be attributed to the degradation of the less thermally stable amorphous regions of cellulose. Figure S3 (Supplementary Information) shows a high degree of similarity in the thermal degradation profile of AP-cellulose, APCNC, and MOCP/APCNC, which exhibited less sharp mass losses than CCNC. This was an indicator of the incomplete removal of non-cellulosic components from AP. MOCP coatings were not shown to significantly impact the thermal stability of APCNC but slightly reduced the mass loss beyond 500 °C. TGA confirmed the successful removal of non-cellulosic components from AP by pretreatment and enabled the comparison in purity between APCNC and CCNC.
The specific surface areas of APCNC, CCNC, and MOCP/APCNC were analyzed by fitting the BET isotherm onto N2 adsorption data, under varied activation conditions, given in Figure S4 (Supplementary Information). N2 adsorption isotherms were not suitably produced for AP or cellulose-AP, so the specific surface areas for those materials were not reported. APCNC exhibited a lower specific surface area (0.74 m2/g) than CCNC (1.35 m2/g), which could be attributed to differences in fiber source and treatment conditions [49]. Coating MOCP onto APCNC increased the material’s specific surface area (1.06 m2/g) relative to unmodified APCNC (0.74 m2/g). The values of the specific surface area of APCNC and CCNC fall within the range reported in the literature [50,51]. Brinkmann et al. (2016) analyzed the specific surface area of CNC through BET, NMR, TEM, and AFM. The reported dimensions of CNC derived from AFM yielded a significantly larger specific surface area (419 m2/g) than what was reported by N2 adsorption isotherms (1.29 m2/g), exemplifying the limitations of the BET isotherm approach for estimating CNC specific surface area. This can be attributed to the drying effects of CNC causing nanoparticle agglomeration. However, N2 adsorption isotherms provided a comparative analysis for the effect of surface treatments on the available surface area. APCNC possessed a smaller specific surface area than CCNC, possibly due to the source material and extraction conditions. MOCP coating enhanced the specific surface area of APCNC.
The hydrodynamic diameters and the apparent surface charges of CCNC, APCNC, and MOCP/APCNC were analyzed through DLS and zeta potential analysis, with results shown in Table 2. CCNC possessed a smaller hydrodynamic diameter than APCNC, which can be attributed to different source materials and extraction conditions. However, DLS did confirm the production of nano-scale APCNC from AP [52]. MOCP coatings increased the size of MOCP/APCNC relative to APCNC, as previously demonstrated by polymer coatings onto CNC [53]. For CNC, hydrodynamic diameters can be only used on a comparative rather than an absolute basis [32], due to the high aspect ratio of CNC failing the assumptions of spherical particles given in the Stokes–Einstein diffusivity equation. In the literature, CNC hydrodynamic diameters are reported in the range of 100–500 nm [51]. The negative zeta potentials of CCNC and APCNC were attributed to the formation of sulfate groups during concentrated acid hydrolysis [44]. The charge of the MOCP extract used for APCNC coating was verified as cationic by zeta potential, with an average value of 8.53 ± 0.99 mV, confirming previous reports in the literature [27]. Zeta potential analysis verified the successful inversion of CNC surface charge through coating with cationic protein extract MOCP. CNC surface charge has previously been inverted by the coating of synthetic polymers or surfactants [22,54]. The primary advantage of MOCP extract coating in comparison to synthetic polymers is its biodegradability, cost-effective procurement, and nontoxicity [55]. DLS confirmed the nanoscale dimensions of APCNC and zeta potential confirmed the inversion of AP surface charge after MOCP coating.

3.4. Batch Adsorption Studies of PFOA onto CNC-Based Adsorbents

The adsorption rate of PFOA onto unmodified APCNC and MOCP/APCNC was analyzed through modeling batch adsorption kinetic trials for a starting PFOA concentration of 500 ppm and an adsorbent dosage of 5000 mg/L, illustrated in Figure 4. Rapid PFOA uptake was observed with equilibrium being reached in both cases within 15 min. The uptake ratio at equilibrium was on average 27 mg/g for MOCP/APCNC and 10 mg/g for APCNC. This demonstrated both the rapid uptake of PFAS onto CNC-based adsorbents and the ability of MOCP coatings to enhance PFAS adsorption capacity. Conventional PFAS adsorbents such as GAC and IEX suffer from long equilibrium times, on the order of several days [56]. Therefore, significant efforts have been focused on developing PFAS adsorbents with shorter equilibrium times, such as with polyaniline polymers, where the PFOA equilibrium was reached within 5 h [57], or powdered activated carbon, where PFOA equilibrium was reached within 60 min [58]. Rapid PFAS adsorption was also observed on polyethyleneimine-coated cellulose microcrystals, where equilibrium was reached within 30 min for a wide range of PFAS tested in pure and lake water [59]. The adsorption rate of microporous adsorbents is diffusion-limited, which led to interest in nanostructured materials such as CNC, due to their high external surface areas [60]. APCNC and MOCP/APCNC offered rapid PFOA adsorption with significantly shorter equilibrium times than those reported for conventional PFAS adsorbents.
The fitted PSSO rate model parameters for PFOA uptake kinetics onto APCNC and MOCP/APCNC are given in Table 3. PFOA adsorption in both cases was well-described by the PSSO rate model with coefficients of variation (R2) of 0.988 and 1.000, respectively. Modeling the adsorption kinetics was necessary to evaluate the experimental results and to extrapolate findings beyond the experimental conditions. PSSO is a widely used empirical kinetic model for batch adsorption studies due to its ability to describe the approach to the uptake ratio at equilibrium [61]. Zhang et al. (2021) applied PSSO and the interparticle diffusion model (IDM) to fit experimental PFAS adsorption kinetic data for GAC and biochar [62]. It is important to note that the adsorbent amounts (50 mg/L vs. 5000 mg/L) and the initial PFOA concentration (1 mg/L vs. 500 mg/L) were significantly lower in the Zhang et al. (2021) [62] study. For all studied PFAS compounds (PFOA, PFOS, PFBA, and PFBS), the PSSO better described the experimental data than the intraparticle diffusion model, exemplified by the reported R2. Since PFAS adsorption data fit the PSSO better than the IDM model, this indicated that intraparticle diffusion was not the rate-limiting step during PFAS adsorption. For GAC and biochar, the PSSO adsorption rate constant was reported as 9.59 × 10⁻⁶ and 6.64 × 10⁻⁶ g/mg/s, respectively, which was multiple orders of magnitude smaller than the PSSO constants derived by fitting PFOA adsorption kinetic data for APCNC (2.65 × 10⁻³) and MOCP/APCNC (5.05 × 10⁻³). This indicated that PFAS adsorption rates onto CNC-based adsorbents were significantly faster than PFAS adsorption rates of conventional adsorbents.
Equilibrium PFOA adsorption experiments were conducted for starting PFOA concentrations ranging from 10 ppb (μg/L) to 1250 ppm (mg/L). Figure 5a,b shows the equilibrium PFOA concentration plotted against the equilibrium uptake ratio on APCNC and MOCP/APCNC modeled by the Freundlich and Henry model. Since no plateau in the equilibrium uptake ratio was found at elevated starting PFOA concentrations, the system was considered within the linear range. This allowed for evaluation using the Henry equilibrium model, which was compared against the Freundlich isotherm model, with the fitted parameters given in Table 4. Through visual inspection, it can be determined that for both APCNC and MOCP/APCNC, the equilibrium uptake ratio had not plateaued and the collected data fell within the linear region of the isotherm shape. Therefore, the maximum adsorption capacity cannot be determined by fitting this data to the Langmuir isotherm. The Freundlich model’s best fit to the experimental data yielded a heterogeneity constant (n) near 1, indicating that the Henry model for linear adsorption would better describe the equilibrium uptake at the tested concentrations and adsorbent dosage. The Henry model was previously used in cases where the equilibrium uptake plateau was not reached for PFOA adsorption onto carbon nanotubes [63]. Plotting the equilibrium PFOA concentration against equilibrium uptake showed that MOCP/APCNC retained a larger quantity of PFOA than APCNC and that maximum adsorption was not reached for either adsorbent given the starting PFOA concentrations and adsorbent dosages tested.
While PFOA adsorption was analyzed in the ppm (mg/L) range in this study, in the actual contaminated water, the PFOA is often detected in the low ppb or high ppt range (ng/L–μg/L) [64]. Therefore, to determine the efficacy of MOCP coatings on PFOA retention under relevant conditions, the removal efficiency of PFOA onto APCNC and MOCP/APCNC was plotted for different starting PFOA concentrations, ranging from 10 ppb to 50 ppm, shown in Figure 5c. At a starting concentration of 10 ppb, the average removal efficiency was 6% for APCNC and 87% for MOCP/APCNC, demonstrating the significant enhancement in PFAS retention for MOCP-coated APCNC compared to unmodified APCNC. Son et al. (2020) determined the removal efficiencies of various PFAS onto numerous types of powdered activated carbon by adding 50 mg/L of adsorbent to a 100 ng/L PFAS solution and mixing until equilibrium was reached [65]. The average removal efficiency was reported as 80%. Although the actual adsorbent dosage (5000 mg/L) and initial PFOA concentration (10,000 ng/L) conditions used in this study are different compared to the conditions used by Son et al. (2020) [65], the ratio of adsorbent dosage to solution PFOA concentration was similar (0.5 mg/ng). Considering adsorbent performance based on adsorbent dosage to solution PFOA concentration, MOCP/APCNC removed PFOA at a similar high efficiency as powdered activated carbon, a high-performing GAC-based alternative. At lower tested starting concentrations, MOCP/APCNC removed a significantly larger percentage of PFOA compared to APCNC. A schematic of the model PFAS removal (PFOA in this study) by the Moringa oleifera-based MOCP/APCNC adsorbent is shown in Figure 6. MO seeds contain high amounts of soluble proteins (MOCP) possessing net positive surface charges, which undergo electrostatic interactions with the negatively charged head groups of PFAS such as PFOA during batch adsorption. Moringa-based adsorbents have also been used previously for PFAS removal from water [66,67]. Moringa oleifera seeds outperformed all adsorbents but one of the non-activated carbon-based PFAS adsorbents, which corroborated previous evidence of MOCP efficacy against other organic pollutants [66]. Militao et al. (2022) encapsulated MO seed powder into alginate beads at different ratios and tested their PFOS removal efficiency from a 100 ppb PFOS solution dosed with 1.5 g/L of adsorbent after 24 h of contact time [67]. The maximum removal efficiency was observed at the highest MO bead dosage. While MO seeds have demonstrated high PFAS affinity, their application is hindered by the release of excessive organic matter leading to bacterial growth in water over time [24]. Therefore, it is noteworthy that this was the first study where MOCP-coated surfaces were shown to enhance PFAS retention since extracting the cationic protein and coating it onto adsorbent surfaces eliminates the issue of excessive organic matter.
Henry and Freundlich model constants, fitted by linear regression to experimental data, are given in Table 4. For both models, MOCP/APCNC possessed a higher adsorption rate constant, indicating that MOCP coatings led to elevated PFOA equilibrium adsorption capacity. In the range of PFOA concentrations tested, both APCNC and MOCP/APCNC adsorption equilibrium uptake ratios were better fitted by the Henry model than the Freundlich. This indicated that a significant amount of additional surface area was still available on the adsorbent and the maximum adsorption capacity was not closely approached. However, comparisons between this novel adsorbent and conventional PFAS adsorption technology were still able to be made. The maximum reported adsorption capacity from a starting concentration of 1250 ppm was 47.1 mg/g for APCNC and 61.1 mg/g for MOCP/APCNC, demonstrating that MOCP coatings enhanced the PFOA adsorption capacity. Both APCNC and MOCP/APCNC displayed a higher PFOA adsorption capacity than polyethyleneimine grafted cellulose microcrystals (2.32 mg/g) but a lower Freundlich adsorption rate constant (11.46 (mg/g)(L/mg)1/n) [59]. Zhang et al. (2021) performed equilibrium experiments to test the adsorption capacity of various PFAS including PFOA on GAC and biochar and fitted the experimental data to the Langmuir and Freundlich isotherms [62]. From the Langmuir isotherm model, the theoretical maximum PFOA adsorption capacity was estimated to be 35.7 and 21.6 mg/g, respectively. The maximum adsorption uptake ratios observed for APCNC and MOCP/APCNC exceeded both adsorbents’ theoretical maximum adsorption capacity, indicating a relatively high PFOA loading capacity. APCNC adsorbed PFOA at levels exceeding conventional adsorbents and MOCP coating was shown to enhance PFOA retention onto APCNC.
The kinetics and equilibrium studies reported so far were undertaken with model PFOA-contaminated aqueous solutions in DI water. However, the presence of ions or dissolved organic matter often negatively impacts adsorption performance in practice. Therefore, to test the robustness of MOCP coatings for PFOA adsorption onto APCNC, the effects of ionic strength and dissolved organic matter on PFOA uptake onto APCNC and MOCP/APCNC were studied and the results are illustrated in Figure 7a,b, respectively. In all cases, 500 ppb solutions of PFOA were challenged with 5 mg/L of adsorbent. For both APCNC and MOCP/APCNC, PFOA uptake increased with increasing ionic strength. However, at elevated solution ionic strength (100 mM), a much larger difference in adsorption uptake was observed between APCNC and MOCP/APCNC (0.013 vs. 0.029 mg/g) than in DI Water (0.006 vs. 0.010 mg/g). Liu et al. (2018) studied the effect of ionic strength on PFOA adsorption onto carbon nanotubes and found little influence [63]. To enhance PFAS retention, Ramos et al. (2022) coated poly(diallyldimethylammonium chloride) (PDADMAC) onto GAC [68]. Ramos et al. (2022) studied the effect of competing ions and organic matter on PFAS adsorption, finding that increasing ionic strength did not lead to a significant increase in the percentage increase in adsorption capacity between unmodified GAC and PDADMAC coated GAC. This trend was not observed in this study as elevated ionic strength increased the proportional difference in PFOA adsorption capacity between APCNC and MOCP/APCNC. One possible cause could be the differences in the chemical composition between MOCP vs PDADMAC. Unlike PDADMAC, which is a cationic polyelectrolyte, MOCP is a mostly cationic protein that contains some hydrophobic moieties [69]. PFAS adsorption can be driven by either electrostatic interaction between cationic surfaces and anionic PFAS head groups or by hydrophobic interactions between hydrophobic surfaces and hydrophobic PFAS tails [70]. It is well known that hydrophobic surface interactions increase with increasing salinity as nonpolar particles become less soluble in aqueous media at elevated conductivities [71]. Therefore, the hydrophobic regions of MOCP may be driving the enhanced adsorption rate observed for MOCP/APCNC at high ionic strengths.
To investigate the impact of dissolved organic matter, humic acid was spiked into solutions of 500 ppb PFOA as a model solute representative of natural organic matter found in surface water. Humic acid is a complex mixture of organic compounds derived from the decomposition of plant and animal matter. It shares some similarities with natural organic matter found in water. In addition, humic acid contains various functional groups, such as carboxylic, phenolic, and hydroxyl groups, which are representative of the types of interactions that can occur between PFAS and natural organic matter in the environment. Thus, using humic acid as a model solute allows PFAS adsorption in the presence of a complex and diverse organic matrix, similar to what is encountered in environmental systems. The effect of spiking PFOA solutions with 0–50 mg/L of humic acid on adsorption uptake onto APCNC and MOCP/APCNC is shown in Figure 7b. At elevated humic acid concentrations (50 mg/L), no quantifiable PFOA adsorption was reported, indicating that the dissolved organic carbon outcompeted PFOA for space on the adsorbent surface. From DI water to the lowest humic acid dosage (5 mg/L), the PFOA adsorption capacity increased from 0.006 to 0.016 mg/g for APCNC and from 0.010 to 0.027 mg/g for MOCP/APCNC. Low dissolved organic matter concentrations have been associated with increased PFOA uptake due to co-adsorption [72]. However, elevated humic acid concentrations have been shown to lower PFOA uptake [73]. Since the dissolved organic matter concentration in the surface water is typically between 0–20 mg/L [74], MOCP/APCNC PFOA adsorption performances were robust against variation in dissolved organic carbon concentrations in water within the range of realistic values.

4. Conclusions

This study investigated the potential of using apple pomace-derived cellulose nanocrystals cationized with protein extracted from Moringa oleifera seeds for the effective removal of PFOA from water. On a water extractive-free dry weight basis, the cellulose yield was 23.94% and the APCNC sulfuric acid hydrolysis yield was found to be 49.1%. The MO loading ratio directly correlated to MOCP protein concentration, with a maximum MOCP protein concentration of 6.2 mg/mL reported at a MO seed loading level of 100 mg MO/mL DI water. The surface charge of MOCP was confirmed as cationic (8.53 mV) by zeta potential analysis. PFOA adsorption equilibrium onto APCNC and MOCP/APCNC was reached within 15 min, significantly faster than conventional PFAS adsorbents. The maximum PFOA adsorption capacities onto APCNC and MOCP/APCNC were 47.1 and 61.1 mg/g, respectively, demonstrating that MOCP coatings enhanced PFAS retention. The linear relationship displayed between the equilibrium concentration and uptake ratio led to the successful fitting of the Henry linear adsorption model with an R2 of 0.94 and 0.93 for APCNC and MOCP/APCNC, respectively. Henry law equilibrium rate constants showed that APCNC (2.65 × 10⁻² L/g) had lower PFOA adsorption affinity than MOCP/APCNC (4.70 × 10⁻² L/g). At low starting PFOA concentrations, MOCP/APCNC almost completely removed PFOA from the solution (87%), compared to only 6% removal by APCNC. Increasing the ionic strength of 500 ppb PFOA solutions was shown to enhance MOCP/APCNC adsorption capacity (0.010 to 0.029 mg/g) to a greater extent than APCNC (0.006 to 0.013 mg/g) due to the presence of hydrophobic groups in MOCP. At the dissolved organic matter content levels reported in groundwater, the PFOA adsorption capacity onto MOCP/APCNC increased. Successful coating of MOCP onto APCNC led to enhanced adsorption rates, capacities, and robustness against variation in water quality. Compared to conventional PFAS adsorbents, MOCP/APCNC offered more rapid uptake at elevated capacities, making it highly competitive as a replacement to or supplement for existing PFAS water treatments.

Supplementary Materials

The following supporting information can be downloaded at https://www.mdpi.com/article/10.3390/pr12020297/s1. Figure S1: SEM images of (a) AP, (b) AP-cellulose, and (c) APCNC; Figure S2: Superimposed FTIR spectra of AP, AP-cellulose, APCNC, MOCP/APCNC, and CCNC; Figure S3: TGA curve for AP, AP-cellulose, APCNC, MOCP/APCNC, and CCNC; Figure S4: Nitrogen adsorption–desorption isotherm for (a) APCNC, (b) MOCP/APCNC, and (c) CCNC.

Author Contributions

L.A.F.: Investigation and writing—original draft. T.D.S.: Conceptualization, investigation, and writing—original draft. M.S.H.: Investigation and writing—original draft. B.V.R.: Conceptualization and funding acquisition. C.C.V.: Investigation. M.W.: Investigation and editing. M.S.: Investigation. D.K.: Conceptualization, resources, supervision, writing, review and editing, and funding acquisition. All authors have read and agreed to the published version of the manuscript.

Funding

This work was financially supported by SyracuseCOE Faculty Fellows Program.

Data Availability Statement

The data presented in this study are within the article and supplementary file.

Conflicts of Interest

The authors declare no conflicts of interest. The funder had no role in the design of the study; in the collection, analyses, or interpretation of data; in the writing of the manuscript; or in the decision to publish the results.

References

  1. Park, S.; Zenobio, J.E.; Lee, L.S. Perfluorooctane Sulfonate (PFOS) Removal with Pd0/NFe0 Nanoparticles: Adsorption or Aqueous Fe-Complexation, Not Transformation? J. Hazard. Mater. 2018, 342, 20–28. [Google Scholar] [CrossRef]
  2. Wanninayake, D.M. Comparison of Currently Available PFAS Remediation Technologies in Water: A Review. J. Environ. Manag. 2021, 283, 111977. [Google Scholar] [CrossRef]
  3. Gomis, M.I.; Vestergren, R.; Borg, D.; Cousins, I.T. Comparing the Toxic Potency in Vivo of Long-Chain Perfluoroalkyl Acids and Fluorinated Alternatives. Environ. Int. 2018, 113, 1–9. [Google Scholar] [CrossRef] [PubMed]
  4. Sunderland, E.M.; Hu, X.; Dassuncao, C. A Review of Pathways of Human Exposure to PFAS. Physiol. Behav. 2019, 173, 665–676. [Google Scholar] [CrossRef]
  5. Ross, I.; Mcdonough, J.; Miles, J.; Storch, P.; Kochunarayanan, P.T.; Kalve, E.; Hurst, J.; Dasgupta, S.S.; Burdick, J. A Review of Emerging Technologies for Remediation of PFASs. Remediat. J. 2018, 28, 101–126. [Google Scholar] [CrossRef]
  6. Xu, B.; Liu, S.; Zhou, J.L.; Zheng, C.; Jin, W.; Chen, B.; Zhang, T.; Qiu, W. PFAS and Their Substitutes in Groundwater: Occurrence, Transformation and Remediation. J. Hazard. Mater. 2021, 412, 125159. [Google Scholar] [CrossRef] [PubMed]
  7. Vu, C.T.; Wu, T. Recent Progress in Adsorptive Removal of Per- and Poly-Fluoroalkyl Substances (PFAS) from Water/Wastewater. Crit. Rev. Environ. Sci. Technol. 2022, 52, 90–129. [Google Scholar] [CrossRef]
  8. Pauletto, P.S.; Bandosz, T.J. Activated Carbon versus Metal-Organic Frameworks: A Review of Their PFAS Adsorption Performance. J. Hazard. Mater. 2022, 425, 127810. [Google Scholar] [CrossRef] [PubMed]
  9. Militao, I.M.; Roddick, F.A.; Bergamasco, R.; Fan, L. Removing PFAS from Aquatic Systems Using Natural and Renewable Material-Based Adsorbents: A Review. J. Environ. Chem. Eng. 2021, 9, 105271. [Google Scholar] [CrossRef]
  10. Tan, K.B.; Vakili, M.; Horri, B.A.; Poh, P.E.; Abdullah, A.Z.; Salamatinia, B. Adsorption of Dyes by Nanomaterials: Recent Developments and Adsorption Mechanisms. Sep. Purif. Technol. 2015, 150, 229–242. [Google Scholar] [CrossRef]
  11. Janusz, W.; Kowalska, K.; Skwarek, E. Research on Deposition of Silver Nanoparticles at the Cellulose/NaNO3 Interface. Physicochem. Probl. Miner. Process. 2023, 59, 173554. [Google Scholar] [CrossRef]
  12. Jia, G.; Wang, H.; Yan, L.; Wang, X.; Pei, R.; Yan, T.; Zhao, Y.; Guo, X. Cytotoxicity of Carbon Nanomaterials: Single-Wall Nanotube, Multi-Wall Nanotube, and Fullerene. Environ. Sci. Technol. 2005, 39, 1378–1383. [Google Scholar] [CrossRef] [PubMed]
  13. Carpenter, A.W.; De Lannoy, C.F.; Wiesner, M.R. Cellulose Nanomaterials in Water Treatment Technologies. Environ. Sci. Technol. 2015, 49, 5277–5287. [Google Scholar] [CrossRef] [PubMed]
  14. Kargarzadeh, H.; Mariano, M.; Gopakumar, D.; Ahmad, I.; Thomas, S.; Dufresne, A.; Huang, J.; Lin, N. Advances in Cellulose Nanomaterials; Springer: Dordrecht, The Netherlands, 2018; Volume 25, ISBN 1057001817235. [Google Scholar]
  15. Vincent, S.; Kandasubramanian, B. Cellulose Nanocrystals from Agricultural Resources: Extraction and Functionalisation. Eur. Polym. J. 2021, 160, 110789. [Google Scholar] [CrossRef]
  16. Liu, H.; Kumar, V.; Jia, L.; Sarsaiya, S.; Kumar, D.; Juneja, A.; Zhang, Z.; Sindhu, R.; Binod, P.; Bhatia, S.K.; et al. Biopolymer Poly-Hydroxyalkanoates (PHA) Production from Apple Industrial Waste Residues: A Review. Chemosphere 2021, 284, 131427. [Google Scholar] [CrossRef]
  17. Padhi, S.; Singh, A.; Routray, W. Nanocellulose from Agro-Waste: A Comprehensive Review of Extraction Methods and Applications. Rev. Environ. Sci. Biotechnol. 2023. [Google Scholar] [CrossRef]
  18. Qin, S.; Shekher Giri, B.; Kumar Patel, A.; Sar, T.; Liu, H.; Chen, H.; Juneja, A.; Kumar, D.; Zhang, Z.; Kumar Awasthi, M.; et al. Resource Recovery and Biorefinery Potential of Apple Orchard Waste in the Circular Bioeconomy. Bioresour. Technol. 2021, 321, 124496. [Google Scholar] [CrossRef] [PubMed]
  19. Skaf, D.W.; Punzi, V.L.; Rolle, J.T.; Cullen, E. Impact of Moringa Oleifera Extraction Conditions on Zeta Potential and Coagulation Effectiveness. J. Environ. Chem. Eng. 2021, 9, 104687. [Google Scholar] [CrossRef]
  20. Szymanska-Chargot, M.; Chylinska, M.; Gdula, K.; Koziol, A.; Zdunek, A. Isolation and Characterization of Cellulose from Different Fruit and Vegetable Pomaces. Polymers 2017, 9, 495. [Google Scholar] [CrossRef]
  21. Melikoğlu, A.Y.; Bilek, S.E.; Cesur, S. Optimum Alkaline Treatment Parameters for the Extraction of Cellulose and Production of Cellulose Nanocrystals from Apple Pomace. Carbohydr. Polym. 2019, 215, 330–337. [Google Scholar] [CrossRef]
  22. Ranjbar, D.; Raeiszadeh, M.; Lewis, L.; MacLachlan, M.J.; Hatzikiriakos, S.G. Adsorptive Removal of Congo Red by Surfactant Modified Cellulose Nanocrystals: A Kinetic, Equilibrium, and Mechanistic Investigation. Cellulose 2020, 27, 3211–3232. [Google Scholar] [CrossRef]
  23. Jung, Y.; Jung, Y.; Kwon, M.; Kye, H.; Abrha, Y.W.; Kang, J.W. Evaluation of Moringa Oleifera Seed Extract by Extraction Time: Effect on Coagulation Efficiency and Extract Characteristic. J. Water Health 2018, 16, 904–913. [Google Scholar] [CrossRef]
  24. Jerri, H.A.; Adolfsen, K.J.; McCullough, L.R.; Velegol, D.; Velegol, S.B. Antimicrobial Sand via Adsorption of Cationic Moringa Oleifera Protein. Langmuir 2012, 28, 2262–2268. [Google Scholar] [CrossRef]
  25. Nordmark, B.A.; Przybycien, T.M.; Tilton, R.D. Comparative Coagulation Performance Study of Moringa Oleifera Cationic Protein Fractions with Varying Water Hardness. J. Environ. Chem. Eng. 2016, 4, 4690–4698. [Google Scholar] [CrossRef]
  26. Samineni, L.; Xiong, B.; Chowdhury, R.; Pei, A.; Kuehster, L.; Wang, H.; Dickey, R.; Soto, P.E.; Massenburg, L.; Nguyen, T.H.; et al. 7 Log Virus Removal in a Simple Functionalized Sand Filter. Environ. Sci. Technol. 2019, 53, 12706–12714. [Google Scholar] [CrossRef] [PubMed]
  27. Abdul Hamid, S.H.; Lananan, F.; Khatoon, H.; Jusoh, A.; Endut, A. A Study of Coagulating Protein of Moringa Oleifera in Microalgae Bio-Flocculation. Int. Biodeterior. Biodegrad. 2016, 113, 310–317. [Google Scholar] [CrossRef]
  28. Sluiter, A.; Hames, B.; Ruiz, R.O.; Scarlata, C.; Sluiter, J.; Templeton, D.; Crocker, D. Determination of Structural Carbohydrates and Lignin in Biomass. Lab. Anal. Proced. 2008, 1617, 1–16. [Google Scholar]
  29. Hou, L.; Jia, L.; Morrison, H.M.; Majumder, E.L.-W.; Kumar, D. Enhanced Polyhydroxybutyrate Production from Acid Whey through Determination of Process and Metabolic Limiting Factors. Bioresour. Technol. 2021, 342, 125973. [Google Scholar] [CrossRef]
  30. Sai Prasanna, N.; Mitra, J. Isolation and Characterization of Cellulose Nanocrystals from Cucumis Sativus Peels. Carbohydr. Polym. 2020, 247, 116706. [Google Scholar] [CrossRef] [PubMed]
  31. Zhu, S.; Sun, H.; Mu, T.; Li, Q.; Richel, A. Preparation of Cellulose Nanocrystals from Purple Sweet Potato Peels by Ultrasound-Assisted Maleic Acid Hydrolysis. Food Chem. 2023, 403, 134496. [Google Scholar] [CrossRef] [PubMed]
  32. Foster, E.J.; Moon, R.J.; Agarwal, U.P.; Bortner, M.J.; Bras, J.; Camarero-Espinosa, S.; Chan, K.J.; Clift, M.J.D.D.; Cranston, E.D.; Eichhorn, S.J.; et al. Current Characterization Methods for Cellulose Nanomaterials. Chem. Soc. Rev. 2018, 47, 2609–2679. [Google Scholar] [CrossRef]
  33. Hossain, S.; Stuart, T.D.; Ramarao, B.V.; VanLeuven, C.C.; Wriedt, M.; Kiemle, D.; Satchwell, M.; Kumar, D. Investigation into Cationic Surfactants and Polyelectrolyte-Coated Β Zeolites for Rapid and High-Capacity Adsorption of Short- and Long-Chain PFAS. Ind. Eng. Chem. Res. 2023, 62, 8373–8384. [Google Scholar] [CrossRef]
  34. Shoemaker, J.A.; Tettenhorst, D.R. EPA Method 537.1 Determination of Selected per- and Polyfluorinated Alkyl Substances in Drinking Water by Solid Phase Extraction and Liquid Chromatography/Tandem Mass Spectroscopy (LC/MS/MS); US EPA: Washington, DC, USA, 2018; Volume 1.
  35. Mozaffari Majd, M.; Kordzadeh-Kermani, V.; Ghalandari, V.; Askari, A.; Sillanpää, M. Adsorption Isotherm Models: A Comprehensive and Systematic Review (2010–2020). Sci. Total Environ. 2022, 812, 151334. [Google Scholar] [CrossRef]
  36. Appleman, T.D.; Dickenson, E.R.V.; Bellona, C.; Higgins, C.P. Nanofiltration and Granular Activated Carbon Treatment of Perfluoroalkyl Acids. J. Hazard. Mater. 2013, 260, 740–746. [Google Scholar] [CrossRef]
  37. Coelho, C.C.S.; Michelin, M.; Cerqueira, M.A.; Gonçalves, C.; Tonon, R.V.; Pastrana, L.M.; Freitas-Silva, O.; Vicente, A.A.; Cabral, L.M.C.; Teixeira, J.A. Cellulose Nanocrystals from Grape Pomace: Production, Properties and Cytotoxicity Assessment. Carbohydr. Polym. 2018, 192, 327–336. [Google Scholar] [CrossRef]
  38. Rhim, J.W.; Reddy, J.P.; Luo, X. Isolation of Cellulose Nanocrystals from Onion Skin and Their Utilization for the Preparation of Agar-Based Bio-Nanocomposites Films. Cellulose 2015, 22, 407–420. [Google Scholar] [CrossRef]
  39. Wijaya, C.J.; Saputra, S.N.; Soetaredjo, F.E.; Putro, J.N.; Lin, C.X.; Kurniawan, A.; Ju, Y.H.; Ismadji, S. Cellulose Nanocrystals from Passion Fruit Peels Waste as Antibiotic Drug Carrier. Carbohydr. Polym. 2017, 175, 370–376. [Google Scholar] [CrossRef] [PubMed]
  40. Dezfooli, S.M.; Uversky, V.N.; Saleem, M.; Baharudin, F.S.; Hitam, S.M.S.; Bachmann, R.T. A Simplified Method for the Purification of an Intrinsically Disordered Coagulant Protein from Defatted Moringa Oleifera Seeds. Process Biochem. 2016, 51, 1085–1091. [Google Scholar] [CrossRef]
  41. Saa, R.W.; Fombang, E.N.; Ndjantou, E.B.; Njintang, N.Y. Treatments and Uses of Moringa Oleifera Seeds in Human Nutrition: A Review. Food Sci. Nutr. 2019, 7, 1911–1919. [Google Scholar] [CrossRef] [PubMed]
  42. Tukki, O.H.; Barminas, J.T.; Osemeahon, S.A.; Onwuka, J.C.; Donatus, R.A. Adsorption of Colloidal Particles of Moringa Oleifera Seeds on Clay for Water Treatment Applications. J. Water Supply Res. Technol.-AQUA 2016, 65, 75–86. [Google Scholar] [CrossRef]
  43. Samineni, L.; De Respino, S.; Tu, Y.; Chowdhury, R.; Mohanty, R.P.; Oh, H.; Geitner, M.; Alberg, C.H.; Roman-white, A.; Mckinzie, S.; et al. Effective Pathogen Removal in Sustainable Natural Fiber Moringa Filters. NPJ Clean. Water 2022, 5, 27. [Google Scholar] [CrossRef]
  44. Habibi, Y.; Lucia, L.A.; Rojas, O.J. Cellulose Nanocrystals: Chemistry, Self-Assembly, and Applications. Chem. Rev. 2010, 110, 3479–3500. [Google Scholar] [CrossRef]
  45. Mariano, M.; El Kissi, N.; Dufresne, A. Cellulose Nanocrystals and Related Nanocomposites: Review of Some Properties and Challenges. J. Polym. Sci. B Polym. Phys. 2014, 52, 791–806. [Google Scholar] [CrossRef]
  46. Morán, J.I.; Alvarez, V.A.; Cyras, V.P.; Vázquez, A. Extraction of Cellulose and Preparation of Nanocellulose from Sisal Fibers. Cellulose 2008, 15, 149–159. [Google Scholar] [CrossRef]
  47. Nisha, R.R.; Jegathambal, P.; Parameswari, K.; Kirupa, K. Biocompatible Water Softening System Using Cationic Protein from Moringa Oleifera Extract. Appl. Water Sci. 2017, 7, 2933–2941. [Google Scholar] [CrossRef]
  48. Yang, H.; Yan, R.; Chen, H.; Lee, D.H.; Zheng, C. Characteristics of Hemicellulose, Cellulose and Lignin Pyrolysis. Fuel 2007, 86, 1781–1788. [Google Scholar] [CrossRef]
  49. Babaei-Ghazvini, A.; Acharya, B. The Effects of Aspect Ratio of Cellulose Nanocrystals on the Properties of All CNC Films: Tunicate and Wood CNCs. Carbohydr. Polym. Technol. Appl. 2023, 5, 100311. [Google Scholar] [CrossRef]
  50. Wang, G.; Zhang, J.; Lin, S.; Xiao, H.; Yang, Q.; Chen, S.; Yan, B.; Gu, Y. Environmentally Friendly Nanocomposites Based on Cellulose Nanocrystals and Polydopamine for Rapid Removal of Organic Dyes in Aqueous Solution. Cellulose 2020, 27, 2085–2097. [Google Scholar] [CrossRef]
  51. Brinkmann, A.; Chen, M.; Couillard, M.; Jakubek, Z.J.; Leng, T.; Johnston, L.J. Correlating Cellulose Nanocrystal Particle Size and Surface Area. Langmuir 2016, 32, 6105–6114. [Google Scholar] [CrossRef] [PubMed]
  52. Verma, C.; Chhajed, M.; Gupta, P.; Roy, S.; Maji, P.K. Isolation of Cellulose Nanocrystals from Different Waste Bio-Mass Collating Their Liquid Crystal Ordering with Morphological Exploration. Int. J. Biol. Macromol. 2021, 175, 242–253. [Google Scholar] [CrossRef]
  53. Gicquel, E.; Martin, C.; Heux, L.; Jean, B.; Bras, J. Adsorption versus Grafting of Poly(N-Isopropylacrylamide) in Aqueous Conditions on the Surface of Cellulose Nanocrystals. Carbohydr. Polym. 2019, 210, 100–109. [Google Scholar] [CrossRef]
  54. Brockman, A.C.; Hubbe, M.A. Charge Reversal System with Cationized Cellulose Nanocrystals to Promote Dewatering of a Cellulosic Fiber Suspension. Cellulose 2017, 24, 4821–4830. [Google Scholar] [CrossRef]
  55. Nouhi, S.; Kwaambwa, H.M.; Gutfreund, P.; Rennie, A.R. Comparative Study of Flocculation and Adsorption Behaviour of Water Treatment Proteins from Moringa Peregrina and Moringa Oleifera Seeds. Sci. Rep. 2019, 9, 17945. [Google Scholar] [CrossRef] [PubMed]
  56. Phong Vo, H.N.; Ngo, H.H.; Guo, W.; Hong Nguyen, T.M.; Li, J.; Liang, H.; Deng, L.; Chen, Z.; Hang Nguyen, T.A. Poly-and Perfluoroalkyl Substances in Water and Wastewater: A Comprehensive Review from Sources to Remediation. J. Water Process Eng. 2020, 36, 101393. [Google Scholar] [CrossRef]
  57. He, J.; Gomeniuc, A.; Olshansky, Y.; Hatton, J.; Abrell, L.; Field, J.A.; Chorover, J.; Sierra-Alvarez, R. Enhanced Removal of Per- and Polyfluoroalkyl Substances by Crosslinked Polyaniline Polymers. Chem. Eng. J. 2022, 446, 137246. [Google Scholar] [CrossRef]
  58. Qu, Y.; Zhang, C.; Li, F.; Bo, X.; Liu, G.; Zhou, Q. Equilibrium and Kinetics Study on the Adsorption of Perfluorooctanoic Acid from Aqueous Solution onto Powdered Activated Carbon. J. Hazard. Mater. 2009, 169, 146–152. [Google Scholar] [CrossRef]
  59. Ateia, M.; Attia, M.F.; Maroli, A.; Tharayil, N.; Alexis, F.; Whitehead, D.C.; Karanfil, T. Rapid Removal of Poly- and Perfluorinated Alkyl Substances by Poly(Ethylenimine)-Functionalized Cellulose Microcrystals at Environmentally Relevant Conditions. Environ. Sci. Technol. Lett. 2018, 5, 764–769. [Google Scholar] [CrossRef]
  60. Köse, K.; Mavlan, M.; Youngblood, J.P. Applications and Impact of Nanocellulose Based Adsorbents. Cellulose 2020, 27, 2967–2990. [Google Scholar] [CrossRef]
  61. Kostoglou, M.; Karapantsios, T.D. Why Is the Linearized Form of Pseudo-Second Order Adsorption Kinetic Model So Successful in Fitting Batch Adsorption Experimental Data? Colloids Interfaces 2022, 6, 55. [Google Scholar] [CrossRef]
  62. Zhang, D.; He, Q.; Wang, M.; Zhang, W.; Liang, Y. Sorption of Perfluoroalkylated Substances (PFASs) onto Granular Activated Carbon and Biochar. Environ. Technol. 2021, 42, 1798–1809. [Google Scholar] [CrossRef]
  63. Liu, L.; Li, D.; Li, C.; Ji, R.; Tian, X. Metal Nanoparticles by Doping Carbon Nanotubes Improved the Sorption of Perfluorooctanoic Acid. J. Hazard. Mater. 2018, 351, 206–214. [Google Scholar] [CrossRef] [PubMed]
  64. Barisci, S.; Suri, R. Occurrence and Removal of Poly/Perfluoroalkyl Substances (PFAS) in Municipal and Industrial Wastewater Treatment Plants. Water Sci. Technol. 2021, 84, 3442–3468. [Google Scholar] [CrossRef] [PubMed]
  65. Son, H.; Kim, T.; Yoom, H.; Zhao, D.; An, B. And Polyfluoroalkyl Substances (PFASs) from Surface Water Using Powder-Activated Carbon. Water 2020, 12, 3287. [Google Scholar] [CrossRef]
  66. Sörengård, M.; Östblom, E.; Köhler, S.; Ahrens, L. Adsorption Behavior of Per- And Polyfluoralkyl Substances (PFASs) to 44 Inorganic and Organic Sorbents and Use of Dyes as Proxies for PFAS Sorption. J. Environ. Chem. Eng. 2020, 8, 103744. [Google Scholar] [CrossRef]
  67. Militao, I.M.; Roddick, F.; Bergamasco, R.; Fan, L. Rapid Adsorption of PFAS: Application of Moringa Oleifera Seed Powder Encapsulated in Alginate Beads. Environ. Technol. Innov. 2022, 28, 102761. [Google Scholar] [CrossRef]
  68. Ramos, P.; Singh Kalra, S.; Johnson, N.W.; Khor, C.M.; Borthakur, A.; Cranmer, B.; Dooley, G.; Mohanty, S.K.; Jassby, D.; Blotevogel, J.; et al. Enhanced Removal of Per- and Polyfluoroalkyl Substances in Complex Matrices by PolyDADMAC-Coated Regenerable Granular Activated Carbon. Environ. Pollut. 2022, 294, 118603. [Google Scholar] [CrossRef] [PubMed]
  69. Kwaambwa, H.M.; Maikokera, R. A Fluorescence Spectroscopic Study of a Coagulating Protein Extracted from Moringa Oleifera Seeds. Colloids Surf. B Biointerfaces 2007, 60, 213–220. [Google Scholar] [CrossRef] [PubMed]
  70. Gagliano, E.; Sgroi, M.; Falciglia, P.P.; Vagliasindi, F.G.A.; Roccaro, P. Removal of Poly- and Perfluoroalkyl Substances (PFAS) from Water by Adsorption: Role of PFAS Chain Length, Effect of Organic Matter and Challenges in Adsorbent Regeneration. Water Res. 2020, 171, 115381. [Google Scholar] [CrossRef]
  71. Makowski, M.; Bogunia, M. Influence of Ionic Strength on Hydrophobic Interactions in Water: Dependence on Solute Size and Shape. J. Phys. Chem. B 2020, 124, 10326–10336. [Google Scholar] [CrossRef]
  72. Qi, Y.; Cao, H.; Pan, W.; Wang, C.; Liang, Y. The Role of Dissolved Organic Matter during Per- and Polyfluorinated Substance (PFAS) Adsorption, Degradation, and Plant Uptake: A Review. J. Hazard. Mater. 2022, 436, 129139. [Google Scholar] [CrossRef]
  73. Lei, X.; Yao, L.; Lian, Q.; Zhang, X.; Wang, T.; Holmes, W.; Ding, G.; Gang, D.D.; Zappi, M.E. Enhanced Adsorption of Perfluorooctanoate (PFOA) onto Low Oxygen Content Ordered Mesoporous Carbon (OMC): Adsorption Behaviors and Mechanisms. J. Hazard. Mater. 2022, 421, 126810. [Google Scholar] [CrossRef] [PubMed]
  74. Evans, C.D.; Monteith, D.T.; Cooper, D.M. Long-Term Increases in Surface Water Dissolved Organic Carbon: Observations, Possible Causes and Environmental Impacts. Environ. Pollut. 2005, 137, 55–71. [Google Scholar] [CrossRef] [PubMed]
Figure 1. Process flow diagram for the isolation of APCNC from AP.
Processes 12 00297 g001
Figure 2. MOCP adsorption onto CCNC. (a) The effect of the MO loading ratio on the extract protein concentration and (b) adsorption equilibrium concentration of MOCP (Ce) vs. MOCP equilibrium uptake ratio onto CCNC (qe), fitted with the Langmuir (LANG) and Freundlich (FREUD) equilibrium models.
Processes 12 00297 g002
Figure 3. (a) X-ray diffractograms and (b) crystallinity indexes of AP, AP-cellulose, APCNC, CCNC, and MOCP/APCNC.
Processes 12 00297 g003
Figure 4. Adsorption kinetics of PFOA onto APCNC and MOCP/APCNC.
Processes 12 00297 g004
Figure 5. Adsorption equilibrium study for PFOA onto (a) APCNC, (b) MOCP/APCNC, and (c) PFOA removal efficiency for APCNC and MOCP/APCNC.
Processes 12 00297 g005
Figure 6. Schematic of the PFAS adsorption mechanism onto Moringa oleifera-derived MOCP/APCNC adsorbent.
Processes 12 00297 g006
Figure 7. The effect of solution conditions on PFOA uptake on APCNC and MOCP/APCNC. (a) The effect of solution ionic strength and (b) the effect of solution dissolved organic carbon concentration.
Processes 12 00297 g007
Table 1. Adsorption isotherm parameters for MOCP adsorption onto CCNC.
LangmuirFreundlich
qmax (mg/g)KL (L/mg)R2Kf (mg/g) (mg/mL)(1/n)nR2
152.5457.980.9152199.0843.3820.9335
Table 2. Hydrodynamic diameter and zeta potential of CCNC, APCNC, and MOCP/APCNC.
Hydrodynamic Diameter (nm)Zeta Potential (mV)
CCNC92.2−25.27
APCNC230.8−15.07
MOCP/APCNC427.67.38
Table 3. PSSO rate model parameters for PFOA adsorption onto APCNC and MOCP/APCNC.
qe (mg/g)k2 (g/mg/s)R2
APCNC11.492.65 × 10−30.988
MOCP/APCNC29.855.05 × 10−31.000
Table 4. Fitted parameters for the Henry and Freundlich model for PFOA adsorption onto APCNC and MOCP/APCNC.
APCNCMOCP/APCNC
HenryKh2.65 × 10−24.70 × 10⁻²
R20.9380.933
FreundlichKf6.30 × 10−36.78 × 10⁻²
n0.8391.071
R20.8850.872
Disclaimer/Publisher’s Note: The statements, opinions and data contained in all publications are solely those of the individual author(s) and contributor(s) and not of MDPI and/or the editor(s). MDPI and/or the editor(s) disclaim responsibility for any injury to people or property resulting from any ideas, methods, instructions or products referred to in the content.

