
The Reversible Transformation of a Vesicular Aggregate in Response to a pH Oscillation


Department of Chemical Engineering & Materials Science, Doshisha University, Kyotanabe 610-0321, Kyoto, Japan
*
Author to whom correspondence should be addressed.
Processes 2024, 12(3), 514; https://doi.org/10.3390/pr12030514
Submission received: 30 January 2024
/
Revised: 19 February 2024
/
Accepted: 1 March 2024
/
Published: 2 March 2024
(This article belongs to the Special Issue Non-equilibrium Processes and Structure Formation)
Abstract
:The transformation of amphiphilic molecular assemblies in response to chemical oscillations is fundamental in biological systems. The reversible transformation of a vesicular aggregate (VA) in response to a pH oscillation is presented in this study. A VA composed of the cationic surfactant didodecyldimethylammonium bromide is transformed using a pH oscillation ranging between 3 and 7. When the VA attains a stable structure at extreme pH values, the transformation reaches the irreversible stage. However, the addition of a phosphate buffer to the VA suspension changes the pH oscillation pattern from being rectangular to triangular and decreases the oscillation amplitude, successfully achieving the reversible transformation of the VA. Maintaining the non-equilibrium (transient) structures throughout the transformation and not falling into the equilibrium state with a varying pH are essential for the reversible transformation. This may be common and essential for dynamics in biological cells.
1. Introduction
In an aqueous medium, vesicles provide a hydrophilic compartment surrounded by an amphiphilic molecular layer. The mass transfer rate across the amphiphilic molecular layer (membrane) is affected by the interaction between the transporting molecules and the membrane properties. Moreover, bioactive molecules such as proteins and DNA can be incorporated in the water pool and/or entrapped within the membrane [1]. The vesicles can thus form a confined space under well-regulated, open conditions, and chemical oscillations or other nonlinear chemical reactions can also be embedded as needed [2,3,4,5,6,7,8]. As a restricted open space, these capabilities may be utilized in the simplest models of biological cells. Therefore, numerous studies have been performed to reveal the structure, membrane permeability, and other functions of vesicles [9,10,11,12]. Recently, the response of the vesicle structure to chemical and physical stimuli has become a popular topic for understanding the dynamics of biological cells [4,13,14,15]. Stimuli often have an osmotic impact on vesicles and tend to bind to a substrate or other vesicles [13,16], which is sometimes coupled with 2D phase separation in vesicle membranes [17,18].
The dynamics of living cells induced by chemical and physical stimuli are reversible in most cases as long as the cells are alive. Although the cells deform in response to a change in the external environment or the interior physicochemical conditions, the original structure is revived when the environmental or interior conditions are relaxed or the change disappears. If the cell structure is in thermodynamic equilibrium, this reversibility is natural; the structure takes the most stable form under the physicochemical conditions. However, living cells are always in a strong non-equilibrium state; therefore, this reversibility probably reflects a dynamic aspect that is beyond thermodynamic stability.
Recently, the reversible deformation of vesicles induced by a pH gradient [19] and active matter has been reported [20,21,22,23,24]. As in other systems, vesicles under chemical oscillation are suitable for examining the dynamic aspect of a reversible structural change. The transformation of amphiphilic molecular assemblies (biological cells) in response to chemical oscillations is fundamental in biological systems, for example, the actin dynamics in cell motility [25] and the Ca-ion oscillation in heart beats [26]. In the periodic integration/disintegration of vesicles that has been reported to date, the structure oscillates between thermodynamically stable states [3,6,8]. However, biological systems do not appear to utilize the periodic structural change between two different equilibria for their functional activity because they must maintain a highly non-equilibrium state throughout their lives. An artificial model that maintains a highly non-equilibrium state with the reversible structural change in response to the chemical oscillation may provide a significant insight for understanding the minimal physical chemistry needed to maintain the type of property that is required for biological activities. However, to the best of our knowledge, such a model in the real world, which is neither of a mathematical nor cyber space concept but is a real experimental system, has not been reported. In this study, we demonstrate the transformation of a vesicular aggregate (VA) under a pH pulse (single oscillation). The VAs are always in non-equilibrium states and do not fall into a thermodynamic, stable structure corresponding to the surrounding pH. A VA is a vesicle with a complex internal structure. In a previous study, Nakada et al. reported that the VAs exhibit various structural changes in response to chemical stimuli [27]. The degree of freedom in these structural changes, which is increased by an excess of amphiphilic molecules in their interiors, enables various dynamic shape changes. However, a simple vesicle does not contain such excess molecules in its interior; therefore, it only undergoes simple structural changes, such as holing and disintegration [28,29,30,31,32]. The VAs typically deform in response to an increase in the pH, and the original structure can be revived with a decrease in the pH. However, when the first transformation exceeds a critical state, the VA cannot return to its original structure. In such cases, the VA does not return to its original shape, and the VA sometimes collapses without showing visible symptoms of recovery. The reversible transformation was observed only when the structure did not reach equilibrium throughout the shape change.
2. Materials and Methods
2.1. Chemicals
Didodecyldimethylammonium bromide (DDAB, >98.0%) was purchased from Tokyo Chemical Industry Co., Ltd. Tokyo, Japan, and the other chemicals were purchased from Fujifilm Wako Chemical Corporation. Osaka, Japan. Sodium hydroxide (>97%), sodium bromate (>99.5%), sodium hydrogen sulfite (guaranteed reagent), sodium sulfite (guaranteed reagent), manganese(II) sulfate pentahydrate (>99.9%), and bromothymol blue (BTB) (guaranteed reagent) were used. The solutions of the phosphate buffer standard solution (pH = 6) and 0.04-w/v% bromothymol blue solution (BTB) were purchased from Fujifilm Wako Chemical Corporation. Osaka, Japan. All the chemicals were used without further purification.
2.2. Sample Preparation
A drying and rehydration method was used for the VA preparation. DDAB—at a concentration of 10 mM—was dissolved in acetone by sonication. The resulting solution was poured into a vial, and acetone was evaporated initially under nitrogen gas and then completely under a vacuum. After evaporation, a thin film remained on the wall of the vial. The thin film was hydrated with deionized water or aqueous solutions containing reactants of 2 mL; the solutions used for rehydration are explained in the next paragraph. The rehydration was performed at 50 °C for 1–2 h. The resulting suspension was shaken gently by hand and then treated as a VA suspension.
Three types of liquid were used for rehydration. The first type was deionized water. The second solution was a pH oscillator solution containing sodium bromate (0.2 M), manganese(II) sulfate pentahydrate (0.0033 M), sodium hydrogen sulfite (0.0033 M), and sodium sulfite (0.033 M) [33]. The third solution was a mixture of the pH oscillator solution and phosphate buffer. The mixing ratio was denoted as 1/n, which means that the volumetric ratio was 1(phosphate buffer)/n(pH oscillator solution). A pH indicator (BTB) was added to the solutions as required.
2.3. Observation of VA
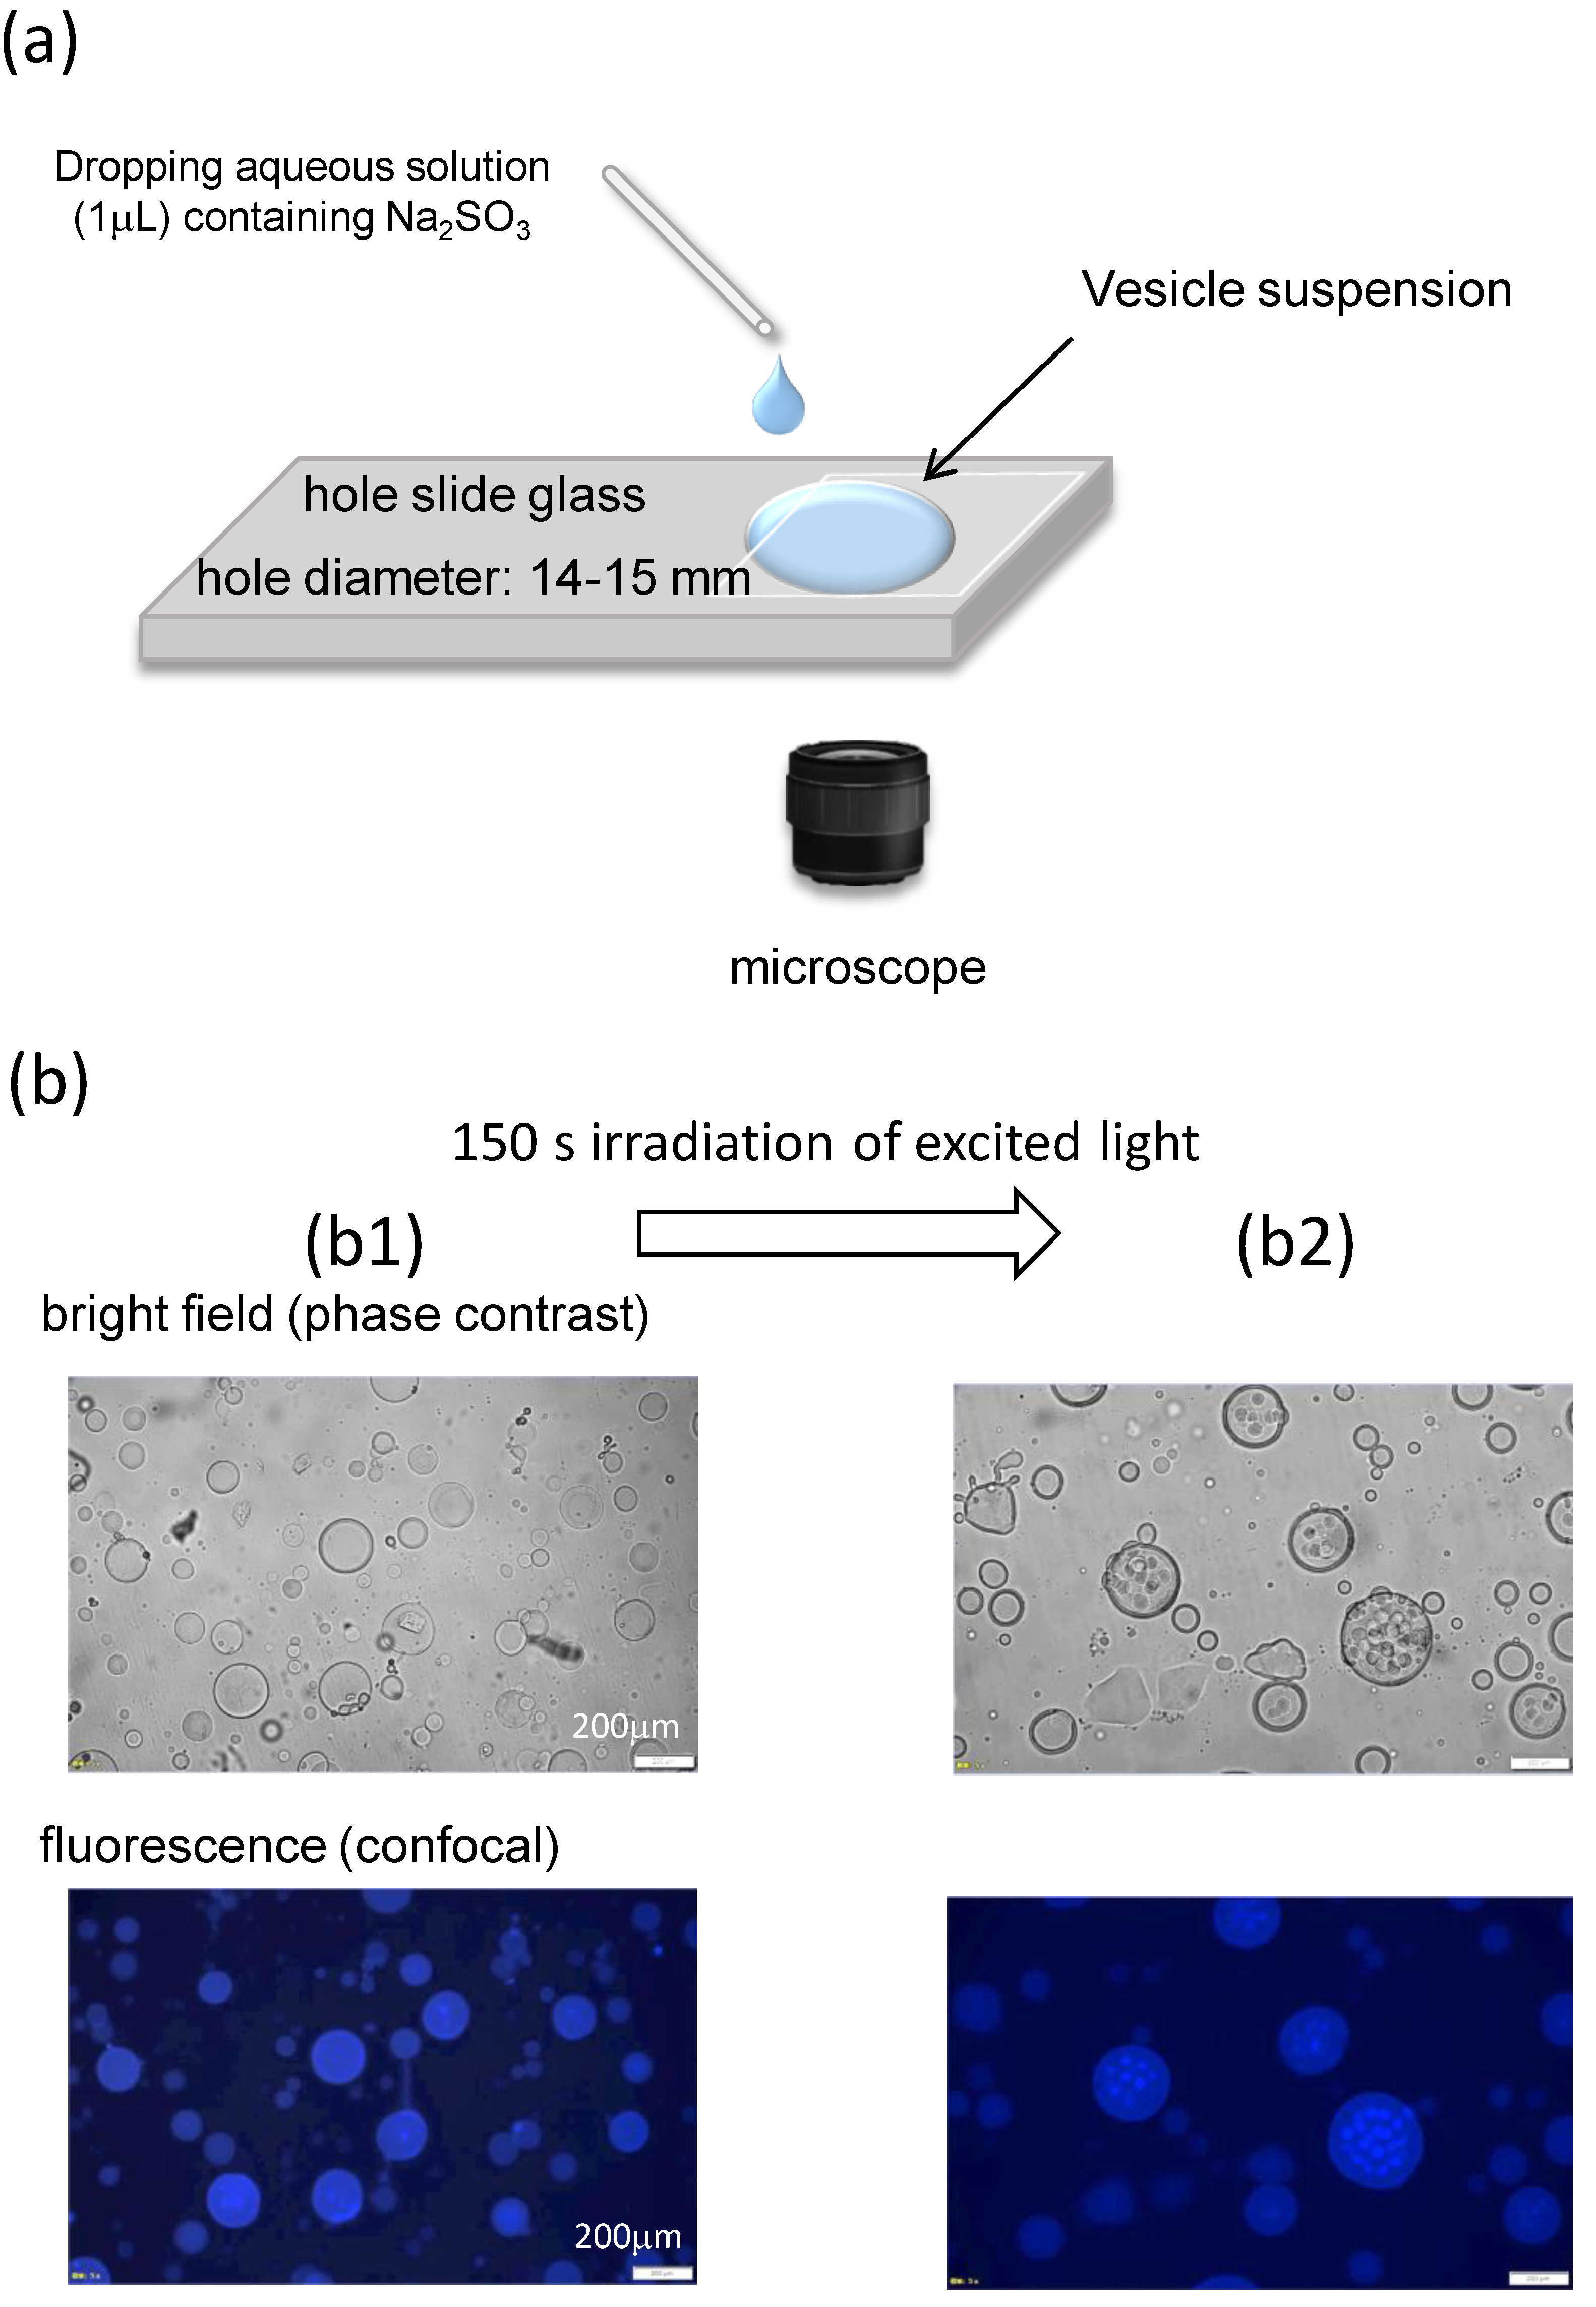
The VA suspension was poured into a circular hollow in a hole slide glass and covered with a cover glass. The VAs were then observed using phase-contrast and fluorescence microscopy (IX-71, Olympus Corporation, Tokyo Japan). All experiments were performed at room temperature, which was controlled by an air conditioner at approximately 18–25 °C. As shown in Figure 1a, a small gap is formed next to the cover glass, and an aqueous solution is diffused from the gap into the VA suspension. The volume ratio of the diffused phase to the VA suspension was approximately 1/40. When the rehydration was performed by deionized water, the diffused solution is an aqueous solution (1.0 μL) of NaOH. The diffused solution was an aqueous solution dissolving Na2SO3 (1.0 μL) of 0.1–0.5 M when the rehydration was made by the pH oscillator solution. The addition of Na2SO3 caused the pH to oscillate.
The pH oscillation was observed also in glass vials with and without stirring. In both cases, the pH oscillator solution (30 mL) was poured into a cylindrical glass container with 0.04-w/v% BTB. Subsequently, the aqueous solution containing sodium sulfite with 0.1–0.5 M was added. The pH change was measured using a pH meter (9618S-10D, HORIBA, Kyoto, Japan), and the color change in the solution was monitored using a charge-coupled device (video camera HC-V480M, Panasonic Corporation, Tokyo, Japan).
3. Results and Discussions
3.1. Structure of the VA
The structure formed after rehydration with deionized water is shown in Figure 1(b1). Globular shapes are observed. The VA diameter is polydispersed approximately in the range 5–200 μm. The VA of 150–200 μm was chosen for observation of the structural change because it is easily characterized. However, the structural change discussed in this paper is observed independently of the VA size. Confocal microscopy revealed fluorescence throughout the spherical shape; however, this structure was difficult to characterize. The same observation was reported in a previous study [27] where DDAB molecules occupied the inner space to form aggregated structures. The addition of water around a spherical aggregate caused water to penetrate the aggregate. Owing to this osmotic impact, the inner DDAB molecules formed several smaller globules [27]. However, in this study, irradiation with excitation light caused a structural change in the inner structure, which may be attributed to a temperature change, as shown in Figure 1(b2). Several smaller aggregates are thus formed. This indicates that the DDAB molecules were present in the inner space. This complicated structure is advantageous for shape changes in aggregates, as demonstrated in a previous study [27]. This pool can supply the DDAB molecules required for shape changes. That is to say that if a simple vesicle were used, a complicated shape change would not be allowed owing to the lack of molecules. Furthermore, the results of Figure 1b indicate that fluorescence microscopy induces structural changes that are not appropriate for further experiments. Therefore, bright-field (phase-contrast) microscopy was used in this study.
3.2. pH Oscillation and Structural Change without the Phosphate Buffer
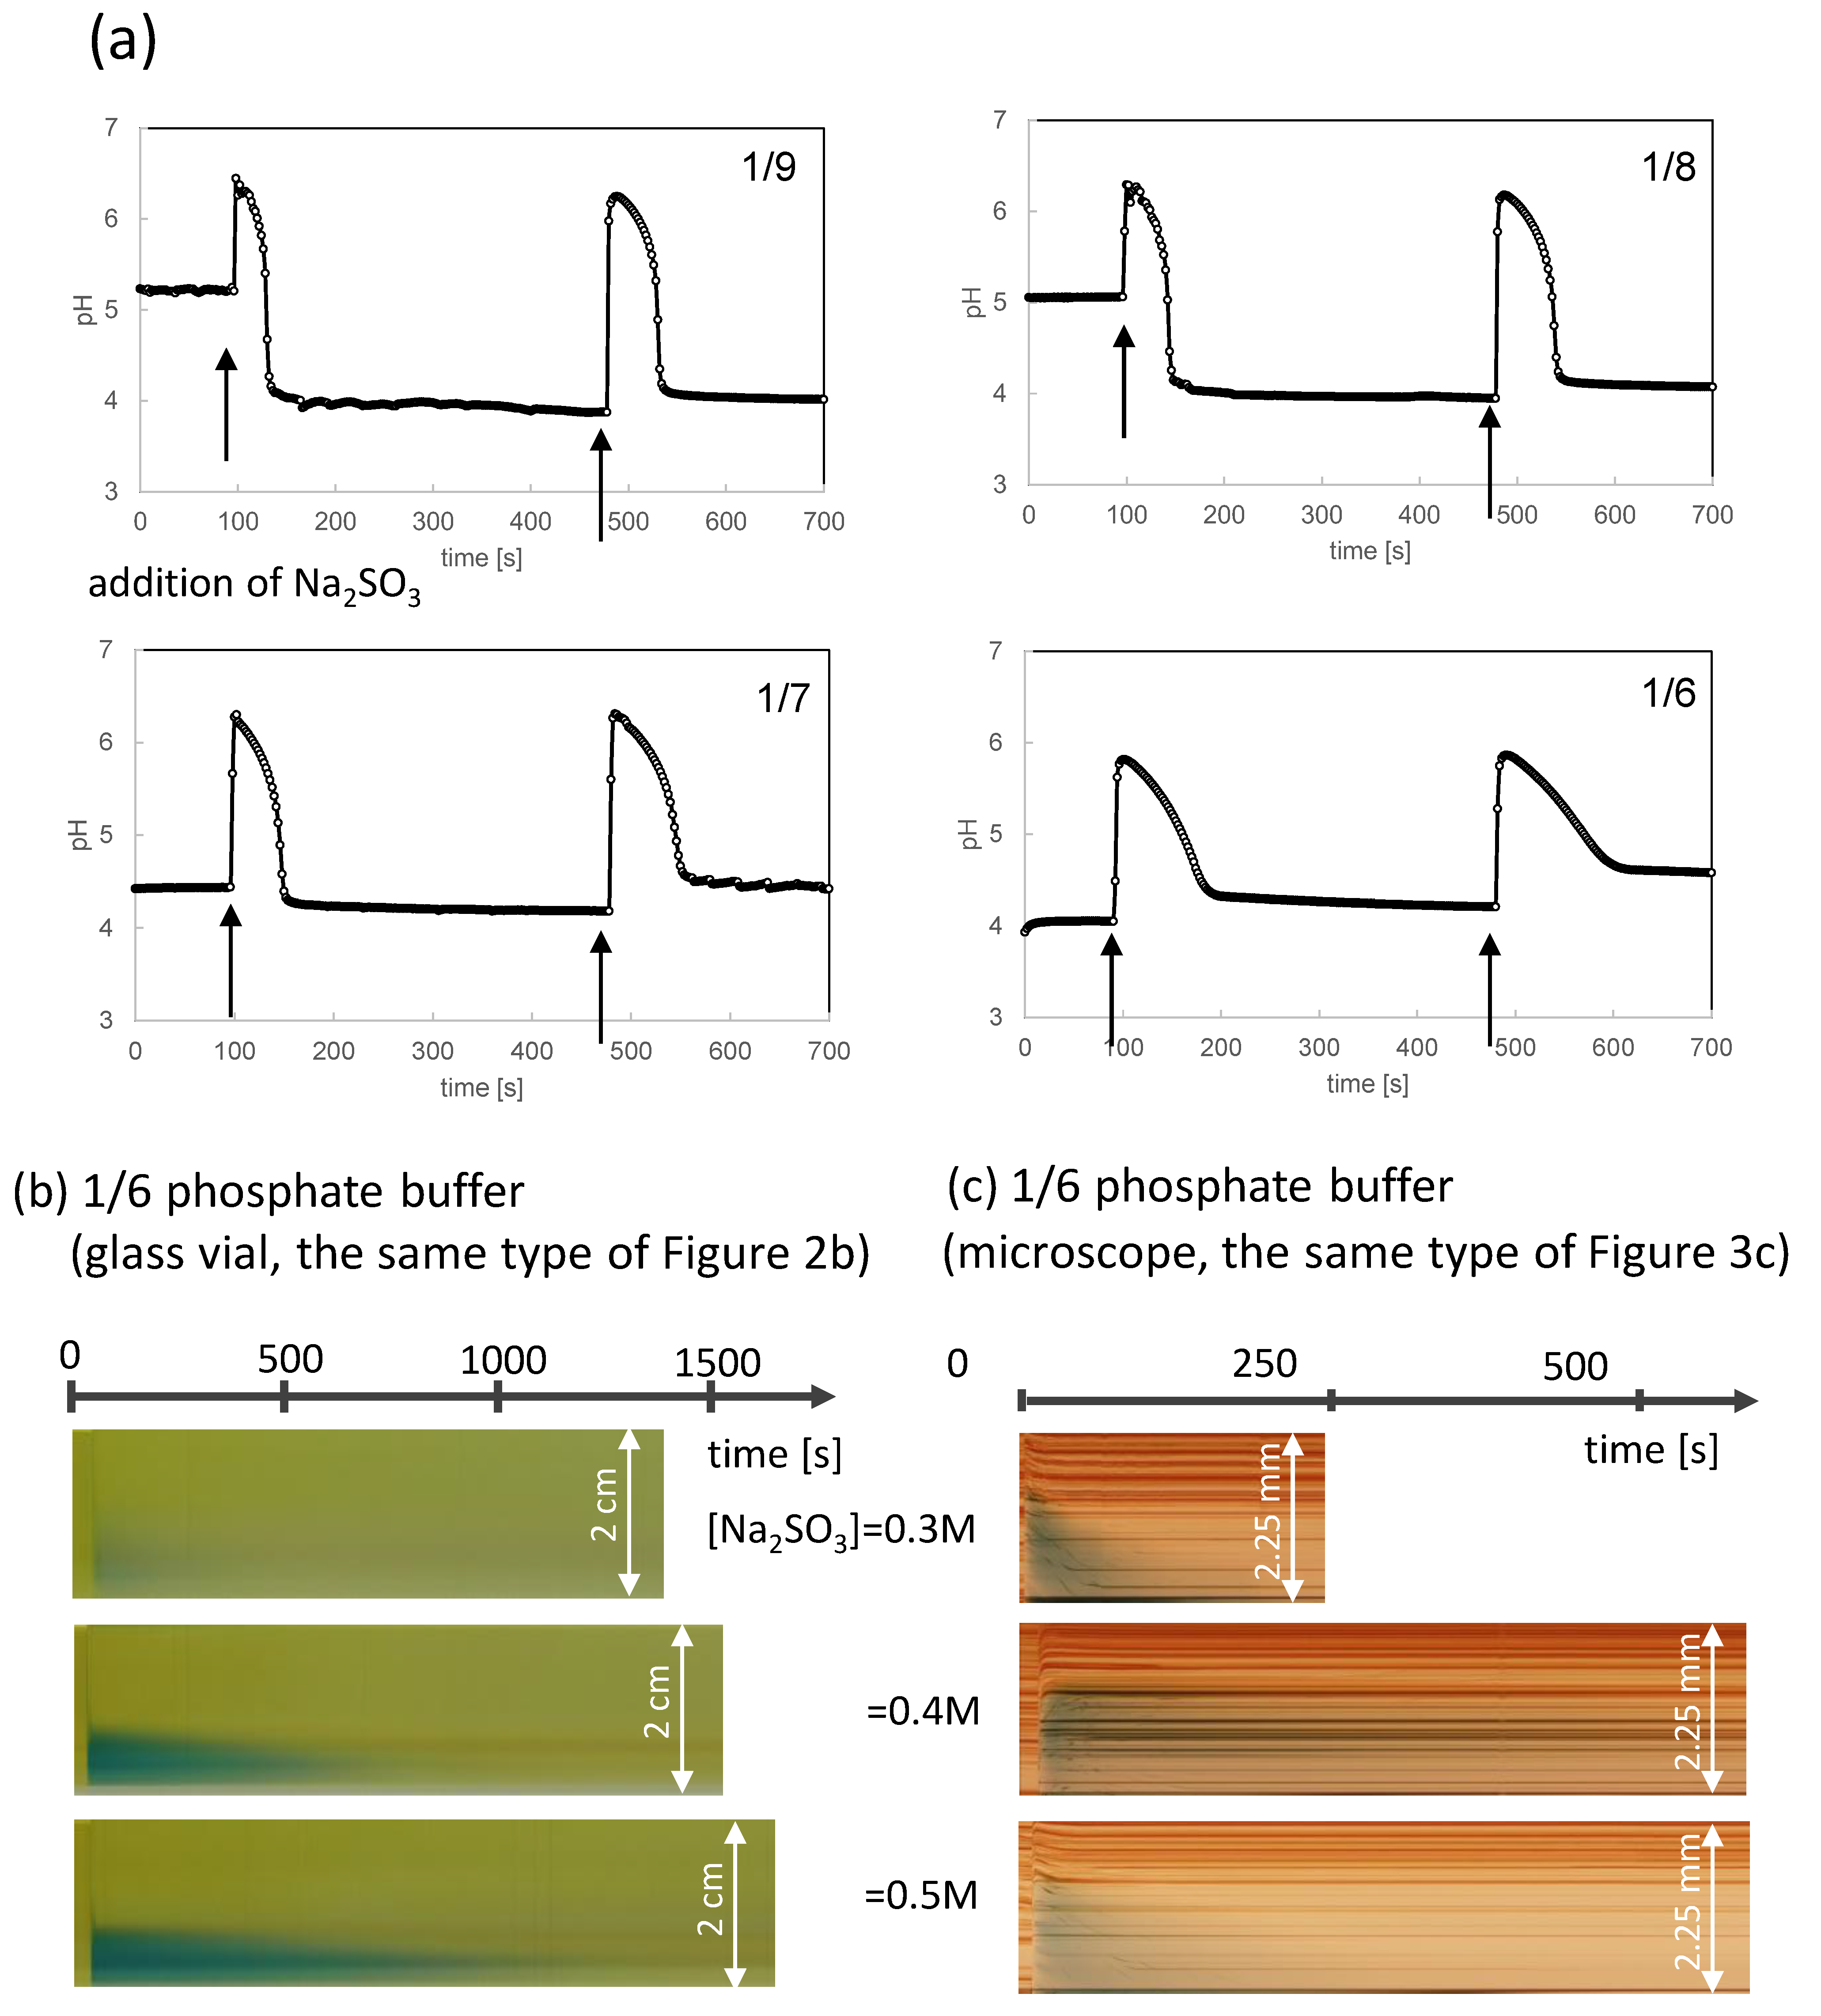
In this study, the pH oscillator was used [33]. The oscillation continued only in the continuous stirred tank reactor (CSTR). In the stirred batch reactor, the pH rapidly increased to approximately 7–8 immediately after the reaction solution was mixed, and the pH decreased to approximately 3 after 400–600 s. When water containing Na2SO3 was added to the solution, a single pulse of a pH oscillation was induced. The pH change in the stirred batch reactor is shown in Figure 2a; it starts to rise immediately after the addition of Na2SO3 (indicated by the arrow), and the maximum duration with the highest pH is approximately one-hundred seconds. In this experiment, the volume ratio of the Na2SO3-containing solution to the pH oscillator solution was fixed at 1/40, which was also used to observe the VA transformation. The pH oscillation observed is essentially identical to that reported already [33]. For the purpose of this study, the control of the oscillation pattern is important. Figure 2a shows that the amplitude and duration of the higher pH is affected by the concentration of the added Na2SO3.
When the tank was not stirred, the added water containing Na2SO3 sank to the bottom owing to its higher density—the density of the pH oscillator solution and that of the Na2SO3 solution was 1.25 and 1.35 g/cm3, respectively. As the pH oscillation was initiated at the bottom, the higher pH region expanded (propagated) from the bottom to the whole of the tank. This propagation was visualized using the pH indicator (BTB). The results are shown in Figure 2b as a space–time plot. In this case, the pH was higher than the neutral value (green color of the BTB) and expanded near the bottom. The measured pH was dependent on the position of the pH electrode. The change in pH, which is detected at the yellow dotted line, is shown in Figure 2b. The complicated pattern of the pH change reflects the spatial inhomogeneity of the pH in addition to its time-dependent nature. At the bottom of the container, the added Na2SO3 remains because of its higher density; therefore, the decrease in pH is not sufficient despite the pH oscillator. As a result, the higher pH region remains at the bottom. This is different from the usual chemical wave caused by chemical oscillation [34] where the extremal concentration region propagates as the wave. The accumulation of a higher pH portion is a gravitational effect and is not significant for VA observations using the setup in Figure 1a, as discussed later.
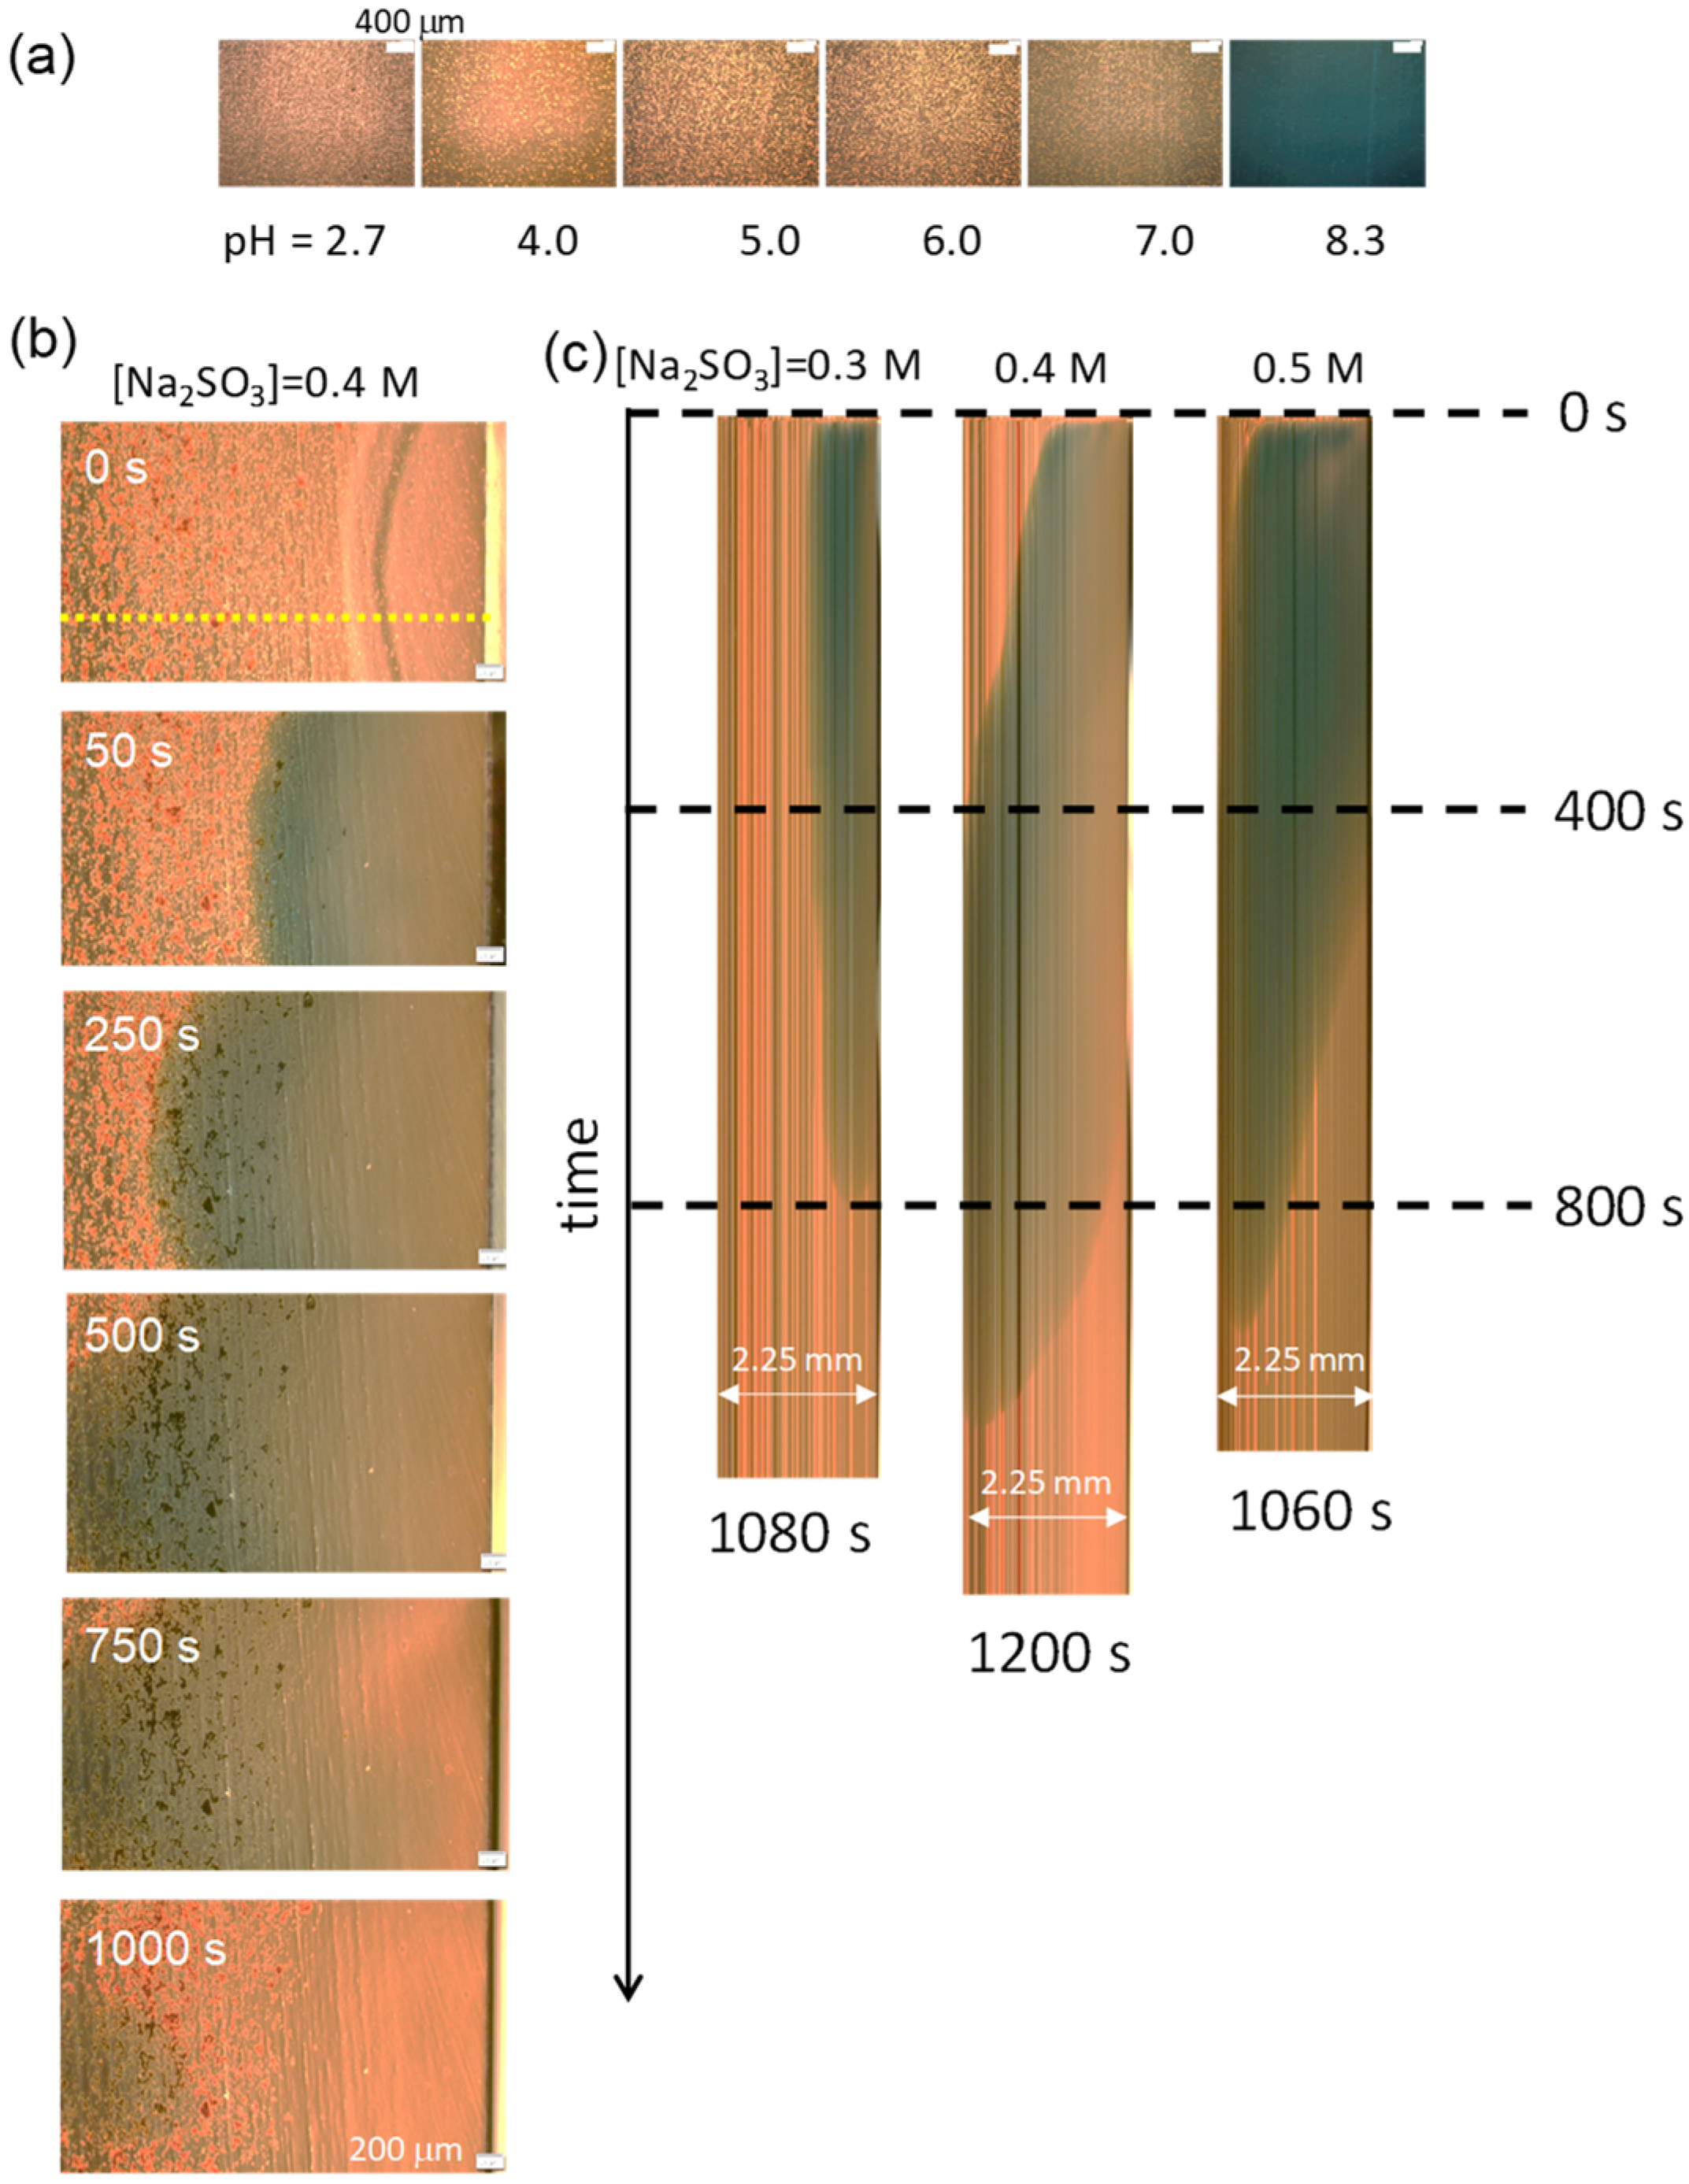
To observe the pH profile in the experiment shown in Figure 1a, a pH oscillator solution that included a pH indicator (BTB) was poured into the hole (hollow) on the glass slide (Figure 1a). Subsequently, an aqueous solution containing Na2SO3 was injected (dropped) from the side end of the hole; the volume ratio of the injected solution to the reaction solution was 1/40, which is the same as that used for the experiment in Figure 2. Because BTB is apt at violating the VA structure, a microscopy with a pH indicator was performed on the VA-free solution. The results are shown in Figure 3. In this experiment, a high amount of BTB was added to enhance the color. Thus, particulate BTB was deposited, resulting in the noisy texture in the images. Figure 3a shows the relationship between the color and pH under a microscope. The microscopy for 0.4 M of the added Na2SO3 (Figure 3b) shows that the higher pH region expands from the injection point (right side) to the opposite (left). The space–time plot for the color change, which is composed of the images on the yellow dotted line in Figure 3b, is shown in Figure 3c. The Na2SO3 solution was added at time zero shown in Figure 3c. The time courses of the green colored region for 0.4 M and 0.5 M of Na2SO3 demonstrate that the pH increases up to 7–8 over the whole field of the microscopy after a few hundred seconds. On the contrary, for 0.3 M of Na2SO3, the pH in the left half of the field is below 7. For all the results, the pH returned to being acidic after several hundred seconds. This is the typical behavior of a chemical wave with a single pulse. The gravitational effect shown in Figure 2b, where a higher pH solution accumulates at the bottom, is not seen in this experiment because the solution is shallow (0.6 mm thickness).
The photographs indicate that the pH change depends on space and time in a complicated manner. In this situation, the time dependence of the pH is more reproducible near the injection point than at a distant location. However, when it is too close to the injection point, the convection caused by the injection strongly affects the VA stability. Therefore, the observation of the VAs was performed from the middle to the left of the microscopy field, as shown in Figure 3b,c, which is approximately 2 mm from the injection point.
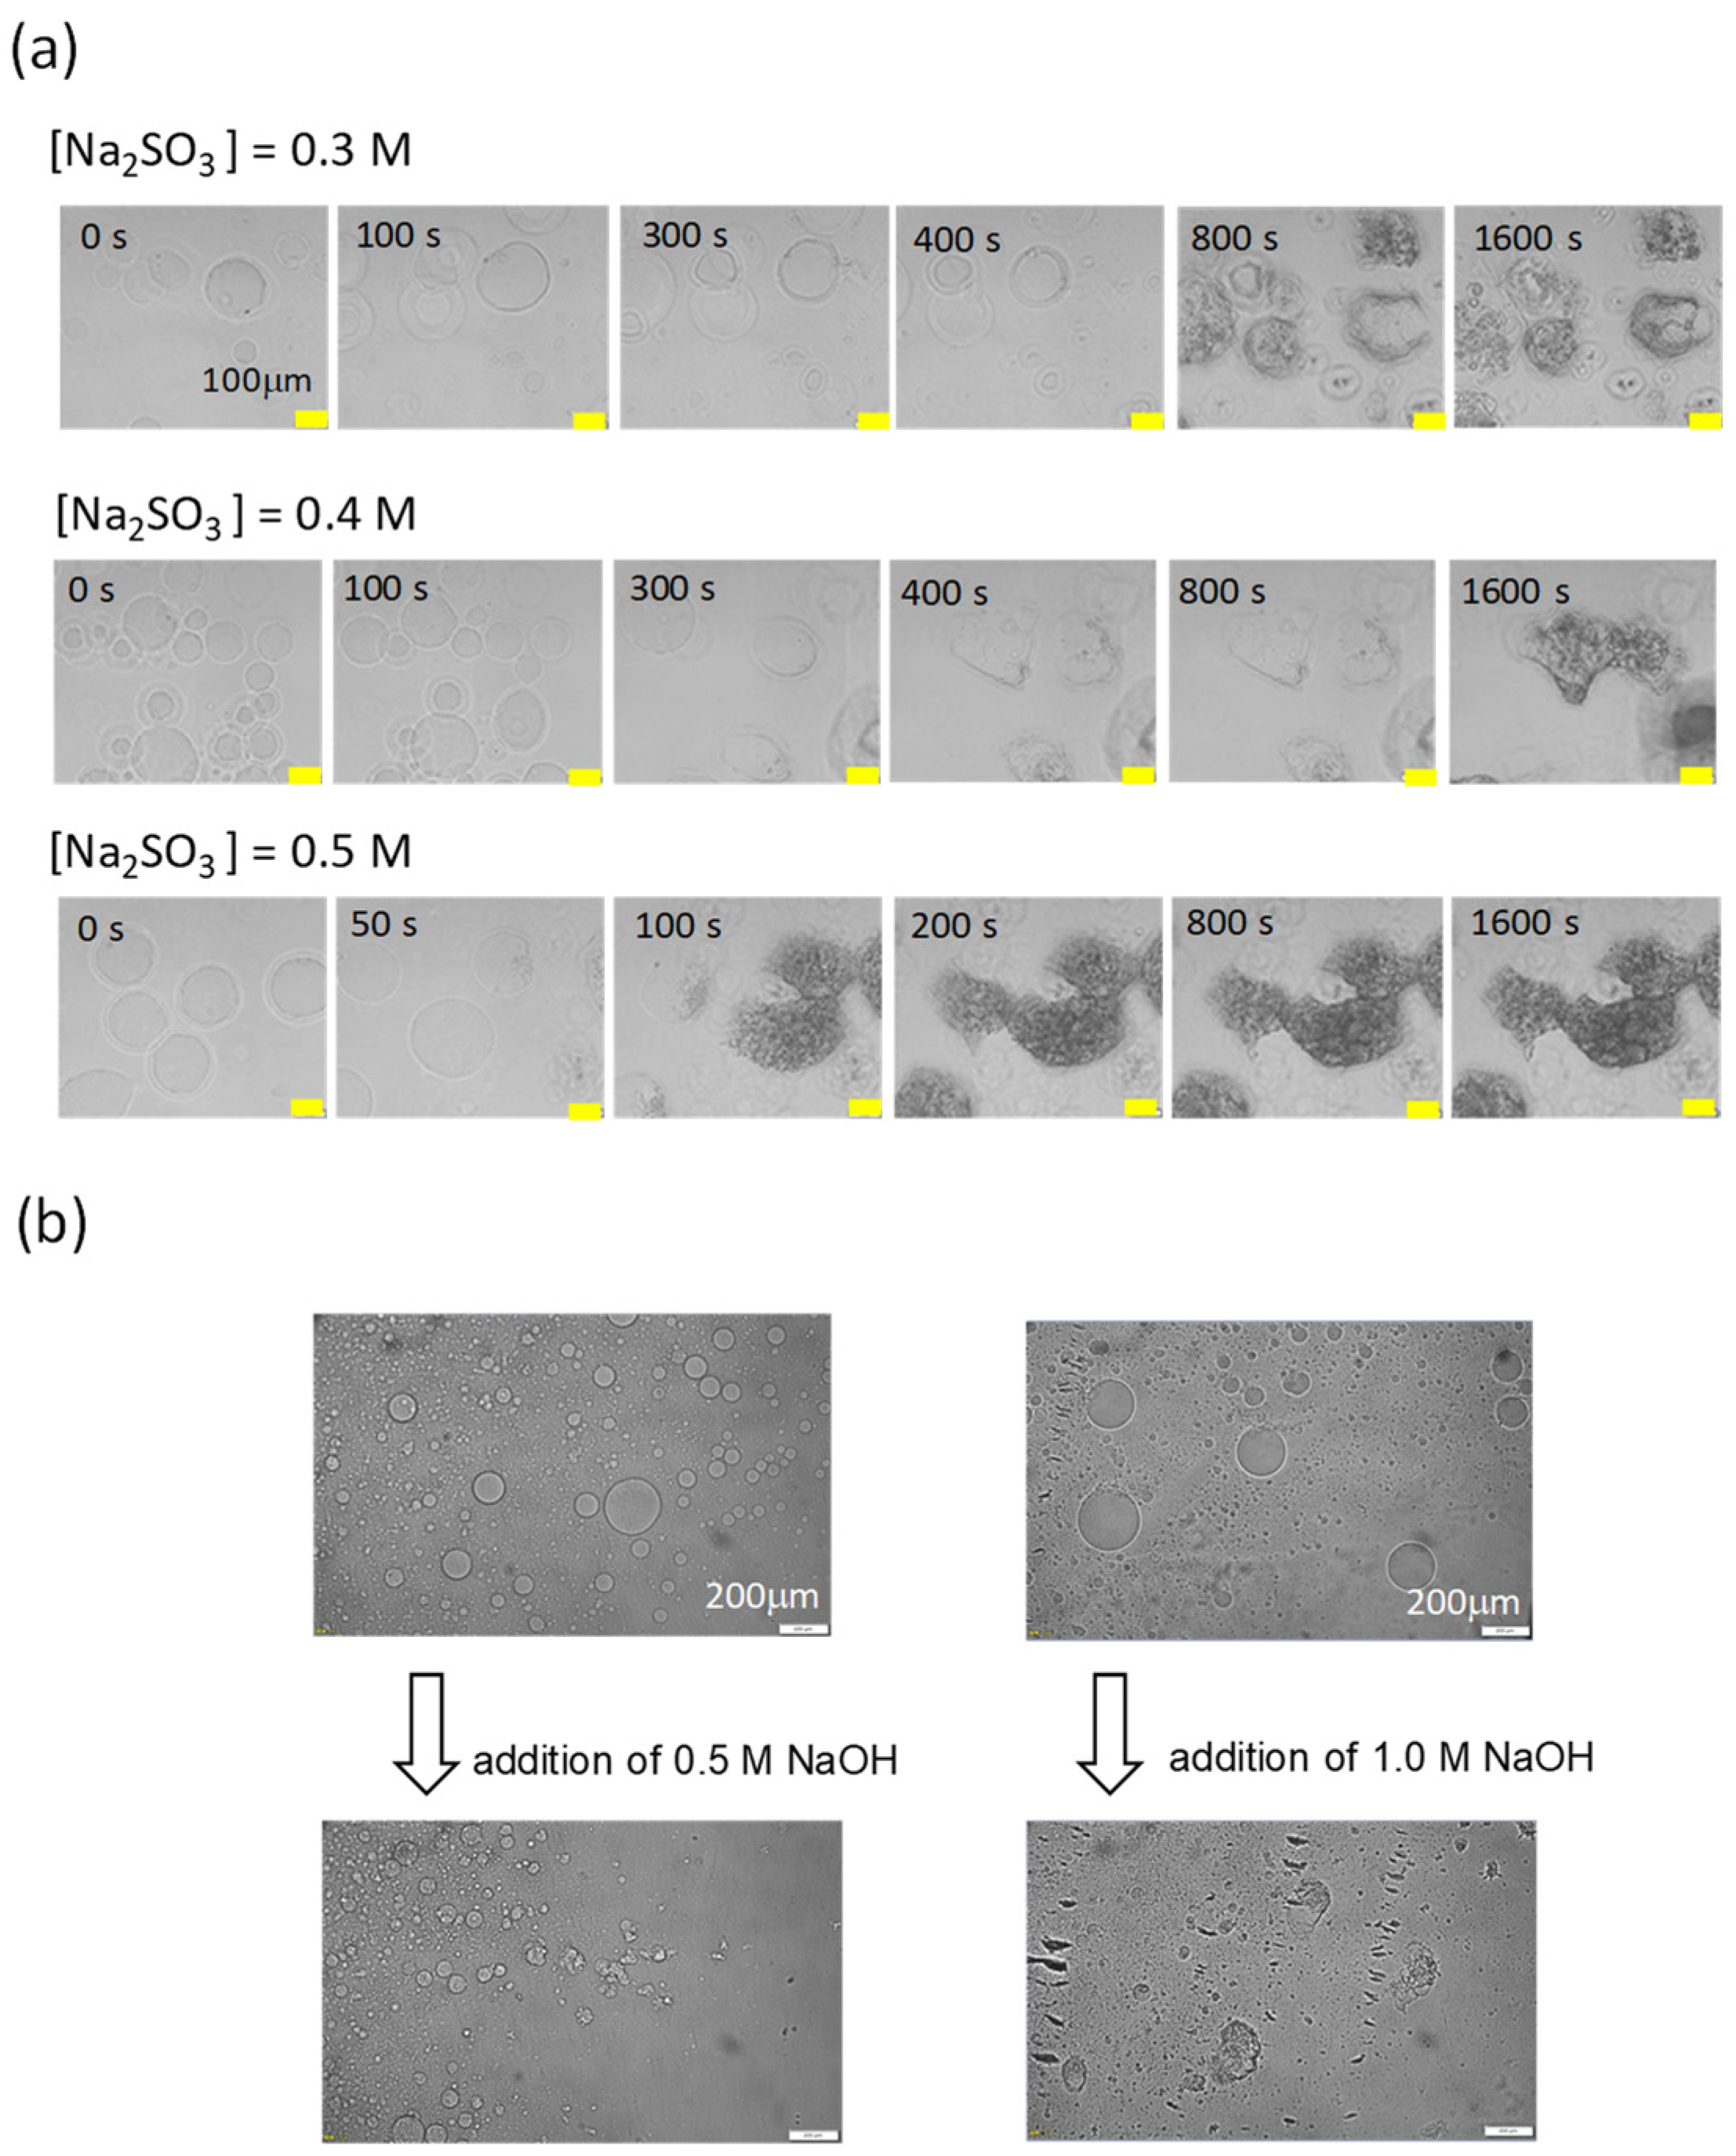
The VA transformation was observed in the experiment in which the VA suspension was poured into a hole in the hole slide glass (Figure 1). Figure 4a shows the time course of the VA structure when the Na2SO3 concentration of the added solution was varied (Supplementary Movies S1–S3). As the VA shape change was not observed for Na2SO3 concentrations that were less than 0.2 M, only Na2SO3 concentrations higher than 0.3 M are presented. Figure 4a shows that the VA structure changes with time. For 0.4 and 0.5 M of Na2SO3, the structural change started approximately 100–400 s after the Na2SO3 addition. The darkening of the photograph probably reflects the irregularly aggregated DDAB molecules. The time range is consistent with that shown in Figure 3c, where it takes 100–400 s for the higher pH region to reach the observation point (left half of the space–time plot). This structural change is irreversible even after 800–1000 s when the pH is considered to be back to being acidic (Figure 3c). The structural changes become more drastic as the Na2SO3 concentration increases.
Figure 2 suggests that the pH change in Figure 4a ranges between 3 and 7. Before the initiation of the pH increase, the VA structure was globular, as shown at 0 s in Figure 4a. The deformation may have been caused by the increase in the pH itself or by other chemical components changing their concentrations. Thus, the structure of the VAs at a higher pH was examined by the addition of an aqueous NaOH solution when the VA was rehydrated with deionized water. The volume ratio of the added solution was fixed at 1/40, and the NaOH concentration was varied. The results are shown in Figure 4b. The structural changes observed were essentially a collapse and/or an aggregation into an irregular shape. This indicates that the deformation shown in Figure 4a was caused by an increase in the pH. Although a DDAB molecule is considered to be inert to pH effects, this result suggests that the degree of ionization may be dependent on the pH as the ammonium ion. In this case, the higher pH is expected to reduce the degree of ionization. When this is reduced, the electrostatic repulsion between the head groups weakens, resulting in stronger aggregation and a collapse. Another possibility of the reason for the structural change is that of the hydrolysis of the surfactant by NaOH, which is discussed for phospholipid vesicles [35]. This is probably not the reason because the structure of the VA returns to the original one under the proper pH oscillation as shown later. If hydrolysis occurs, the reversible change is difficult. As with the other one, the osmotic impact acts on the vesicles when the concentrations of the surrounding chemicals change. In the pH oscillator solution, only the chemical waves induced by the added Na2SO3 reached the vesicle. Thus, the change in the total electrolyte concentration around the vesicles was probably insignificant.
The structure shown in Figure 4a varies with the Na2SO3 concentration. The VA structure of 0.5 m of Na2SO3 collapsed and aggregated after 100 s. In contrast, the structure of 0.3 m of Na2SO3 appears to maintain its original shape. The maximum pH (after Na2SO3 addition) was nearly the same for 0.3 M and 0.5 M of Na2SO3, as shown in Figure 2a. The duration at a pH > 6 was approximately 60 s (0.3 M) and 130 s (0.5 M). Because the Na2SO3 concentration affects the duration more than the maximum pH, the difference in the duration may be considered the cause of the dependency of the Na2SO3 concentration on the VA transformation. Although the duration (the time course of the oscillation pattern) appears to have an impact on the VA transformation, the observed structural change is irreversible in all cases; consequently, the VAs do not return to their initial shape.
3.3. pH Oscillation and Structural Change with the Phosphate Buffer
To further analyze the oscillation pattern, a phosphate buffer was mixed in the pH oscillator solution, as explained in “sample preparation.” The phosphate buffer affects the ionization equilibrium between SO32− and HSO3−. The resultant oscillation pattern after the addition of 0.3 M of Na2SO3 is shown in Figure 5a for a stirred batch reactor; here, the volume ratio of the added solution to the pH oscillator solution containing the phosphate buffer is 1/40, which is the same as that in Figure 2 and Figure 3. The value of 1/n in Figure 5a indicates that the volume of the phosphate buffer is 1/n times that of the pH oscillator solution. The maximum pH did not exceed 6 and was lower than that of the solution without the phosphate buffer (pH ≈ 7; Figure 2a). For the second addition of Na2SO3, the maximum pH and the duration of the higher pH were almost the same as those of the first oscillation, demonstrating that a pH oscillation occurred in the solution with the phosphate buffer. The shape of the pH pulse is nearly trapezoidal (rectangular) without the phosphate buffer (Figure 2a); however, the pulse shape becomes more triangular as the mixing ratio increases (that is, the n-value in the denominator of 1/n decreases), the duration with a pH > 6 becomes shorter (sometimes none), and the pH decreases linearly with time.
The experimental results corresponding to Figure 2b (space–time plots) and Figure 3c are shown in Figure 5b and Figure 5c, respectively. Here, the n-value is 6. The green region, which exhibits a higher pH, was smaller than that without the phosphate buffer. In Figure 5c, which is the experiment with the setup in Figure 1a, the green color disappears at 100–200 s where Na2SO3 is added at the bottom of the space–time plot. (The result of 0.4 M of Na2SO3 shows a duration that is a little longer. This is probably due to the fluctuation in the spatial inhomogeneity because the experiment of Figure 5b does not show the peculiarity at 0.4 M of Na2SO3. Nevertheless, the duration is shorter than that shown in Figure 3c for the same Na2SO3 concentration).
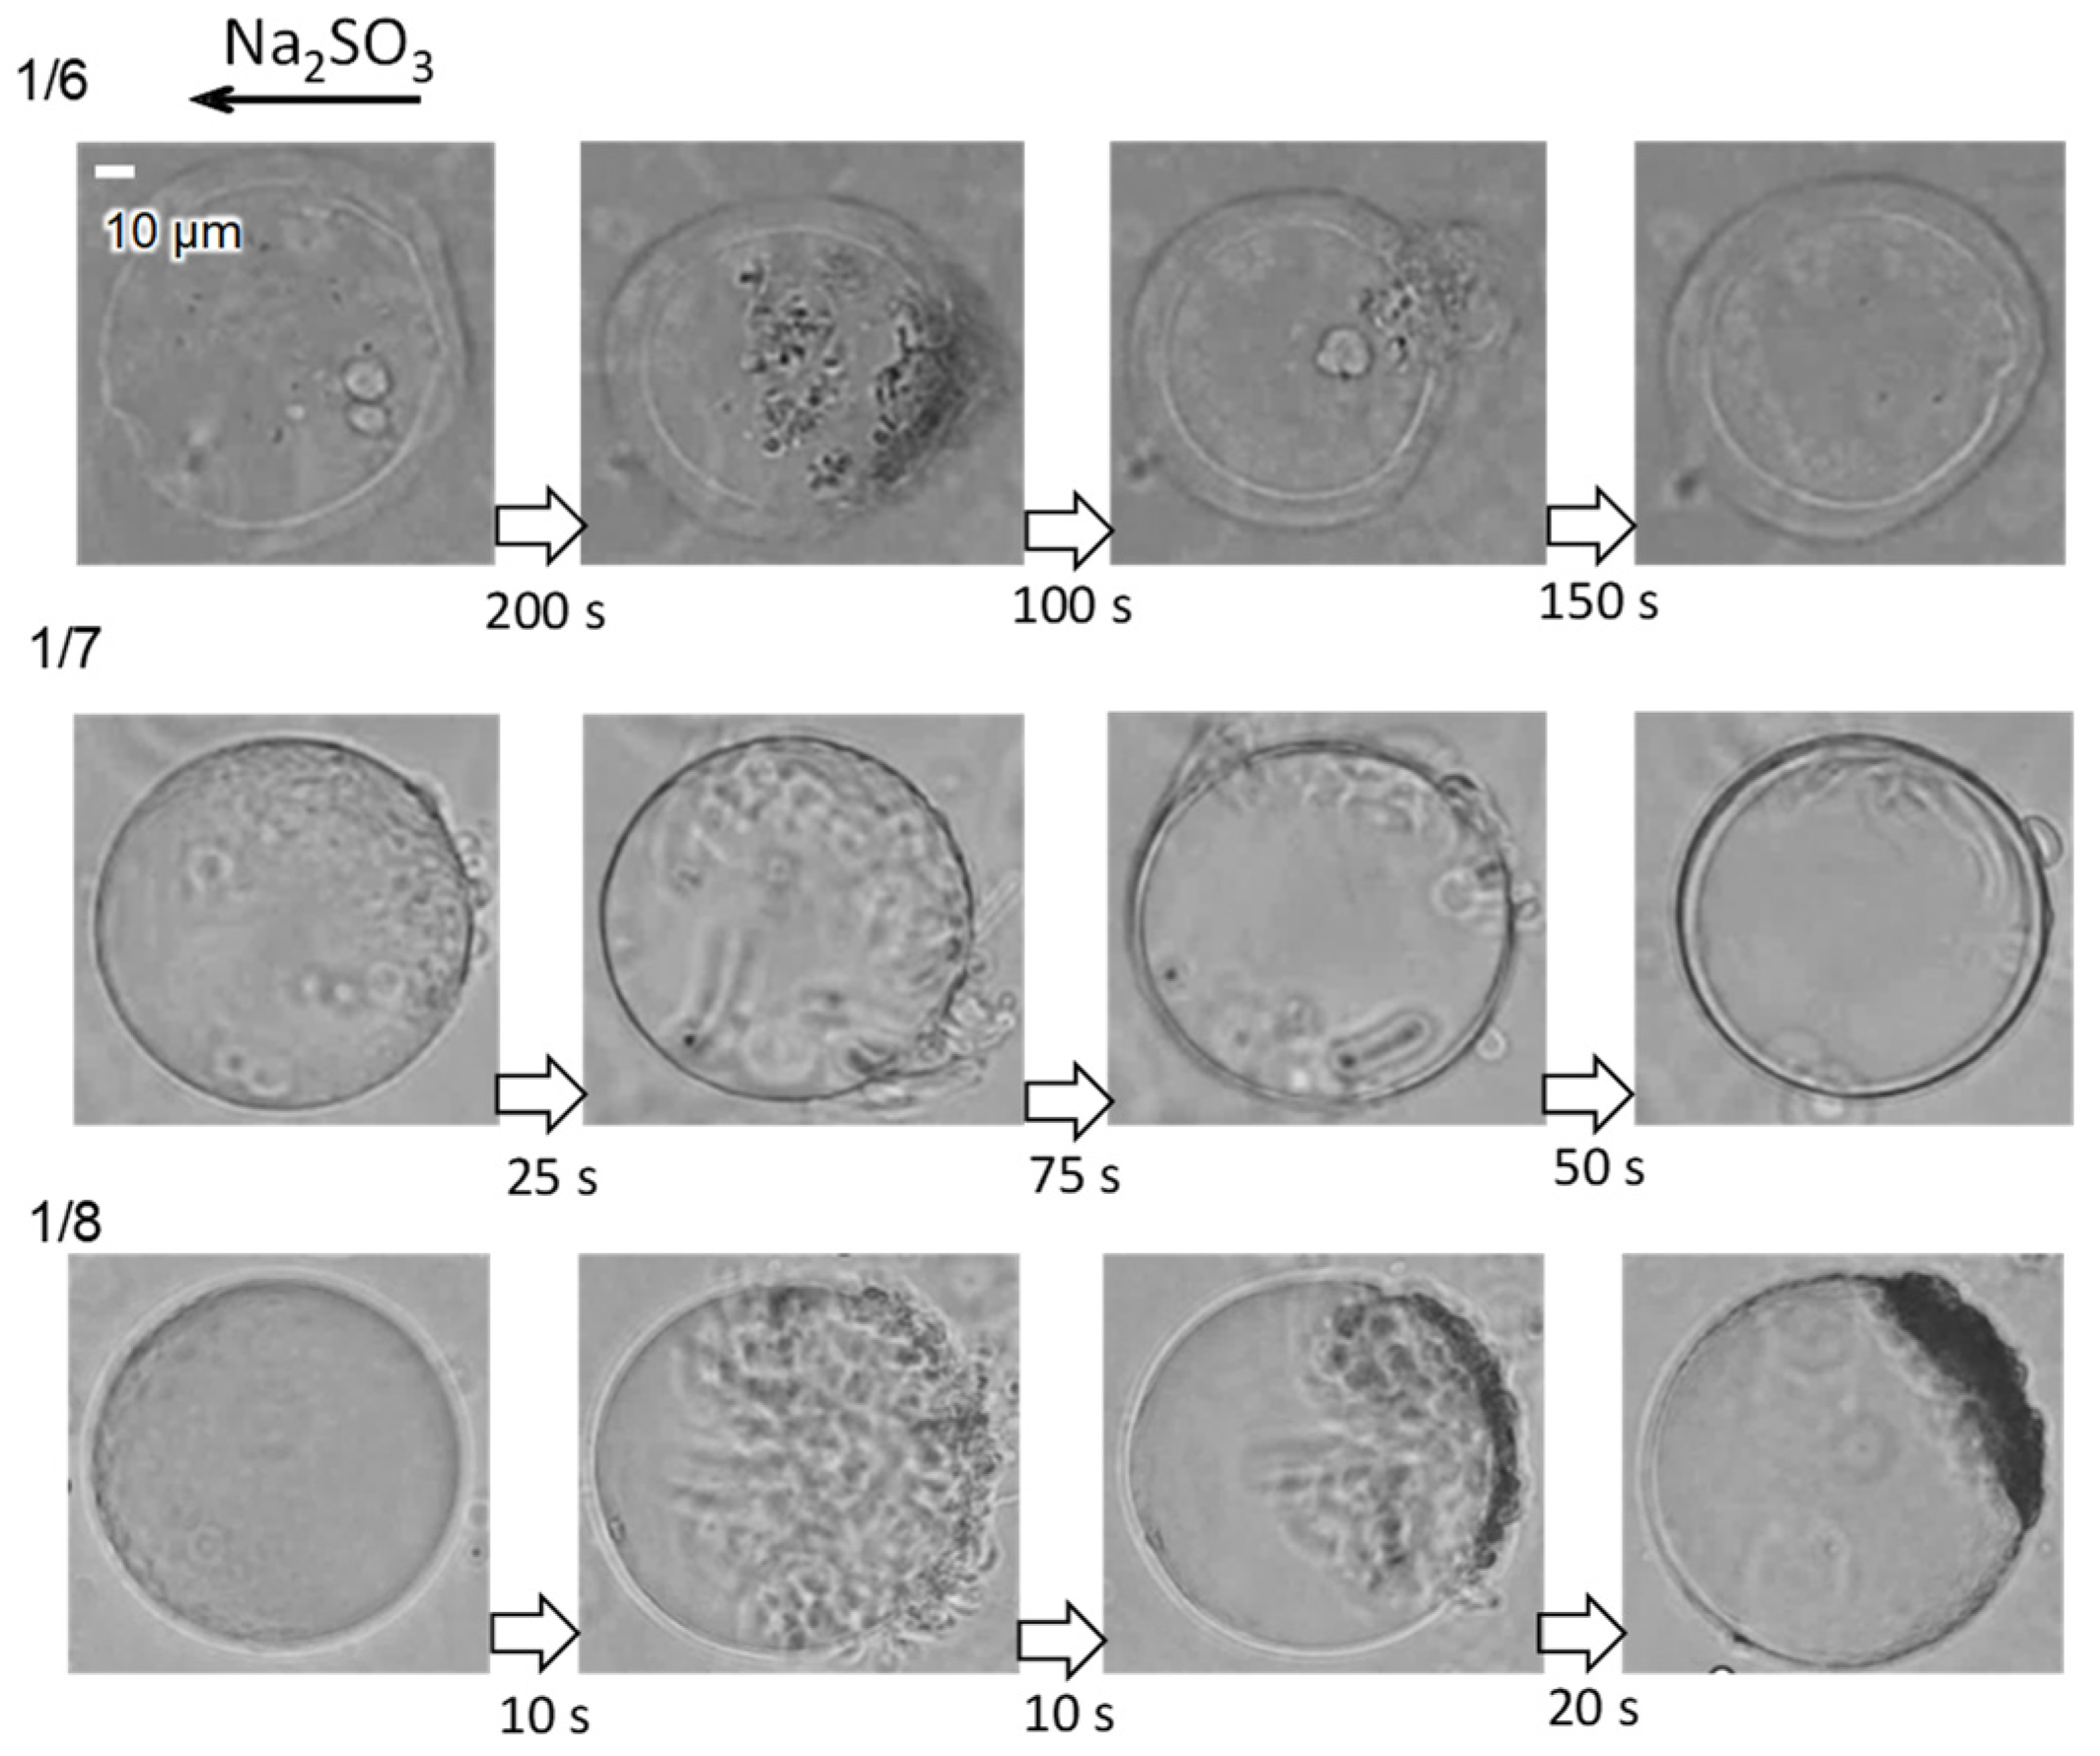
The time course of the change in the VA shape with the phosphate buffer is shown in Figure 6 (Supplementary Movies S4–S6). The VA shape change was relatively low compared with the result shown in Figure 4a (no phosphate buffer). In particular, VA with a 1/6 and a 1/7 mixing ratio of the phosphate buffer returned to a spherical shape. Although the VAs exhibited partial aggregation (collapse) at 200 s for 1/6 and wrinkling formation at 25 s for 1/7, these damages were recovered. At a lower mixing ratio (1/8) of the phosphate buffer, the aggregated structure partially remained on the VA surface. This aftereffect persisted during the observation period. These structural changes proceeded within a few hundred seconds and were much faster than those observed without the phosphate buffer (Figure 4). This is consistent with the comparison between Figure 2, Figure 3 and Figure 5, which show that the time range with a higher pH is shorter for the solution containing the phosphate buffer.
The structure of the VAs formed by rehydration with the phosphate buffer was examined. The formed VAs often collapsed (aggregated) and/or were much smaller than those shown in Figure 4 and Figure 6, even when the VAs were visible. This indicated that the phosphate buffer did not stabilize the VA structure. However, the VA shown in Figure 6 returned to a simple spherical shape in the solution containing the phosphate buffer. Therefore, the reversible transformation of the VA was not caused by the chemical effect of the phosphate buffer but by its effect on the pattern of the pH pulse.
For both cases of Figure 4a and Figure 6, the structural changes are considered to be caused by the pH change. However, the reversibility in both structural changes are quite different. For the reversible case shown in Figure 6, the damage of the VA is localized. This means that the original VA structure remains intact in a part of the VA. These intact portions may work as nuclei for the structural recovery. The time course of Figure 6 shows that the recovery progresses from the damage-free part. This appears to repair the adjacent damaged portion. As the pH is already reduced for the recovery process, the ionized DDAB molecules are able to be assembled following the intact or recovered VA structure. Although this is speculation, the fully damaged vesicle cannot be revived even after the surrounding pH is reduced.
3.4. Effect of the Oscillation Pattern
The results shown in Figure 4 demonstrate that a heavily damaged VA cannot return to its spherical shape. Such heavy damage may be attributed to the longer duration of a pH > 6 because the duration was shorter for a VA suspension containing the phosphate buffer. This effect of the phosphate buffer may be considered to be the shape of the pH pulse. The pH pulse became triangular rather than rectangular as the mixing ratio of the phosphate buffer increased, thereby suggesting that the shape of the pH pulse is an important factor.
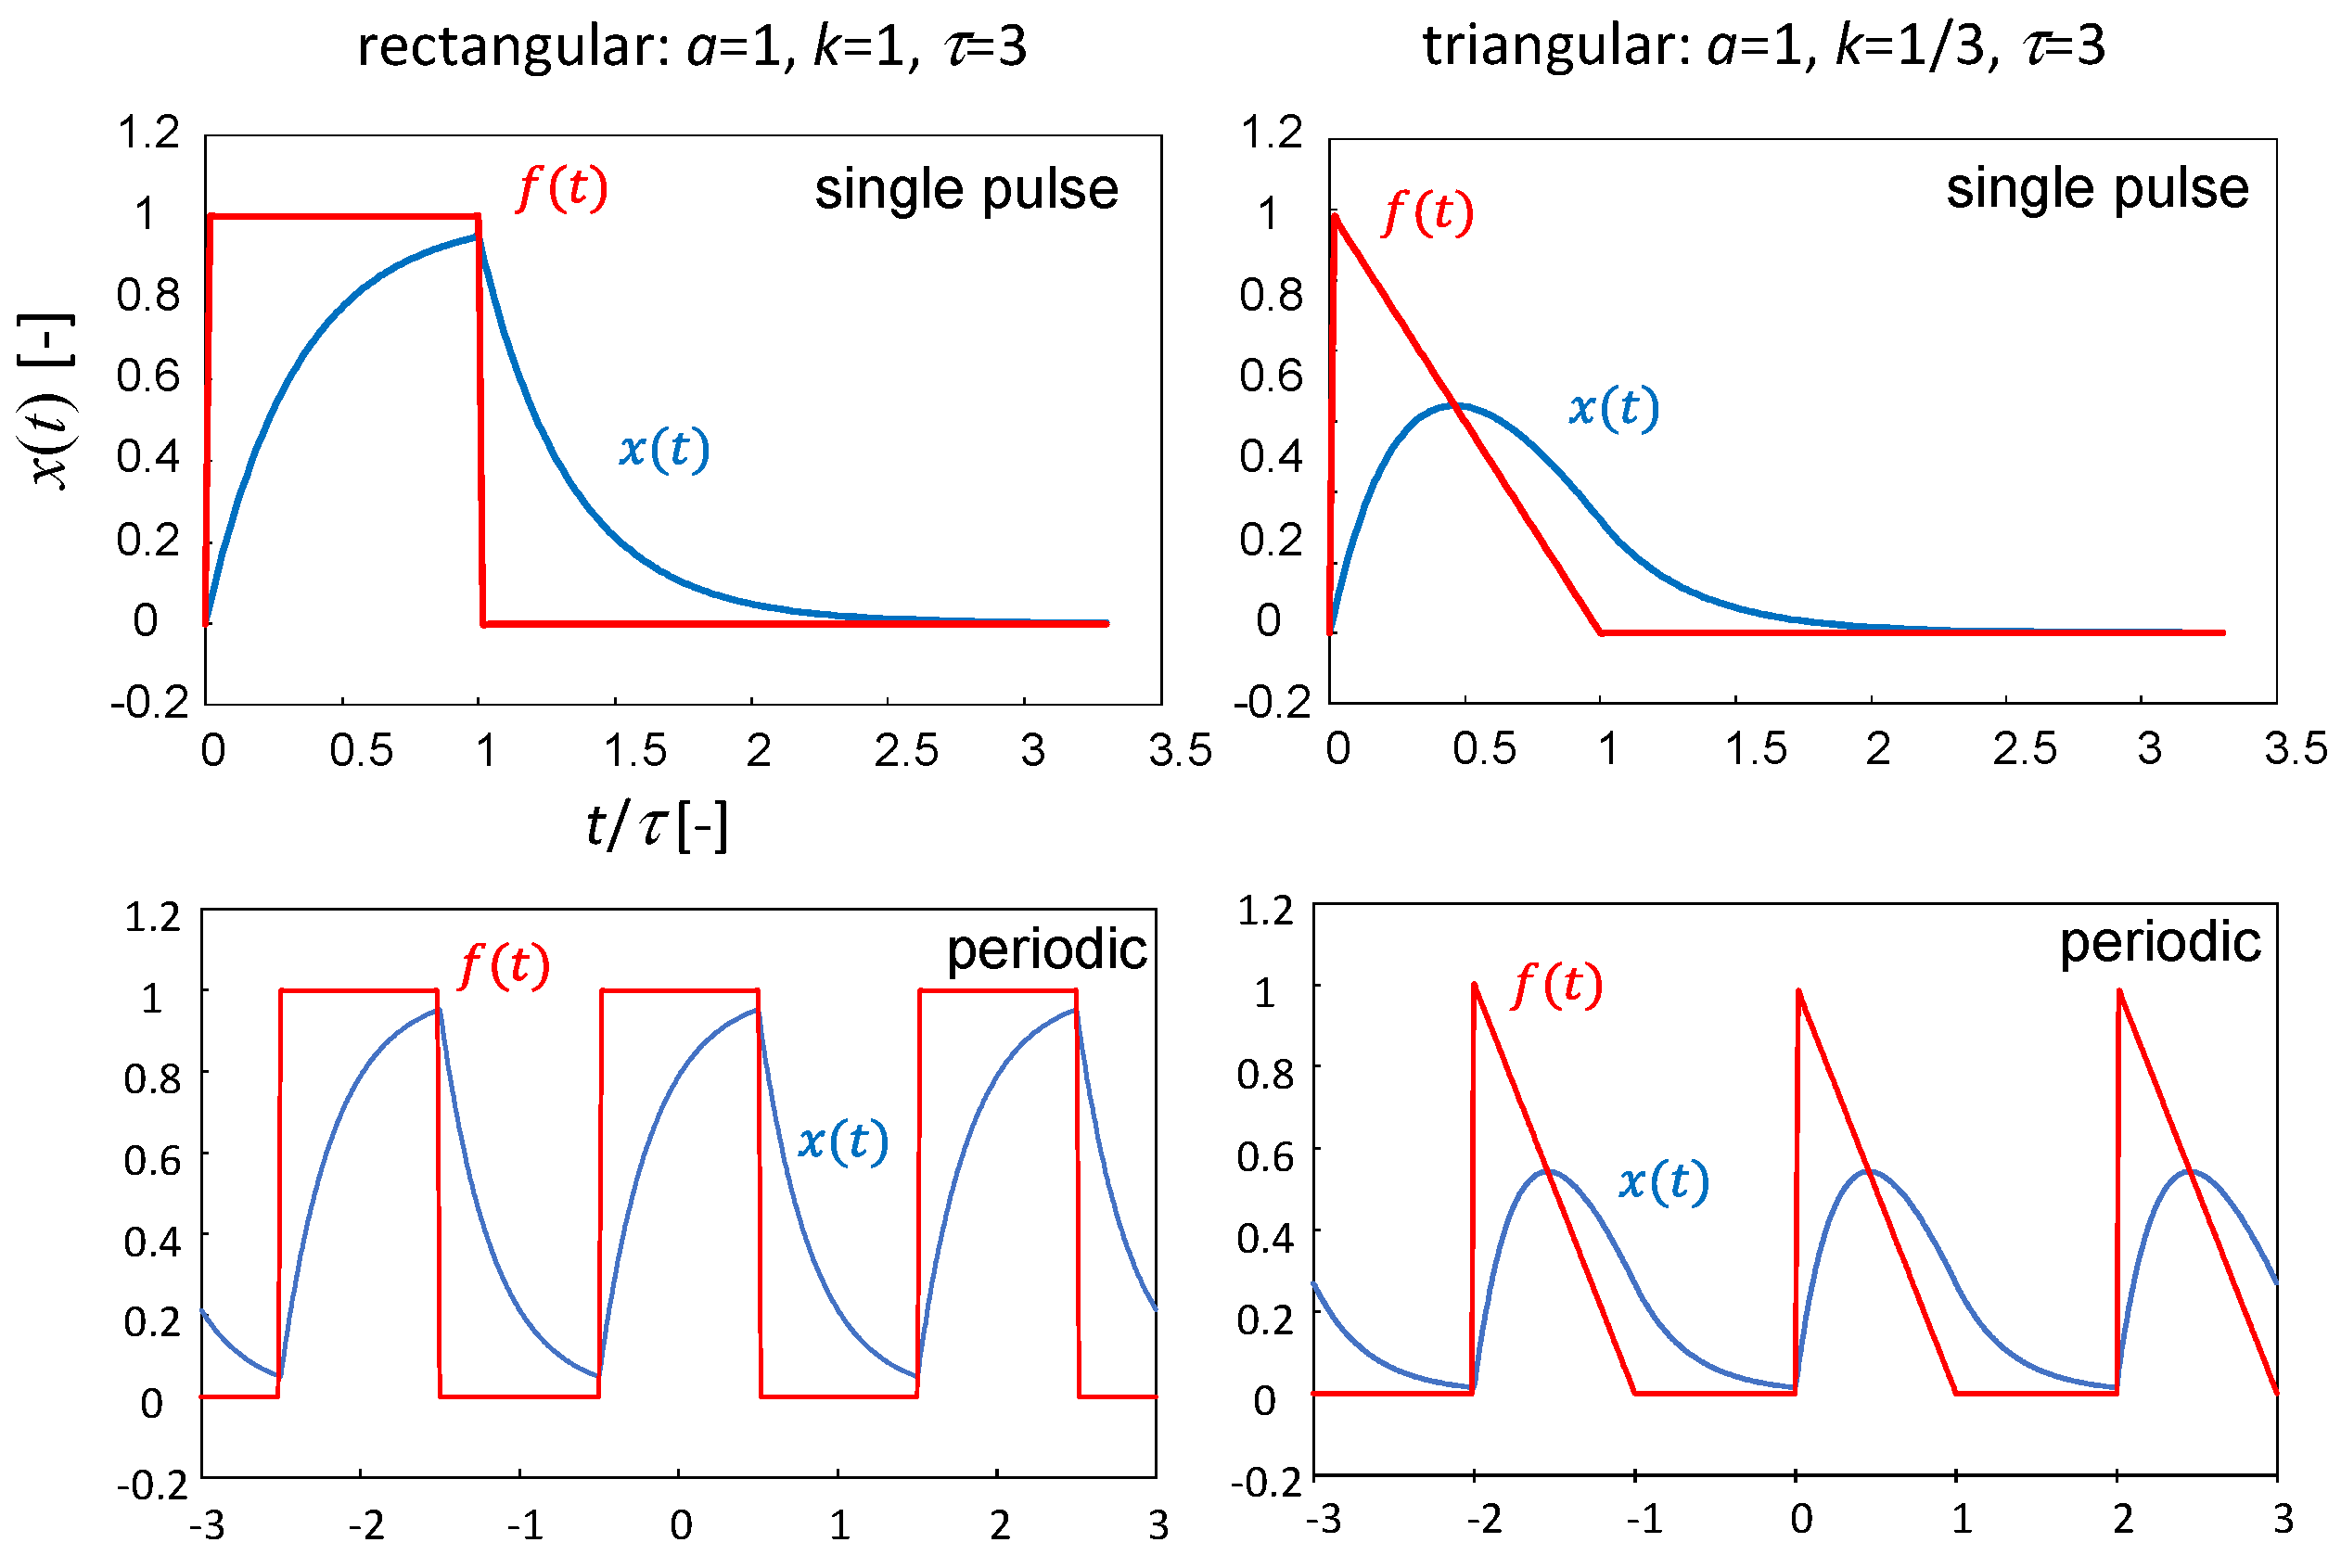
The VA began to transform as the pH increased. This response is not instantaneous and contains a delay element. As the simplest approximation, this may be expressed as a first-order lag by Equation (1) as follows:
where x(t) is a symbolic parameter representing the VA state, and f(t) represents the stimulus acting on x(t); for example, f(t) is a rectangular or triangular function corresponding to a pH pulse. The coefficient a denotes the reciprocal of the time constant. Equation (1) is solved for the two types of f(t).
- (i)
- Rectangular stimulus:
- (ii)
- Triangular stimulus:
The periodic stimuli with the periodicity 2τ are also applied as below.
- (i′)
- Periodic rectangles:
- (ii′)
- Periodic triangles:
Figure 7 shows the response of x(t) for each case. The analytical solution is shown in the Supplementary Document File. The parameters are set so that f(0) = 1 and the abscissa is represented by t/τ. The maximum value of x(t) was much lower for the triangular stimulus than for the rectangular stimulus, even when f(0) was the same (f(0) = 1). This suggests that the damage to the VA caused by the pH pulse could be less severe for the triangular pulse. This agrees with the results shown in Figure 5 and Figure 6, in which the damage to the VA became gentler as the pattern of the pH pulse became more triangular.
For the triangular pulse, the period when the VA is exposed to the higher pH is relatively short. In particular, the period of the pH range that is higher than 6 is expected to be extremely short, as suggested by Figure 5. The structural change in the VA requires a finite time in the order of 10 s (Figure 6). This time is probably comparable to the higher pH period. In this case, the VA structure starts to recover before the whole VA is damaged. Then, the recovery of the VA structure may be able to start from the damage-free part. The reversible transformation of the VA that responds to chemical oscillations is difficult when the VA is heavily damaged. The oscillation amplitude and pattern must be properly controlled so that the VA in the oscillation does not take an extremely different shape from that in the initial state.
4. Conclusions and the Future Perspective
A reversible transformation of the vesicular aggregates was observed in response to pH oscillations. The pH oscillator of the bromate–manganese–sulfite system was applied in the pH range of 3–7. The VAs showed a collapse (aggregation) with an increase in the pH. During the pH oscillation, the collapsed (aggregated) structure did not return to its original structure, even after the pH decreased to being acidic. When the phosphate buffer was mixed with the pH oscillator solution, the collapse (aggregation) was not drastic, and the structure returned to the original globular structure. The addition of the phosphate buffer affected the oscillation pattern of the pH—the shape of pH oscillation changed from being rectangular to triangular. A simple calculation based on the first-order delay model demonstrated that a triangular pH change reduced the degree of perturbation of the structure. Moreover, for the reversible transformation of the VAs, the structure must be placed in non-equilibrium and dynamic states. In this case, the original (damage-free) structure remains in a part of the VA. This part probably works as a base structure for the recovery process. The coexistence of the damaged and intact structures is itself a typical non-equilibrium state.
Vesicle integration and disintegration have been reported [3,6,8], where two extremal structures constituting the oscillation are considered to be in thermodynamic equilibrium states. In other words, the structure follows the chemical environment produced by the chemical oscillation, meaning that a sufficient time is provided for the structural change to reach equilibrium. The results of this study indicate that the VA exhibiting the reversible shape change cannot reach chemical equilibrium corresponding to the chemical environment. Once the VA reached the final structure for a given environment, the structural change becomes irreversible. For example, with the Ca-ion oscillation in cardiac cells [26], the shape change appears to occur in response to the Ca-ion oscillation within a short time scale in biology. The shape changes in biological cells that maintain their lives responding to chemical oscillations appear to proceed under a strong non-equilibrium state. The result of this study suggests that the pattern of the chemical oscillation plays a crucial role in the reversible structural change in amphiphilic molecular assemblies as follows: the role of the chemical oscillations is discussed through the amplitude (extremal concentrations of the important chemicals) and frequency. However, the present study suggests that the oscillation pattern (shape of the time course) may have an impact on the biological functions.
Supplementary Materials
The following supporting information can be downloaded at: https://www.mdpi.com/article/10.3390/pr12030514/s1; Supplementary Movie S1: file name: Figure 4 (0.3 M), Movie for Figure 4a (0.3 M), 50 times accelerated; Supplementary Movie S2: file name: Figure 4 (0.4 M), Movie for Figure 4a (0.4 M), 50 times accelerated; Supplementary Movie S3: file name: Figure 4 (0.5 M), Movie for Figure 4a (0.5 M), 50 times accelerated; Supplementary Movie S4: file name: Figure 6 (1–6), Movie for Figure 6 (1/6), 10 times accelerated; Supplementary Movie S5: file name: Figure 6 (1–7), Movie for Figure 6 (1/7), 10 times accelerated; Supplementary Movie S6: file name: Figure 6 (1–8), Movie for Figure 6 (0.3 M), 10 times accelerated; Supplementary pdf File: file name: Supplementary Document File.
Author Contributions
Conceptualization, A.S., Y.O. and D.Y.; methodology, M.S., R.S. and Y.O.; validation, Y.O. and D.Y.; writing—original draft preparation, A.S. and M.S.; writing—review and editing, Y.O. and D.Y.; visualization, M.S.; supervision, A.S.; funding acquisition, A.S. All authors have read and agreed to the published version of the manuscript.
Funding
This research was funded by the Japanese Society for the Promotion of Science (JSPS). (KAKENHI grant number JP22K03560).
Data Availability Statement
Data supporting the findings reported in this manuscript are available from the corresponding authors upon reasonable request.
Conflicts of Interest
The authors declare no conflicts of interest.
References
- Malkin, E.Z.; Bratman, S.V. Bioactive DNA from extracellular vesicles and particles. Cell Death Dis. 2020, 11, 584. [Google Scholar] [CrossRef]
- Tomasi, R.; Noël, J.-M.; Zenati, A.; Ristori, S.; Rossi, F.; Cabuil, V.; Kanoufi, F.; Abou-Hassan, A. Chemical communication between liposomes encapsulating a chemical oscillatory reaction. Chem. Sci. 2014, 5, 1854–1859. [Google Scholar] [CrossRef]
- Poros-Tarcali, E.; Perez-Mercader, J. Concurrent self-regulated autonomous synthesis and functionalization of pH-responsive giant vesicles by a chemical pH oscillator. Soft Matter 2021, 17, 4011–4018. [Google Scholar] [CrossRef]
- Noguchi, H. Disappearance, division, and route change of excitable reaction-diffusion waves in deformable membranes. Sci. Rep. 2023, 13, 6207. [Google Scholar] [CrossRef]
- Shao, Q.; Zhang, S.; Hu, Z.; Zhou, Y. Multimode Self-Oscillating Vesicle Transformers. Angew. Chem. Int. Ed. 2020, 59, 17125–17129. [Google Scholar] [CrossRef]
- Guo, J.; Poros-Tarcali, E.; Pérez-Mercader, J. Periodic Polymerization and the Generation of Polymer Giant Vesicles Autonomously Driven by pH Oscillatory Chemistry. Front. Chem. 2021, 9, 576349. [Google Scholar] [CrossRef]
- Tamate, R.; Ueki, T.; Shibayama, M.; Yoshida, R. Self-Oscillating Vesicles: Spontaneous Cyclic Structural Changes of Synthetic Diblock Copolymers. Angew. Chem. Int. Ed. 2014, 53, 11248–11252. [Google Scholar] [CrossRef] [PubMed]
- Lagzi, I.; Wang, D.; Kowalczyk, B.; Grzybowski, B.A. Vesicle-to-Micelle Oscillations and Spatial Patterns. Langmuir 2010, 26, 13770–13772. [Google Scholar] [CrossRef]
- Miele, Y.; Holló, G.; Lagzi, I.; Rossi, F. Shape Deformation, Budding and Division of Giant Vesicles and Artificial Cells: A Review. Life 2022, 12, 841. [Google Scholar] [CrossRef] [PubMed]
- Sachin Krishnan, T.V.; Sunil Kumar, P.B. Active membrane recycling induced morphology changes in vesicles. Front. Phys. 2022, 10, 1003558. [Google Scholar] [CrossRef]
- Ho, J.C.S.; Rangamani, P.; Liedberg, B.; Parikh, A.N. Mixing Water, Transducing Energy, and Shaping Membranes: Autonomously Self-Regulating Giant Vesicles. Langmuir 2016, 32, 2151–2163. [Google Scholar] [CrossRef]
- Park, H.; Sut, T.N.; Ferhan, A.R.; Yoon, B.K.; Zhdanov, V.P.; Cho, N.-J.; Jackman, J.A. pH-Modulated Nanoarchitectonics for Enhancement of Multivalency-Induced Vesicle Shape Deformation at Receptor-Presenting Lipid Membrane Interfaces. Langmuir 2023, 39, 8297–8305. [Google Scholar] [CrossRef] [PubMed]
- Chiba, T.; Sakuma, Y.; Imai, M.; Ziherl, P. Morphology of vesicle triplets: Shape transformation at weak and strong adhesion limits. Soft Matter 2023, 19, 4286–4296. [Google Scholar] [CrossRef] [PubMed]
- Tamemoto, N.; Noguchi, H. Pattern formation in reaction–diffusion system on membrane with mechanochemical feedback. Sci. Rep. 2020, 10, 19582. [Google Scholar] [CrossRef] [PubMed]
- Dimitrov, V.; Kakorin, S.; Neumann, E. Transient oscillation of shape and membrane conductivity changes by field pulse-induced electroporation in nano-sized phospholipid vesicles. Phys. Chem. Chem. Phys. 2013, 15, 6303–6322. [Google Scholar] [CrossRef] [PubMed]
- Nawa, E.; Yamamoto, D.; Shioi, A. Chemotactic Amoeboid-Like Shape Change of a Vesicle under a pH Gradient. Bull. Chem. Soc. Jpn. 2015, 88, 1536–1544. [Google Scholar] [CrossRef]
- Baumgart, T.; Hess, S.T.; Webb, W.W. Imaging coexisting fluid domains in biomembrane models coupling curvature and line tension. Nature 2003, 425, 821–824. [Google Scholar] [CrossRef] [PubMed]
- Kato, A.; Tsuji, A.; Yanagisawa, M.; Saeki, D.; Juni, K.; Morimoto, Y.; Yoshikawa, K. Phase Separation on a Phospholipid Membrane Inducing a Characteristic Localization of DNA Accompanied by Its Structural Transition. J. Phys. Chem. Lett. 2010, 1, 3391–3395. [Google Scholar] [CrossRef]
- Nawa-Okita, E.; Nakao, Y.; Yamamoto, D.; Shioi, A. A Molecular Assembly Machine Working under a Quasi-Steady State pH Gradient. Bull. Chem. Soc. Jpn. 2020, 93, 604–610. [Google Scholar] [CrossRef]
- Vutukuri, H.R.; Hoore, M.; Abaurrea-Velasco, C.; van Buren, L.; Dutto, A.; Auth, T.; Fedosov, D.A.; Gompper, G.; Vermant, J. Active particles induce large shape deformations in giant lipid vesicles. Nature 2020, 586, 52–56. [Google Scholar] [CrossRef]
- Iyer, P.; Gompper, G.; Fedosov, D.A. Non-equilibrium shapes and dynamics of active vesicles. Soft Matter 2022, 18, 6868–6881. [Google Scholar] [CrossRef] [PubMed]
- Chen, J.; Hua, Y.; Jiang, Y.; Zhou, X.; Zhang, L. Rotational Diffusion of Soft Vesicles Filled by Chiral Active Particles. Sci. Rep. 2017, 7, 15006. [Google Scholar] [CrossRef] [PubMed]
- Paoluzzi, M.; Di Leonardo, R.; Marchetti, M.C.; Angelani, L. Shape and Displacement Fluctuations in Soft Vesicles Filled by Active Particles. Sci. Rep. 2016, 6, 34146. [Google Scholar] [CrossRef] [PubMed]
- Takiguchi, K.; Negishi, M.; Tanaka-Takiguchi, Y.; Hayashi, M.; Yoshikawa, K. Specific Transformation of Assembly with Actin Filaments and Molecular Motors in a Cell-Sized Self-Emerged Liposome. Orig. Life Evol. Biosph. 2014, 44, 325–329. [Google Scholar] [CrossRef]
- Blanchoin, L.; Boujemaa-Paterski, R.; Sykes, C.; Plastino, J. Actin Dynamics, Architecture, and Mechanics in Cell Motility. Physiol. Rev. 2014, 94, 235–263. [Google Scholar] [CrossRef]
- Cohen, O.; Safran, S.A. Physics of Spontaneous Calcium Oscillations in Cardiac Cells and Their Entrainment. Phys. Rev. Lett. 2019, 122, 198101. [Google Scholar] [CrossRef]
- Nakada, M.; Fujikami, Y.; Kawaguchi, M.; Yamamoto, D.; Shioi, A. A molecular assembly that crawls on a solid substrate with a metabolic-like process. Mol. Syst. Des. Eng. 2016, 1, 208–215. [Google Scholar] [CrossRef]
- Brochard-Wyart, F.; de Gennes, P.G.; Sandre, O. Transient pores in stretched vesicles: Role of leak-out. Phys. A Stat. Mech. Its Appl. 2000, 278, 32–51. [Google Scholar] [CrossRef]
- Nomura, F.; Nagata, M.; Inaba, T.; Hiramatsu, H.; Hotani, H.; Takiguchi, K. Capabilities of liposomes for topological transformation. Proc. Natl. Acad. Sci. USA 2001, 98, 2340–2345. [Google Scholar] [CrossRef]
- Umeda, T.; Nomura, F.; Inaba, T.; Takiguchi, K.; Hotani, H. Stepwise Shrinkage of Liposomes Driven by Thermal Fluctuations of the Membranes. ChemPhysChem 2005, 6, 1047–1050. [Google Scholar] [CrossRef] [PubMed]
- Takeda, S.; Saitoh, A.; Furuta, M.; Satomi, N.; Ishino, A.; Nishida, G.; Sudo, H.; Hotani, H.; Takiguchi, K. Opening of Holes in Liposomal Membranes Is Induced by Proteins Possessing the FERM Domain. J. Mol. Biol. 2006, 362, 403–413. [Google Scholar] [CrossRef]
- Hamada, T.; Hirabayashi, Y.; Ohta, T.; Takagi, M. Rhythmic pore dynamics in a shrinking lipid vesicle. Phys. Rev. E 2009, 80, 051921. [Google Scholar] [CrossRef] [PubMed]
- Rábai, G.; Kaminaga, A.; Hanazaki, I. Mechanism of the Oscillatory Bromate Oxidation of Sulfite and Ferrocyanide in a CSTR. J. Phys. Chem. 1996, 100, 16441–16442. [Google Scholar] [CrossRef]
- Mikhailov, A.S.; Showalter, K. Control of waves, patterns and turbulence in chemical systems. Phys. Rep. 2006, 425, 79–194. [Google Scholar] [CrossRef]
- Kodama, A.; Sakuma, Y.; Imai, M.; Oya, Y.; Kawakatsu, T.; Puff, N.; Angelova, M.I. Migration of phospholipid vesicles in response to OH− stimuli. Soft Matter 2016, 12, 2877–2886. [Google Scholar] [CrossRef]
Figure 1.
Experimental setup and VA structure. (a) Schematic of the experimental setup. A small water droplet containing Na2SO3 (or NaOH) was placed in the side of the hole slide. (b) Optical microscopy images of the VA rehydrated with deionized water. (b1) Initial structure and (b2) structure after 150 s of irradiation with excited light.
Figure 2.
The pH oscillation in a glass vial. (a) Time course of the pH under stirring (250 rpm). Na2SO3 is added at the time indicated by the arrow. (b) Time course of the pH in the vial without stirring. Time zero is immediately after the Na2SO3 addition. Space–time plot of the color change of BTB is also shown where the abscissa is common to the pH change and the yellow dotted line denotes the position of the pH detection. The added solution sinks and is placed near the bottom. The detected pH oscillates. Note that the time zero is different between (a,b).
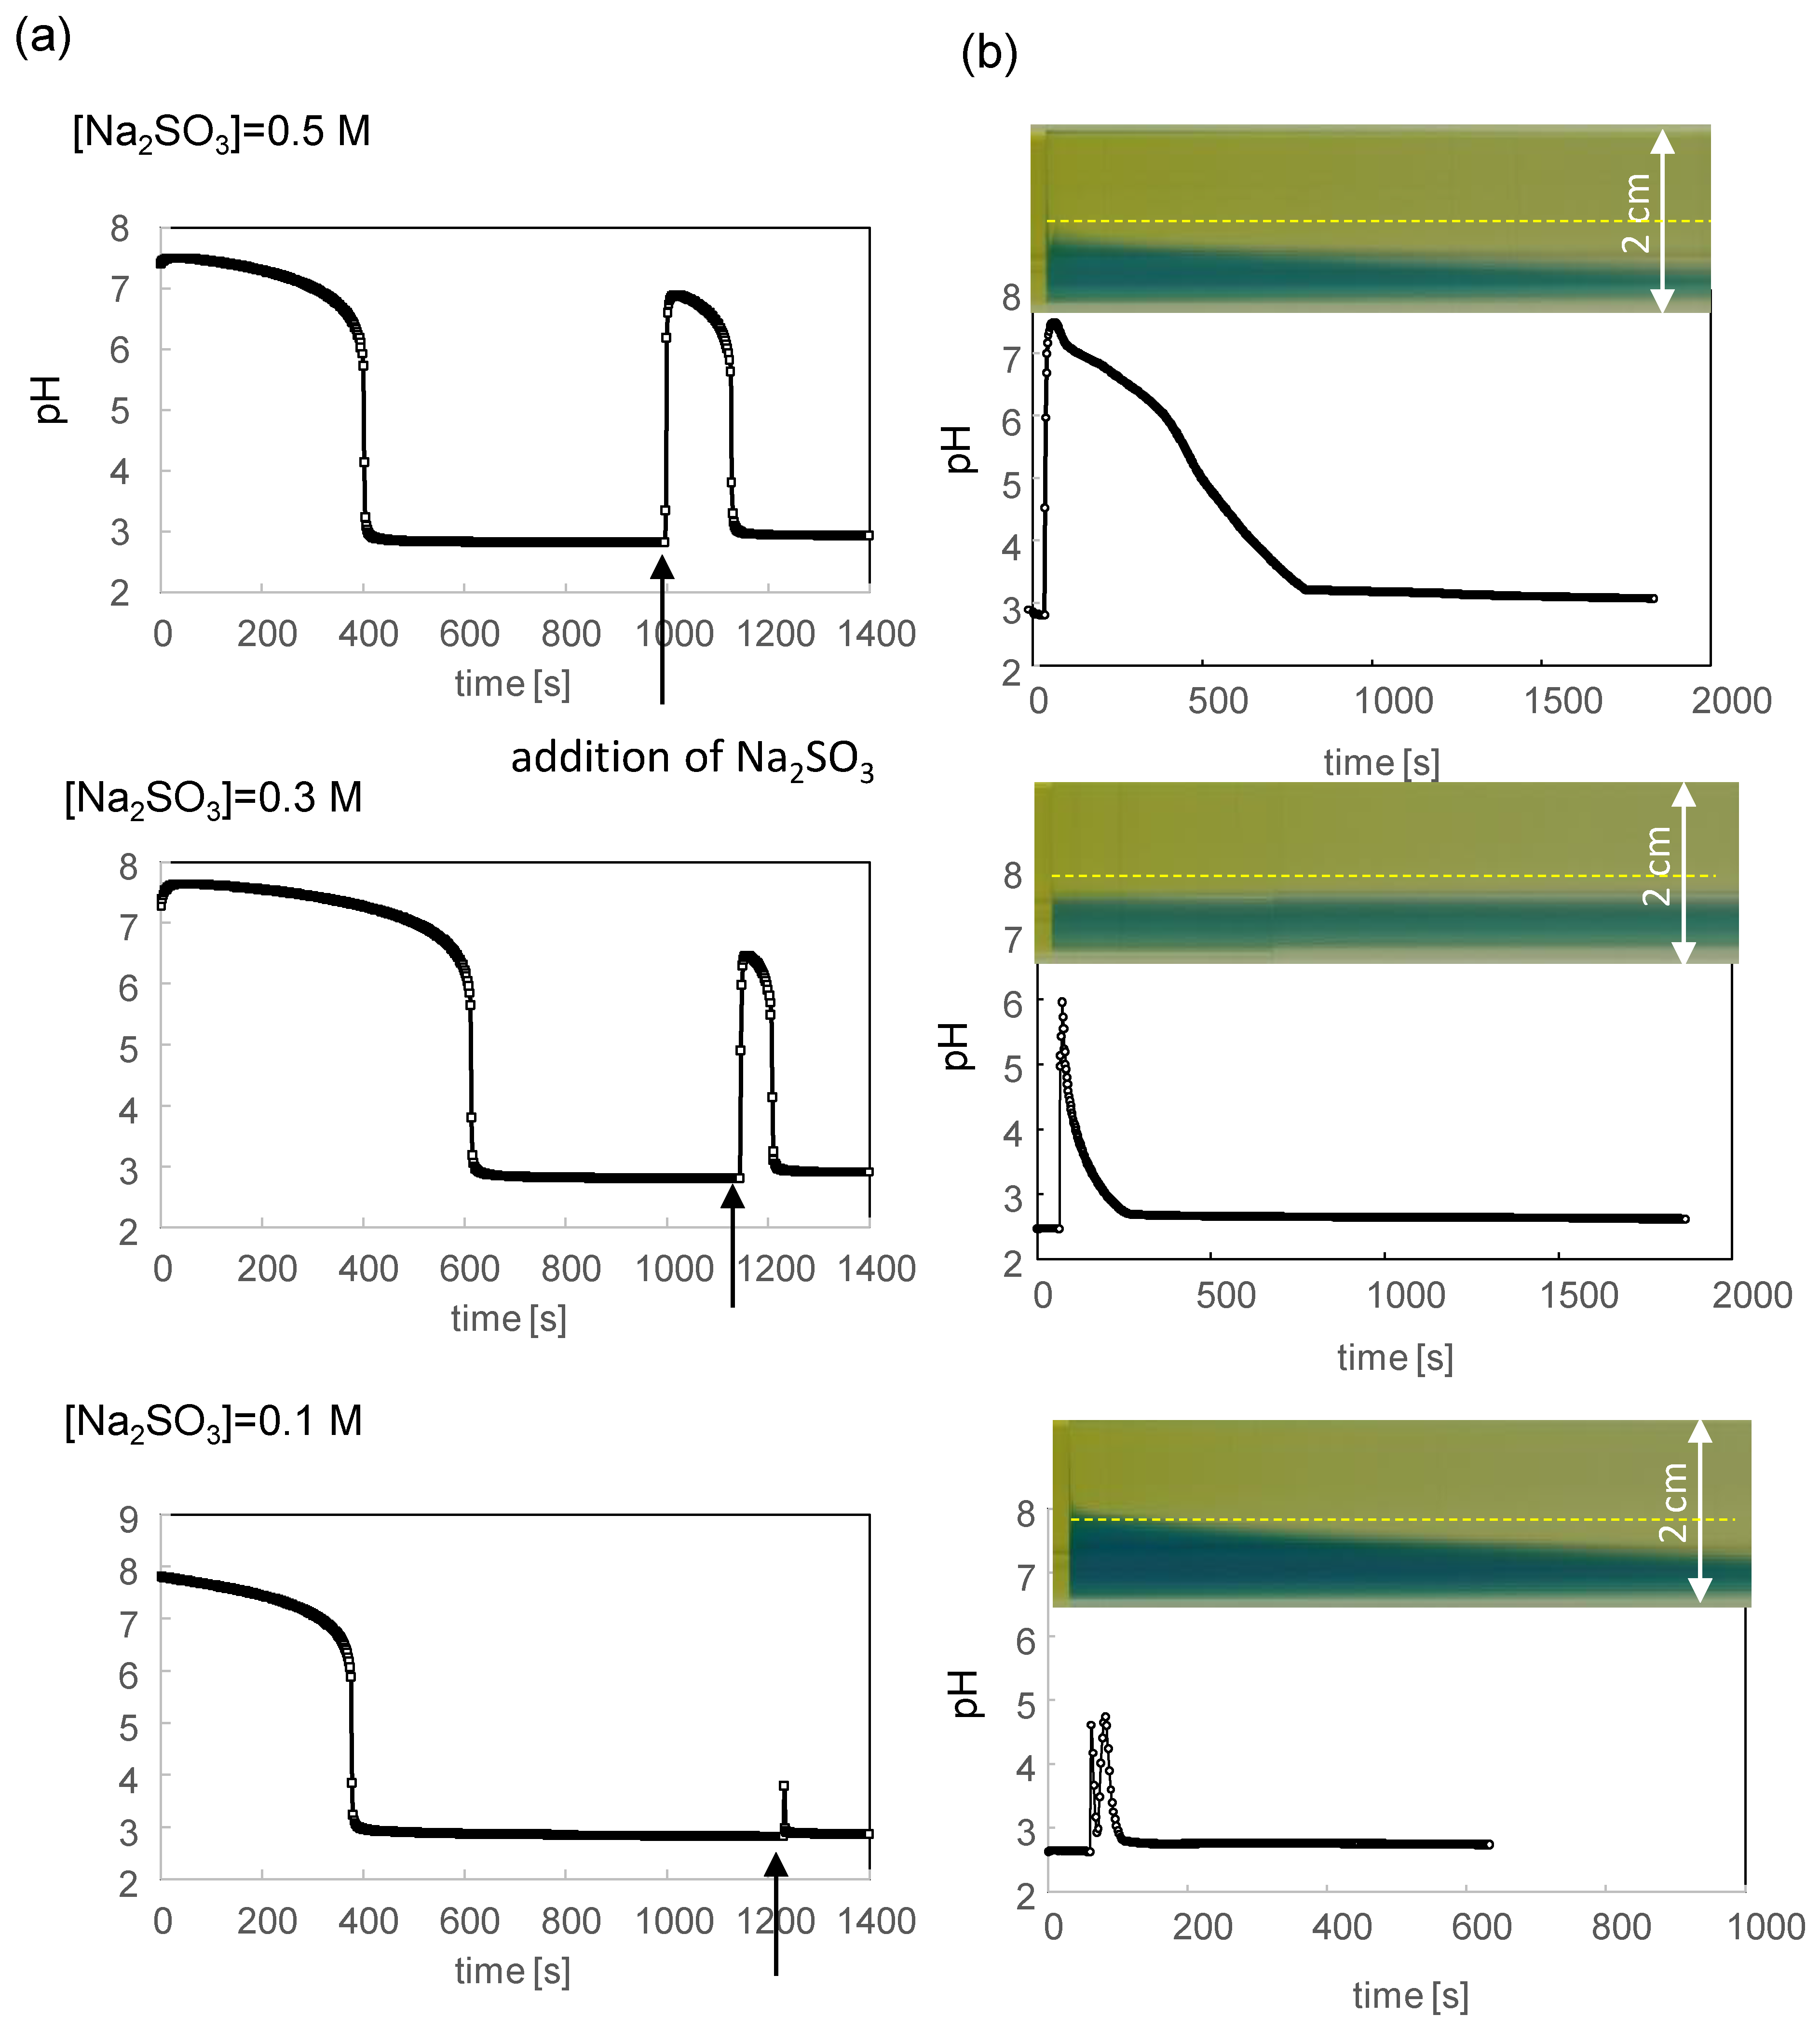
Figure 3.
Color change of BTB under an optical microscope. (a) Photographs of the microscopy at the shown pH. (b) Color change after the addition of Na2SO3 (0.4 M) to the pH oscillator solution. The pH rise initiates after the addition at the right side. (c) Space–time plot is made at the yellow dotted line shown in (b) (for 0.4 M Na2SO3). The higher pH region moves from the right to the left for 0.4 and 0.5 M of Na2SO3. For 0.3 M of Na2SO3, the pH at the left side negligibly exceeds 7.
Figure 4.
Optical microscopy of the VA structural change. (a) Time course with respect to the pH oscillation. The Na2SO3 concentrations added are 0.3, 0.4, and 0.5 M. (b) Structural change in response to the addition of water containing NaOH.
Figure 4.
Optical microscopy of the VA structural change. (a) Time course with respect to the pH oscillation. The Na2SO3 concentrations added are 0.3, 0.4, and 0.5 M. (b) Structural change in response to the addition of water containing NaOH.
Figure 5.
pH oscillation for the pH oscillator solution containing the phosphate buffer. (a) Time course of the pH under stirring (250 rpm). The added Na2SO3 concentration is 0.3 M. The volume ratio of the phosphate buffer is shown as 1/n. (b) Space–time plot after the Na2SO3 addition (corresponding to Figure 2b) (c) Space–time plot after the Na2SO3 addition (corresponding to Figure 3c). Na2SO3 is added at the bottom.

Figure 6.
Optical microscopy of the structural change in the VA. Elapsed time is shown in Figure, and the photograph that is most to the left corresponds to the start of the structural change. Phosphate buffer is added with a mixing ratio of 1/n. A total of 0.3 M of Na2SO3 is added at the right side of each photograph.
Figure 7.
First-order delay response (blue) with respect to a rectangular (left) and a triangular (right) input (red). The upper and lower panels indicate the results of the single and periodic inputs, respectively.
Figure 7.
First-order delay response (blue) with respect to a rectangular (left) and a triangular (right) input (red). The upper and lower panels indicate the results of the single and periodic inputs, respectively.
Disclaimer/Publisher’s Note: The statements, opinions and data contained in all publications are solely those of the individual author(s) and contributor(s) and not of MDPI and/or the editor(s). MDPI and/or the editor(s) disclaim responsibility for any injury to people or property resulting from any ideas, methods, instructions or products referred to in the content. |
© 2024 by the authors. Licensee MDPI, Basel, Switzerland. This article is an open access article distributed under the terms and conditions of the Creative Commons Attribution (CC BY) license (https://creativecommons.org/licenses/by/4.0/).
Share and Cite
MDPI and ACS Style
Shimada, M.; Someya, R.; Okamoto, Y.; Yamamoto, D.; Shioi, A. The Reversible Transformation of a Vesicular Aggregate in Response to a pH Oscillation. Processes 2024, 12, 514. https://doi.org/10.3390/pr12030514
AMA Style
Shimada M, Someya R, Okamoto Y, Yamamoto D, Shioi A. The Reversible Transformation of a Vesicular Aggregate in Response to a pH Oscillation. Processes. 2024; 12(3):514. https://doi.org/10.3390/pr12030514
Chicago/Turabian StyleShimada, Moeka, Risa Someya, Yasunao Okamoto, Daigo Yamamoto, and Akihisa Shioi. 2024. "The Reversible Transformation of a Vesicular Aggregate in Response to a pH Oscillation" Processes 12, no. 3: 514. https://doi.org/10.3390/pr12030514
Note that from the first issue of 2016, this journal uses article numbers instead of page numbers. See further details here.