

Fault Diagnosis for Power Batteries Based on a Stacked Sparse Autoencoder and a Convolutional Block Attention Capsule Network

1
College of Quality & Safety Engineering, China Jiliang University, Hangzhou 310018, China
2
China Automotive Engineering Research Institute Co., Ltd., Chongqing 401120, China
*
Author to whom correspondence should be addressed.
Processes 2024, 12(4), 816; https://doi.org/10.3390/pr12040816
Submission received: 18 March 2024
/
Revised: 13 April 2024
/
Accepted: 15 April 2024
/
Published: 18 April 2024
(This article belongs to the Special Issue Manufacturing Processes: Enhancements through Smart and Sustainable Approaches)
Abstract
:The power battery constitutes the fundamental component of new energy vehicles. Rapid and accurate fault diagnosis of power batteries can effectively improve the safety and power performance of the vehicle. In response to the issues of limited generalization ability and suboptimal diagnostic accuracy observed in traditional power battery fault diagnosis models, this study proposes a fault diagnosis method utilizing a Convolutional Block Attention Capsule Network (CBAM-CapsNet) based on a stacked sparse autoencoder (SSAE). The reconstructed dataset is initially input into the SSAE model. Layer-by-layer greedy learning using unsupervised learning is employed, combining unsupervised learning methods with parameter updating and local fine-tuning to enhance visualization capabilities. The CBAM is then integrated into the CapsNet, which not only mitigates the effect of noise on the SSAE but also improves the model’s ability to characterize power cell features, completing the fault diagnosis process. The experimental comparison results show that the proposed method can diagnose power battery failure modes with an accuracy of 96.86%, and various evaluation indexes are superior to CNN, CapsNet, CBAM-CapsNet, and other neural networks at accurately identifying fault types with higher diagnostic accuracy and robustness.
1. Introduction
New energy vehicles play a crucial role in addressing energy depletion, mitigating environmental pollution, and advancing electrified transportation. With the support of policies and the market, by the end of 2023, China’s new energy vehicle production and sales volume had reached an impressive 9.587 million units and 9.495 million units, respectively, exhibiting year-over-year growth rates of 35.8% and 37.9%, respectively. Moreover, the market share of new energy vehicles expanded by a significant 6.0 percentage points compared to the same period last year, reaching a remarkable 31.6%, and has maintained its position as the global leader for eight consecutive years [1]. The ensuing safety problems of new energy vehicles are becoming more and more prominent, with more than 60% of the accidents caused by power batteries. Therefore, timely and accurate identification and diagnosis of power battery failures are vital to prevent accidents and are significant to improving vehicle dynamics, safety, and reliability.
Recent research on power battery fault diagnosis has predominantly centered on expert diagnosis and neural networks [2]. Gu, A. et al. [3] proposed a power battery fault diagnosis method based on RBF for the typical failure modes of power batteries and verified the method’s effectiveness with test data. Mahmoud, A. et al. [4] employed a CNN (convolutional neural network) for EEG emotion recognition, demonstrating the proposed method’s robustness through relevant performance evaluation results. Du, R. et al. [5] proposed a proton exchange membrane fuel fault diagnosis model, set the operating conditions with different fault levels to realize the diagnosis of fault types and fault levels, and verified that the method could effectively improve the reliability of the fuel cell system. Tang, Q. et al. [6] presented a battery fault diagnosis method based on a fuzzy neural network. Through the use of 24 fault samples, it was demonstrated that the proposed method achieves higher diagnostic accuracy and faster training speed. Zheng, C. [7] introduced an adaptive traceless Kalman filter-based fault diagnosis method specifically designed to handle parameter shift faults in lithium batteries. They successfully applied this method to address two types of faults in lithium-ion batteries, showcasing its remarkable estimation accuracy. The above power battery fault diagnosis algorithm applies to the diagnosis of typical fault types and does not apply to the fault diagnosis of power batteries under complex conditions. The tremendous success of deep learning technology in feature learning and image recognition has presented new opportunities for advancing power battery fault diagnosis in recent years. These breakthroughs can potentially drive further progress in this field [8].
Jiang, H. et al. [9] proposed an innovative approach, SAE–DBN (Stacked Autoencoder–Deep Belief Network), for monitoring operating conditions. This addresses challenges in fault feature extraction and enhances early warning accuracy for combined harvester hydraulic systems. Liu, X. et al. [10] tackled the problem of insufficient prediction accuracy of the network structure model by first extracting data features with an SSAE (Sparse Stacked Autoencoder) and then performing regression analysis with a BPNN (Backpropagation Neural Network), achieving better results in reducing the average error of the predictable results. Ma, X. et al. [11] presented a fault diagnosis model that combines SSAE (Stacked Sparse Autoencoder) and TL (Transfer Learning) to address the digitization problems and low intelligence of traditional fault diagnosis methods, demonstrating higher accuracy than traditional neural networks. Xiang, C. et al. [12] addressed the problems of low accuracy of rolling bearing fault diagnosis and inability to identify unknown faults; firstly, SSAE was used for feature extraction and then combined with XGBoost for fault identification. The research findings indicate that SSAE is capable of performing deep-level signal feature extraction for fault diagnosis, leading to a significant improvement in the accuracy of fault diagnosis. To overcome the defects of CNNs, Hinton, et al. [13] proposed a Capsule Network (CapsNet). The new capsule network structure has a better classification effect and performance than CNNs and can provide better accuracy and convergence when dealing with complex data. Meanwhile, the attention mechanism can focus on the vital information in the data by assigning different weights to each part of the information input to improve the model performance [14]. Therefore, integrating the attention mechanism with the capsule network not only addresses the limitations of traditional CNN but also enables improved focus on crucial information within the target. This capability is essential for meeting the practical demands of fault diagnosis under complex conditions. As a result, the combination of the capsule network and attention mechanism has gained prominence as one of the primary approaches for fault diagnosis in current times. Zhang, H. et al. [15] introduced a crop disease recognition method that utilizes an attention capsule network. The experimental results demonstrate that integrating the attention mechanism with the capsule network significantly enhances the training capability of the network. This improvement offers an effective solution for enhancing the performance of deep learning methods in crop disease recognition. Zeng, W. et al. [16] presented a method for small-sample rice pest recognition using the Convolution Block Attention Module (CBAM). The results demonstrated a significant improvement in feature recognition accuracy when combining the attention mechanism with the capsule network. Zhang, Q. et al. [17] proposed a scale feature fusion capsule network that incorporates the attention mechanism for machinery fault diagnosis. The proposed method was evaluated using a rolling bearing experimental dataset and a motor fault dataset to assess its performance and validate its effectiveness. Sun, H. et al. [18] presented an intrusion detection method for capsule networks that utilizes an attention mechanism. This method aims to tackle the issue of imbalanced sample data. The proposed approach was validated using a publicly available dataset, demonstrating its scientific validity and effectiveness. Attentional mechanisms combined with capsule networks are widely used in image recognition, fault diagnosis, and other fields. However, the research applied to power battery fault diagnosis is relatively rare, which has a wide range of application prospects. From the above literature, it is clear that SSAEs can effectively extract data features and increase data differentiation in the case of complex sample data so that the dataset performs better in the ensuing fault diagnosis task [19]. Furthermore, the combination of the capsule network and attention mechanism is capable of effectively mitigating the impact of noise generated by an SSAE on network performance. They can also better focus on the local and global information of the data and meet the performance requirements of the practical applications of power battery fault diagnosis [20].
Building upon the aforementioned research findings, this study proposes an innovative approach for power battery fault diagnosis—an SSAE-based Convolutional Block Attention Capsule Network. Firstly, the collected power battery data are processed by a mixed sampling method to achieve equalization of data samples; then the processed data are input into the SSAE model for feature learning to achieve more efficient and meaningful feature extraction; finally, the CBAM module is set up to extract essential features before the initial capsule network, and the final test and parameter adjustment are carried out to establish the CBAM-CapsNet model. This model is then utilized for fault diagnosis in power batteries. The contributions and main innovations of the fault diagnosis method proposed in this study include:
- (1)
- This study proposes a CBAM-CapsNet power battery fault diagnosis method based on SSAE. The method takes power battery feature data as its input, achieving high diagnostic accuracy and robustness for diagnosing unbalanced power battery data.
- (2)
- To address the issue of insufficient differentiation of power battery fault data features, the SSAE network model is constructed by stacking multiple SAE models to enhance data features.
- (3)
- Conv1 and Conv2 are positioned before the primary capsule layer of the capsule network, with the insertion of the CBAM module. This adjustment reduces the impact of noise generated by the SSAE on network identification performance, particularly when discussing the generalization ability of the fault diagnosis model.
The remaining sections of this paper are structured as follows: Section 2 describes the proposed feature extraction method and the attention fault diagnosis method; Section 3 presents the fault diagnosis process for power battery data based on unbalanced samples. Concluding remarks are provided in Section 5.
2. Methods
2.1. Principle of the SSAE Algorithm
The SAE [21] incorporates supplementary sparse-type constraints on the hidden layer neurons, augmenting the traditional autoencoder structure with regular constraints to enhance the model’s generalization ability and noise robustness. The structure of the SAE is illustrated in Figure 1.
The SAE introduces a penalty factor into the hidden layer’s cost function to regulate the average activity level of the neurons. The average activity of neuron is shown in the following equation [22]:
where represents the number of neurons; represents the output of neuron in the hidden layer; represents the activation function; and represent the weight and bias of the corresponding neuron, respectively.
Moreover, to quantify the similarity between the average neuron activation output and sparsity, the scatter (Kullback–Leibler divergence) function is incorporated into the SAE. The dispersion is calculated as follows:
where denotes sparsity, typically set to = 0.05. A smaller dispersion indicates a closer fit to the true distribution, implying a smaller disparity between and .
Thus, the SAE loss function can be represented as follows:
where denotes the penalty coefficient, denotes the total number of input samples, and represents the total number of neurons.
A single SAE network is limited in its ability to learn complex and deeper implicit features. SSAEs can be significantly improved by stacking multiple SAEs layer-by-layer and incorporating sparse constraints. This transformation gradually shifts the data from the original high-dimensional space to more representative low-dimensional feature representations, while preserving the informational content of the input data [23]. The structure of the SSAE is illustrated in Figure 2.
In the SSAE, after inputting the original data into the input layer, the feature vector learned by encoder 1 is utilized to train the input of the second SAE layer. Subsequently, the previously trained SAE hidden layer serves as the input layer for the next SAE. This process of training a single hidden layer of the SAE is repeated sequentially up to the layers. Ultimately, a more representative and lower-dimensional feature vector is obtained. The training process for the SSAE is illustrated below [24]:
where represents the coding vector obtained from the dataset through the coding layer; represents the activation function.
Building upon this foundation, the SSAE enables the extraction of more representative features from power battery failure data by incorporating sparse constraints.
Equation (5) defines as the coefficient term constant of the SSAE, as the scattering constant of the SSAE, and as the number of hidden point nodes.
The SSAE combines the benefits of both AEs and SAEs, and its multilevel structure can effectively explore the potential features of the data. Additionally, the SSAE disregards interactions with subsequent features while preserving the essence of fault features. Ensuring the entire SSAE structure maintains strict symmetry and guarantees consistency between the dimensions of the reconstructed data and the input sample data.
2.2. Convolutional Block Attention Capsule Networks
2.2.1. Capsule Networks
To address the limitation where convolutional neural networks (CNNs) might lose certain feature parameter information in the pooling layer, Hinton et al. introduced a novel capsule network model in 2017, demonstrating exceptional performance on the MNIST handwriting dataset. The capsule network consists of two parts, that is, the encoder and decoder; the encoder part includes a convolutional layer (Conv), primary capsule layer (Primary Caps), and digital capsule layer (Digital Caps) [25]. The structure of the CapsNet is illustrated in Figure 3.
Moreover, the capsule network introduces a dynamic routing algorithm to facilitate information transfer between capsule layers. It dynamically adjusts the parameters of both the main capsule layer and the digital capsule layer through an iterative process to enhance feature extraction and classification efficiency. If the prediction results of all sub-capsules are consistent, the corresponding parent capsule activates, thus generating the corresponding feature vector [26]. The dynamic routing mechanism process is shown in Figure 4.
The dynamic routing algorithm passes through the following three stages:
First, the input vectors are weighted and summed, compressed to generate the feature vectors, and the specific calculation process is illustrated below:
where represents the -th fault characterization capsule; represents the labeling of the digital capsule; represents the matrix of weights; is the output of the -th capsule, which is obtained by multiplying with the transformation matrix to obtain the vector ; represents the vector of input ; represents the routing parameter from the -th capsule in the sub-capsule layer to the -th capsule in the parent capsule layer; represents the -th capsule in the parent capsule layer.
Then, the routing parameter undergoes updates to enable dynamic routing between capsule layers. The calculation process is illustrated below:
where represents the probability that capsule in the child capsule layer is connected to capsule in the parent capsule layer; represents the output of the -th capsule in the parent capsule layer.
Finally, the squash function compresses the modulus of the digital capsule to the range [0,1], ultimately yielding the digital capsule from the digital capsule layer. The updating of is determined by the degree of matching between features in the lower capsule and their corresponding positions in the higher capsule. The detailed computation process is illustrated below.
In each forward propagation of dynamic routing, is first initialized to 0, and Equation (8) is used to update the values of and ; the value of is further corrected by forward propagation to change the value of the output vector . The optimal coupling coefficients are finally obtained through an iterative loop of dynamic routing.
2.2.2. CBAM Module
CBAM [27] establishes attention mechanisms on channels and spatial locations, which are then merged to optimize features and enhance the overall performance and robustness of the model. By integrating CBAM into various convolutional layers and introducing a limited number of parameters, the focus is on representing effective feature information while minimizing irrelevant feature information.
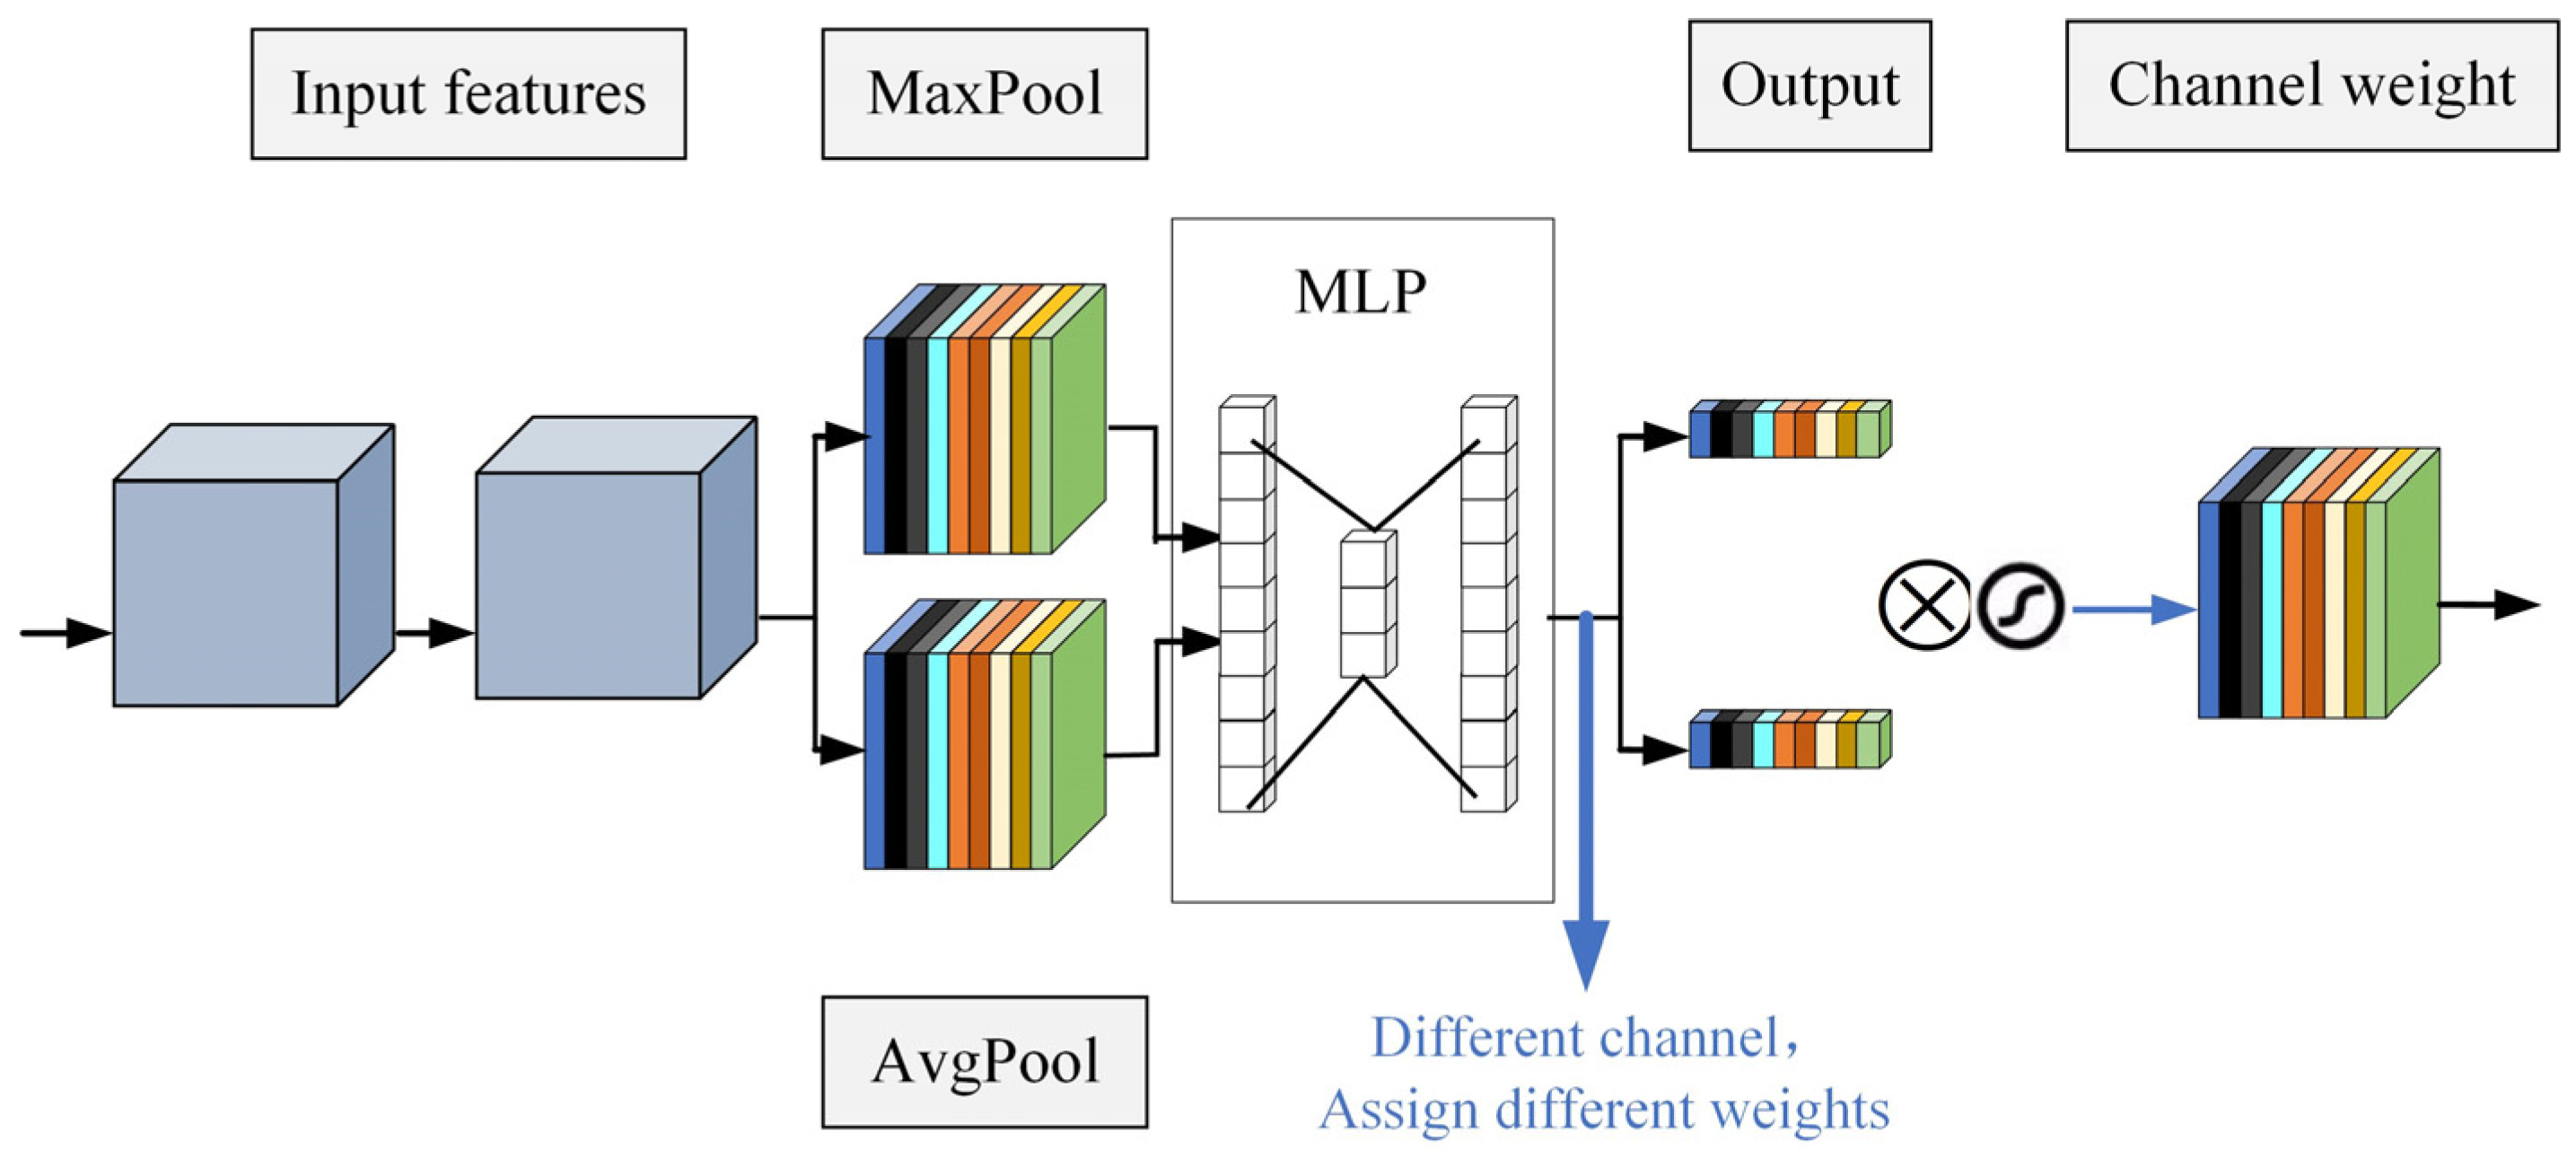
Attention mechanisms are broadly classified into two categories; the channel attention module (Figure 5) focuses on capturing meaningful aspects in the input data sample [28]. In the context of fault diagnosis, the process involves global pooling and average pooling operations on the input feature matrix. The results from these operations are then fed into a multilayer perceptron (MLP) for learning. Subsequently, the MLP output undergoes element-wise addition and is mapped with the Sigmoid function to derive the final “channel attention value”. This value is then multiplied by the input matrix F to produce the new channel attention feature map. The detailed calculation process is illustrated below [29]:
where represents the input feature matrix after being weighted by the one-dimensional channel attention parameter matrix; signifies the Sigmoid activation function; and indicate the maximum pooling operation and average pooling operation, respectively.
The one-dimensional channel attention parameter matrix acquired through learning is integrated with the original features, resulting in the computational formula depicted below:
where the symbol represents the multiplication of the corresponding elements one by one, i.e., the features of each dimension are multiplied by the weighting coefficients of the corresponding dimension; is the fused feature matrix.
The original feature fusion of spatial attention (Figure 6) follows the same approach as channel attention, primarily emphasizing crucial regions within the input features and assigning varying weights to features at different spatial locations [30]. In fault diagnosis, the process begins with the two-dimensional feature matrix generated by the channel attention module undergoing global pooling and average pooling operations to produce feature maps for each channel. Subsequently, the two-dimensional features are obtained by concatenating the results of global pooling and average pooling in the channel, resulting in a spliced matrix with dimensions . The spliced results are then reduced to a single channel through convolutional operations, yielding a feature dimension of . Finally, the single-channel feature result map is concatenated and input into the 7 × 7 convolutional layer, and the ultimate result is produced after processing through the Sigmoid activation function. The computational process is illustrated below:
where “[ ]” represents matrix merging; represents convolution operation; represents the spatial attention parameter matrix learned by the feature matrix ; and represents the convolution operation using a convolution kernel of size 7 × 7.
CBAM (Figure 7) initially extracts channel features from input features, then acquires channel attention from the feature matrix , and multiplies the two to obtain a new feature matrix ; subsequently, learns spatial attention , and the product of with results in the final fused feature matrix . This process enhances the network’s feature extraction capability while minimizing noise interference. The CBAM calculation formula is illustrated below:
where represents the output characterization under the action of CBAM.
3. Power Battery Fault Diagnosis Model
To enhance the accuracy of power battery fault diagnosis in new energy vehicles, a novel method, CBAM-CapsNet power battery fault diagnosis, is proposed, incorporating the SSAE technique. Initially, the data undergo hybrid sampling to achieve a balanced sample data set. By enhancing the SAE network architecture and stacking to construct the SSAE model, the dataset samples are trained, data features are obtained, and these features are mapped to a high-level representation through their combination to extract deep-level fault features. The traditional capsule network is integrated with CBAM, introducing two convolutional layers before the initial capsule layer, and inserting CBAM between these layers to enhance the extraction of more powerful fault features. Finally, by combining performance evaluation indexes, CBAM yields a more robust fault diagnosis model. Subsequently, the traditional capsule network is combined with CBAM, setting up two convolutional layers before the initial capsule layer, and inserting CBAM between these layers to produce fine features with more essential characteristics of the power battery. This leads to the construction of a fault diagnosis model with enhanced fault feature extraction capabilities. The proposed model is then validated through a combination of performance evaluation indexes and experimental comparisons. The specific power battery fault diagnosis process is illustrated in Figure 8.
Step 1: Acquisition and pre-processing of power battery fault data. Initially, the power battery fault data are obtained via the BMS system of new energy vehicles and vehicle enterprise platforms. Next, statistical analysis is performed on the power battery fault types to identify those associated with sudden uncontrolled accidents in new energy vehicles. Finally, the discrete and disordered feature attribute values of power battery data are encoded using One-Hot encoding.
Step 2: Mixed sampling method for unbalanced data. To address the issue of category imbalance in the dataset, a hybrid sampling method that combines oversampling and random undersampling is employed [31]. For fault samples belonging to minority categories, oversampling is employed to augment their data, ensuring comprehensive feature learning by the model. Whereas for fault types belonging to majority categories, random undersampling is utilized to decrease their count, thus achieving a balanced representation for each category. The theoretical number of samples after sampling for each fault type is illustrated below [32]:
where represents the number of samples sampled by category ; represents the number of samples in the category before sampling; represents the sampling balance factor, here ; denotes the median of the number of samples of all categories before sampling if is greater than to take undersampling mode, and vice versa to take oversampling mode.
Step 3: Dataset segmentation and reconstruction. The original dataset is divided into specific proportions. Firstly, 70% of the data are randomly selected as the training dataset for the model to learn patterns and features. Then, 20% of the data are randomly chosen as the test set for evaluating model performance and assessing its generalization ability. The remaining 10% of the data serve as the validation set for fine-tuning model parameters and evaluation.
Step 4: SSAE for unsupervised learning and feature extraction. The unsupervised feature extraction model based on the SSAE network is constructed to achieve the unsupervised learning and feature extraction of power battery data. This is accomplished by stacking the multi-layer SAE layer-by-layer, learning, and extracting sparsity feature expression. The specific implementation steps are as follows:
First, Assuming the original dataset is , the dataset is used to train the first coding layer of the SAE, obtaining the first layer feature representation of the dataset, . The activation function employed in this layer is the nonlinear Sigmoid function. The calculation process of is illustrated below [33].
where is the hidden layer coding vector obtained from dataset through coding layer 1; is the activation function for coding layer 1; is the weight matrix of coding layer 1; is the coding layer one bias vector.
Second, Inputting the feature representation from the first sparse coding layer into the second sparse coding layer yields the second layer feature representation, , for the dataset. The specific calculation process for is illustrated below
where is the hidden layer coding vector obtained from dataset through coding layer 2; is the activation function for coding layer 2; is the weight matrix of coding layer 2; is the coding layer 2 bias vector.
Then, Upon completing the feature extraction of the input data, the SSAE connects it to the softmax classification layer, generating the feature recognition for the corresponding data after extraction. The softmax classification layer is capable of offering the probability of the sample belonging to each category, assuming the classification problem involves r categories. The output function of the softmax classification layer is precisely calculated below.
where is the probability that the softmax classification layer will diagnose the sample as belonging to category , given the network parameter , where the category with the highest probability is considered as the label for the sample; The weight of the -th output category is represented as .
Step 5: Construct the CBAM-CapsNet model to complete the fault diagnosis process. Several enhancements are implemented in the structure of the traditional capsule network. Specifically, two convolutional layers are introduced in the convolutional part of the capsule network. Conv1 is responsible for extracting the primary features of the target, while Conv2 focuses on extracting the high-level features of the target. Additionally, the CBAM attention mechanism module is inserted between the two convolutional layers to enhance the ability to extract features from the power battery. Subsequently, the model weights are trained through the dynamic routing algorithm to obtain the output vector. Finally, the output vector from the digital capsule layer is employed to represent the type of fault in the power battery. The CBAM-CapsNet network structure is depicted in Figure 9, and the troubleshooting process is as follows:
First, Conv1 extracts the primary features of the target. In Conv1, the input data undergo extraction, and following the maximum pooling layer, the primary features of the data are extracted. The computational process is elucidated below:
where represents the primary features; represents the weight parameter of convolutional layer 1; represents the activation function; represents the maximum pooling.
Second, CBAM attention mechanism module enhances data characterization. After Conv1, a CBAM attention mechanism module is introduced to conduct feature weighting on the primary features. In comparison to the primary feature , features contributing more to the decision are assigned higher weights and play a more substantial role in the classification decision process. Conversely, features contributing less or deemed irrelevant are assigned lower weights and have a diminished impact on the classification decision process, yielding the CBAM-weighted feature .
Then, Conv2 extracts high-level features of the target. The CBAM-weighted feature is fed through Conv2 to obtain the high-level feature map . Subsequently, a layer is introduced after Conv2, randomly selecting 50% of the neurons during each training iteration, which is excluded from the training process to mitigate the risk of network overfitting. The calculation process is illustrated below:
where represents the parameters of Conv2; represents the excitation function.
The fourth layer is the Primary Capsules layer, tasked with extracting the essential entities of the target. Utilizing 128 × 7 × 7 convolutional kernels, features are extracted, resulting in a set of quantum neurons of size , referred to as capsules. Among these capsules, some represent the target features. The formula is depicted below:
The fifth layer is the digit capsule layer, where the primary capsule layer is subject to weighting and fusion to yield sets of capsules. The length of each capsule in these sets represents the probability that the target belongs to a different category. The input is the primary capsule , and the output comprises capsules, with representing the number of categories in the dataset. Each capsule is denoted by , and the specific calculation process is elucidated below:
Dynamic routing algorithms update parameters by evaluating the error between predicted and actual labels of capsule vectors, employing interval loss as the training loss function for the network. The calculation process is illustrated below [34]:
where and are category predictions, usually taken as and ; is the equilibrium coefficient, usually taken as ; represents the type of power battery fault; is the data category label, is 1 when it is determined to be that type of fault, and 0 when it is not that type of fault; represents the length of the vector, which indicates the magnitude of the probability of diagnosing the fault as the -th category. Smaller values of indicate more minor differences between the predicted output vector and the actual input vector, leading to better capsule network classification.
Finally, evaluate model performance. In order to gauge the accuracy of the power battery fault diagnosis model using the SSAE’s CBAM-CapsNet and assess its performance, Precision, Recall, and F1 values are utilized to quantify the disparity between the actual labels and the diagnosis results. The specific calculation process is illustrated below [35].
In the evaluation of the model, TP (True Positive) represents the number of samples correctly predicted as positive classes, while TN (True Negative) represents the number of samples correctly predicted as negative classes. FP (False Positive) represents the number of samples incorrectly predicted as positive classes, and FN (False Negative) represents the number of samples incorrectly predicted as negative classes. Precision measures the proportion of samples correctly classified as positive out of all samples predicted as positive. Recall measures the proportion of actual positive samples that are correctly identified by the model. The F1 score, which considers both precision and recall, provides a more comprehensive assessment of the model’s overall performance.
4. Experimental Design and Result Analysis
4.1. Parameter Description and Computational Complexity Analysis
In this study, comparison experiments and parameter tuning were conducted on a computer running the Windows 10 64-bit operating system. The code was implemented using Python 3.10 programming language, and the modeling was performed using Tensorflow 2.10.0 deep learning framework. The detailed experimental environment configuration is illustrated in Table 1.
The performance of the neural network greatly depends on the selection of hyperparameters. Common hyperparameters include, but are not limited to, learning rate, batch size, optimizer, number of iterations, and decay rate. The total number of training iterations for the network is set to 1000, with a batch size of 128 data points per training batch. The Adam algorithm is selected as the learning optimizer, with a learning rate of 0.001.
4.2. Data Processing
To ensure the safe operation of new energy vehicles and foster the industry’s development in a positive direction, China has established a national regulatory platform for new energy vehicles. This platform facilitates real-time detection of power battery operation data, offering robust safety assurance for new energy vehicles. This paper utilizes the national regulatory platform for new energy vehicles to collect information on the failure state parameters of new energy vehicle power batteries. This includes onboard data acquisition frequency of every 10 s, sampling accuracy of 1 millivolt, and the use of lithium ternary batteries. The collected power battery parameters encompass battery current, SOC, total battery voltage, voltage of each cell, temperature of each cell, maximum voltage cell number, minimum voltage cell number, maximum temperature cell number, minimum temperature cell number, and battery status, among other attributes.
Utilizing battery parameter information, the battery fault types are categorized as poor single-cell consistency, DC-DC temperature alarm, SOC jumping, low SOC, insulation failure, single-cell over-voltage, and single-cell under-voltage. These faults are assigned numbers 0 through 6 in sequential order. After screening samples with missing or abnormal features and conducting statistical analysis on the fault types, Table 2 presents each fault type along with its corresponding sample count.
Fault types in the sample data are designated by numbers ranging from 0 to 6, each representing a distinct fault category. Furthermore, the remaining sample data incorporate characteristic variables like total current i, SOC, highest individual voltage number, highest temperature individual voltage number, lowest voltage individual number, battery status, and others. The discrete and unordered features are digitized through One-Hot coding, enhancing their utility for subsequent fault diagnosis tasks.
4.3. Troubleshooting and Result Analysis
During the experiment, 3200 data points from the historical failure dataset of power batteries were divided into a training set, with 900 data points allocated for the test set, and the remaining 500 data points were designated for the validation set. To more intuitively assess the classification accuracy of each fault type, experiments used confusion matrix visualization techniques and rigorous cross-validation strategies. Figure 10 displays the results of the confusion matrix for the proposed network model, along with the precision and recall values for the corresponding fault patterns, as presented in Table 2.
Referring to the aforementioned figure, the fault diagnosis results depict the precision and recall rates, with detailed outcomes presented in Table 3.
Drawing from the previously discussed fault diagnosis results, it is apparent that the model exhibits remarkable diagnostic efficacy, especially for fault types 0, 3, 4, 5, and 6. Precision and recall rates surpass 0.96, except for fault types 1 and 2. The overall diagnostic outcomes yield an average precision and recall of 0.96. The diagnosis of diverse fault models demonstrates outstanding classification results, and the diagnostic process remains relatively stable without indications of severely poor classification for certain faults.
4.4. Comparative Analysis of Algorithms
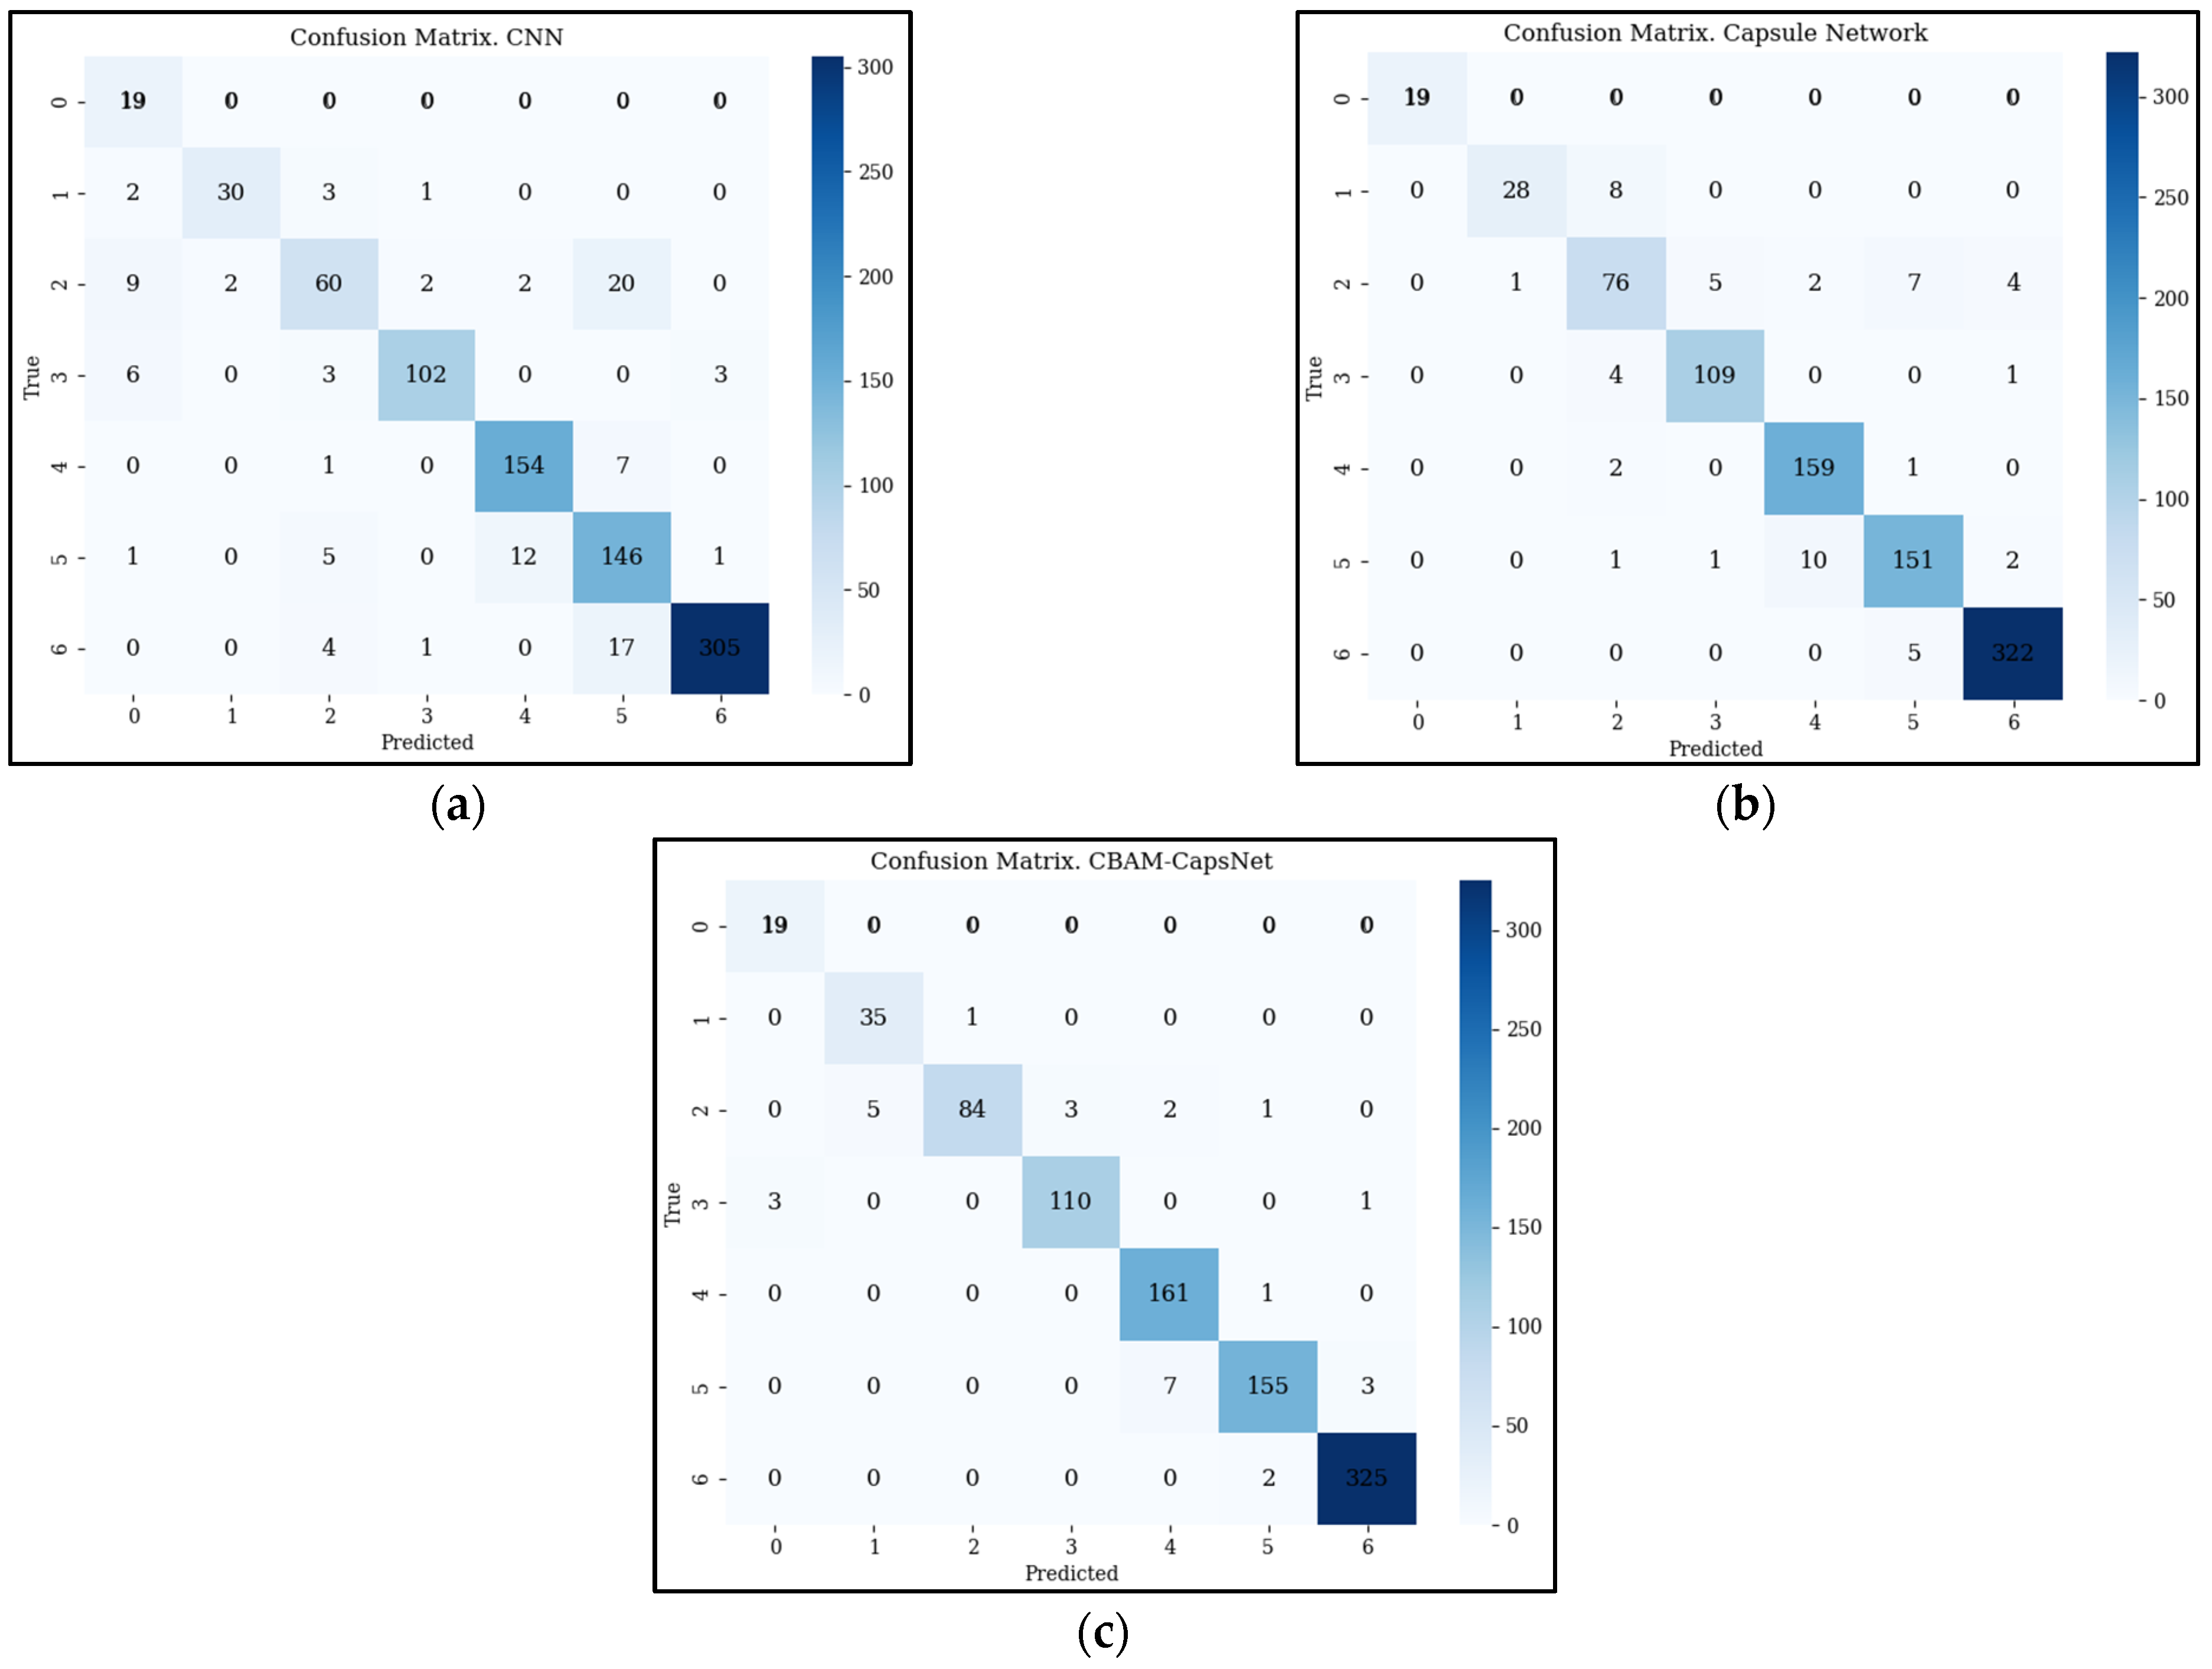
To validate the effectiveness of the proposed method in power battery fault diagnosis, three classical fault diagnosis algorithms—CNN, CapsNet, and CBAM-CapsNet—are chosen for comparative analysis, and the performance of each model is documented. All proposed networks undergo training until convergence using an identical training set and are subsequently tested using the same power battery fault data. Figure 11 showcases the power battery fault diagnosis results for each neural network.
Analyzing Figure 11a, it is evident that the CNN method exhibits poorer diagnostic results among various neural network methods. Diagnostic errors of varying degrees are observed between fault modes, including poor single-cell consistency, low SOC, and instances where insulation faults are mistakenly categorized as SOC jumps, single-cell over-voltage, and single-cell under-voltage. Moving to Figure 11b, CapsNet displays fewer misclassified samples, particularly excelling in distinguishing faults related to poor single-cell consistency, and overall improvement in classification results is notable. Examining Figure 11c, misdiagnoses of insulation faults as single-cell overvoltage are observed in CBAM-CapsNet. However, the inclusion of the CBAM module enhances the diagnostic accuracy of each fault type while ensuring a smoother diagnostic process. In the broader context of Figure 11, SSAE–CBAM-CapsNet significantly enhances the diagnostic accuracy of diverse fault category samples, with only a minimal number of misclassifications for SOC low fault samples. This improvement is attributed to the model’s incorporation of the SSAE to bolster the feature extraction capability of the entire model, coupled with the addition of the CBAM module on the foundation of the traditional capsular network model. This not only mitigates the impact of SSAE noise but also elevates the model’s power battery fault diagnosis ability.
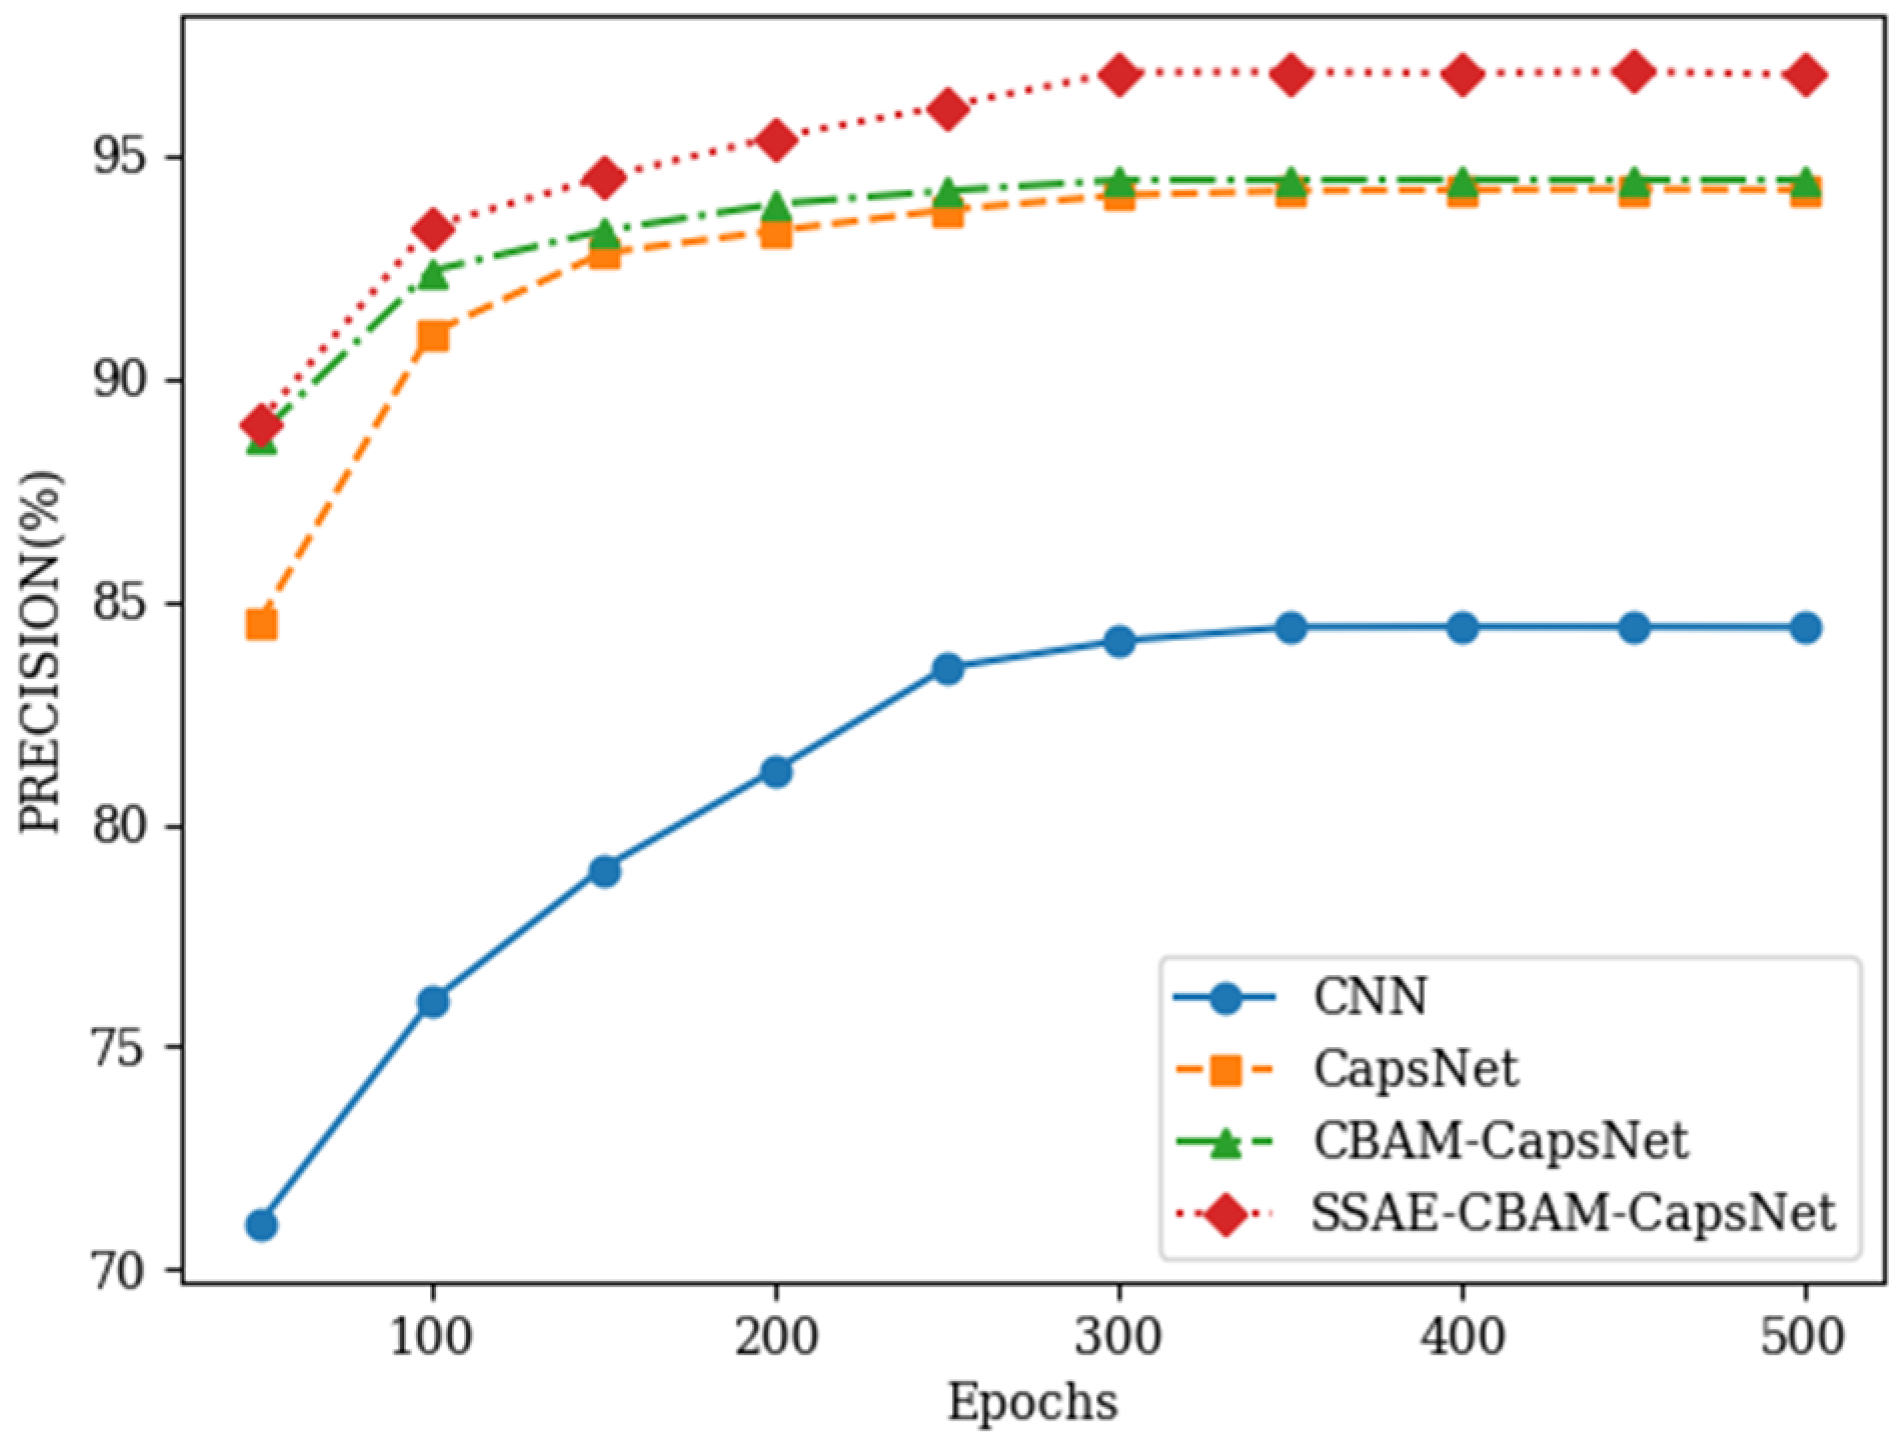
Precision, Recall, and F1 values for each neural network are computed based on the confusion matrix diagrams in Figure 10 and Figure 11 This calculation serves to compare and evaluate the performance of each algorithm. The results, depicting precision, recall, and F1 values with the increase in the number of iterations, are illustrated in Figure 12 and Figure 13, and summarized in Table 4.
From the above graphs, it is evident that as the number of iterations increases, the accuracy converges to 0.84 for CNN, 0.94 for CapsNet, 0.94 for CBAM-CapsNet, and 0.96 for SSAE–CBAM-CapsNet. Furthermore, in comparison with CNN, CapsNet, and CBAM-CapsNet, the proposed model enhances precision by 0.13, 0.03, and 0.03; recall by 0.09, 0.04, and 0.01; and F1 value increases by 0.12, 0.04, and 0.02, respectively. Across all metrics, the proposed model outperforms the other three methods, significantly improving fault diagnosis indicators and demonstrating the capability to accurately diagnose various fault modes of power batteries.
5. Conclusions
In response to the challenges of low diagnostic accuracy and limited generalizability in power battery fault diagnosis, a proposed approach integrates the SSAE to bolster the model’s feature extraction capability. Furthermore, the Capsule Network is fused with CBAM to extract and identify crucial information from the data efficiently. This leads to the development of the CBAM-CapsNet model for power battery fault diagnosis. To ascertain the effectiveness of the proposed method, pertinent evaluation indices and experimental validation are utilized. The subsequent section delineates the specific steps and experimental results.
- Data pre-processing. In addressing the challenge of uneven distribution in power battery fault data, we propose a hybrid sampling method. This approach integrates both undersampling and oversampling techniques to create a balanced dataset. The quality and efficiency of the sampling results are systematically evaluated and adjusted to attain the optimal sampling effect.
- Establish the SSAE model to enhance feature extraction. Initially, multiple sparse autoencoders are stacked, with the output of each serving as the input for the subsequent one, forming the SSAE model. Subsequently, the pre-processed fault data are fed into the SSAE model to tackle the challenge of inadequate feature differentiation. This process results in the augmentation of data features, facilitating subsequent fault classification and diagnosis tasks.
- Establishment of an SSAE-based CBAM-CapsNet model. To augment the network’s feature expression and extraction capabilities, Conv1 and Conv2 are positioned in front of the primary capsule layer of the capsule network. Furthermore, the CBAM attention mechanism module is incorporated to alleviate the impact of noise generated by the SSAE on the network’s recognition performance. This integration of CBAM enhances the overall performance of the network by emphasizing relevant features and diminishing the influence of irrelevant information. Finally, a dynamic routing algorithm is introduced to streamline network computation, and the output specifies the type of power battery faults, completing the power battery fault diagnosis.
During the power battery fault diagnosis process, it is acknowledged that the SSAE-based CBAM-CapsNet algorithm is impacted by data imbalance. Therefore, future research could delve into preprocessing non-equilibrium data to enhance the model’s accuracy and generalization capability.
Author Contributions
Data curation, J.Z.; methodology, J.Z., S.Z. and P.W.; writing—review and editing, J.Z. and S.Z.; funding acquisition, P.W. All authors have read and agreed to the published version of the manuscript.
Funding
This research was funded by the project Out of Control Accidents’ Scenario Reconstruction and In-depth Investigation Technology for New Energy Vehicle (Grant No. 2021YFF0601102).
Data Availability Statement
No new data were created or analyzed in this study. Data sharing is not applicable to this article.
Conflicts of Interest
Author Peng Wang was employed by the company China Automotive Engineering Research Institute Co., Ltd. The remaining authors declare that the research was conducted in the absence of any commercial or financial relationships that could be construed as a potential conflict of interest. The China Automotive Engineering Research Institute Co., Ltd. had no role in the design of the study; in the collection, analyses, or interpretation of data; in the writing of the manuscript, or in the decision to publish the results.
References
- Li, X.; Peng, Y.; He, Q.; He, H.; Xue, S. Development of New-Energy Vehicles under the Carbon Peaking and Carbon Neutrality Strategy in China. Sustainability 2023, 15, 7725. [Google Scholar] [CrossRef]
- Lei, Y.; Yang, B.; Jiang, X.; Jia, F.; Li, N.; Nandi, A.K. Applications of Machine Learning to Machine Fault Diagnosis: A Review and Roadmap. Mech. Syst. Signal Process. 2020, 138, 106587. [Google Scholar] [CrossRef]
- Gu, A.; Zhang, X.W. Fault diagnosis system for power battery based on RBF neural network. Chin. J. Power Sources 2016, 40, 1943–1945. [Google Scholar]
- Mahmoud, A.; Amin, K.; Al Rahhal, M.M.; Elkilani, W.S.; Mekhalfi, M.L.; Ibrahim, M. A CNN Approach for Emotion Recognition via EEG. Symmetry 2023, 15, 1822. [Google Scholar] [CrossRef]
- Du, R.; Wei, X.; Wang, X.; Chen, S.; Yuan, H.; Dai, H.; Ming, P. A Fault Diagnosis Model for Proton Exchange Membrane Fuel Cell Based on Impedance Identification with Differential Evolution Algorithm. Int. J. Hydrog. Energy 2021, 46, 38795–38808. [Google Scholar] [CrossRef]
- Tang, Q.; Xie, C.; Zeng, M.; Shi, Y. Fault diagnosis of power battery based on fuzzy network system. Chin. J. Power Sources 2020, 44, 1779–1783. [Google Scholar]
- Zheng, C.; Ge, Y.; Chen, Z.; Huang, D.; Liu, J.; Zhou, S. Diagnosis Method for Li-Ion Battery Fault Based on an Adaptive Unscented Kalman Filter. Energies 2017, 10, 1810. [Google Scholar] [CrossRef]
- Vaimann, T. Advances in Machine Fault Diagnosis. Appl. Sci. 2021, 11, 7348. [Google Scholar] [CrossRef]
- Jiang, H.; Yang, G.; Liu, L.; Liu, W. Condition Monitoring in Hydraulic System of Combine Harvester Based on SAE-DBN. Chin. Hydraul. Pneum. 2022, 46, 59–70. [Google Scholar]
- Liu, X.; Li, B.; Deng, Y. A soft measurement method of carbon content in fly ash under variable operating conditions of SSAE+BPNN. Therm. Power Gener. 2023, 52, 66–73. [Google Scholar] [CrossRef]
- Ma, X.; Chen, F.; Wang, Z.; Li, K.; Tian, C. Digital Twin Model for Chiller Fault Diagnosis Based on SSAE and Transfer Learning. Build. Environ. 2023, 243, 110718. [Google Scholar] [CrossRef]
- Xiang, C.; Zhou, J.; Han, B.; Li, W.; Zhao, H. Fault Diagnosis of Rolling Bearing Based on a Priority Elimination Method. Sensors 2023, 23, 2320. [Google Scholar] [CrossRef]
- Sabour, S.; Frosst, N.; Hinton, G.E. Dynamic routing between capsules. Adv. Neural Inf. Process. Syst. 2017, 30, 1710. [Google Scholar]
- Saleem, S.; Asim, M.N.; Elst, L.V.; Dengel, A. FNReq-Net: A Hybrid Computational Framework for Functional and Non-Functional Requirements Classification. J. King Saud Univ. Comput. Inf. Sci. 2023, 35, 101665. [Google Scholar] [CrossRef]
- Zhang, H.; Xie, Z.; Zhang, S. Crop disease recognition method based on attention capsule network. Jiangsu Agric. Sci. 2022, 50, 101–106. [Google Scholar] [CrossRef]
- Zeng, W.; Tang, X.; Hu, G.; Liang, D. Rice pests recognition with small number of samples based on CBAM and capsule network. J. China Agric. Univ. 2022, 27, 63–74. [Google Scholar]
- Zhang, Q.; Li, J.; Ding, W.; Ye, Z.; Meng, Z. Mechanical Fault Intelligent Diagnosis Using Attention-Based Dual-Scale Feature Fusion Capsule Network. Measurement 2023, 207, 112345. [Google Scholar] [CrossRef]
- Sun, H.; Wan, L.; Liu, M.; Wang, B. Few-Shot Network Intrusion Detection Based on Prototypical Capsule Network with Attention Mechanism. PLoS ONE 2023, 18, e0284632. [Google Scholar] [CrossRef]
- Zhao, J.; Feng, X.; Wang, J.; Lian, Y.; Ouyang, M.; Burke, A.F. Battery Fault Diagnosis and Failure Prognosis for Electric Vehicles Using Spatio-Temporal Transformer Networks. Appl. Energy 2023, 352, 121949. [Google Scholar] [CrossRef]
- Liu, Y.; Zhao, B.; Zhang, S.; Lin, J. Application for recognition of rice pest based on multi-scale dual-path attention capsule network. Southwest China J. Agric. Sci. 2022, 35, 1573–1581. [Google Scholar] [CrossRef]
- Steinweg, F.; Mikitisin, A.; Janitzky, T.L.M.; Richter, S.; Weirich, T.E.; Mayer, J.; Broeckmann, C. Influence of Additive-Derived Reaction Layers on White Etching Crack Failure of SAE 52100 Bearing Steel under Rolling Contact Loading. Tribol. Int. 2023, 180, 108239. [Google Scholar] [CrossRef]
- Liu, X.; Xiong, L.; Zhang, Y.; Luo, C. Remaining Useful Life Prediction for Turbofan Engine Using SAE-TCN Model. Aerospace 2023, 10, 715. [Google Scholar] [CrossRef]
- Zhang, L.; Jiao, L.; Ma, W.; Duan, Y.; Zhang, D. PolSAR Image Classification Based on Multi-Scale Stacked Sparse Autoencoder. Neurocomputing 2019, 351, 167–179. [Google Scholar] [CrossRef]
- Ma, J.; Li, C.; Zhang, G. Rolling Bearing Fault Diagnosis Based on Deep Learning and Autoencoder Information Fusion. Symmetry 2021, 14, 13. [Google Scholar] [CrossRef]
- Han, Z.; Hossain, M.M.; Wang, Y.; Li, J.; Xu, C. Combustion Stability Monitoring through Flame Imaging and Stacked Sparse Autoencoder Based Deep Neural Network. Appl. Energy 2020, 259, 114159. [Google Scholar] [CrossRef]
- Zhang, C.; Li, Y.; Yu, Z.; Huang, X.; Xu, J.; Deng, C. An End-to-End Lower Limb Activity Recognition Framework Based on sEMG Data Augmentation and Enhanced CapsNet. Expert Syst. Appl. 2023, 227, 120257. [Google Scholar] [CrossRef]
- Ding, Z.; Shen, L.; Chen, H.; Yan, F.; Ansari, N. Energy-Efficient Relay-Selection-Based Dynamic Routing Algorithm for IoT-Oriented Software-Defined WSNs. IEEE Internet Things J. 2020, 7, 9050–9065. [Google Scholar] [CrossRef]
- Wang, J.; Chen, Q.; Shi, C. Research on Spider Recognition Technology Based on Transfer Learning and Attention Mechanism. Symmetry 2023, 15, 1727. [Google Scholar] [CrossRef]
- Yu, H.; Wang, J.; Han, Y.; Fan, B.; Zhang, C. Research on an Intelligent Identification Method for Wind Turbine Blade Damage Based on CBAM-BiFPN-YOLOV8. Processes 2024, 12, 205. [Google Scholar] [CrossRef]
- Wei, X.; Zhang, Y.; Zheng, Y. BSFCDet: Bidirectional Spatial–Semantic Fusion Network Coupled with Channel Attention for Object Detection in Satellite Images. Remote Sens. 2023, 15, 3213. [Google Scholar] [CrossRef]
- Liu, S.; Huang, J.; Ma, J.; Luo, J. SRMANet: Toward an Interpretable Neural Network with Multi-Attention Mechanism for Gearbox Fault Diagnosis. Appl. Sci. 2022, 12, 8388. [Google Scholar] [CrossRef]
- Wang, H. Three-Stage Sampling Algorithm for Highly Imbalanced Multi-Classification Time Series Datasets. Symmetry 2023, 15, 1849. [Google Scholar] [CrossRef]
- Ding, P.; Li, J.; Wen, M.; Wang, L.; Li, H. Efficient BiSRU Combined With Feature Dimensionality Reduction for Abnormal Traffic Detection. IEEE Access 2020, 8, 164414–164427. [Google Scholar] [CrossRef]
- Abuqaddom, I.; Mahafzah, B.A.; Faris, H. Oriented Stochastic Loss Descent Algorithm to Train Very Deep Multi-Layer Neural Networks without Vanishing Gradients. Knowl.-Based Syst. 2021, 230, 107391. [Google Scholar] [CrossRef]
- Cui, J.; Zhang, G.; Chen, Z.; Yu, N. Multi-Homed Abnormal Behavior Detection Algorithm Based on Fuzzy Particle Swarm Cluster in User and Entity Behavior Analytics. Sci. Rep. 2022, 12, 22349. [Google Scholar] [CrossRef]
Figure 1.
SAE structure.

Figure 2.
SSAE structure.

Figure 3.
Structure of CapsNet.

Figure 4.
Dynamic routing mechanism.

Figure 5.
Channel Attention Module in CBAM.

Figure 6.
Spatial attention module in CBAM.

Figure 7.
CBAM structure.

Figure 8.
SSAE–CBAM-CapsNet model flow chart.

Figure 9.
Structure of the CBAM-CapsNet network.

Figure 10.
Confusion matrix for fusion diagnostic results.

Figure 11.
Confusion matrix of diagnostic results for each neural network: (a) CNN Confusion; (b) CapsNet Confusion; (c) CBAM-CapsNet Confusion.
Figure 11.
Confusion matrix of diagnostic results for each neural network: (a) CNN Confusion; (b) CapsNet Confusion; (c) CBAM-CapsNet Confusion.

Figure 12.
Plot of exact variation with increasing number of iterations.

Figure 13.
Fault diagnosis accuracy of different neural networks.


Table 1.
Experimental environment and configuration.
| Experimental Environment | Configure |
|---|---|
| operating system | Windows 10 64bit |
| processing unit | Intel(R) i5-12490F 2.30 GHz |
| random access memory (RAM) | 8 G |
| programming language | Python3.10 |
| Deep Learning Framework | Tensorflow2.10.0 |
Table 2.
Number of samples corresponding to each fault type.
| Fault Number | Fault Type | Sample Size |
|---|---|---|
| 0 | Poor single-cell consistency | 94 |
| 1 | DC-DC temperature alarm | 123 |
| 2 | SOC jumping | 435 |
| 3 | Low SOC | 548 |
| 4 | Insulation failure | 832 |
| 5 | Single-cell over-voltage, | 866 |
| 6 | Single-cell under-voltage | 1691 |
Table 3.
Precision and Recall Rates of SSAE–CBAM-CapsNet Fault Diagnosis.
| Fault Number | Fault Type | Precision | Recall |
|---|---|---|---|
| 0 | Poor single-cell consistency | 0.96 | 1 |
| 1 | DC-DC temperature alarm | 0.92 | 0.92 |
| 2 | SOC jumping | 0.92 | 0.89 |
| 3 | Low SOC | 0.96 | 0.96 |
| 4 | Insulation failure | 0.99 | 0.98 |
| 5 | Single-cell over-voltage, | 0.98 | 0.98 |
| 6 | Single-cell under-voltage | 0.99 | 1 |
Table 4.
Fault diagnosis results of different neural networks.
| Method | Precision | Recall | F Value |
|---|---|---|---|
| CNN | 0.84 | 0.87 | 0.84 |
| CapsNet | 0.94 | 0.92 | 0.93 |
| CBAM-CapsNet | 0.94 | 0.96 | 0.95 |
| SSAE–CBAM-CapsNet | 0.97 | 0.96 | 0.96 |
Disclaimer/Publisher’s Note: The statements, opinions and data contained in all publications are solely those of the individual author(s) and contributor(s) and not of MDPI and/or the editor(s). MDPI and/or the editor(s) disclaim responsibility for any injury to people or property resulting from any ideas, methods, instructions or products referred to in the content. |
© 2024 by the authors. Licensee MDPI, Basel, Switzerland. This article is an open access article distributed under the terms and conditions of the Creative Commons Attribution (CC BY) license (https://creativecommons.org/licenses/by/4.0/).
Share and Cite
MDPI and ACS Style
Zhou, J.; Zhang, S.; Wang, P. Fault Diagnosis for Power Batteries Based on a Stacked Sparse Autoencoder and a Convolutional Block Attention Capsule Network. Processes 2024, 12, 816. https://doi.org/10.3390/pr12040816
AMA Style
Zhou J, Zhang S, Wang P. Fault Diagnosis for Power Batteries Based on a Stacked Sparse Autoencoder and a Convolutional Block Attention Capsule Network. Processes. 2024; 12(4):816. https://doi.org/10.3390/pr12040816
Chicago/Turabian StyleZhou, Juan, Shun Zhang, and Peng Wang. 2024. "Fault Diagnosis for Power Batteries Based on a Stacked Sparse Autoencoder and a Convolutional Block Attention Capsule Network" Processes 12, no. 4: 816. https://doi.org/10.3390/pr12040816
Note that from the first issue of 2016, this journal uses article numbers instead of page numbers. See further details here.