Article

Fault Diagnosis of Power Transformer in One-Key Sequential Control System of Intelligent Substation Based on a Transformer Neural Network Model

1
State Grid Power Supply Company of Gansu Baiyin, Baiyin 730900, China
2
School of Automation, Nanjing University of Science and Technology, Nanjing 210094, China
*
Author to whom correspondence should be addressed.
Processes 2024, 12(4), 824; https://doi.org/10.3390/pr12040824
Submission received: 7 March 2024 / Revised: 9 April 2024 / Accepted: 16 April 2024 / Published: 19 April 2024

Abstract

:
With the introduction of numerous technologies and equipment, the volume of data in smart substations has undergone exponential growth. In order to enhance the intelligent management level of substations and promote their efficient and sustainable development, the one-key sequential control system of smart substations is being renovated. In this study, firstly, the intelligent substation is defined and compared with the traditional substation. The one-key sequential control system is introduced, and the main issues existing in the system are analyzed. Secondly, experiments are conducted on the winding temperature, insulation oil temperature, and ambient temperature of power transformers in the primary equipment. Combining data fusion technology and transformer neural network models, a Power Transformer-Transformer Neural Network (PT-TNNet) model based on data fusion is proposed. Subsequently, comparative experiments are conducted with multiple algorithms to validate the high accuracy, precision, recall, and F1 score of the PT-TNNet model for equipment state monitoring and fault diagnosis. Finally, using the efficient PT-TNNet, Random Forest, and Extra Trees models, the cross-validation of the accuracy of winding temperature and insulation oil temperature of transformers is performed, confirming the superiority of the PT-TNNet model based on transformer neural networks for power transformer state monitoring and fault diagnosis, its feasibility for application in one-key sequential control systems, and the optimization of one-key sequential control system performance.

1. Introduction

The intelligent substation adopts advanced, integrated, and environmentally friendly intelligent devices. It requires full-site digitization, a networked communication platform, and standardized information sharing as basic requirements. The system automatically completes information collection, measurement, control, protection, and monitoring [1,2,3]. Currently, intelligent substations show a trend of increasing the number of connected devices and the size of substations, leading to increased complexity and danger in manual on-site switching operations [2]. To address this, a one-key sequential control system is proposed to ensure the personal safety of operators and transition from traditional manual step-by-step operations to remote automatic operations using computers.
The one-key sequential control system deals with a large volume and diverse types of data, often containing noise and redundancy, leading to low data accuracy, wasted storage space, and reduced data transmission efficiency and power grid reliability. In this regard, corresponding measures need to be taken to improve the accuracy of equipment status information and shorten the system response time [4].
In the primary equipment of a substation, the power transformer is crucially connected to various key processes such as generation, transmission, substation, and distribution. Monitoring the operational status of the transformer and conducting regular fault diagnostics are essential tasks to ensure the safety, stability, and reliability of the power system. This article focuses on the monitoring and fault diagnosis of transformers as the main research content, aiming to improve and optimize them, thereby enhancing the speed, stability, and reliability of the one-key sequential control system.
Power transformers are typically equipped with various types of protective devices. Selecting appropriate features as triggering criteria is crucial to selectively and correctly isolate faults.
In the past, fault detection in transformers relied mainly on manual inspections and de-energized tests. Maintenance personnel had to regularly inspect the transformer’s external appearance to identify issues like oil leakage or abnormal sounds. Preventive tests involving periodic power outages were conducted to determine if there were insulation problems in the transformer. On-site inspections and fault analysis were time-consuming and labor-intensive. Manual preliminary analysis was prone to errors, and incorrect fault judgments could lead to mis-operations of the transformer’s relay protection devices, posing significant safety risks and economic losses. As a result, a series of intelligent algorithms for transformer condition monitoring and fault diagnosis has emerged. Currently, research on transformer fault detection can be categorized into three main types: mechanism models, feature analysis, and machine learning [5,6,7,8].
Mechanism models are an analytical approach based on physical principles. They involve constructing fault diagnosis models for transformers based on their physical characteristics and operational principles, utilizing disciplines such as electromagnetics, thermodynamics, and fluid mechanics. These models can accurately capture changes in parameters such as current, voltage, temperature, and humidity within the transformer, thereby providing high-precision assessments of its operational state. In [5], an accurate fault diagnosis for transformers is achieved using a current compensation method. While mechanism models in transformer condition monitoring offer advantages such as high accuracy and a foundation in physical principles, they come with a series of drawbacks and challenges, including dependence on data quality, limitations in model applicability, real-time requirements, and computational complexity.
Feature analysis is primarily based on the analysis of data characteristics. Intelligent sensing devices can continuously perceive and acquire various aspects of the transformer’s condition, such as temperature, acoustic patterns, and discharges in real time. However, the fault diagnosis methods in the feature analysis category also have certain limitations. They often heavily rely on data quality and sensor accuracy, and in complex fault scenarios, they may overlook some subtle or challenging-to-capture fault features. Moreover, for rare fault types, they might be ineffective in providing a valid diagnosis.
Machine learning primarily relies on artificial intelligence technology, exploring feature interactions comprehensively through machine learning models and neural networks to automatically extract features. Various network structures are designed to achieve feature information extraction for different categories, such as convolutional neural networks, recurrent neural networks, long short-term memory networks, self-attention networks, etc. This approach has shown significant effectiveness in processing image, audio, and time-series data.
Based on this foundation, various fault diagnosis algorithms related to deep learning have been derived. In [6], fuzzy logic and an Adaptive Neuro-Fuzzy Inference System (ANFIS) model are employed for transformer fault diagnosis based on Dissolved Gas Analysis (DGA). Reference [7] proposes a self-decision model that considers fault characteristics and the adaptability of traditional deep concise networks. Reference [8] introduces a new method for transformer fault diagnosis based on an integrated Adaptive Neuro-Fuzzy Inference System and the Dempster–Shafer theory (DST). Fault diagnosis algorithms based on deep learning show significant potential in practical applications but come with various limitations.
These deep learning methods often require a large amount of labeled data during the training process, and they may create black-box models that are challenging to interpret. Additionally, they demand high computational resources during operation, face issues related to imbalanced fault data categories, and have limited model generalization.
This paper proposes a power transformer state monitoring and fault diagnosis model based on transformer neural networks. Due to its unique auto-correlation structure, it can fully exploit the relationships between different feature dimensions, making the transformer neural network model more sensitive to data relationships between feature dimensions compared to other deep networks. Moreover, the transformer neural network model, being a complex multi-layer network model structure, can provide superior nonlinear mapping capabilities for the decision-making layer, making it more suitable for the development of transformer state monitoring and fault diagnosis methods.
By collecting a large amount of multi-dimensional operational historical data from the internal and external sensors of the power transformer, the designed transformer network model is trained. In the data preprocessing stage, data fusion is employed to reduce the data volume required for model training and to accelerate model convergence. Through comparative experiments and cross-validation, the superiority of the PT-TNNet model based on transformer neural networks in transformer state monitoring and fault diagnosis, as well as its feasibility for application in one-key dispatching and control systems, can be demonstrated.
In Section 2, the definition of an intelligent substation is provided, and a comparison is made between intelligent substations and traditional substations, elucidating the short-circuit level of the substations under study in this paper. Section 3 provides a detailed introduction to the novel one-key sequential control system applied in intelligent substations, outlining the main problems encountered in such systems. Section 4 summarizes the types of faults in power transformers and their corresponding causes. Section 5 specifically discusses data fusion technology. Section 6 presents the theoretical analysis, formula derivation, and framework proposal of the PT-TNNet model based on transformer neural networks. Section 7 introduces the dataset and evaluation metrics, conducts ablation verification of input data, and summarizes the results of comparative experiments and cross-validation. Finally, Section 8 provides a summary and conclusion of the research achievements presented in this paper.

2. Intelligent Substation

An intelligent substation is an upgraded and reformed version of a traditional substation based on advanced monitoring, control, and communication technologies, utilizing artificial intelligence (AI) and the Internet of Things (IoT). Its aim is to enhance the operational efficiency, reliability, and safety of the power system. The intelligent substation employs digitalization, automation, and intelligence to achieve real-time monitoring, remote control, and intelligent management of power equipment and systems.

2.1. Comparison between Intelligent Substation and Traditional Substation

The intelligent substation exhibits several significant differences compared to traditional substations, primarily encompassing the following aspects:
1.
Automation Level: Intelligent substations employ advanced automation technologies and digital control systems, enabling functionalities such as remote monitoring, intelligent diagnosis, and fault prediction. Figure 1 depicts a remote monitoring device. In contrast, traditional substations heavily rely on manual operations and simple control equipment.
2.
Data Processing Capability: Intelligent substations can collect a vast amount of data in real time and process it through techniques like data analysis and artificial intelligence, enhancing the efficiency and security of the power grid operation. Conversely, traditional substations have relatively weaker data processing capabilities, mainly relying on manual data analysis and handling.
3.
Equipment Status Monitoring: Intelligent substations are equipped with various sensors and monitoring devices that can monitor parameters such as equipment operation status, temperature, and vibration in real time, promptly detecting equipment anomalies and issuing warnings. Figure 2 shows an intelligent inspection robot. Traditional substations typically require manual inspections and regular maintenance.
4.
Response Speed: Due to the adoption of advanced control systems and communication technologies, intelligent substations can quickly respond to changes and faults in the power grid, improving the response speed and reliability of the power system.
5.
Safety and Reliability: Intelligent substations can identify potential fault risks in a timely manner through data analysis and intelligent algorithms, taking preventive measures to enhance the safety and reliability of the power grid operation. In contrast, traditional substations rely more on manual experience and regular maintenance to ensure safety.

2.2. The Short-Circuit Current Level of the Intelligent Substation

The short-circuit current level of a substation refers to the maximum current that can flow through the system in a short-circuit state. The short-circuit current level depends on the size and configuration of the power grid, the impedance of transformers, the impedance of transmission and distribution lines, and the impedance of loads connected to the system.
The short-circuit current values for intelligent primary equipment are as follows:
  • The short-circuit current for the 110 kV voltage level is 40 kA.
  • The short-circuit current for the 10 kV voltage level is as follows: 40 kA for the main transformer incoming line and sectional isolators and 31.5 kA for the outgoing lines of 10 kV, 10 kV capacitor banks, 10 kV grounding transformers, and parallel low-resistance sets of arc suppression coils.

3. One-Key Sequential Control System

3.1. Overview

The power system is developing rapidly, and the level of automation is gradually increasing. However, at the same time, adjustments to the maintenance and operation methods of the power grid are becoming more frequent. The number of operation tickets that dispatchers need to formulate daily is increasing. During manual operations, errors and omissions are prone to occur, leading to the waste of human resources, increased time costs, and reduced efficiency. Especially in harsh weather conditions and complex environments, manual operations become difficult and risky [3,4].
In response to this, the intelligent substation proposes a one-key sequential control system. The one-key sequential control enables quick and convenient drafting of operation tickets and switching operations, effectively reducing the operational risks and costs of maintenance and strengthening the control capabilities of maintenance personnel over equipment. This system achieves the transformation from traditional manual step-by-step operations to computer-aided remote automatic operations.

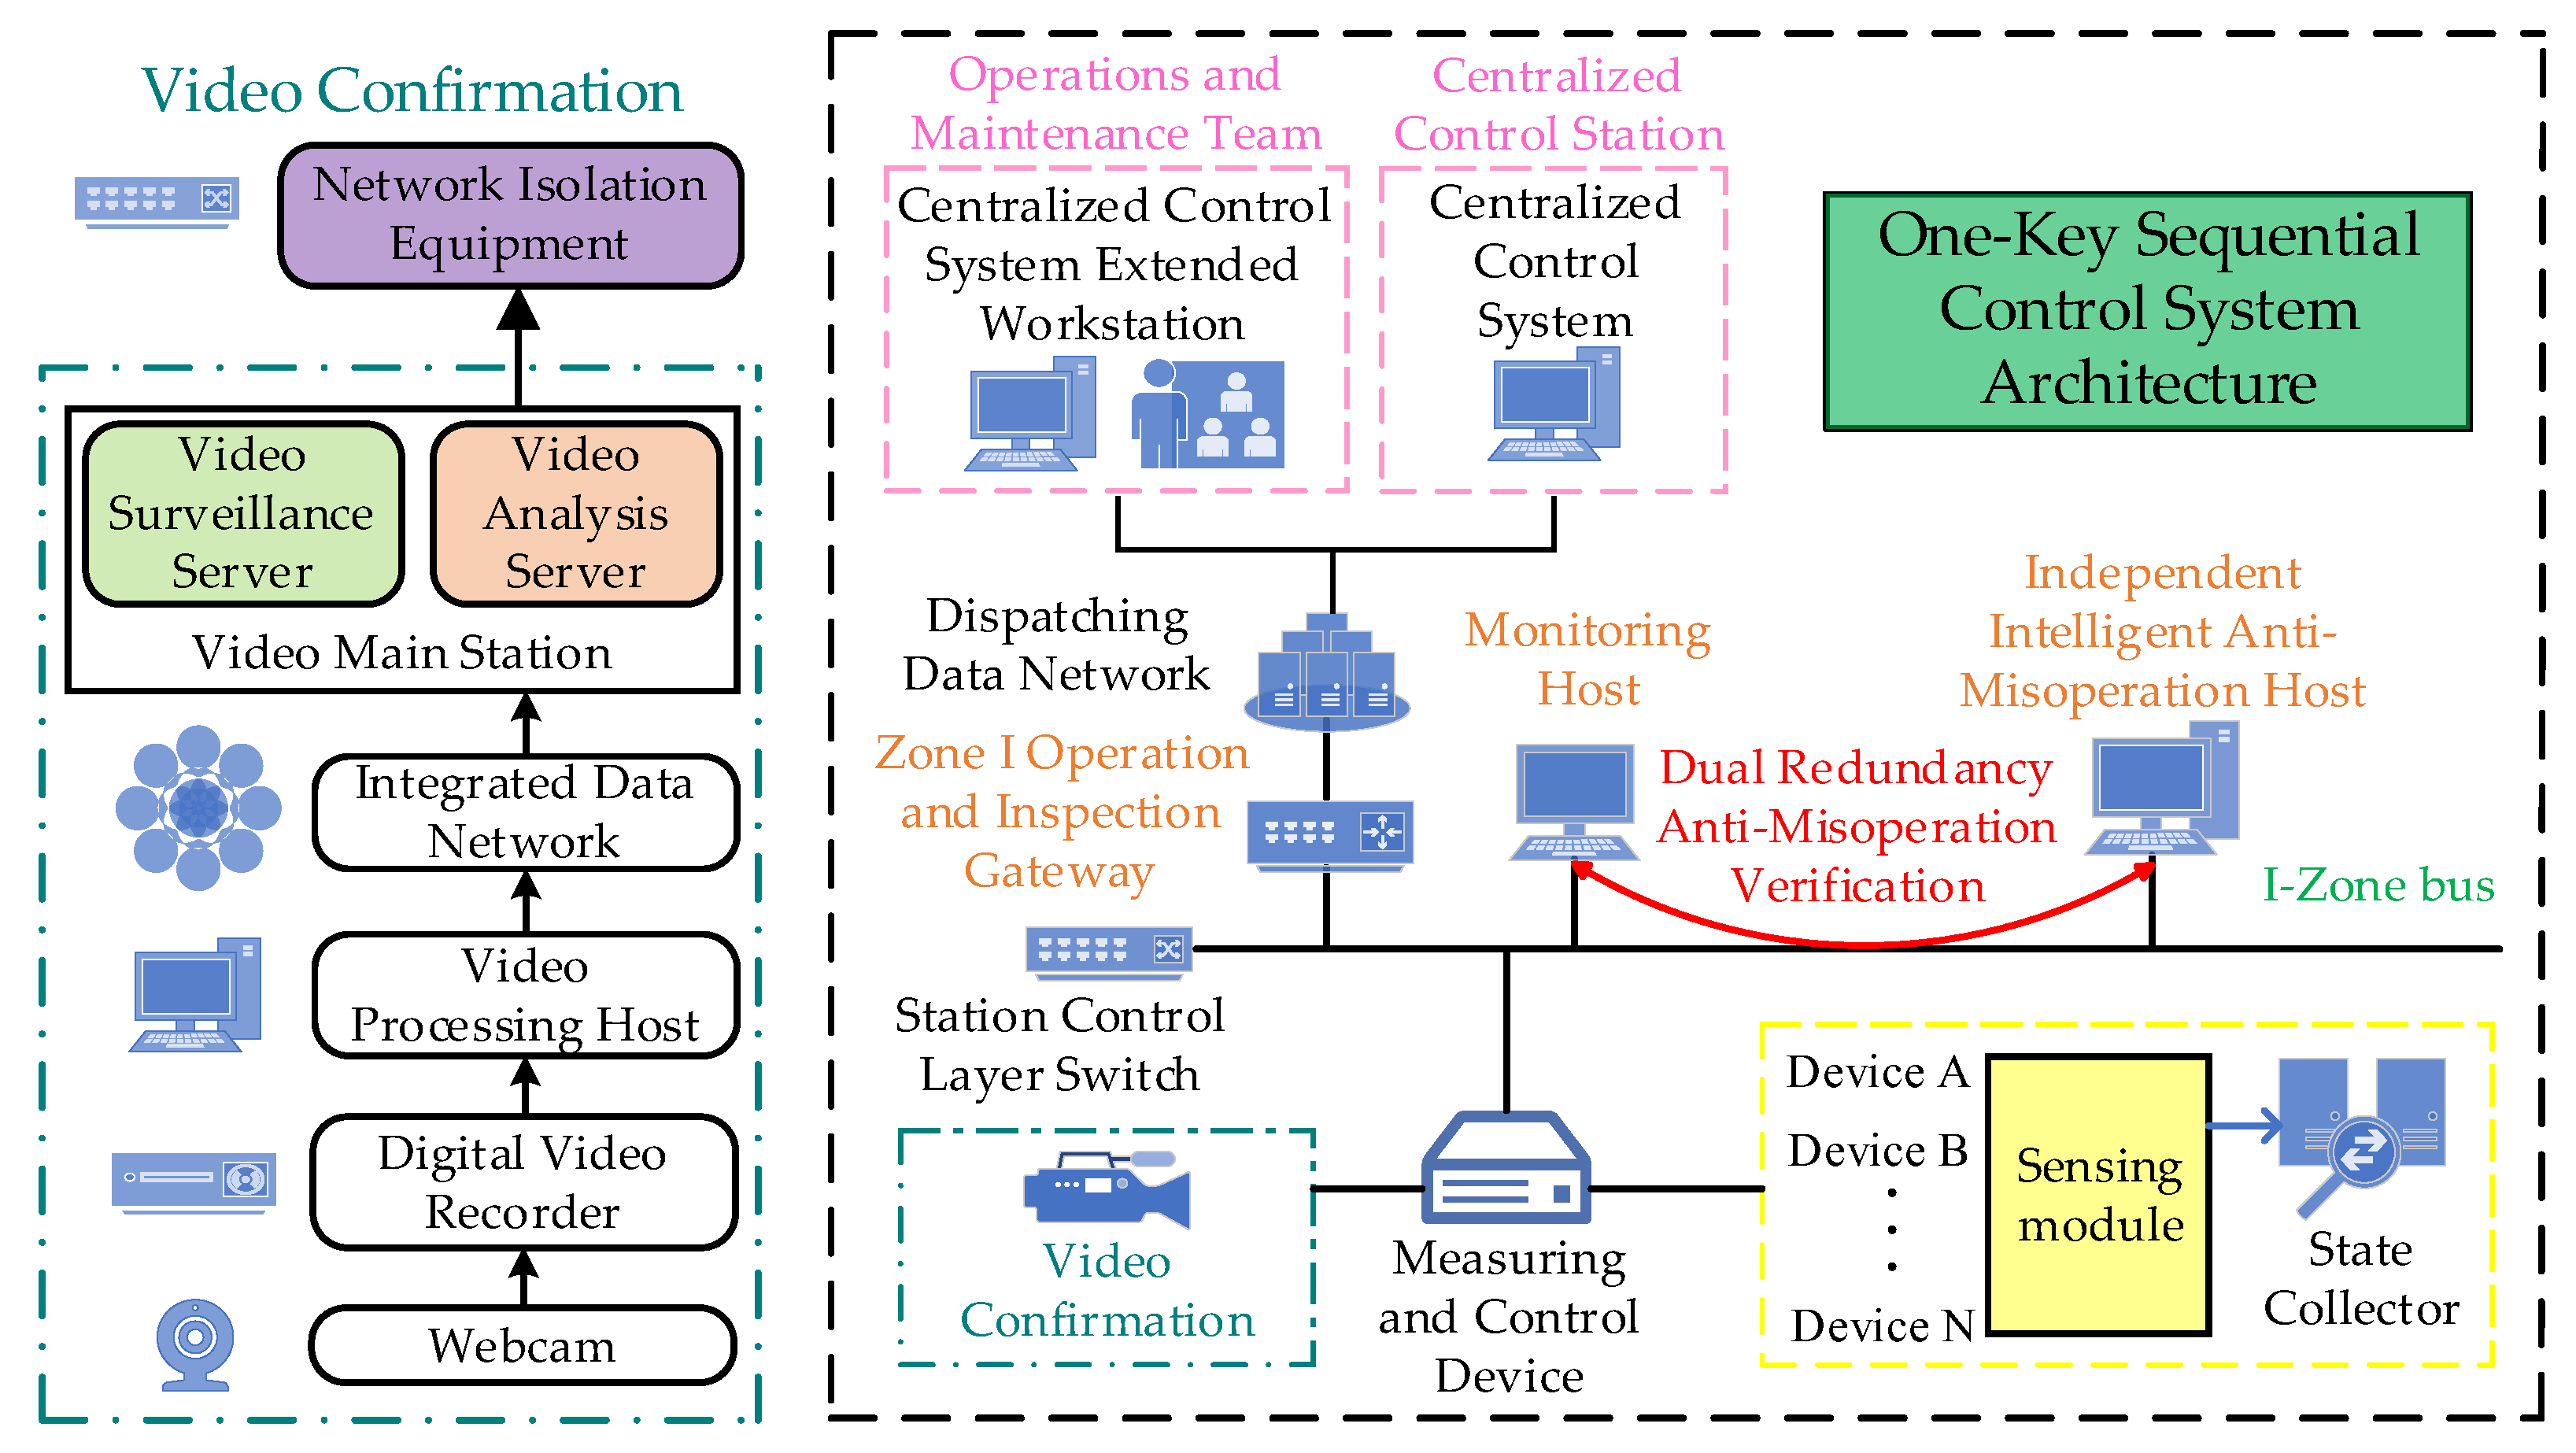
3.2. The Platform Architecture of One-Key Sequential Control System

The overall architecture of the one-key sequential control system platform is shown in Figure 3. Within the substation, it deploys a monitoring host, an independent intelligent anti-misoperation host, and an I-zone operation and inspection gateway. The monitoring host connects to the I-zone station control layer network through dual-network redundancy, collecting and processing information such as the operating status of primary and secondary equipment, real-time electrical measurements, and indications of power grid anomalies from the station control layer network. It possesses functions such as one-key sequential control, anti-misoperation interlocking, operation monitoring, and operation control for on-site equipment. Before controlling each operation item, the monitoring host communicates with the auxiliary equipment monitoring system, sends out remote control linkage signals, initiates camera linkage, and transmits data such as device status and measurement information once.
The independent intelligent anti-misoperation host provides operation interlocking functions for all station equipment, interacts with the monitoring host to exchange anti-misoperation safety information, and performs dual-set anti-misoperation verification. It facilitates one-key sequential control operations by offering functions such as simulated rehearsal, comprehensive/single-item operation project anti-misoperation verification, and more.
The I-zone operation and inspection gateway are equipped with vertical encryption devices and routers at the front end, ensuring secure access to remote data. It interacts with the monitoring host to exchange one-key sequential control information, forwards one-key sequential control commands, uploads execution results, and provides an operational channel for remote one-key sequential control.

3.3. Execution of One-Key Sequential Control Operation

3.3.1. Determination of Device Status

The status of primary and secondary equipment in the substation is divided into operational status, hot standby status, cold standby status, and maintenance status which includes circuit breaker maintenance status and line maintenance status. The determination of device status is a necessary condition for the execution of one-key sequential control operations. It is defined based on information such as the device’s position, operation or energy storage air switch position, energy storage status, and protection status. Real-time device status data in the substation are collected and transmitted through position sensors, status collectors, high-definition network cameras, infrared thermal imagers, inspection robots, and other means.

3.3.2. Generation of Operation Tickets

A one-key sequential control operation ticket includes items such as the operating object, current device state, target device state, operation task name, operation items, operating conditions, target status, etc. The monitoring host receives and executes one-key sequential control commands issued locally and remotely in real time. Based on a typical operation ticket library, it accomplishes tasks such as generating, modifying, deleting, storing, and managing sequential control operation tickets.

3.3.3. Simulation Rehearsal and Instruction Execution of Operation Tickets

The one-key sequential control operation ticket needs to undergo a simulated rehearsal within the monitoring host and the independent intelligent anti-misoperation host to confirm the correctness, feasibility, and safety of the operational logic. After the successful simulated rehearsal, the execution of the operation ticket, anti-misoperation verification, and operation log recording are completed, and the execution results are uploaded.

3.4. The Main Problems with the One-Key Sequential Control System

3.4.1. Low Data Transmission Efficiency and Long System Response Time

Due to the increased connection of communication equipment in the substation, the addition of double confirmation devices for isolating switches and circuit breakers, the extensive integration of image monitoring systems, and the deployment of dual-set safety verification systems for independent intelligent anti-misoperation hosts and monitoring hosts, the data redundancy, duplicate data, and data noise in the substation have increased. For example, the existing communication network bandwidth may not be able to handle the video streams from high-definition cameras in the monitoring system, leading to data congestion and subsequently causing the paralysis of the communication network. When there is a high volume of user requests, the system response time is prolonged. If there is a delay in updating real-time status information for primary and secondary equipment, it will result in an extended verification and execution time for operation tickets, failing to meet the rapid response performance requirements of the one-key sequential control system.

3.4.2. Low Data Quality and Low Data Accuracy

Currently, the data volume and complexity of equipment status data measured by various sensors in the substation are immense. The use of double confirmation criteria for isolating switches and circuit breakers leads to issues such as data repetition, anomalies, errors, omissions, and structural mismatches. When high-definition cameras are used as auxiliary criteria for monitoring, there are some blind spots due to the fixed position of the cameras. In adverse weather or environmental conditions, the clarity and visibility of the equipment decrease, affecting the judgment of the equipment’s positional status. Additionally, different measuring devices have varying errors in signal reception, transmission, and processing, leading to inaccuracies in system judgment and decision-making. This can result in operational errors and negatively impact the reliability, stability, and accuracy of the one-key sequential control system.

3.4.3. Lack of Monitoring and Diagnosis of Equipment Failures

Based on the historical operational status data, electrical parameter data, meteorological data, and external loss data measured by intelligent inspections of substation equipment, a comprehensive evaluation of the state of intelligent substation equipment is conducted, and the operational environment is comprehensively simulated. The changes in various status parameters of substation equipment are analyzed to assess the severity of equipment degradation. Timely and accurate state evaluation and prediction are performed, and warnings and alarms are issued for abnormal equipment conditions. Fault spatiotemporal logs are recorded, and the causes of faults are diagnosed. The prediction of short-term spatiotemporal data in the substation and the comprehensive perception of the overall operational environment are achieved. Currently, substations still need to strengthen the identification, localization, and diagnosis of equipment failure issues to ensure the integrity and accuracy of monitoring content.

4. Types of Power Transformer Faults

The external faults of a power transformer include lightning strikes, overvoltage, overcurrent, electrical breakdown, etc. These are caused by influences from the power system itself or external factors such as lightning, voltage fluctuations in the power grid, and short circuits, leading to transformer burnout, insulation breakdown, and winding open circuits [9,10,11,12]. Internal faults of transformers can be classified into thermal faults and discharge faults based on the nature of the faults, with these two categories accounting for 80% of all faults. This article mainly focuses on the study of thermal faults in power transformers.

4.1. Thermal Faults

Transformer thermal faults refer to various issues caused by excessive temperatures, which can significantly affect the performance of the transformer and may even result in equipment damage or fire. Here are some common thermal faults of transformers:
  • Overheating of windings: Prolonged operation at loads exceeding rated capacity can cause overheating of windings and insulation materials, ultimately leading to insulation aging, winding short circuits, or other internal faults.
  • Cooling system failure: The transformer’s cooling system includes components such as cooling oil and radiators. If the cooling system fails, such as due to oil leaks, radiator blockages, or improper cooling system design, the transformer may not effectively dissipate heat, leading to overheating.
  • Insulation aging: After years of operation, distribution transformers may experience insulation expansion, resulting in blocked oil passages between winding sections, poor oil flow, and insufficient cooling of inter-turn insulation, and aging insulation layers may peel off under prolonged electromagnetic vibration, leading to inter-turn or inter-segment short circuits and eventual transformer failure [10].
  • Overheating of tap changers: Mechanical wear, electrical corrosion, and contact contamination resulting from long-term switching operations can cause poor contact, loosening, and overheating of tap changers.
  • Faults in transformer leads: Broken leads, poor contact of lead joints, and loose conducting rods can increase contact resistance, generating excessive heat during current flow and leading to localized overheating.
  • Magnetic circuit overheating: During operation, transformers generate stray magnetic fields, and eddy currents generated in areas with high stray magnetic flux can cause significant heat buildup, leading to localized overheating.
  • High ambient temperatures: If transformers are installed in locations with excessively high ambient temperatures or poor ventilation, the transformer itself may overheat.
Regular inspection, maintenance, and upkeep are crucial for preventing thermal faults in transformers. This includes monitoring the transformer’s temperature, ensuring the cooling system remains unobstructed, and conducting periodic inspections of the insulation materials. Timely detection and resolution of potential thermal fault issues can ensure the safe and stable operation of the transformer.

4.2. Discharge Faults

A discharge fault in a transformer refers to the phenomenon of discharge occurring inside or around the transformer, which can lead to equipment damage, unstable operation, or even fires. Discharge faults are typically caused by issues with the insulation system or external environmental factors. Here are some common discharge faults in transformers:
  • Partial discharge: Partial discharge is a localized electrical discharge phenomenon that occurs in the insulation system due to defects in insulation materials, air bubbles, or impurities in the oil. Partial discharge can lead to insulation material damage, gas generation, oil contamination, and accelerated transformer aging.
  • Oil discharge: If the insulation oil in the transformer is contaminated or the gas dissolution rate increases abnormally, it may lead to oil discharge phenomena. Oil discharge can generate gas, heat, and sediment, leading to oil contamination, decreased insulation performance, and equipment damage.
  • Flashover discharge: Flashover discharge is a sudden discharge phenomenon that occurs on the surface of insulation or between windings, usually due to insufficient insulation strength or excessive voltage stress. Flashover discharge can lead to insulation material damage, thereby reducing the insulation performance of the transformer.
  • External discharge: External discharge refers to discharge phenomena occurring in the atmospheric environment around the transformer, possibly caused by lightning, arcing, pollution, etc. External discharge can generate high-energy arcs, causing severe damage to the transformer.
The key to preventing discharge faults in transformers lies in regular inspections of the insulation system, keeping the transformer clean, and promptly addressing insulation oil contamination. Additionally, the rational design of the transformer’s insulation system and surrounding environment is also an important measure to prevent discharge faults.

4.3. One Fault Detection Method for Transformers
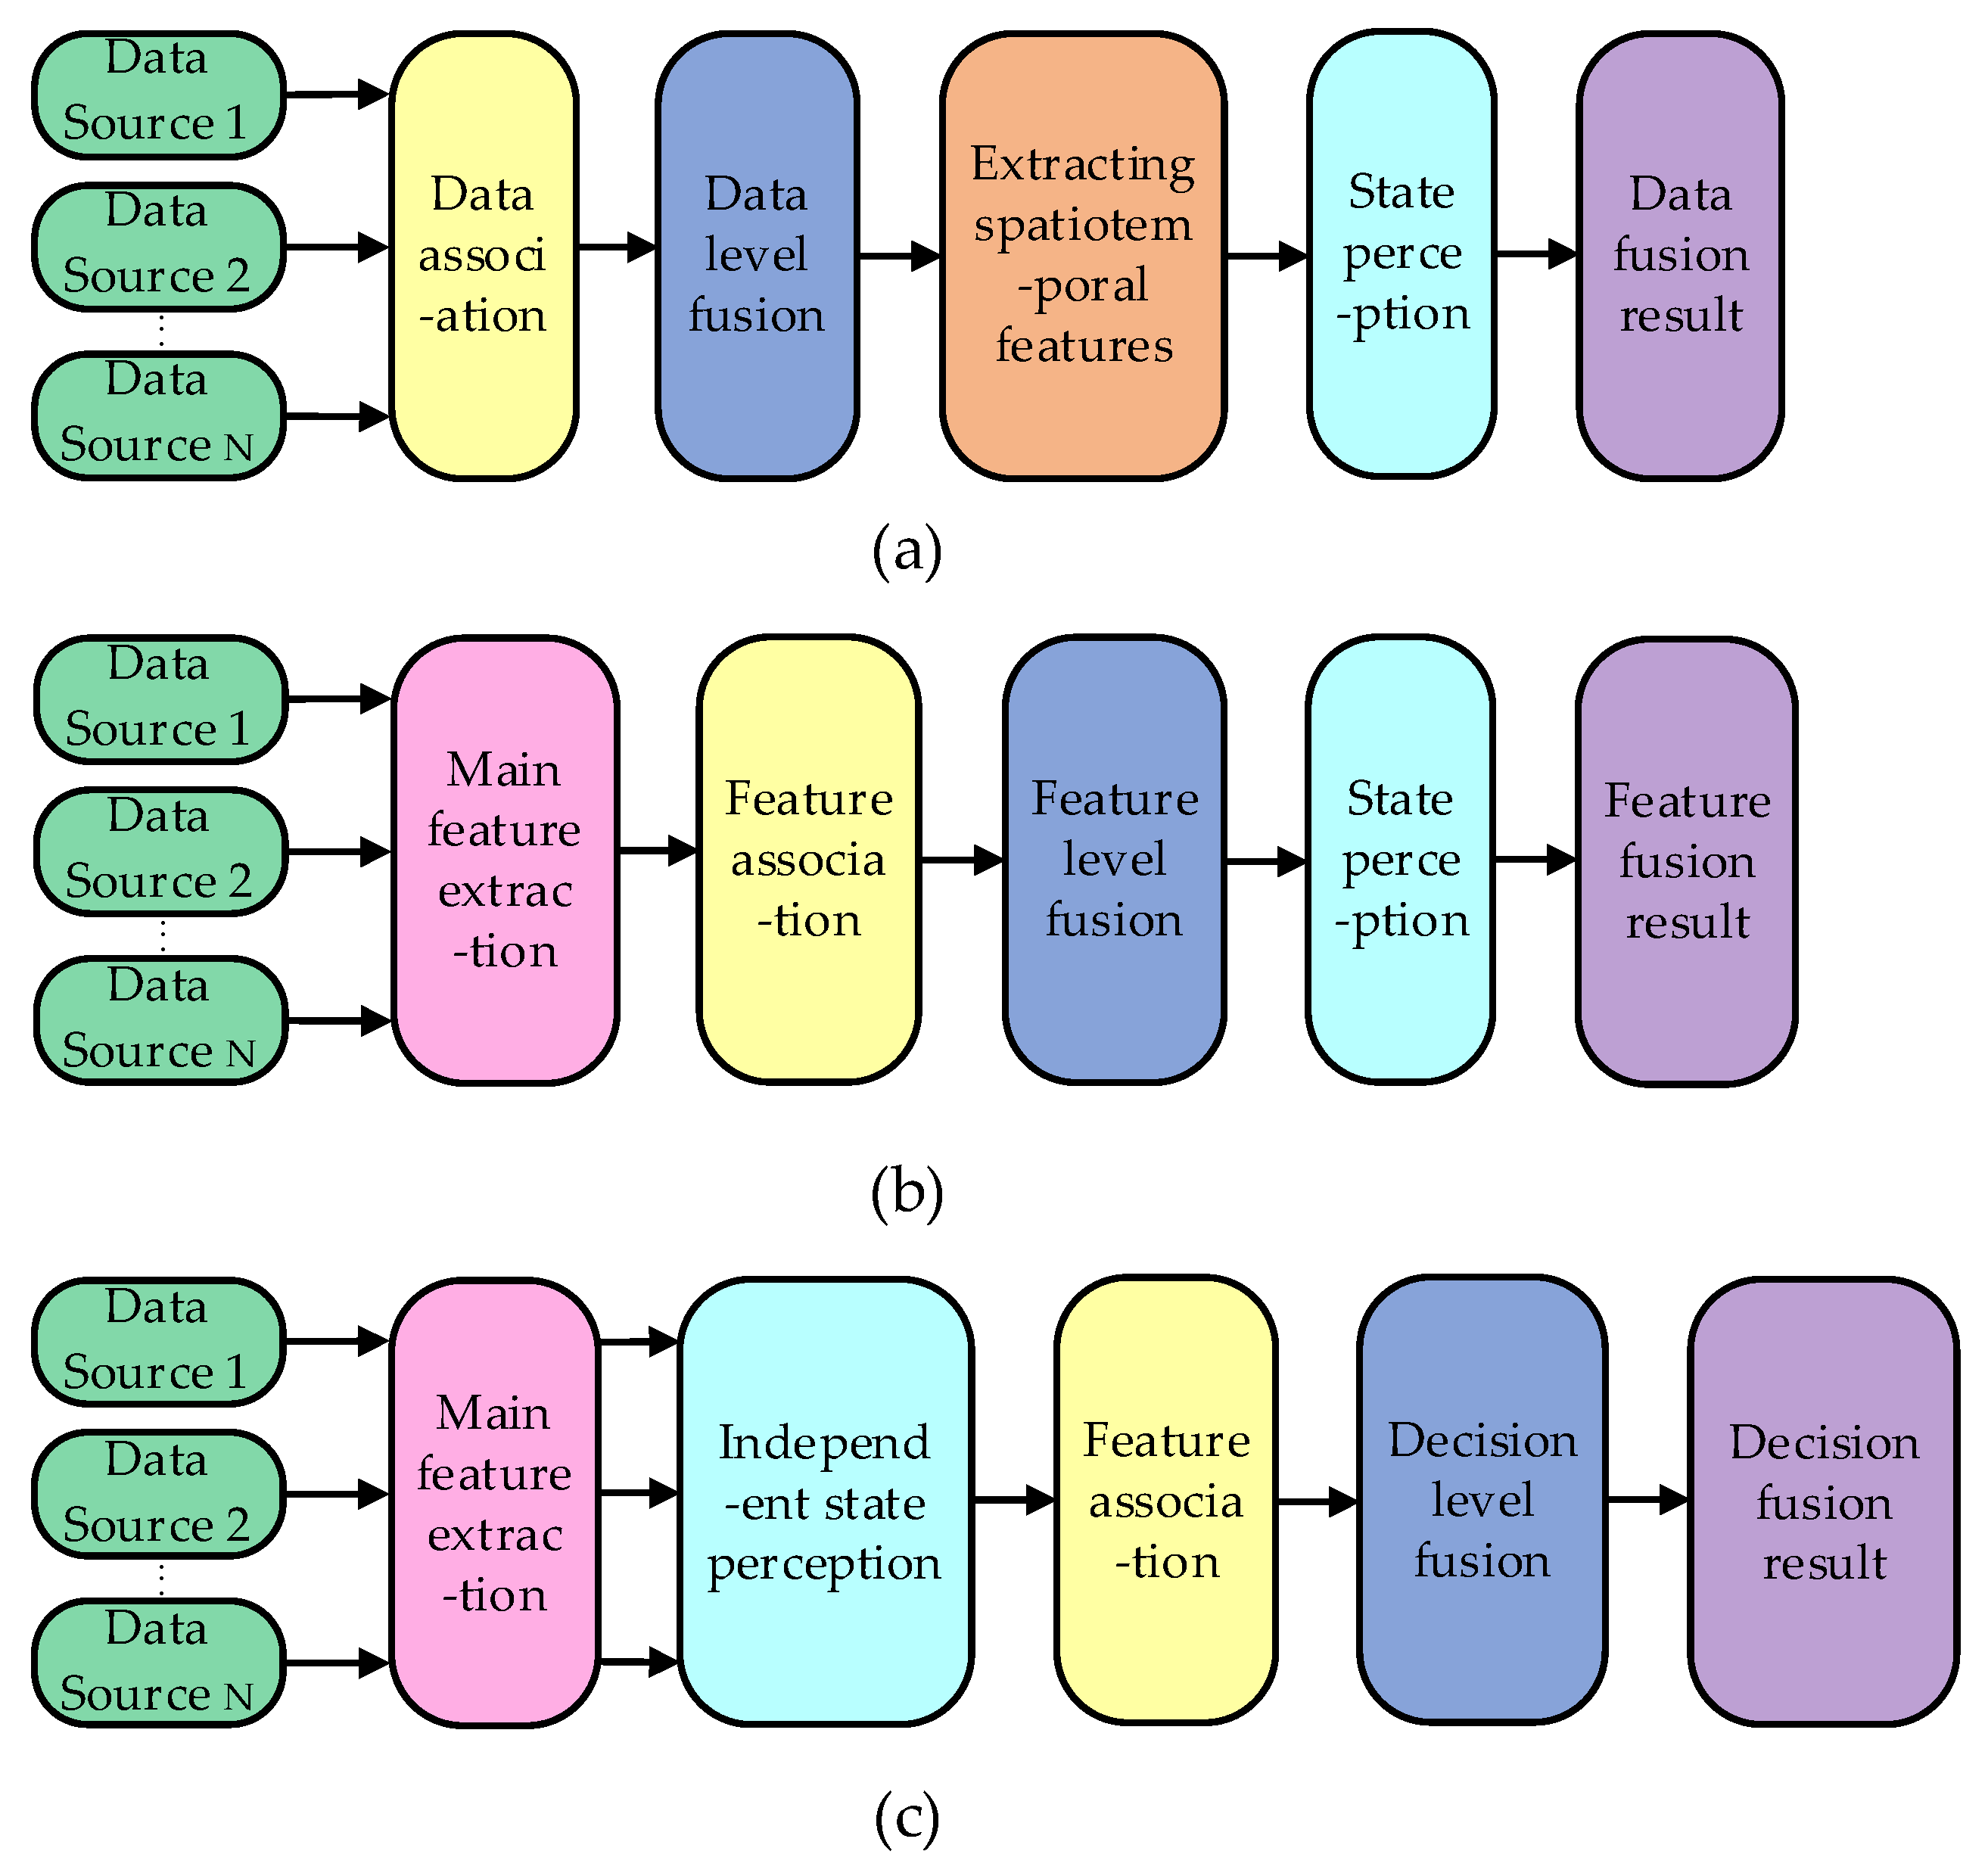
A common fault in transformers is a phase-to-phase short circuit, which refers to a short circuit between two phases of the transformer. Failure to detect and address this issue promptly can result in the overheating of windings, insulation damage, and equipment malfunction. Differential relays can be used to detect phase-to-phase short circuit faults in transformers.
Differential relays compare the current entering and leaving the winding of a transformer to detect any imbalances that may indicate a fault. Differential relays are connected to three-phase transformers, measuring the current entering the winding (Iin) and leaving the winding (Iout) for each phase. Under normal operating conditions, the current entering the winding for each phase is equal to the current leaving the winding. However, if a phase-to-phase short circuit fault occurs (for example, a short circuit between phase A and phase B), the currents entering and leaving the winding for phases A and B will no longer be equal. The differential relay can detect this imbalance. When the differential relay detects an imbalance exceeding a preset threshold, it triggers an alarm or circuit breaker, isolating the faulty part of the transformer to ensure the safe and reliable operation of the transformer system.

5. Data Fusion

Multiple-source data fusion technology refers to the aggregation, correlation, integration, analysis, and evaluation of data from multiple sensors or other types of information sources. It aims to make short-term predictions for a specific event, enhance the accuracy of target detection and feature estimation, achieve situational awareness, and obtain a comprehensive description of a confined space from all perspectives [13,14,15].
In the one-key sequential control system, the use of data fusion technology allows encryption and compression of upper-level dispatch instructions and simulated/execution instructions issued by the monitoring host. This ensures the security and accuracy of instruction issuance while improving the speed of instruction transmission. After the instructions are issued, various sensors, monitoring devices, and measurement and control devices transmit equipment location information and equipment operational status information, extracting the main data attributes.
In theory, this can reduce data redundancy and noise, enhance data quality and accuracy, improve data transmission efficiency, reduce system response time, alleviate data transmission layer pressure, and simultaneously increase the accuracy of equipment status monitoring and fault diagnosis [16,17]. This optimization contributes to enhancing the performance of the one-key sequential control system.
Data fusion includes data-level fusion, feature-level fusion, and decision-level fusion. The architecture of three types of fusion is shown in Figure 4. The selection of the fusion hierarchy for the new power system needs to comprehensively consider factors such as data structure, fusion accuracy requirements, data layer communication capability, real-time data requirements, fusion costs, and backend computing capabilities [15,18].
The key to achieving data fusion is to use data processing algorithms to coordinate the data generated by all sensors or data sources, integrate effective data, and thereby obtain target-oriented, high-quality, and more valuable information. Regardless of the algorithm used, it must meet a fundamental requirement, which is to have robustness and the ability for parallel processing to adapt to the diversity and complexity of data information.

6. Power Transformer-Transformer Neural Network

Due to the complex structure and harsh operating environment of transformers, their fault characteristics contain a lot of uncertain information. A single algorithm cannot fully identify them. Considering the limitations of a single method and issues related to the resistance to interference and poor robustness of single-state data, it is necessary to adopt a transformer fault diagnosis method based on data fusion [19,20].
The transformer neural network model is a deep learning model based on the self-attention mechanism. Compared to convolutional neural networks (CNNs) or long short-term memory networks (LSTMs), the transformer network model can thoroughly explore the relationships between data dimensions of different features. As the transformer model has a relatively complex multi-layered structure, it provides excellent non-linear mapping capabilities for the decision-making layer, making it more suitable for the state monitoring and fault diagnosis of transformers [21,22,23,24].
This paper proposes a Power Transformer-Transformer Neural Network (PT-TNNet) model for power transformer condition monitoring and fault diagnosis. The model is trained using a large amount of multidimensional operational historical data collected from sensors inside the transformer. In the data preprocessing stage, data fusion is employed to reduce the model’s training data volume requirements, thereby accelerating model convergence.

6.1. Overview

The framework for power transformer condition monitoring and fault diagnosis consists of three main parts: data preprocessing, transformer network model training, and model testing, as shown in Figure 5. By deploying sensors inside and outside the transformer, various types of status data of the transformer are measured to obtain raw data. The raw data undergo Fourier transform to obtain frequency-domain features, while the original data inherently contain time-domain features. The time-domain features and frequency-domain features obtained from the transformation are fused through a data fusion module. The data are then divided into training and testing datasets, which are input into the transformer model for training. The training process continues until the accuracy on the test set reaches a predetermined value, at which point the training is terminated, and the model is saved [25].
During model inference, real-time data from sensors on the transformer are input into the trained model, and the inference process yields the current transformer state corresponding to the input data.

6.2. Data Preprocessing

The Fourier transform is a linear integral transformation. When a time-domain signal undergoes Fourier transform, the frequency-domain expression of the signal is obtained, revealing features that may not be observable in the time domain. For a continuous signal f(t), its transformation formula is given by Equation (1):
F ( ω ) = F [ f ( t ) ] = + f ( t ) e j ω t d t
Sampling the continuous signal x(t) in the time domain yields discrete samples x(n), and applying the discrete Fourier transform to these samples results in Equation (2):
X ( ω ) = n = + x ( n ) e j ω n
In the frequency domain, the samples are obtained as shown in Equation (3):
X ( k ) = n = 0 N 1 x ( n ) e j 2 π k n N
The time-domain features and frequency-domain features obtained after the Fourier transform are fused through a data fusion module, completing the preprocessing of the original data.

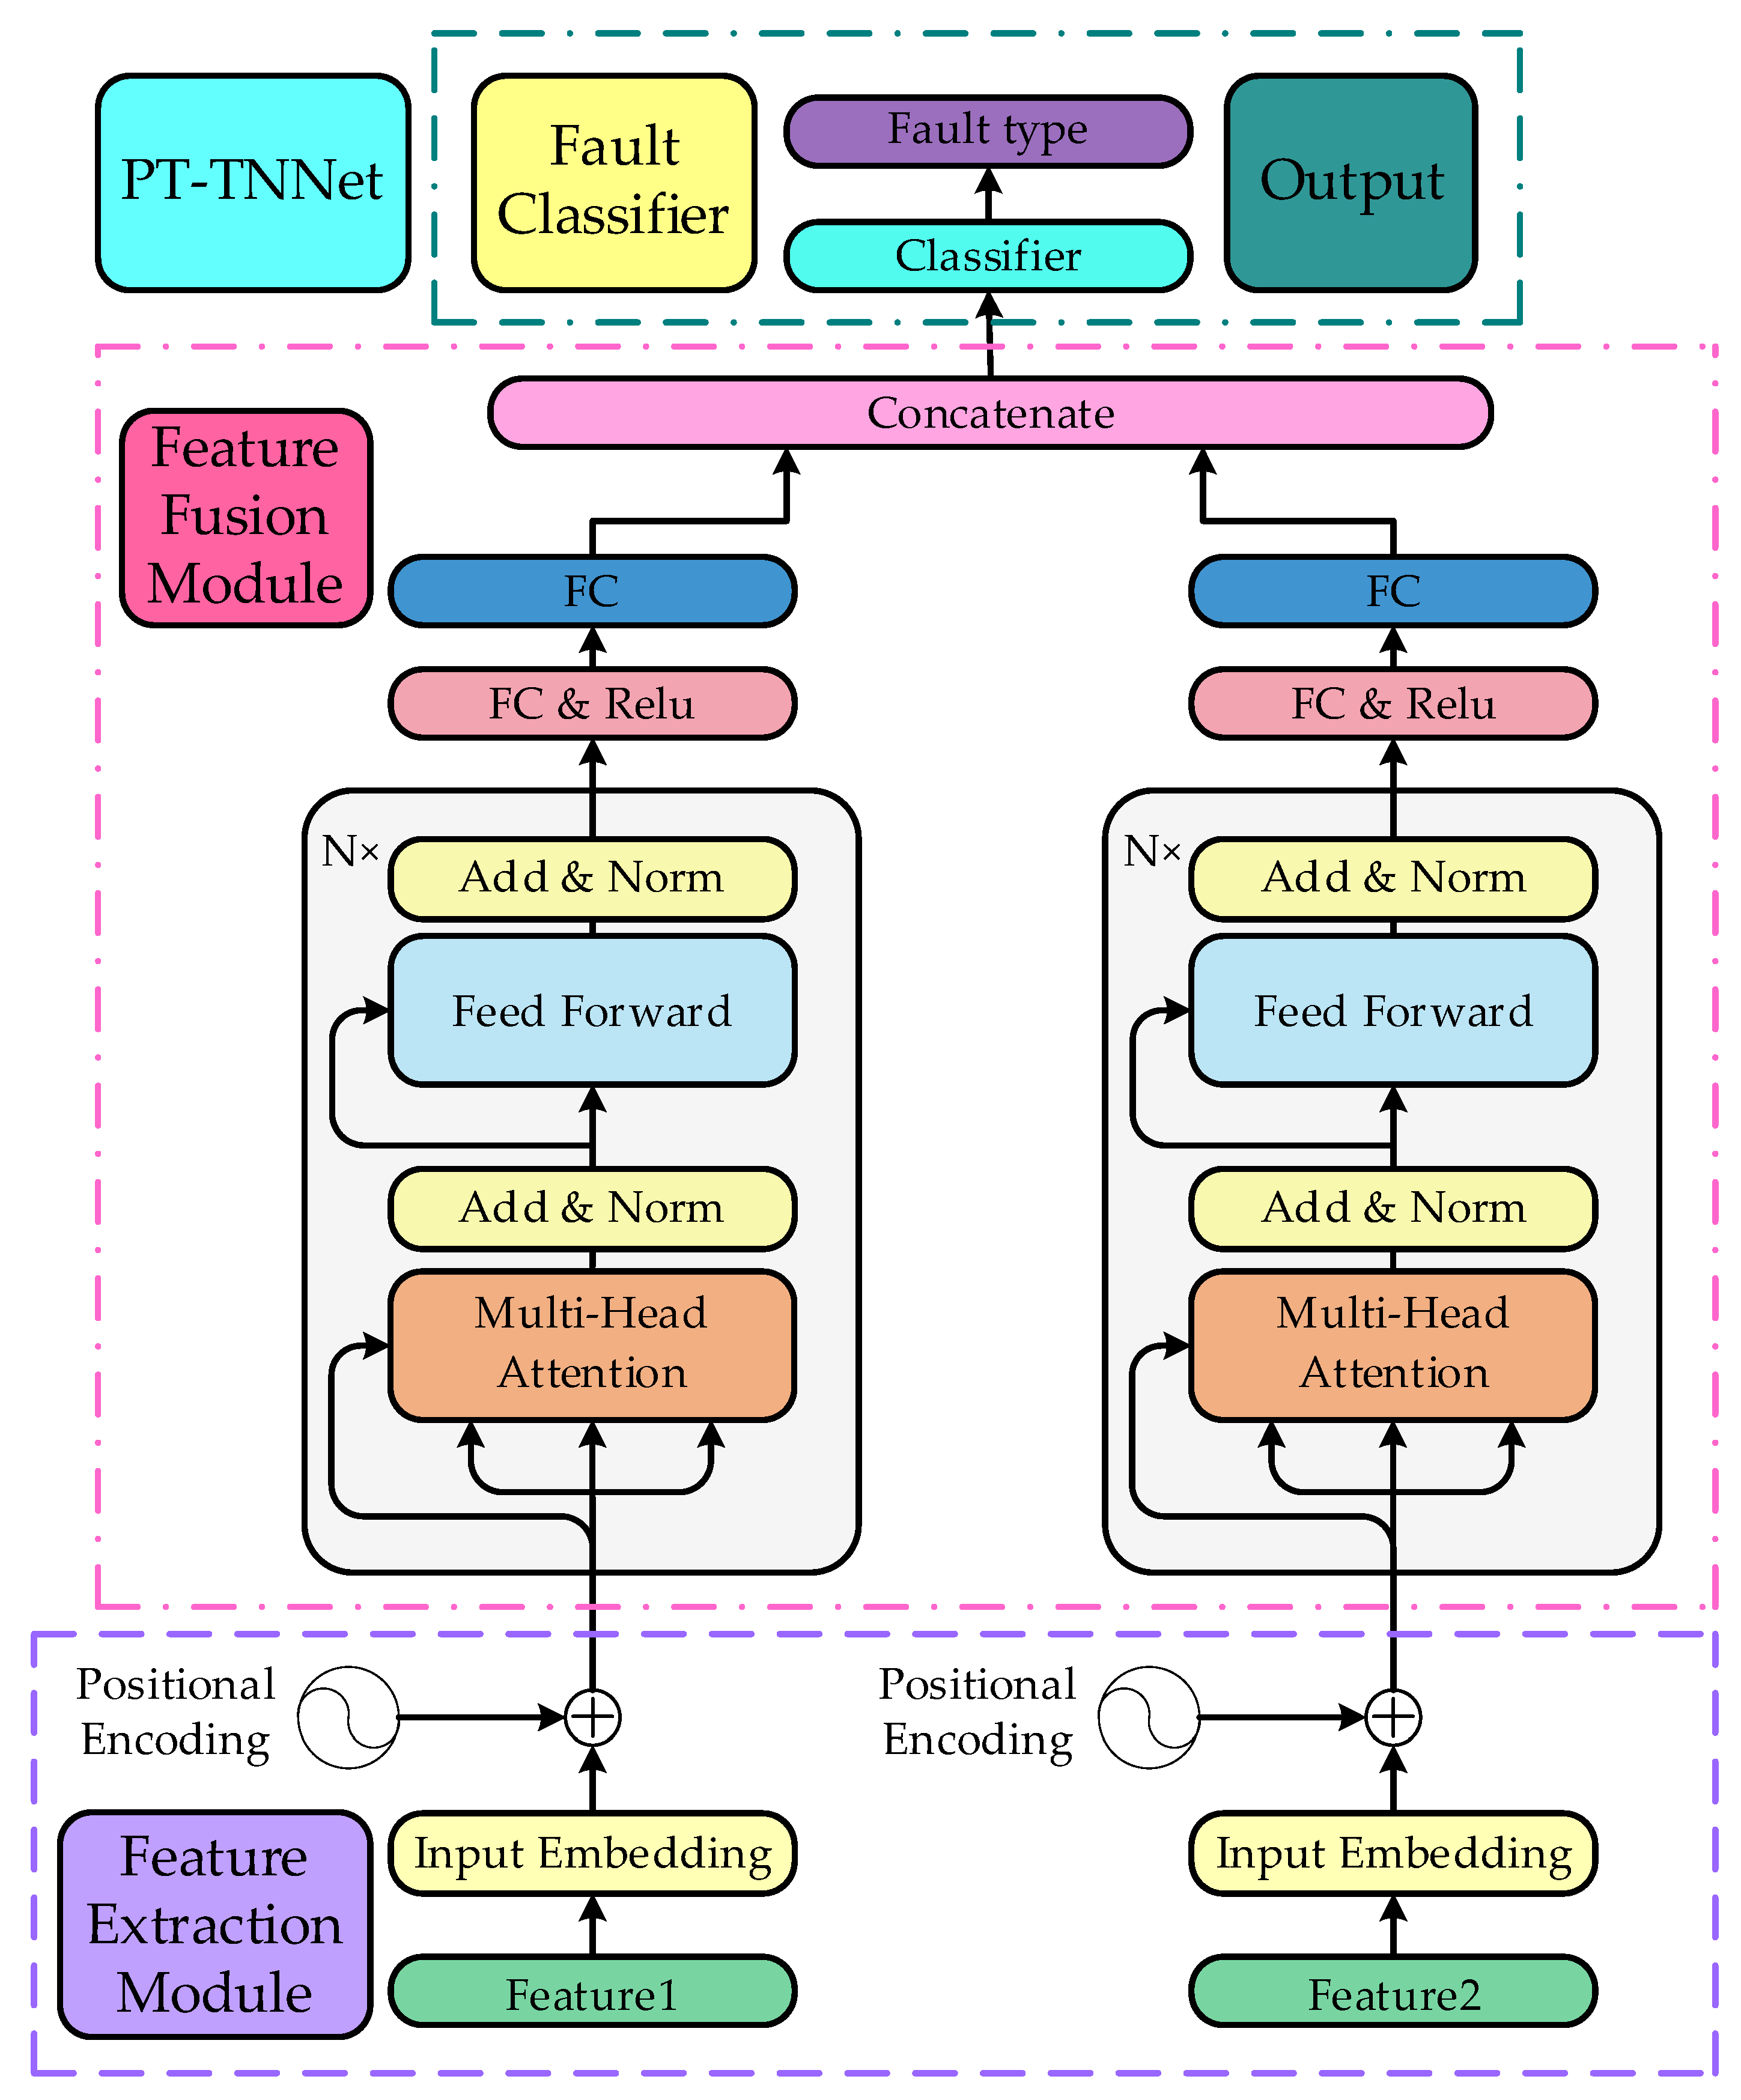
6.3. Design of PT-TNNet Model

6.3.1. Positional Encoding

Blocks composed of transformer encoders are leveraged to capture both short-term and long-term dependencies among all input feature sequences. The input to the transformer is typically represented as a sequence. Such sequences are further processed to incorporate a trainable class token for positional encoding. To make full use of the order of feature sequences, some positional information is injected into the sequences for computing the dependency between any two ones [24,25,26]. As a result, the sinusoidal positional encoding scheme is employed to establish global dependencies among input sequences, ensuring the positional relationships of signal features across different times. Mathematically, this encoding scheme can be expressed as follows:
P E ( p o s , 2 i ) = sin ( p o s / 10000 2 i / d m o d e l ) P E ( p o s , 2 i + 1 ) = cos ( p o s / 10000 2 i / d m o d e l )
where pos represents the position of the current input, dmodel is the dimensionality of input and output, and i is the value of the dimension from [0, dmodel]. After the aforementioned transformations, a batch of input embeddings is delivered into the designed transformer blocks, followed by fault diagnosis estimation through the classifier. In this paper, dmodel = 128 is employed.

6.3.2. Transformer Encoder

The encoder is composed of a stack of N identical layers. Each layer has two sub-layers. The first is a multi-head self-attention (MSA) mechanism, and the second is a position-wise fully connected feed-forward network. A residual connection around each of the two sub-layers is employed, followed by layer normalization. The output of each sub-layer is LayerNorm (x + Sublayer(x)), where Sublayer(x) is the function implemented by the sub-layer itself. To facilitate these residual connections, all sub-layers in the model, as well as the embedding layers, produce outputs of dimension dmodel.
Multi-head self-attention can enhance feature expressiveness by combining multiple self-attention layers to focus on different aspects of information. The architecture of the MSA mechanism is with h self-attention layers. Specifically, for the ith head of self-attention, the embeddings are transformed into three matrices of query Qi, key Ki, and value Vi through a learnable linear projection. Self-attention is performed h times in parallel on each projected version of these three matrices [23,24,25]. Finally, the output values of multiple attentions are concatenated together, and a trainable weight matrix WO is utilized to transform the output into a matrix of identical size as input. In detail, the formula of MSA is expressed as follows:
  M u l t i h e a d ( Q , K , V ) = C o n c a t h e a d 1 , , h e a d h W O   h e a d i = A t t e n t i o n   Q W i Q , K W i K , V W i V
where K, Q, and V are the calculation features and are learnable Params. WiQ, WiK, and WiV are the i-th head of linear projection for matrices of query Qi, key Ki, and value Vi, respectively. In this work, we employ h = 8 parallel attention layers, or heads. For each of these, dk = dv = dmodel/h = 16 is set.
In addition to attention sub-layers, each of the layers in the encoder contains a fully connected feed-forward network:
F F N ( x ) = max 0 , x W 1 + b 1 W 2 + b 2
which is applied to each position separately and identically. This consists of two linear transformations with a Relu activation in between. The inner layer has dimensionality dff = 256.

6.3.3. Structure of PT-TNNet

Transformer is a sequence transduction architecture that uses multi-head self-attention mechanisms to capture long-distance dependency information. Taking advantage of the transformer, this article creatively proposes a PT-TNNet. The overall architecture of the proposed PT-TNNet is shown in Figure 6, which mainly contains three parts: feature extraction module, feature fusion module, and fault classifier.
The feature extraction module first reprojects the time-domain and frequency-domain features obtained after preprocessing, mapping them to the same feature space. Finally, an additional positional encoding is provided through a learnable parameter to offer extra positional information.
In the feature fusion module, features from the two branches are transformed to the same feature space through fully connected layers and concatenated together to obtain the fused feature fm. This feature serves as the input to the fault classifier, ultimately yielding the diagnostic result.

7. Experimental Results

7.1. Dataset Description and Evaluation Metrics

The internal faults of transformers can be divided into thermal faults and discharge faults, which account for 80% of the total faults. This article focuses on the detection and diagnosis of the transformer’s thermal faults, including winding overheating, tap changer overheating, magnetic circuit overheating, and high ambient temperatures.
As shown in Figure 7, the temperature, voltage, and current of various components of the transformer are measured by sensors placed inside and outside the transformer. The experimental dataset obtained includes data such as transformer winding temperature, insulation oil temperature in the tank, the ambient temperature of the power transformer, and the three-phase voltage and current of the power transformer [10,11,12]. The data were collected from 12 September 2023 to 12 February 2024, with updates made every 15 min each day. The information regarding samples contained within the dataset is shown in Table 1.
Below are the sources of data in the dataset:
1.
Winding Temperature
In transformers, the winding is one of the key components that carries the current, and it is monitored by a winding temperature indicator. The winding temperature indicator is typically installed on the winding of the transformer and measures the winding temperature in real time through sensors or probes. When the winding temperature reaches or exceeds the set warning or protection threshold, the temperature indicator will sound an alarm or trigger protective devices to ensure that the transformer operates within a safe temperature range, avoiding damage caused by overheating.
2.
Oil Temperature
Insulation oil is used as a cooling and insulation medium, and its temperature is measured in real time by an oil temperature indicator installed in the transformer’s oil tank or oil circuit. When the oil temperature reaches the set warning threshold, the oil temperature indicator will sound an alarm, reminding maintenance personnel to check the transformer’s cooling system, reduce the load, replace the insulation oil, etc., to prevent further increase in oil temperature and ensure the safe operation of the equipment.
3.
Ambient Temperature
The ambient temperature indicator measures the temperature of the surrounding environment of the transformer. By monitoring the ambient temperature, measures can be taken promptly to prevent the equipment from overheating or becoming too cold, thus ensuring the safe operation of the equipment. For example, if the ambient temperature is too high, ventilation can be increased, or the load can be reduced; if the ambient temperature is too low, the equipment can be heated, or additional insulation protection measures can be implemented.
In traditional transformer fault diagnosis, accuracy is typically used as a single diagnostic result, which cannot distinguish between misclassifications and missed detections. To evaluate the proposed PT-TNNet model, four evaluation metrics are used to assess the model’s performance, including accuracy, precision, recall, and F1 score.

7.2. Input Data Ablation Validation

The time-domain features and frequency-domain features obtained from data preprocessing are fused through the data fusion module to construct the model training dataset and testing dataset, which are then fed into the transformer model for training. The ablation validation is performed on different combinations of input data, as shown in Figure 8. When the original data are combined with the Fourier transform, the model exhibits higher evaluation metrics, and the accuracy of PT-TNNet achieves 95.68%. This is attributed to the data fusion, which expands the feature dimensions of the data. The PF-TNNet model can efficiently conduct feature exploration and accelerate model convergence.

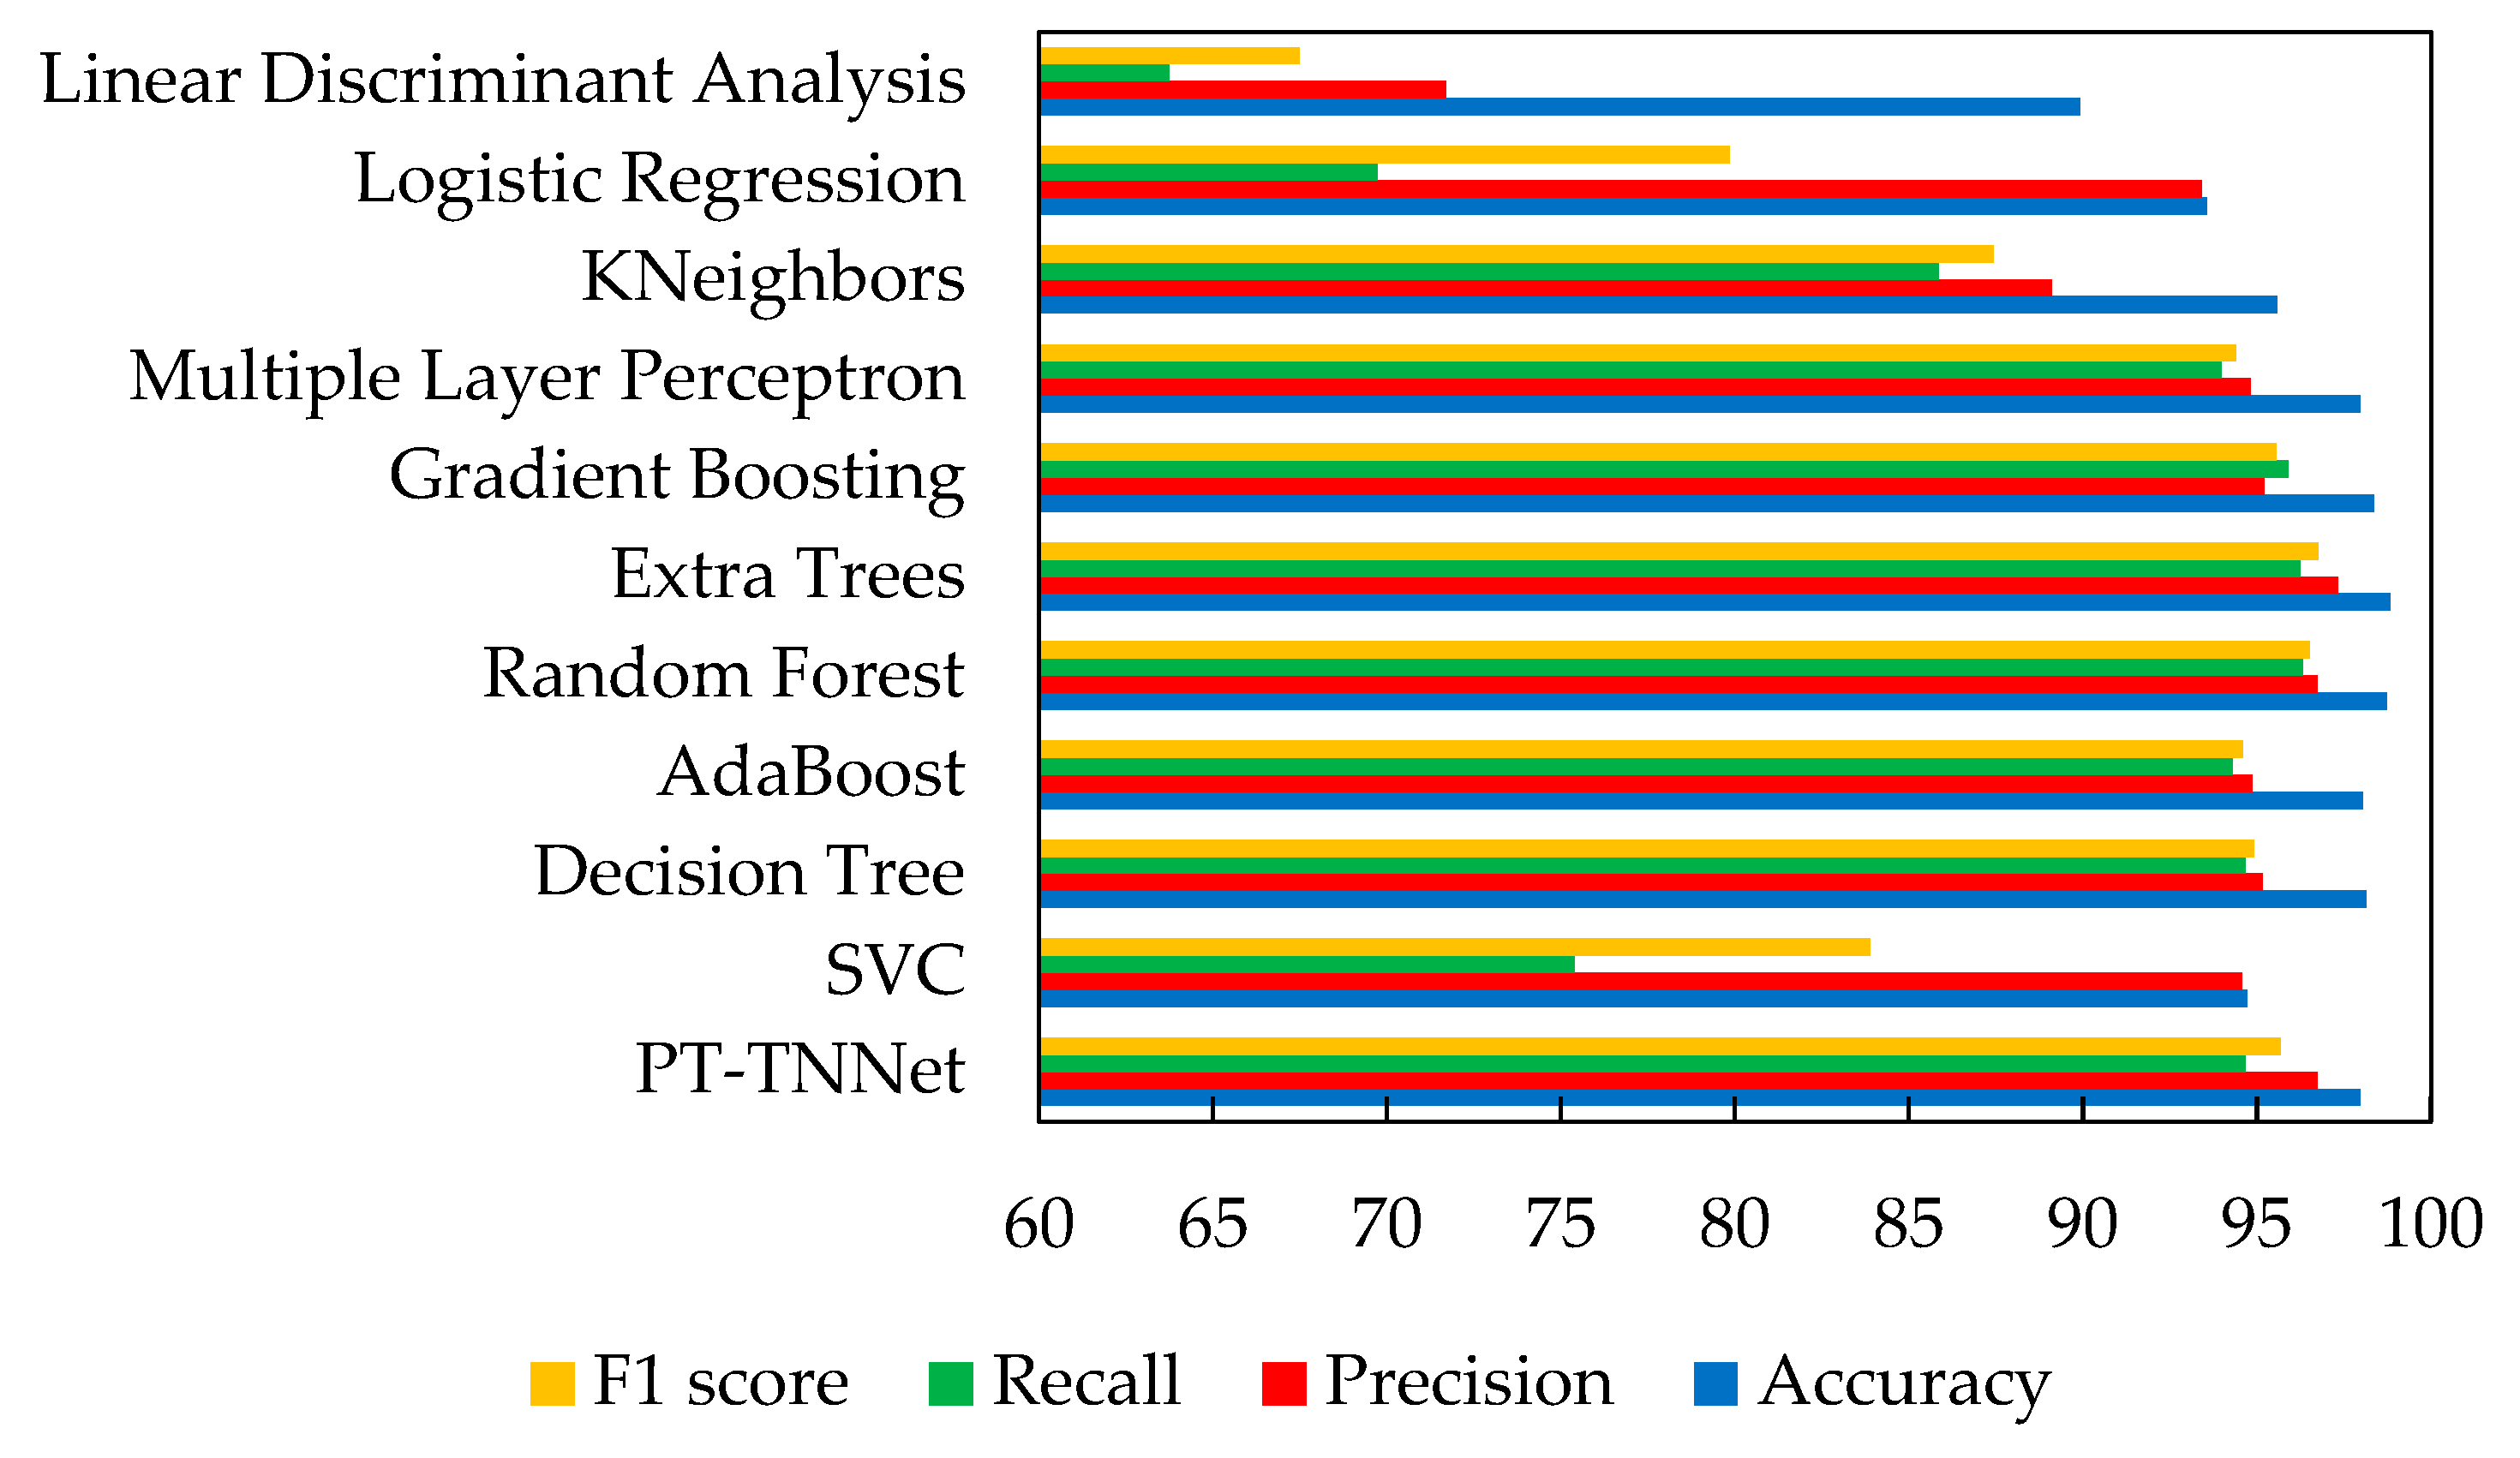
7.3. Analysis of Results and Comparison with Different Methods

In order to investigate and compare the performance of the proposed PT-TNNet model for transformer state monitoring and fault diagnosis, we further conducted comparative experiments using various methods, including SVC, Decision Tree, AdaBoost, Random Forest, Extra Trees, Gradient Boosting, Multiple Layer Perceptron, KNeighbors, Logistic Regression, and Linear Discriminant Analysis algorithms. Comparative experiments were conducted on the datasets described above.
As shown in Figure 9 and Table 2, experimental results on winding temperature data indicate that using the PT-TNNet model yields an accuracy of 95.68%, precision of 94.25%, recall of 95.46%, and an F1 score of 94.85%, all of which are higher than those of other models, demonstrating the superiority of the transformer neural network. However, the values of the evaluation metrics are also relatively high when using Random Forest and Extra Trees. Therefore, further comparative experiments on insulation oil temperature and ambient temperature are needed to select suitable and efficient models.
As shown in Figure 10 and Table 3, the experimental results on transformer insulation oil temperature data indicate that using the PT-TNNet model yields an accuracy of 99.95%, precision of 99.89%, recall of 95.45%, and an F1 score of 97.61%, all of which are higher than those of other models. When using Decision Tree, AdaBoost, Random Forest, Extra Trees, and Gradient Boosting, the values of the evaluation metrics are also relatively high. However, Random Forest exhibits a lower recall rate, at only 90.89%. Next, comparative experiments will be conducted on the transformer’s ambient temperature.
As shown in Figure 11 and Table 4, experimental results on transformer ambient temperature data indicate that using the PT-TNNet model yields an accuracy of 97.96%, precision of 96.72%, recall of 94.65%, and an F1 score of 95.67%, which is not optimal. When using Random Forest and Extra Trees, the values of the evaluation metrics are higher than those of the PT-TNNet model. External ambient temperature is influenced by natural climate and geographic location, resulting in complex and fluctuating variations. Therefore, the internal winding temperature and insulation oil temperature of the transformer are crucial for transformer condition monitoring and fault diagnosis.
Next, cross-validation is conducted on the accuracy of the PT-TNNet, Random Forest, and Extra Trees models for winding temperature and oil temperature. In cross-validation, the dataset is divided into several subsets, with one subset used as the test set and the remaining subsets used as the training set in rotation. This process is repeated multiple times, and the results of each validation are summarized to obtain the final evaluation metrics. CrossValMeans averages the results of each cross-validation, helping to reduce fluctuations in evaluation results caused by random data partitioning and providing a more stable assessment of model performance. CrossValErrors indicate the standard deviation of the evaluation metrics, providing information about the performance of the model on different data subsets and helping to evaluate the robustness and generalization ability of the model. The cross-validation results are shown in Table 5 and Table 6.
The statistical results of three kinds of input data using the PT-TNNet model are shown in Table 7. The PT-TNNet model outperforms other algorithms in terms of monitoring and diagnosing accuracy, precision, recall, and F1 score for winding temperature and oil temperature. This is attributed to the unique self-attention mechanism of the transformer model, allowing PT-TNNet to explore the relationships of different dimensional inputs and increase model accuracy. Feature fusion during data preprocessing removes data redundancy and noise, accelerating model convergence. However, as the depth of the PT-TNNet model increases, its accuracy can continue to improve, but the complexity of the model also increases, which may not be favorable for systems requiring rapid response.
The experimental results above validate the effectiveness of the PT-TNNet model in detecting and diagnosing the status of power transformers, improving the accuracy of collecting transformer status information. Moreover, by employing data fusion, the model helps to remove data redundancy and noise to a certain extent, accurately capturing the operating status of the transformer. This improvement could reduce the response time of the one-key sequential control system, thereby providing a more reliable guarantee for the formulation of one-key sequential control operation tickets.

8. Conclusions

This paper addresses several significant issues present in the one-key sequential control system of intelligent substations, including low data transmission efficiency, prolonged system response time, low data quality and accuracy, and a lack of equipment fault monitoring and diagnosis. To mitigate these challenges, the PT-TNNet model, which integrates data fusion and transformer neural network, is introduced for power transformer state monitoring and thermal fault diagnosis. Comparative experiments are conducted on the measured winding temperature, insulation oil temperature, and ambient temperature of transformers. Utilizing PT-TNNet, Random Forest, and Extra Trees—three efficient models—the cross-validation of the accuracy of winding temperature and insulation oil temperature of transformers is performed, affirming the superiority of the PT-TNNet model for transformer state monitoring and fault diagnosis, as well as the feasibility of data fusion technology for one-key sequential control systems, thereby enhancing the accuracy of equipment state information.
In the event of equipment failure, the system receives monitoring alerts, enabling timely fault removal. Under conditions satisfying power supply requirements, the reformation of operation tickets, simulation rehearsals, instruction execution, and equipment deployment or withdrawal are carried out, thereby enhancing data transmission speed, data quality, and accuracy and reducing system response time in the power grid. Consequently, the execution time of each sequential control operation is shortened, efficiency is improved, and the performance of the one-click sequential control system is optimized.

Author Contributions

Conceptualization, C.W.; formal analysis, Z.F. and Z.Z.; investigation, C.W. and W.W.; data curation, C.W.; writing—review and editing, C.W. and H.C.; supervision, D.X.; project administration, W.W. and Z.Z. All authors have read and agreed to the published version of the manuscript.

Funding

This research received no external funding.

Data Availability Statement

The data that support the findings of this study are unavailable due to privacy.

Conflicts of Interest

Authors Cheng Wang, Zhixin Fu, Zheng Zhang, Weiping Wang and Huatai Chen were employed by the State Grid Power Supply Company. The remaining authors declare that the research was conducted in the absence of any commercial or financial relationships that could be construed as a potential conflict of interest. The State Grid Power Supply Company of Gansu Baiyin had no role in the design of the study; in the collection, analyses, or interpretation of data; in the writing of the manuscript, or in the decision to publish the results.

References

  1. Liu, H.; Cai, F.; Lv, C.; Shuai, M. A fish eye recognition algorithm for switch on/off key in sequence control substation. In Proceedings of the 2020 2nd International Conference on Information Technology and Computer Application (ITCA), Guangzhou, China, 18–20 December 2020; pp. 143–146. [Google Scholar]
  2. Wang, Y.; Li, H.; Shiping, E.; Zhang, K.; Chen, Q.; Guo, Y.; Ye, C. Research on intelligent anti-misoperation technology applied to substation one-button sequential control. In Proceedings of the 2021 4th International Conference on Advanced Electronic Materials, Computers and Software Engineering (AEMCSE), Changsha, China, 26–28 March 2021; pp. 258–261. [Google Scholar]
  3. Xiong, Z.; Gan, X.; Gao, Y.; Li, Y.; Ding, D.; Tian, Y. Study on Application of One Key Sequence Control in 750 kV Substation. In Proceedings of the 2021 6th Asia Conference on Power and Electrical Engineering (ACPEE), Chongqing, China, 8–11 April 2021; pp. 269–274. [Google Scholar]
  4. Wang, X.; Chen, C.; Liang, Y.; Zhou, C. Upgrading Application of One-Key Sequence Control in Substation Automation System. In Proceedings of the 2023 9th International Conference on Electrical Engineering, Control and Robotics (EECR), Wuhan, China, 24–26 February 2023; pp. 1–4. [Google Scholar]
  5. Ameli, A.; Ghafouri, M.; Zeineldin, H.H.; Salama, M.M.; El-Saadany, E.F. Accurate fault diagnosis in transformers using an auxiliary current-compensation-based framework for differential relays. IEEE Trans. Instrum. Meas. 2021, 70, 9004214. [Google Scholar] [CrossRef]
  6. Khan, S.A.; Equbal, M.D.; Islam, T. A comprehensive comparative study of DGA based transformer fault diagnosis using fuzzy logic and ANFIS models. IEEE Trans. Dielectr. Electr. Insul. 2015, 22, 590–596. [Google Scholar] [CrossRef]
  7. Qi, B.; Wang, Y.; Zhang, P.; Li, C.; Wang, H.; Chen, J. A novel self-decision fault diagnosis model based on state-oriented correction for power transformer. IEEE Trans. Dielectr. Electr. Insul. 2020, 27, 1778–1786. [Google Scholar] [CrossRef]
  8. Kari, T.; Gao, W.; Zhao, D.; Zhang, Z.; Mo, W.; Wang, Y.; Luan, L. An integrated method of ANFIS and Dempster-Shafer theory for fault diagnosis of power transformer. IEEE Trans. Dielectr. Electr. Insul. 2018, 25, 360–371. [Google Scholar] [CrossRef]
  9. Wang, X.; Li, Q.; Li, C.; Yang, R.; Su, Q. Reliability assessment of the fault diagnosis methodologies for transformers and a new diagnostic scheme based on fault info integration. IEEE Trans. Dielectr. Electr. Insul. 2013, 20, 2292–2298. [Google Scholar] [CrossRef]
  10. Dai, J.; Song, H.; Sheng, G.; Jiang, X. Dissolved gas analysis of insulating oil for power transformer fault diagnosis with deep belief network. IEEE Trans. Dielectr. Electr. Insul. 2017, 24, 2828–2835. [Google Scholar] [CrossRef]
  11. Li, J.; Zhang, Q.; Wang, K.; Wang, J.; Zhou, T.; Zhang, Y. Optimal dissolved gas ratios selected by genetic algorithm for power transformer fault diagnosis based on support vector machine. IEEE Trans. Dielectr. Electr. Insul. 2016, 23, 1198–1206. [Google Scholar] [CrossRef]
  12. Liao, W.; Zhang, Y.; Cao, D.; Ishizaki, T.; Yang, Z.; Yang, D. Explainable Fault Diagnosis of Oil-Immersed Transformers: A Glass-Box Model. IEEE Trans. Instrum. Meas. 2024, 73, 2506204. [Google Scholar] [CrossRef]
  13. Zhang, Y.; Feng, K.; Ma, H.; Yu, K.; Ren, Z.; Liu, Z. MMFNet: Multisensor data and multiscale feature fusion model for intelligent cross-domain machinery fault diagnosis. IEEE Trans. Instrum. Meas. 2022, 71, 3526311. [Google Scholar] [CrossRef]
  14. Huang, Z.; Zhou, J.; Huang, W.; Liu, Y.; Zhu, G.; Zhang, K. Multiple classifiers based information fusion for power transformer fault diagnosis. In Proceedings of the 2020 IEEE 4th Conference on Energy Internet and Energy System Integration (EI2), Wuhan, China, 30 October–1 November 2020; pp. 2971–2975. [Google Scholar]
  15. Wu, H.; Qiao, Z.; Zhang, Y.; Ji, X. Real-time Monitoring of Smart Grid Terminals based on Multi-dimensional Information Fusion. In Proceedings of the 2020 IEEE 4th Conference on Energy Internet and Energy System Integration (EI2), Wuhan, China, 30 October–1 November 2020; pp. 3812–3816. [Google Scholar]
  16. Zhang, L.; Xie, Y.; Xidao, L.; Zhang, X. Multi-source heterogeneous data fusion. In Proceedings of the 2018 International conference on artificial intelligence and big data (ICAIBD), Chengdu, China, 26–28 May 2018; pp. 47–51. [Google Scholar]
  17. Wu, B.; Hu, Y. Analysis of substation joint safety control system and model based on multi-source heterogeneous data fusion. IEEE Access 2023, 11, 35281–35297. [Google Scholar] [CrossRef]
  18. Liu, H.; Chen, Y.; Cui, N.; Xu, D.; Li, J. An effective data fusion model for detecting the risk of transmission line in smart grid. IEEE Internet Things J. 2021, 9, 22256–22266. [Google Scholar] [CrossRef]
  19. Wu, Y.; Sheng, Y.; Guo, N.; Li, F.; Tian, Y.; Su, X. Hybrid Deep Network Based Multi-Source Sensing Data Fusion for FDIA Detection in Smart Grid. In Proceedings of the 2022 Asia Power and Electrical Technology Conference (APET), Shanghai, China, 11–13 November 2022; pp. 310–315. [Google Scholar]
  20. Bai, W.; Zhang, D.; An, C.; Chang, P.; Yang, H. Abnormal Detection Scheme of Substation Equipment based on Intelligent Fusion Terminal. In Proceedings of the 2023 4th Information Communication Technologies Conference (ICTC), Nanjing, China, 17–19 May 2023; pp. 384–389. [Google Scholar]
  21. Weng, C.; Lu, B.; Gu, Q.; Zhao, X. A Novel Multisensor Fusion Transformer and Its Application into Rotating Machinery Fault Diagnosis. IEEE Trans. Instrum. Meas. 2023, 72, 3507512. [Google Scholar] [CrossRef]
  22. Lu, Z.; Liang, L.; Zhu, J.; Zou, W.; Mao, L. Rotating Machinery Fault Diagnosis Under Multiple Working Conditions via A Time Series Transformer Enhanced by Convolutional Neural Network. IEEE Trans. Instrum. Meas. 2023, 72, 3533611. [Google Scholar] [CrossRef]
  23. Wu, H.; Huang, P.; Zhang, M.; Tang, W. CTFNet: CNN-Transformer Fusion Network for Remote Sensing Image Semantic Segmentation. IEEE Geosci. Remote Sens. Lett. 2024, 21, 5000305. [Google Scholar] [CrossRef]
  24. Yan, J.; Wang, Y.; Yang, Z.; Ding, Y.; Wang, J.; Geng, Y. Few-Shot Mechanical Fault Diagnosis for a High-Voltage Circuit Breaker via a Transformer-Convolutional Neural Network and Metric Meta-learning. IEEE Trans. Instrum. Meas. 2023, 72, 3528011. [Google Scholar] [CrossRef]
  25. Vaswani, A.; Shazeer, N.; Parmar, N.; Uszkoreit, J.; Jones, L.; Gomez, A.N.; Kaiser, Ł.; Polosukhin, I. Attention is all you need. Adv. Neural Inf. Process. Syst. 2017, 30, 5998–6008. [Google Scholar]
  26. Feng, Z.; Jin, R.; Luo, C. Transformer State Monitoring based on Transformer Neural Network. Foreign Electron. Meas. Technol. 2023, 42, 145–150. [Google Scholar]
Figure 1. The remote monitoring device is utilized in an intelligent substation.
Processes 12 00824 g001
Figure 2. The intelligent inspection robot is utilized in an intelligent substation.
Processes 12 00824 g002
Figure 3. The platform architecture of the one-key sequential control system.
Processes 12 00824 g003
Figure 4. Three types of data fusion methods. (a) Data-level fusion. (b) Feature-level fusion. (c) Decision-level fusion.
Processes 12 00824 g004
Figure 5. The framework for power transformer condition monitoring and fault diagnosis.
Processes 12 00824 g005
Figure 6. The overall architecture of the proposed PT-TNNet.
Processes 12 00824 g006
Figure 7. The measurement of various parameters in the transformer.
Processes 12 00824 g007
Figure 8. The ablation validation performed on different combinations of input data.
Processes 12 00824 g008
Figure 9. The comparative experiment results of winding temperature via different methods.
Processes 12 00824 g009
Figure 10. The comparative experiment results of oil temperature via different methods.
Processes 12 00824 g010
Figure 11. The comparative experiment results of ambient temperature via different methods.
Processes 12 00824 g011
Table 1. The samples contained within the dataset.
Total Number of Samples: 14,760 Rows × 4 Columns
(Including the First Column, Which Is the Device Time Stamp.)
Number of Valid SamplesNumber of Invalid Samples
Number of Samples
during Normal Operation
Number of Samples
during Fault Occurrence
Winding Temperature14,354242164
Oil Temperature14,335239186
Ambient Temperature14,294246220
Table 2. The statistical results of winding temperature via different methods.
MethodsAccuracy (%)Precision (%)Recall (%)F1 Score (%)
PT-TNNet95.6894.2595.4694.85
SVC85.2881.6190.1485.66
Decision Tree90.4487.1387.8487.48
AdaBoost91.3788.389.1488.71
Random Forest92.4590.3693.2391.77
Extra Trees92.5890.6693.0791.81
Gradient Boosting90.9987.0790.9988.98
Multiple Layer Perceptron86.0681.7489.0185.22
KNeighbors90.3986.6189.0887.82
Logistic Regression85.2680.6587.0583.72
Linear Discriminant Analysis84.0180.3688.6384.29
Table 3. The statistical results of oil temperature via different methods.
MethodsAccuracy (%)Precision (%)Recall (%)F1 Score (%)
PT-TNNet99.9599.8995.4597.61
SVC99.7999.8970.4582.62
Decision Tree99.9597.695.4596.5
AdaBoost99.9597.695.4596.5
Random Forest99.994.9790.8992.88
Extra Trees99.9597.695.4596.5
Gradient Boosting99.9295.2193.1794.17
Multiple Layer Perceptron99.7999.8970.4582.62
KNeighbors99.887.4484.0585.7
Logistic Regression99.7999.8970.4582.62
Linear Discriminant Analysis99.7999.8970.4582.62
Table 4. The statistical results of ambient temperature via different methods.
MethodsAccuracy (%)Precision (%)Recall (%)F1 Score (%)
PT-TNNet97.9696.7294.6595.67
SVC94.7194.5675.3983.89
Decision Tree98.1495.1694.6594.9
AdaBoost98.0394.8794.394.58
Random Forest98.7396.7296.3296.52
Extra Trees98.8397.3196.2396.76
Gradient Boosting98.3695.295.995.54
Multiple Layer Perceptron97.9694.8193.9894.39
KNeighbors95.5789.185.8587.44
Logistic Regression93.5793.4269.7279.84
Linear Discriminant Analysis89.9271.763.7367.48
Table 5. The cross-validation of the winding temperature via different methods.
MethodsCrossValMeansCrossValErrors
PT-TNNet0.9648320.005056
Random Forest0.9338220.005558
Extra Trees0.9382900.004977
Table 6. The cross-validation of the oil temperature via different methods.
MethodsCrossValMeansCrossValErrors
PT-TNNet0.9991420.000682
Random Forest0.9991620.000814
Extra Trees0.9990230.000640
Table 7. The statistical results of three kinds of input data using the PT-TNNet model.
Input DataAccuracy (%)Precision (%)Recall (%)F1 Score (%)
Winding temperature95.6894.2595.4694.85
Oil temperature99.9599.8995.4597.61
Ambient temperature97.9696.7294.6595.67
Disclaimer/Publisher’s Note: The statements, opinions and data contained in all publications are solely those of the individual author(s) and contributor(s) and not of MDPI and/or the editor(s). MDPI and/or the editor(s) disclaim responsibility for any injury to people or property resulting from any ideas, methods, instructions or products referred to in the content.

