
Failure Prediction of Coal Mine Equipment Braking System Based on Digital Twin Models
School of Mechanical and Electrical Engineering, China University of Mining & Technology-Beijing, Beijing 100083, China
*
Author to whom correspondence should be addressed.
Processes 2024, 12(4), 837; https://doi.org/10.3390/pr12040837
Submission received: 12 March 2024
/
Revised: 16 April 2024
/
Accepted: 18 April 2024
/
Published: 20 April 2024
(This article belongs to the Section Process Control and Monitoring)
Abstract
:The primary function of a mine hoist is the transportation of personnel and equipment, serving as a crucial link between underground and surface systems. The proper functioning of key components such as work braking and safety braking is essential for ensuring the safety of both personnel and equipment, thereby playing a critical role in the safe operation of coal mines. As coal mining operations extend to greater depths, they introduce heightened challenges for safe transportation, compounded by increased equipment loss. Consequently, there is a pressing need to enhance safety protocols to safeguard personnel and materials. Traditional maintenance and repair methods, characterized by routine equipment inspections and scheduled downtime, often fall short in addressing emerging issues promptly, leading to production delays and heightened risks for maintenance personnel. This underscores the necessity of adopting predictive maintenance strategies, leveraging digital twin models to anticipate and prevent potential faults in mine hoists. In summary, the implementation of predictive maintenance techniques grounded in digital twin technology represents a proactive and scientifically rigorous approach to ensuring the continued safe operation of mine hoists amidst the evolving challenges of deepening coal mining operations. In this study, we propose the integration of a CNN-LSTM algorithm within a digital twin framework for predicting faults in mine hoist braking systems. Utilizing software such as AMESim 2019 and MATLAB 2016b, we conduct joint simulations of the hoist braking digital twin system. Subsequently, leveraging the simulation model, we establish a fault diagnosis platform for the hoist braking system. Finally, employing the CNN-LSTM network model, we forecast failures in the mine hoist braking system. Experimental findings demonstrate the effectiveness of our proposed algorithm, achieving a prediction accuracy of 95.35%. Comparative analysis against alternative algorithms confirms the superior performance of our approach.
1. Introduction
The concept of the digital twin, pioneered by Michael Grieves during a product lifecycle management course at the University of Michigan, has undergone significant evolution since its inception. Initially confined to military and aerospace applications, digital twins are now experiencing a surge in development across various sectors [1]. Drawing inspiration from their successful implementation in aerospace, the manufacturing industry has embraced digital twin technology with enthusiasm, deploying it in diverse applications such as computer numerically controlled machine tools, industrial robotics, and semiconductor manufacturing [2]. As mining operations become increasingly sophisticated, the integration of digital twins is driving advancements in mine intelligence. Notably, intelligent maintenance protocols for coal mine electromechanical equipment represent a pivotal component of this intelligence. As diagnostic and predictive maintenance technologies, including condition monitoring and predictive maintenance, continue to mature, the demand for effective equipment overhauls escalates correspondingly [3,4]. Consequently, digital twin technology, characterized by its real-time synchronization, precise mapping, and high fidelity, has emerged as a focal point of research in equipment failure prevention. By facilitating seamless interaction and integration between the physical and digital realms [5,6], digital twins have garnered significant attention and interest within academic circles.
To enable intelligent prediction, the proposition of establishing a digital twin model serves as a foundation for constructing a fault monitoring and warning system. By comparing measured data with twin data, the model’s high correlation with reality is verified [7]. This process further elucidates the digital twin’s framework structure, system characteristics, and its varied application scenarios such as aerospace, manufacturing, complex measurement and control systems, communication drives, and fusion assemblies [8,9,10,11]. These applications facilitate precise decision-making through the fusion of virtual and physical spaces [12]. Digital twin technology stands as a cornerstone in achieving information–physical system integration, featuring real-time device communication, virtual space creation, and interactive virtual reality experiences. This technology provides invaluable guidance for monitoring and evaluating equipment in manufacturing and experimental contexts [13]. However, challenges persist due to the actual system’s complexity, data acquisition hurdles, and the current limitations of modeling accuracy [14]. These shortcomings manifest in the model’s limited generalization capabilities during migration and its tendency to mask weak fault characteristics with stronger ones, leading to incomplete fault information extraction [15]. Moreover, the intricate nature of braking system structures, encompassing electrical, hydraulic, and other components, significantly influences fault diagnosis [16,17,18]. Considering the correlation between the fault samples and the attributes of each sample data, the improved algorithm is used to train the sample data to obtain the decision tree classification model. Finally, the fault samples of the hoist braking system are trained to obtain the algorithm model, which in turn generates the fault diagnosis rules. A new approach to address the challenge of determining the state of the braking system by classifying the data [19] is to construct a human digital twin [20]. By investigating deep reinforcement learning and its application in intelligent decision-making models, digital twins are constructed to improve intelligent decision-making in their manufacturing and processing [21]. The rapid development of deep learning has also been applied to computer engineering, mechanical engineering, civil engineering, power grid engineering, medicine [22,23,24,25,26,27,28] and other fields. High-fidelity and evolvable virtual models will be the key to the implementation of digital twins in the manufacturing field [29].
These aforementioned articles have conducted pertinent research on both braking systems and digital twin technology. However, the digital twin model under study exhibits limited flexibility, encountering issues such as system complexity and practical application challenges. Addressing these technological dilemmas, this paper employs software tools like AMESim and MATLAB to conduct a collaborative simulation of the hoisting mechanism braking system. Subsequently, it constructs a fault diagnosis platform for the said system based on the simulation model. Moreover, leveraging Convolutional Neural Networks (CNNs), renowned for their superior feature extraction capabilities, and Long Short-Term Memory Neural Networks (LSTMs), known for their adept memory retention, a CNN-LSTM approach is adopted. This amalgamation effectively discerns fault diagnosis features within the hoisting mechanism braking system, enhancing diagnostic efficiency and simplifying system complexities. Lastly, the fusion of virtual and real data significantly bolsters the accuracy of brake system fault prediction. The overall diagnosis process of this paper is shown in Figure 1.
2. Theoretical Foundation
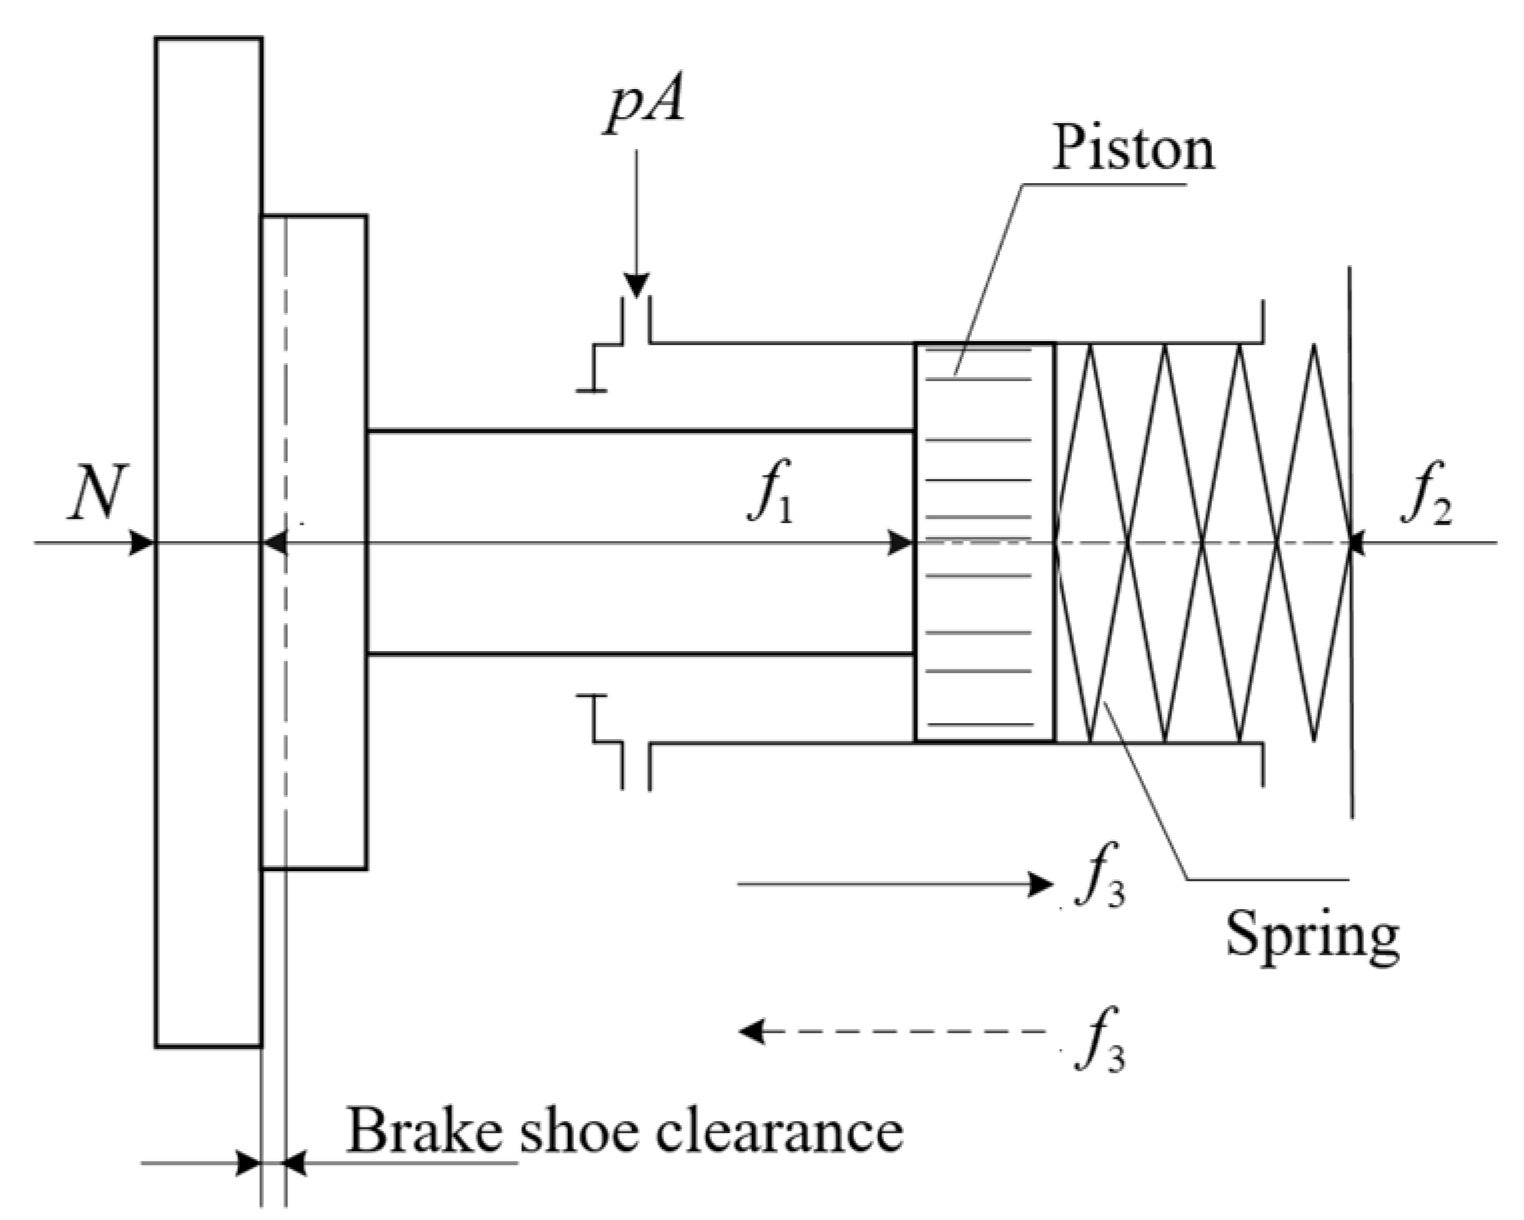
2.1. Analysis of Forces on Disc Brakes
Adopting CITIC (CHN)Heavy Industry JKMD4.5 × 4 mine hoist E141A hydraulic station. The force analysis of a disk brake piston in motion is shown in Figure 2. The piston is pressurized by a disc spring . Pressure generated by the oil, ; frictional resistance during motion, ; and the counterforce that gives positive pressure to the brake disk, .
Braking force: when the spring force is greater than the sum of the pressure of the hydraulic fluid on the piston and the friction force, a positive pressure is generated between the brake shoe and the brake disc , the value of which ignores the deformation of the brake shoe and the brake disc:
The plus or minus sign in the formula indicates whether the direction of piston movement is the opposite or the same as the direction of spring force, and δ is the brake opening clearance.
2.2. Equation of State for Disc Brakes
According to the working principle of the brake, the movement of the brake can be divided into the opening process, closing process, critical contact, and braking process.
The movement of the brake starts from the maximum opening clearance when braking, and the movement direction of the piston during the closing process is positive, ignoring the elastic deformation of the brake tile and brake disc, so the equation of motion of the piston is:
Equation of state for the operation of the brake (3):
The variables used in this equation are: for brake piston displacement, for brake piston speed, for the maximum compression of the disc spring, . for the mass of the brake piston and brake tile, for brake spring stiffness, for the coefficient of viscous friction of the piston movement, for positive pressure between the brake tile and the brake disc, and for the effective action area of the piston cavity.
2.3. Modelling Analysis of Constant Deceleration Braking System
Based on the principle of constant deceleration braking, the control principle block diagram for the hoist braking system is shown in Figure 3.
2.4. Proportional Directional Valve Modelling
The transfer function for the voltage displacement of the proportional directional valve is (4), where represents the current of the electromagnetic proportional directional valve, represents the displacement gain, represents the intrinsic frequency of the electromagnetic proportional directional valve, and E represents the dimensionless damping ratio of the electromagnetic proportional directional valve.
2.5. Proportional Directional Valve Controlled Brake Modelling
(1) The linearized flow equation for the solenoid proportional directional valve is (5), where is the load flow rate of the solenoid proportional directional valve, is the spool displacement of the solenoid proportional directional valve, is the solenoid proportional directional valve flow–displacement gain, is the solenoid proportional directional valve flow–pressure coefficient, and is the load pressure .
(2) The force equation of the brake piston is (6), where is the effective working area of the piston, is the pressure in the hydraulic chamber, is the mass of the working part driven by the piston, is the piston displacement, is the pre-compressed length of the spring, is the viscous damping coefficient, and is the spring stiffness
(3) The flow continuity equation in the hydraulic cylinder of the brake is (7), where is the piston leakage coefficient, is the volume of oil in the working chamber of the hydraulic cylinder and the inlet line, and is the bulk modulus of the oil. Taking increments to Equations (5)–(7) and performing the Laplace transform yields the following equations:
The block diagram of the proportional valve brake transfer function is shown in Figure 4 from Equations (8)–(10).
According to the algorithm of the block diagram, the transfer function with proportional directional valve spool displacement as input and brake oil-filled chamber pressure as output is (11)
where is the total flow pressure coefficient. .
Since the system satisfies the three conditions, , and , Equation (11) can thus be simplified as:
where is the inertia link turning frequency, ; is the intrinsic frequency of the valve control cylinder, ; is the hydraulic spring stiffness of the hydraulic cylinder, ; and is the damping ratio of the valve control cylinder. .
Modeling of hoist deceleration:
In transmitter and amplifier modeling, with brake pressure as input and pressure comparator feedback current as output, the transfer function is a proportional link.
An amplifier with deceleration deviation as input and control current as output can be considered a proportional link.
An amplifier that takes current deviation as input and controls current output can be considered a proportional link.
3. Brake System Stuck Cylinder Simulation
3.1. Model Building
The overall framework of the joint simulation is to establish the digital twin physical model. The modeling process adopts a top-down approach, commencing from the equipment’s composition and its motion laws. For instance, the braking system is segmented into disc brake, hydraulic station, brake disc, and other components. Field visits to the mine hoist test bench yield data on its design dimensions and model degradation over time, informing the physical modeling process. CAD drawings guide the creation of the digital model, with meticulous attention paid to setting up motion coordinate systems and applying motion subroutines to components. The assembly process steps are mapped out, and material types are assigned to ensure the model’s stiffness and strength, preventing excessive deformation during simulation due to slewing or collisions. Forces and moments are applied to generate a cohesive joint model, with considerations for component movement and wear derived from field data. Motion constraints are then imposed to produce the final digital twin model of the hoist.
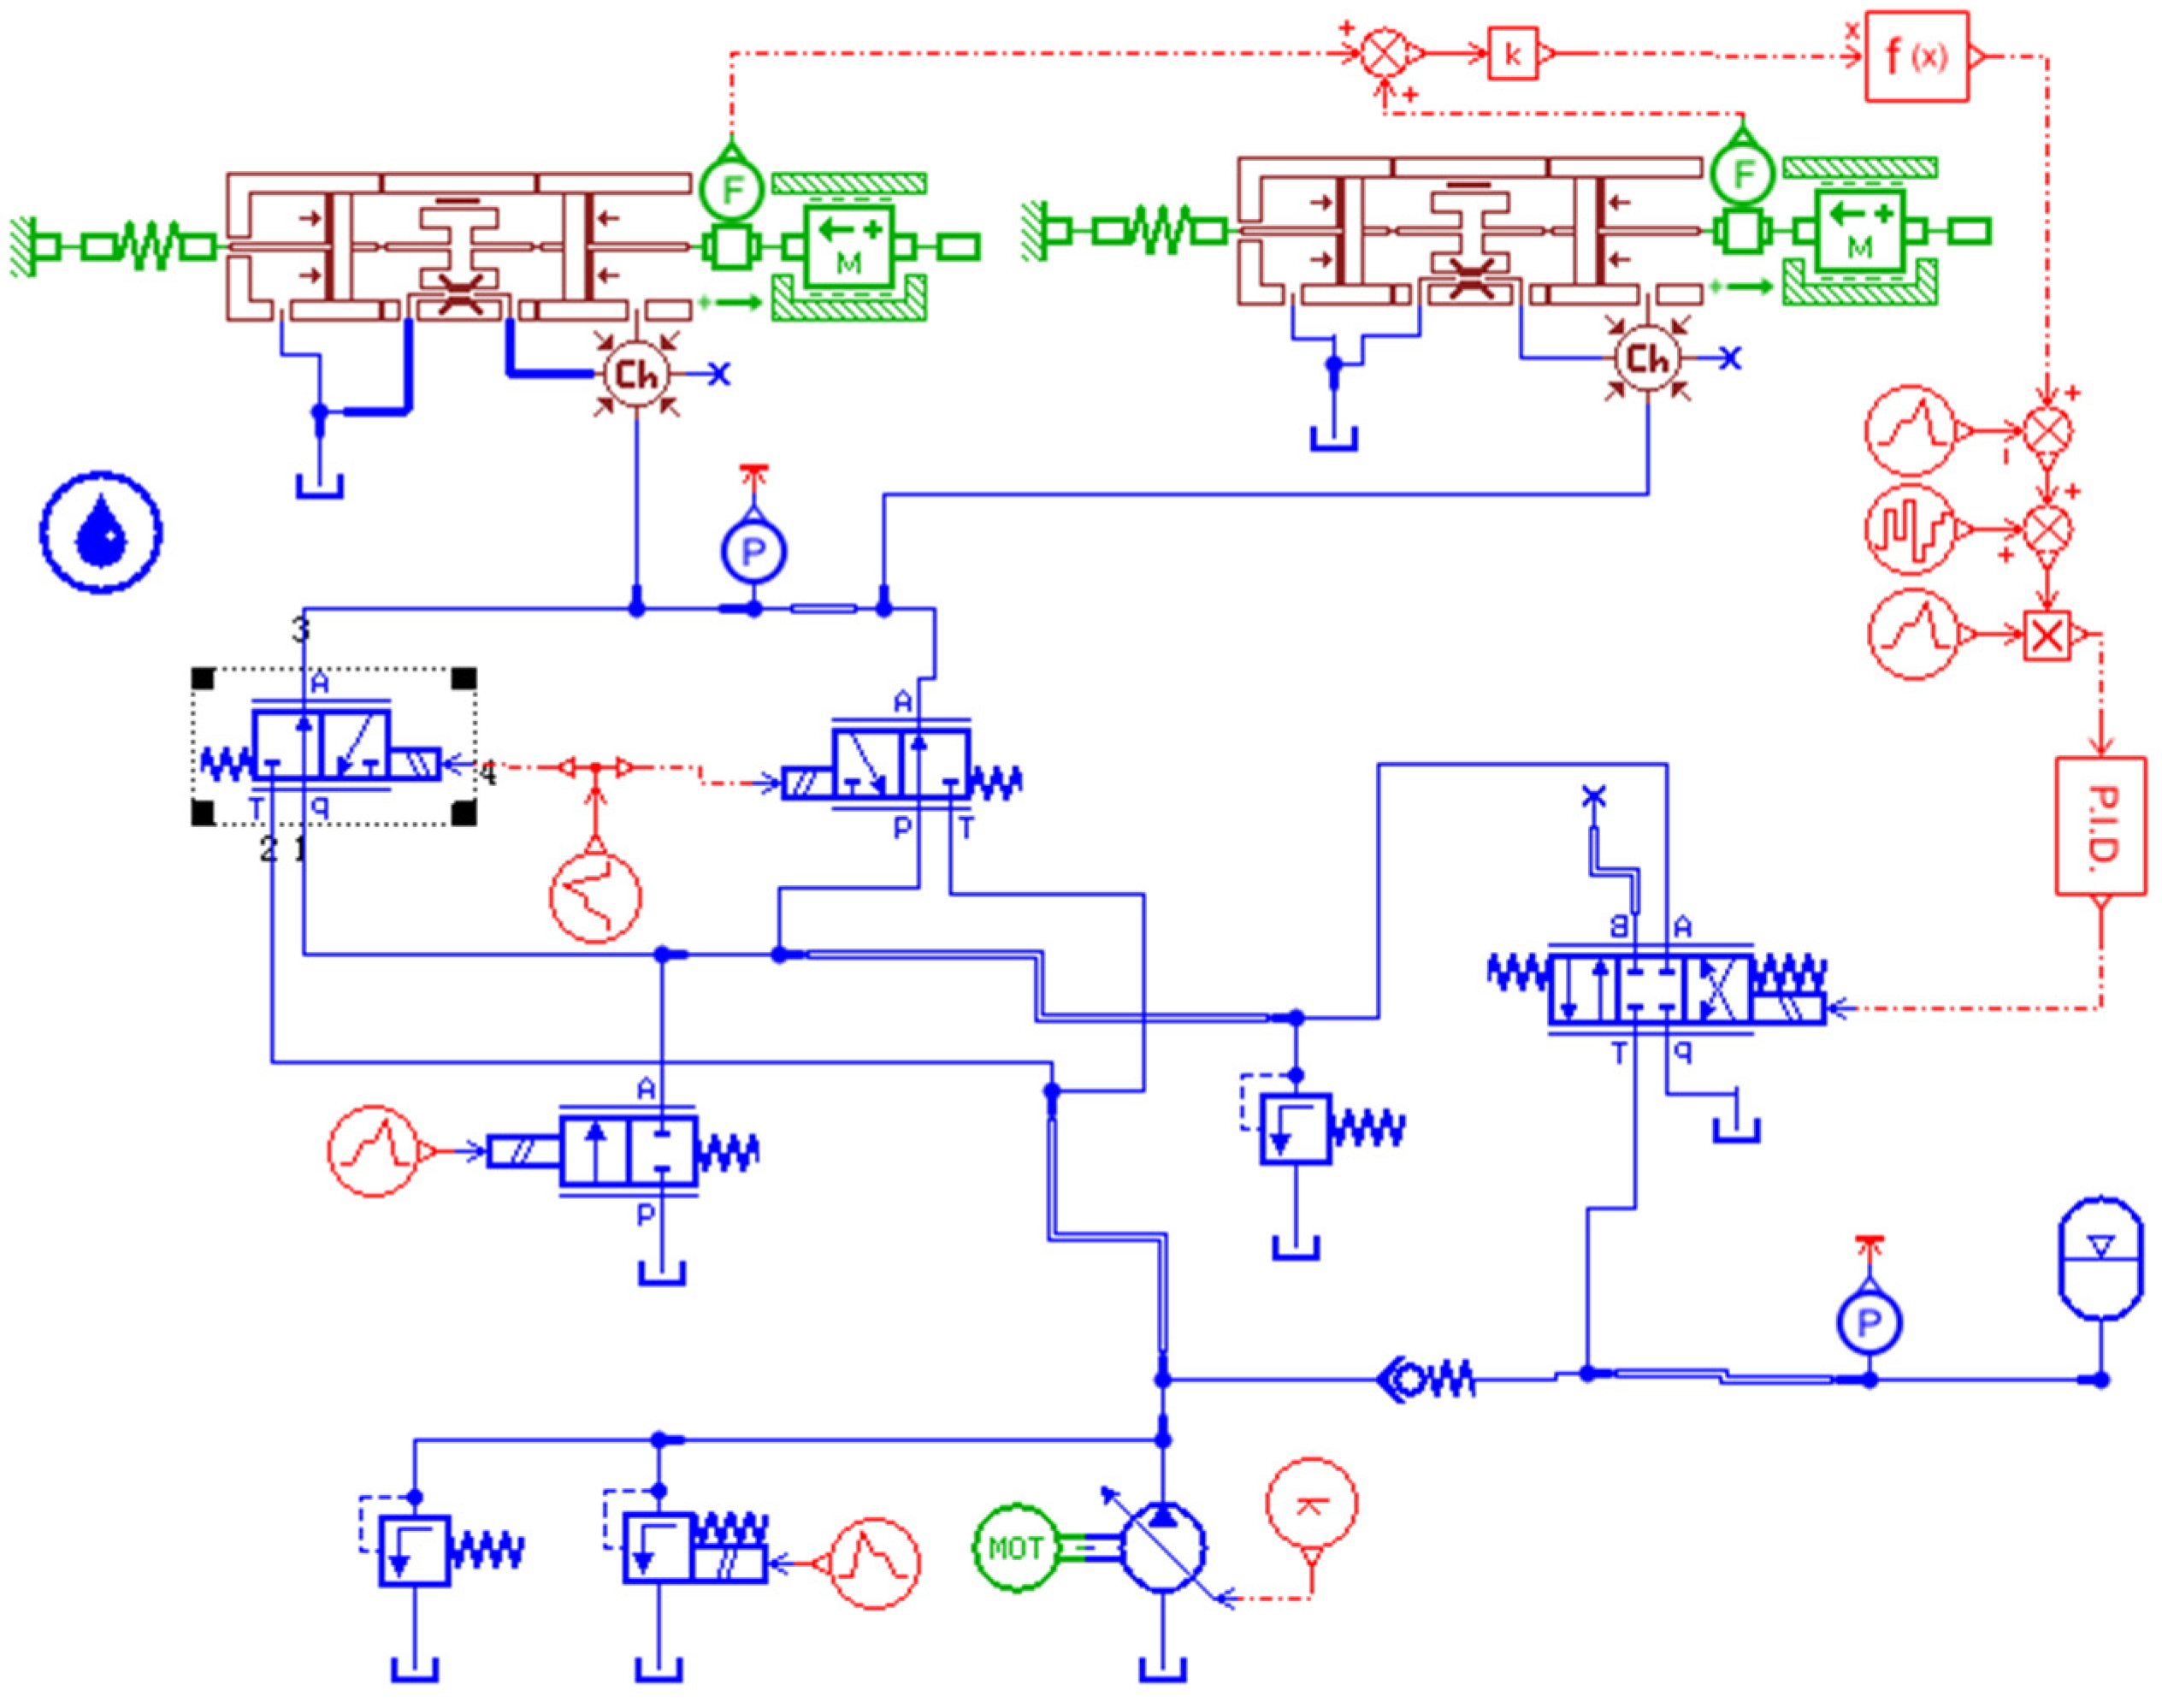
In the construction of the joint simulation environment, first of all, note that the AMESim corresponding version of the software version can support MATLAB, paying attention to the establishment of the two software interfaces as well as setting the corresponding user environment variables. Set the system environment variables in the joint simulation host. In AMESim, the operation process does not exist in the wire rope on the drum friction torque changes, so the hoist braking speed reduction is proportional to the given braking speed reduction. The model of the constant deceleration braking system in AMESim is shown in Figure 5.
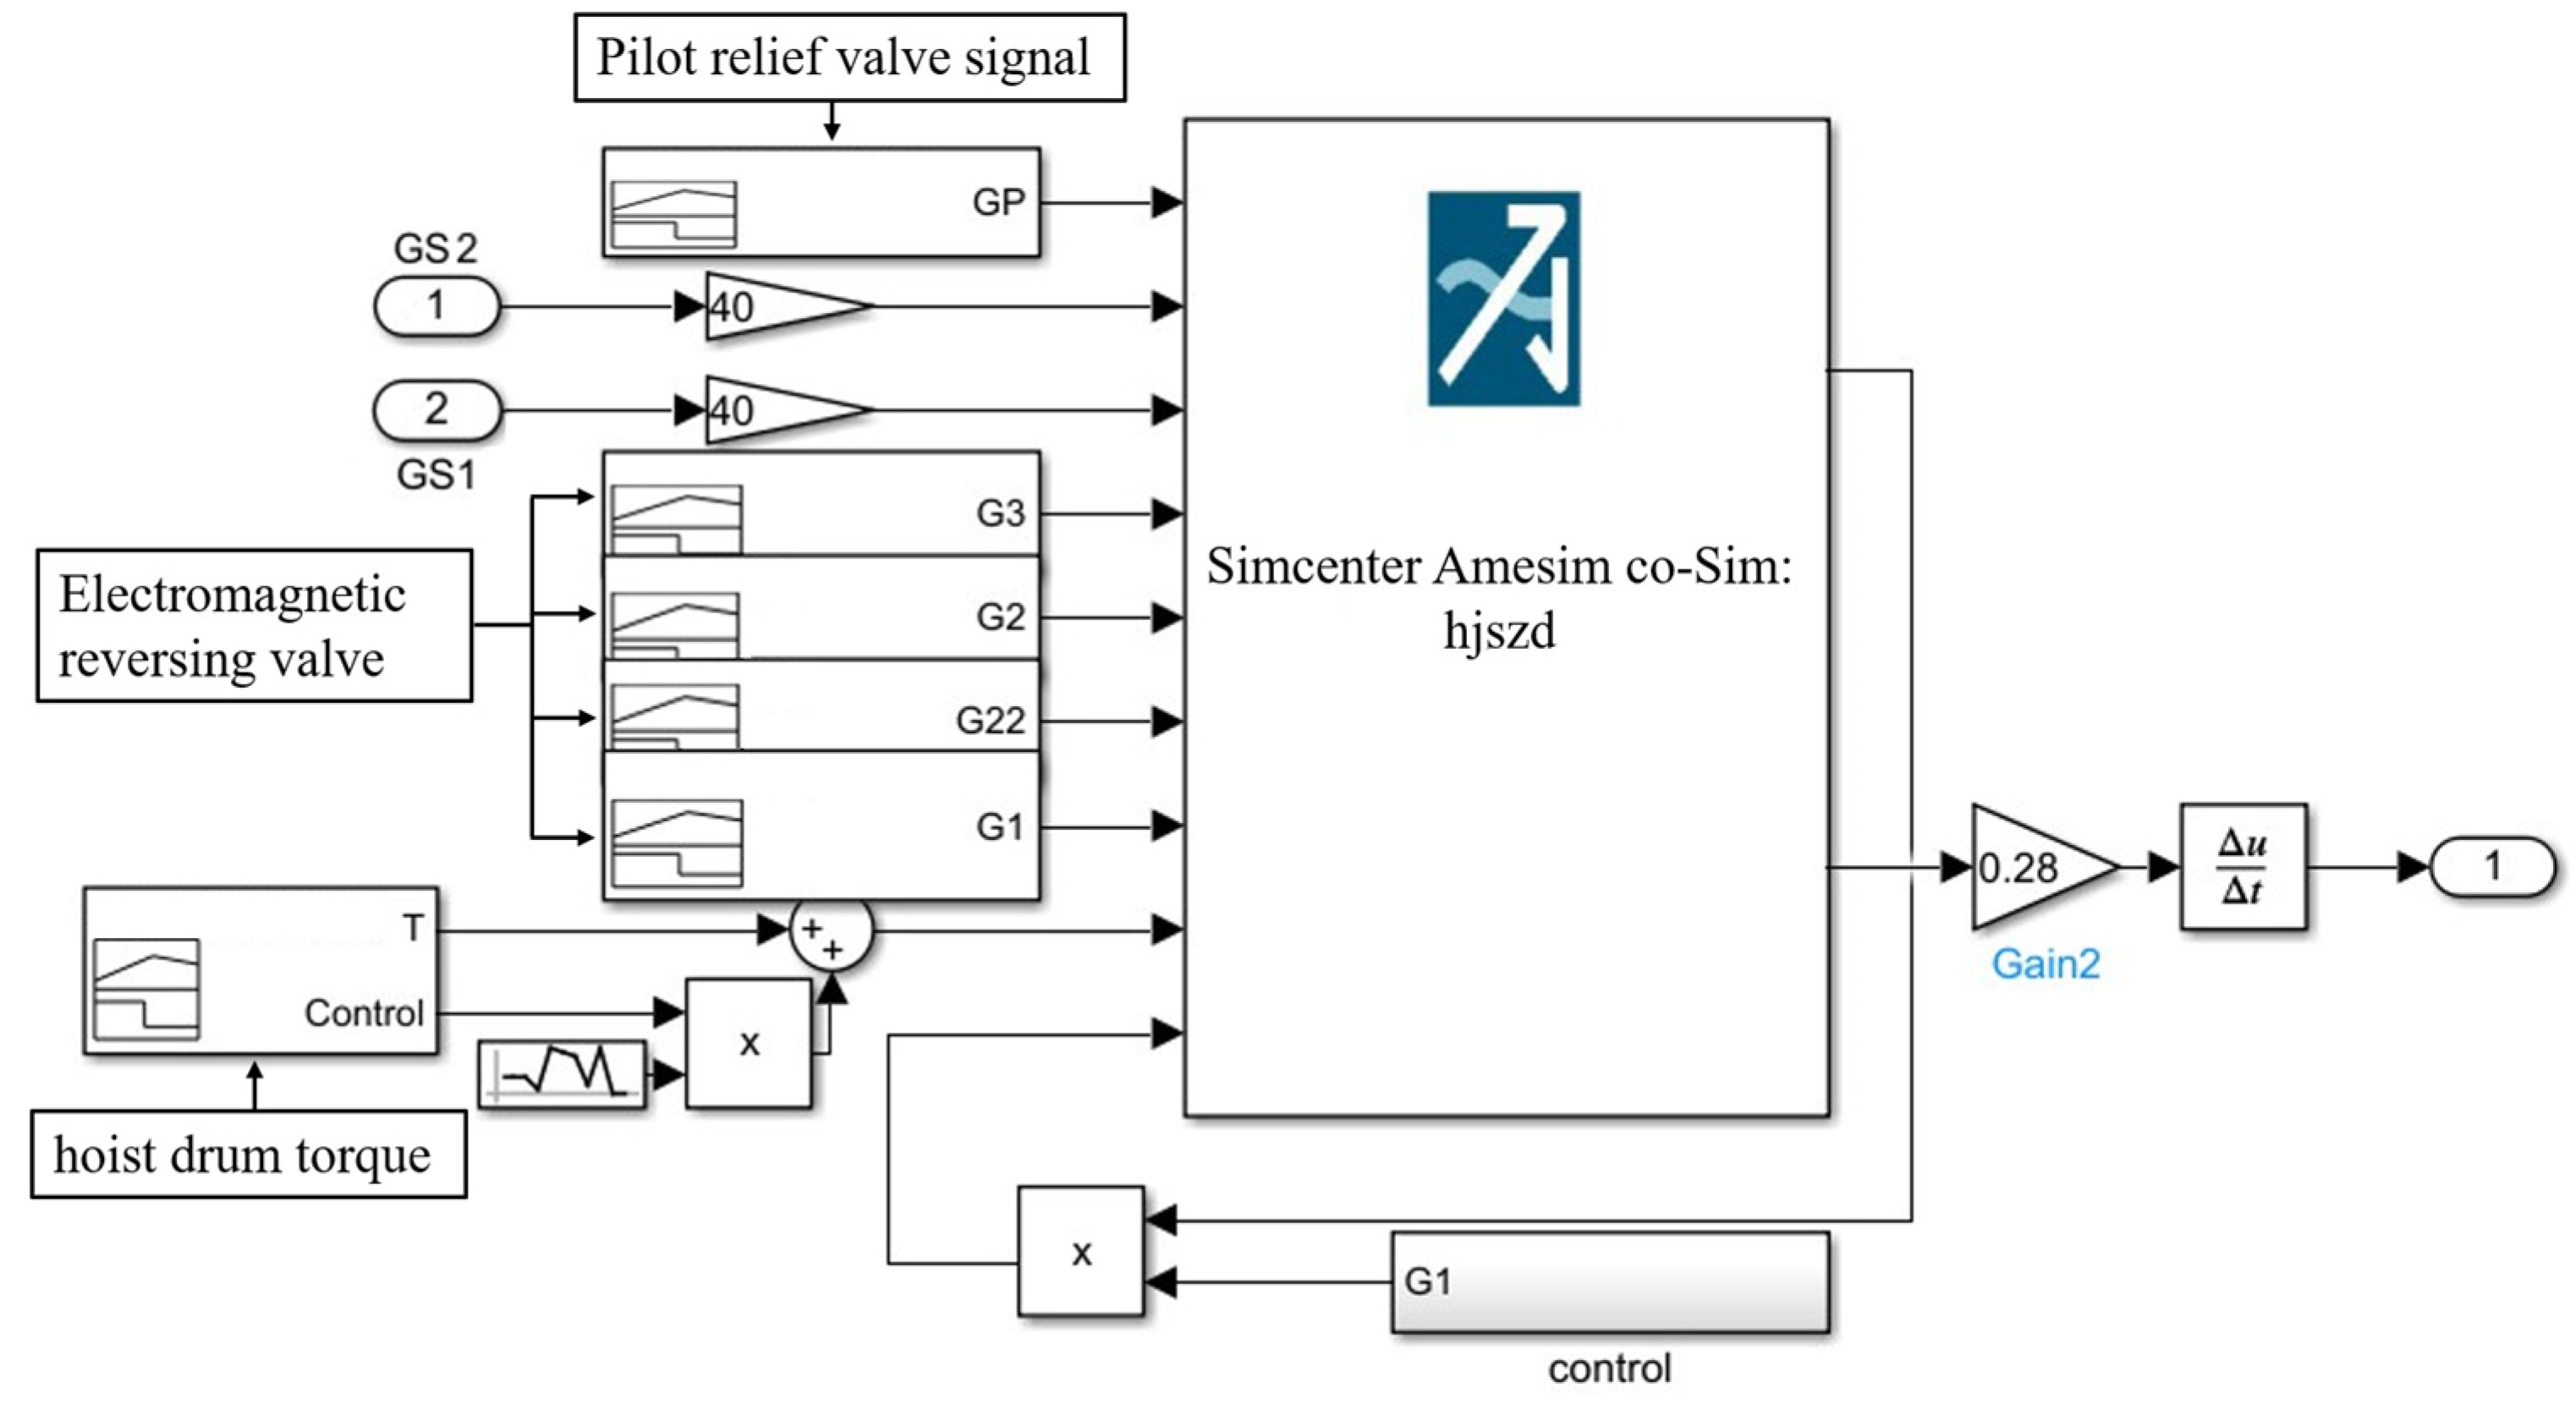
During the joint simulation stage, the hydraulic valve control is managed by the Signal Builder module in Simulink. The joint simulation module encapsulates the signal interface between the electro-hydraulic valve and the relief valve as the input, and the braking deceleration speed of the hoist drum as the output. Figure 6 illustrates the control signals and the interface module in Simulink.
Figure 7 illustrates the AMESim–Simulink co-simulation program, which outputs the given deceleration and drum deceleration to the workspace using the simout module.
3.2. Simulation Results
In order to detect the change in deceleration in the braking process, the relationship between the pressure and deceleration of the braking system is finally obtained by measuring the disc brake oil pressure and calculating the angular acceleration of the drum. The simulation settings of the hoist are shown in Table 1, and the simulation results are shown in Figure 8.
Simulation results analysis: the initial speed of the equipment running at constant deceleration braking is 5.1 m/s−2, and then it decreases to 1.4 m/s−2; the initial stage of constant deceleration braking has a slow change in speed, and then it decreases according to a certain deceleration. The reason is that there is a process of brake closing, applying the gate, and regulating the pressure during the application of the gate, during which the deceleration of the elevator rises to the set deceleration, and then the deceleration is maintained at a constant level, and as the brake oil chamber pressure decreases, the brake goes through the process of closing and applying the gate, and then it tends to stabilize for a period of time. The brake oil cavity pressure decreases, the brake undergoes the process of closing and applying the brake, the brake deceleration rises from 1.4 m/s−2 to about 3.7 m/s−2, and then tends to be stable for a period of time; the brake system pressure obtained by the simulation decreases from the opening pressure of 11.5 MPa to 3.9 MPa, and then fluctuates in the interval, and then tends to be stable, and the results verify the reliability of the simulation platform.
4. Experimental Validation
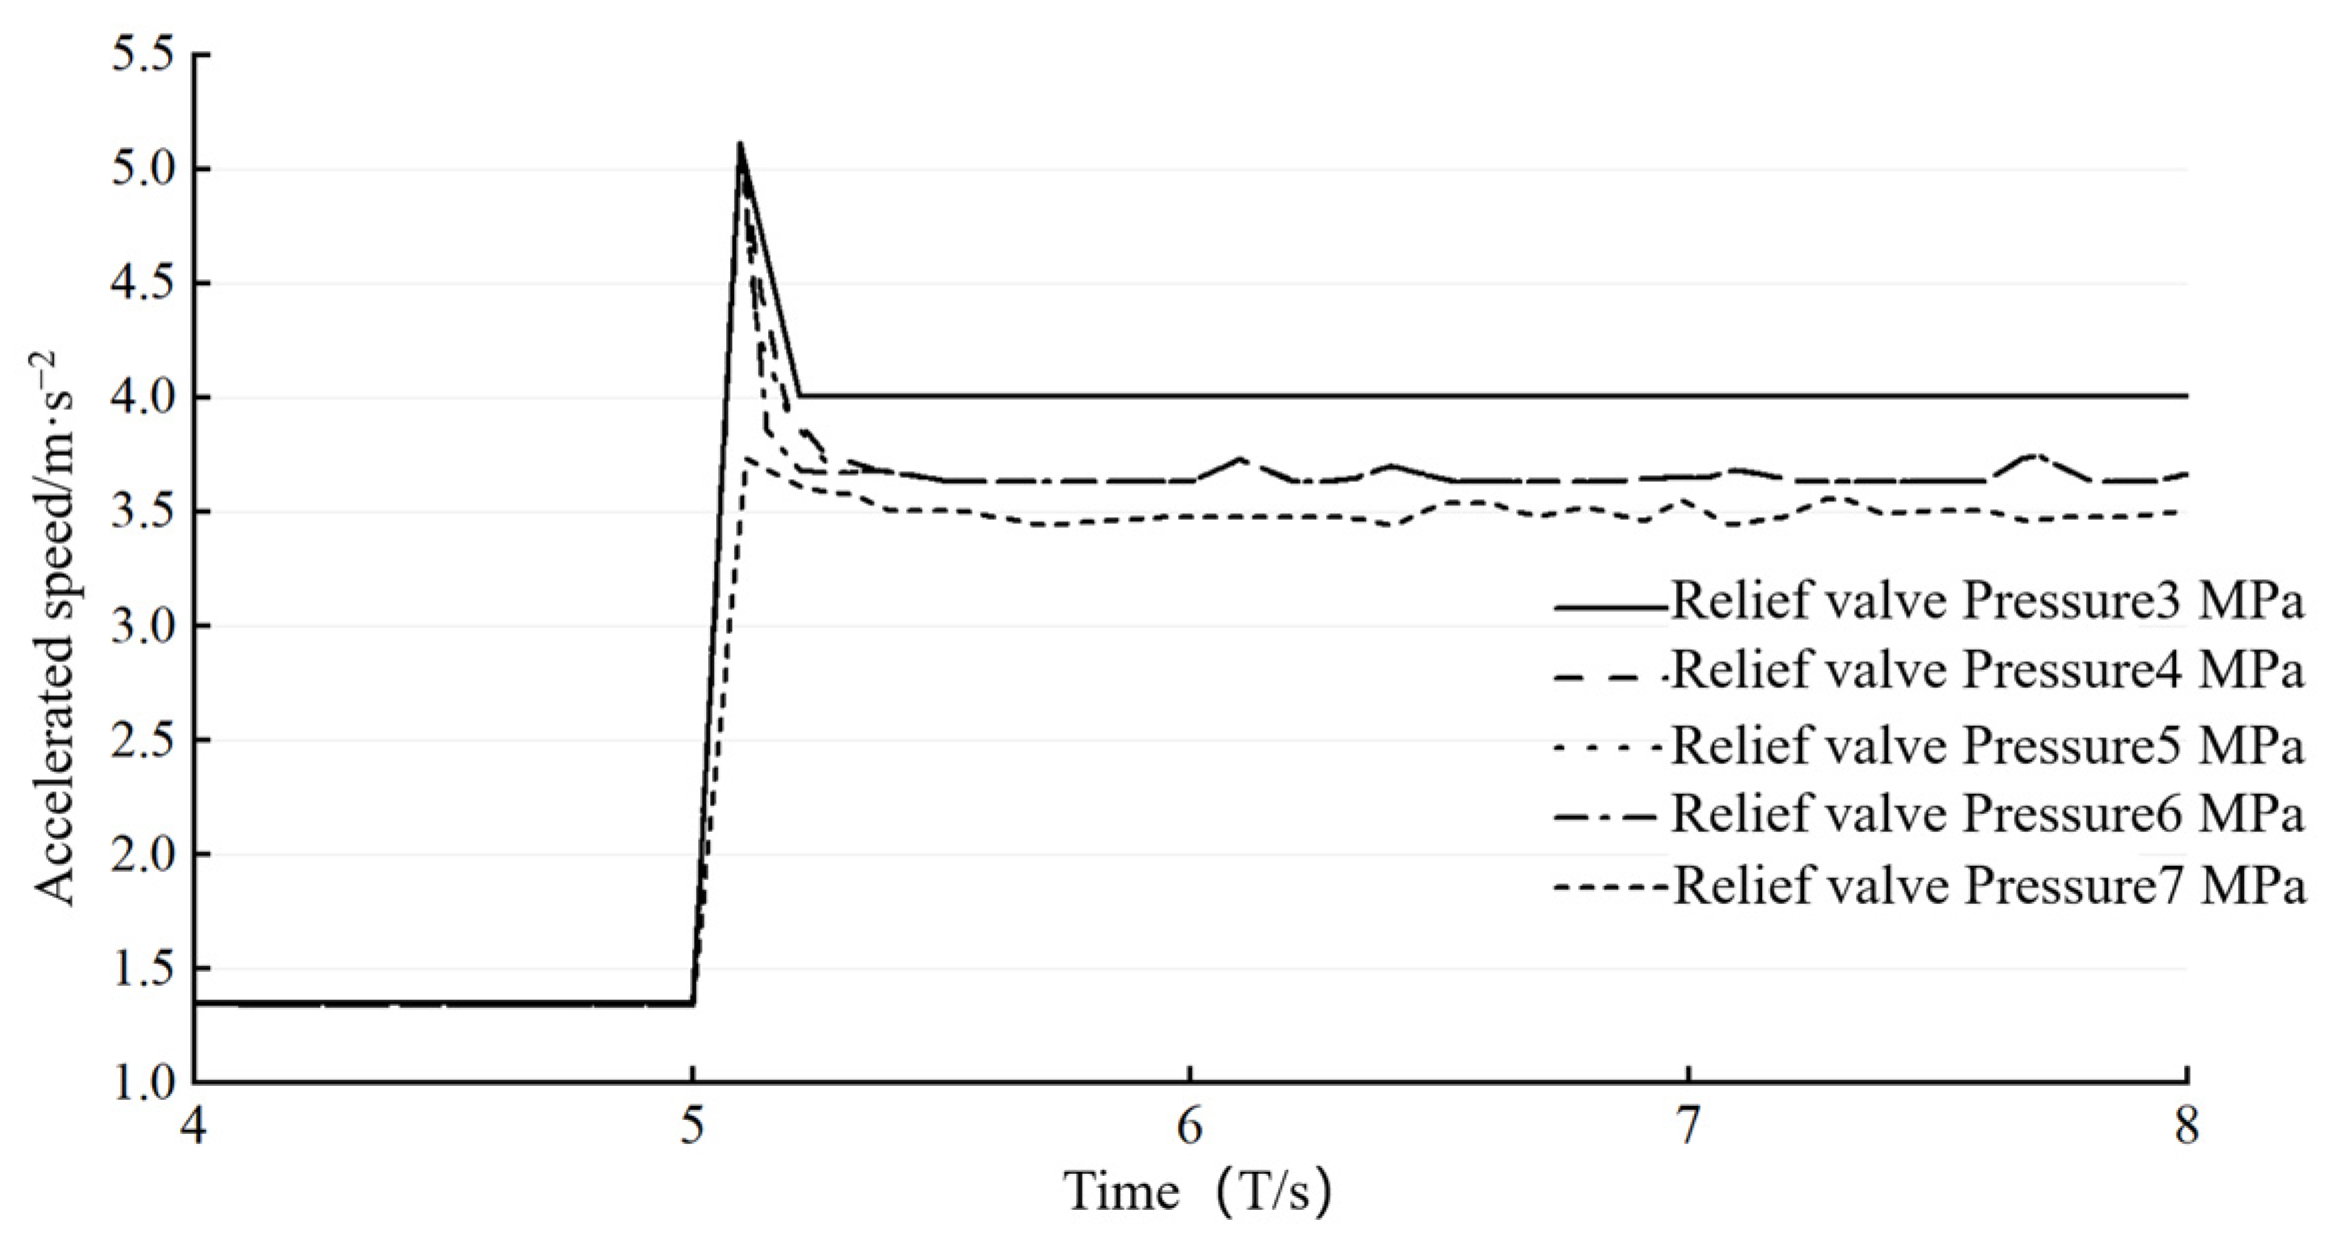
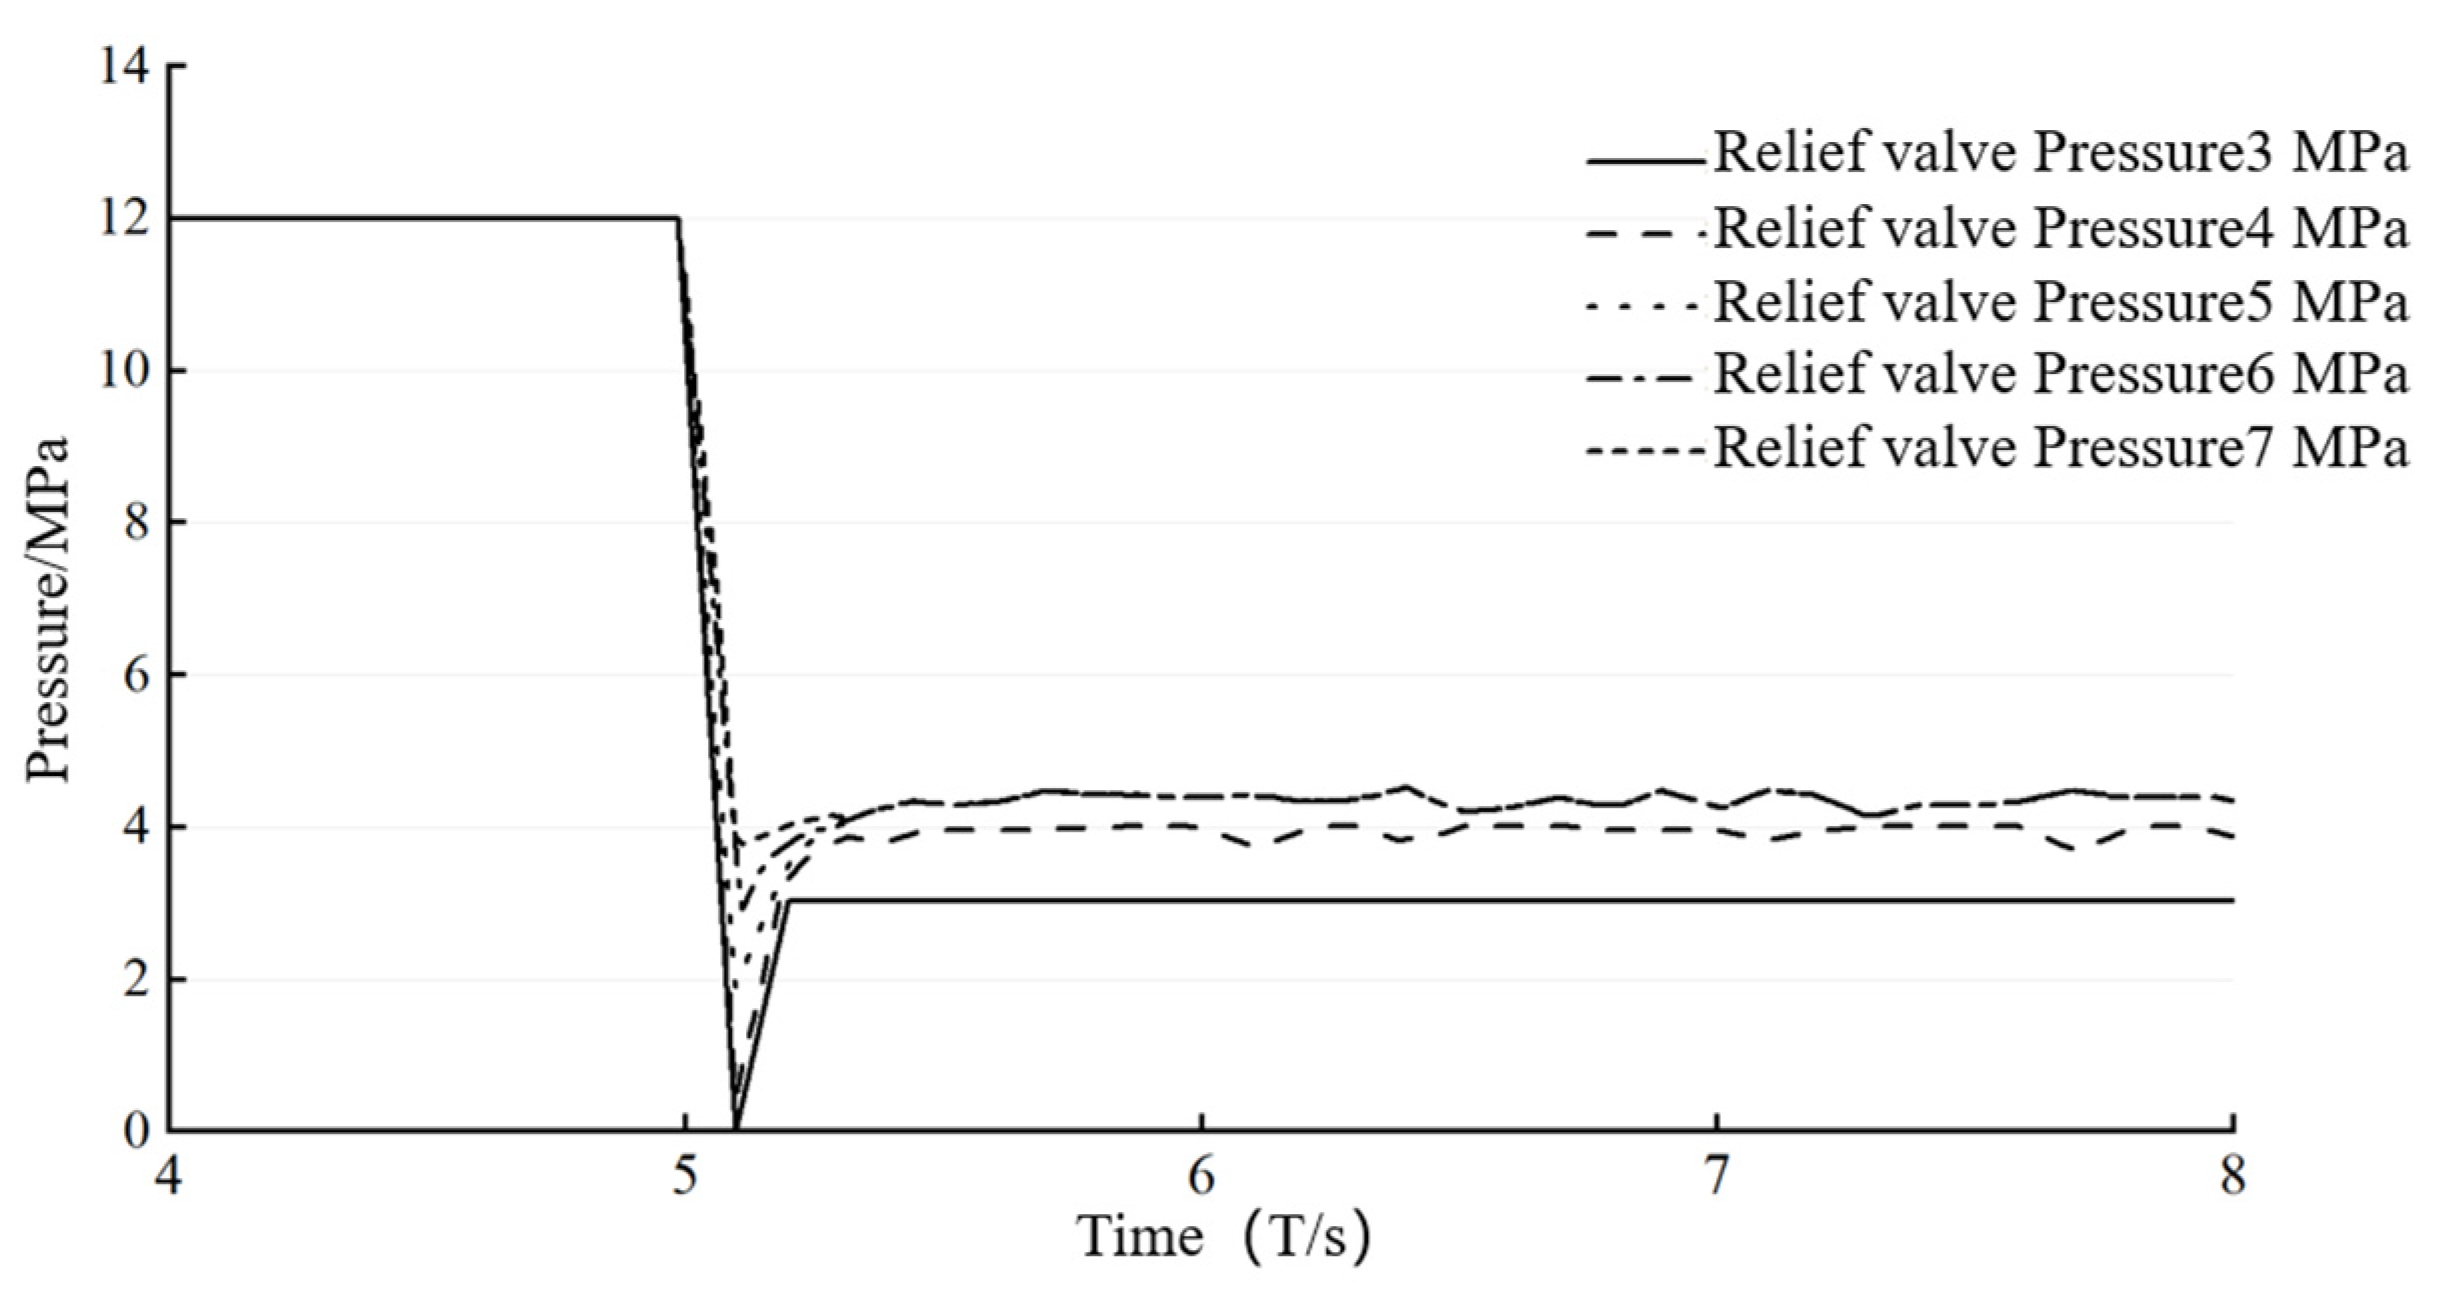
The sensor design for the hoist experimental platform primarily focuses on monitoring the clearance between the brake discs, necessitating placement on the end cover of the disc brake. Pressure sensors are strategically installed within the outlet oil circuit of the hydraulic station and securely fastened using threaded holes. Additionally, the pressure sensor for the accumulator is securely sealed with an additional sealing ring within the inlet oil circuit block. The experimental process involves gathering data from five sets of acceleration times during braking deceleration, along with five sets of data from normal safe braking scenarios and instances where the pressure of the relief valve gradually decreases. These data sets are illustrated in Figure 9 and Figure 10. Figure 9 depicts the test results showcasing the performance of the relief valve during braking deceleration, while Figure 10 exhibits the test results focusing on the relief valve performance and the pressure within the braking system.
By adjusting the pressure of the relief valve, we can simulate the decline in its performance and its ability to stabilize pressure. In this study, we tested the relief valve under varying conditions within a constant deceleration braking system. Initially, the relief valve operated at a pressure of 7 MPa. Subsequently, we systematically reduced the relief valve pressure. As shown in Figure 9, as the relief valve pressure decreases, the rate of deceleration in constant motion also decreases. Simultaneously, as depicted in Figure 10, the reduced pressure corresponds to a decrease in safety braking effectiveness.
In this paper, in AMEsim, by changing the pressure of the relief valve, the simulation is achieved to produce a decline in the performance of the relief valve. The pressure stabilization capability degradation simulation guides the basis of the experiments, and the experimental results are shown in Figure 10. As shown in Figure 10, the relief valve braking acceleration rose from 1.4 ms−2 to 5.1 ms−2 and finally stabilized at about 4.0 ms−2. Not only that, but the braking system pressure dropped from 12 MPa to 0 MPa and then rose to 3 MPa to stabilize, which corresponds to the simulation results, and both of them were mutually verified with a certain degree of reliability.
5. Brake System Failure Prediction Based on CNN-LSTM Algorithm
5.1. Principles of CNN-LSTM
Since the data obtained from the dynamic system of the lifting mechanism follow a periodic behavioral pattern, it is appropriate to apply the time series method for preprocessing. A CNN is a type of multilayered neural network that utilizes a feed-forward architecture. It optimizes the size of the convolution kernel, the number of kernels, and the operation step using the gradient descent method of bi-directional propagation. The network’s processing of signals involves two main steps. Firstly, it performs an initial screening of the incoming data, reducing noise signals by limiting their magnitude. Secondly, it extracts feature signals from the preprocessed data. The second step involves extracting feature signals, which involves automatically condensing the feature parameters that are appropriate for use as training data, ultimately resulting in the completion of fault prediction.
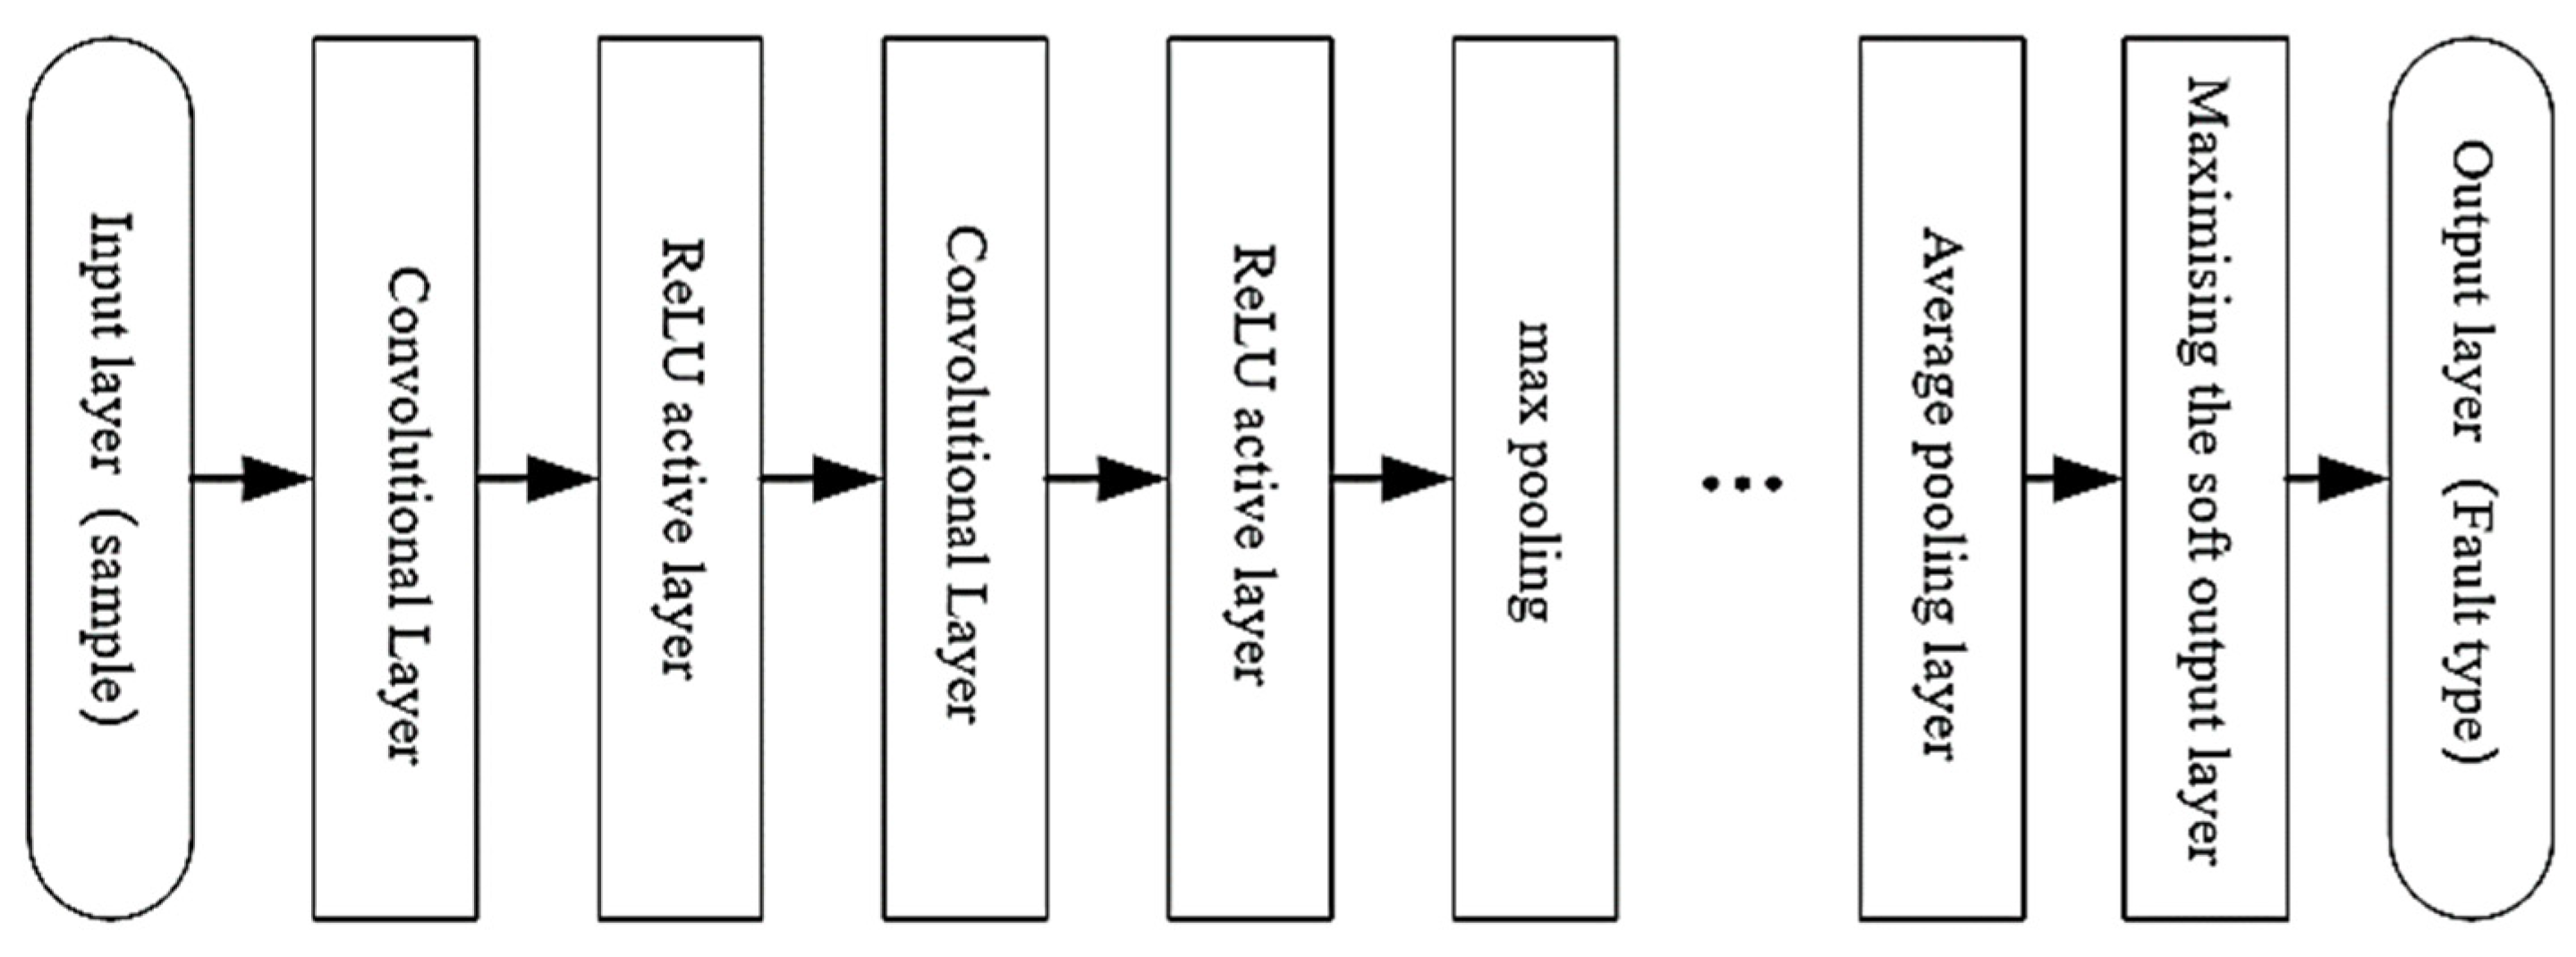
In this paper, when constructing the convolutional neural network, based on its main data for time series data, a one-dimensional convolutional neural network model is used. Set each convolutional layer after selecting the appropriate nonlinear activation function, then process them through the average pooling layer, maximize the soft output layer, and finally output the fault type through the fully connected layer. The convolutional neural network composition is shown in Figure 11.
In the data selection session, intercept a fixed period for the sample set, selecting sampling points as the sample set, and then assign the training set, sample set, and validation set with more randomness (where and are positive integers).
Recurrent neural networks (RNNs) indeed exhibit inherent limitations, including the rapid vanishing or explosion of gradients, often attributed to the exponential growth in multiplicative computations. In contrast, long short-term memory networks (LSTMs), serving as an enhanced variant of convolutional networks, have demonstrated efficacy, particularly in fault recognition domains. LSTMs offer accelerated computational speeds, effectively addressing issues related to excessively high gradients and gradient vanishing. Consequently, this study leverages a hybrid architecture combining LSTM and convolutional neural network (CNN) methodologies for predicting brake system faults. The operational workflow of the LSTM unit, as depicted in Figure 12, involves the computation of input, output, and forget gates. Leveraging the state from the previous time step alongside the current input, these gates regulate information flow while concurrently updating the memory unit. The amalgamation of input and forget gate states with the memory unit facilitates the transfer of internal states to the external environment. This approach enhances fault prediction accuracy by dynamically adjusting the network’s internal states, thereby augmenting the model’s adaptability and performance.
Long short-term memory networks are designed to address challenges such as exploding and vanishing gradients, which commonly affect the training of traditional neural networks. LSTMs facilitate the retention and integration of information over extended periods, making them particularly suited for processing time series data. In practical applications, LSTMs have been effectively employed for tasks like predictive maintenance, where they can leverage transfer learning techniques to adapt pre-trained models to new domains, such as monitoring the performance of motorized systems in mining operations. LSTMs incorporate sophisticated mechanisms such as gating units—which regulate information flow—and memory cells, which store historical data critical for understanding temporal dependencies. These features enable the models to update their parameters more effectively through backpropagation over time. Despite their capabilities, the inherent complexity of LSTMs often requires significant computational resources. They are composed of multiple layers with numerous parameters, necessitating extensive training datasets to prevent overfitting. Additionally, LSTMs maintain a sequence-dependent computational process, which challenges their parallelization and can slow down training, particularly on large datasets. Each parameter update within the network takes into account not only the current input but also the previously accumulated state, which is crucial for its memory function but computationally demanding. Thus, while LSTMs offer substantial advantages in handling long-term dependencies, they also come with computational trade-offs that can impact their efficiency and scalability.
The LSTM networks devised in this study create a sequential constructor by specifying the desired number of neurons, setting the number of iterations, and defining the data size. The size of the validation set is determined by the segmentation training test validation procedure. To mitigate overfitting, incorporate a dropout layer to regulate the weights and choose a non-linear activation function. After performing a comparison, choose the optimizer and the loss function. Utilize the flattening layer to expand the data. Specify the number of outputs for the fully connected layer and employ the soft-max function to generate the recognition results.
Assuming that the features from the operation of the hoist are and these features are labeled as , they are divided into batches by the number of sampling points mentioned above, and the features and labels of each batch are:
The output is the labels of different feature batches, and each time, the result is the result of all the previous feature training, as shown in Figure 13 for the feature labels.
This work presents a combination of CNN and LSTM algorithms to leverage the benefits of each for fault identification. The CNN utilizes the convolutional kernel to extract features from the sample, whereas the LSTM is capable of accessing the long-term aspects of these features. By incorporating Rectified Linear Unit (ReLU) activation functions between the convolutional and pooling layers, the convergence of the model is expedited. The model utilizes fused features from a convolutional neural network to describe the data. These data are then passed through a LSTMs. The data are reconstructed into inputs that can be accepted by the LSTM. They are then screened for retention and abandonment using the Sig mod activation function. This function selects important data to be preserved and forgettable data to be discarded. The preserved data are continually updated by obtaining data from the input gate. With the assistance of the information carried by the output gate, the updated data are transferred to the next time step. The overall network structure is depicted in Figure 14.
5.2. Principles of CNN-LSTM
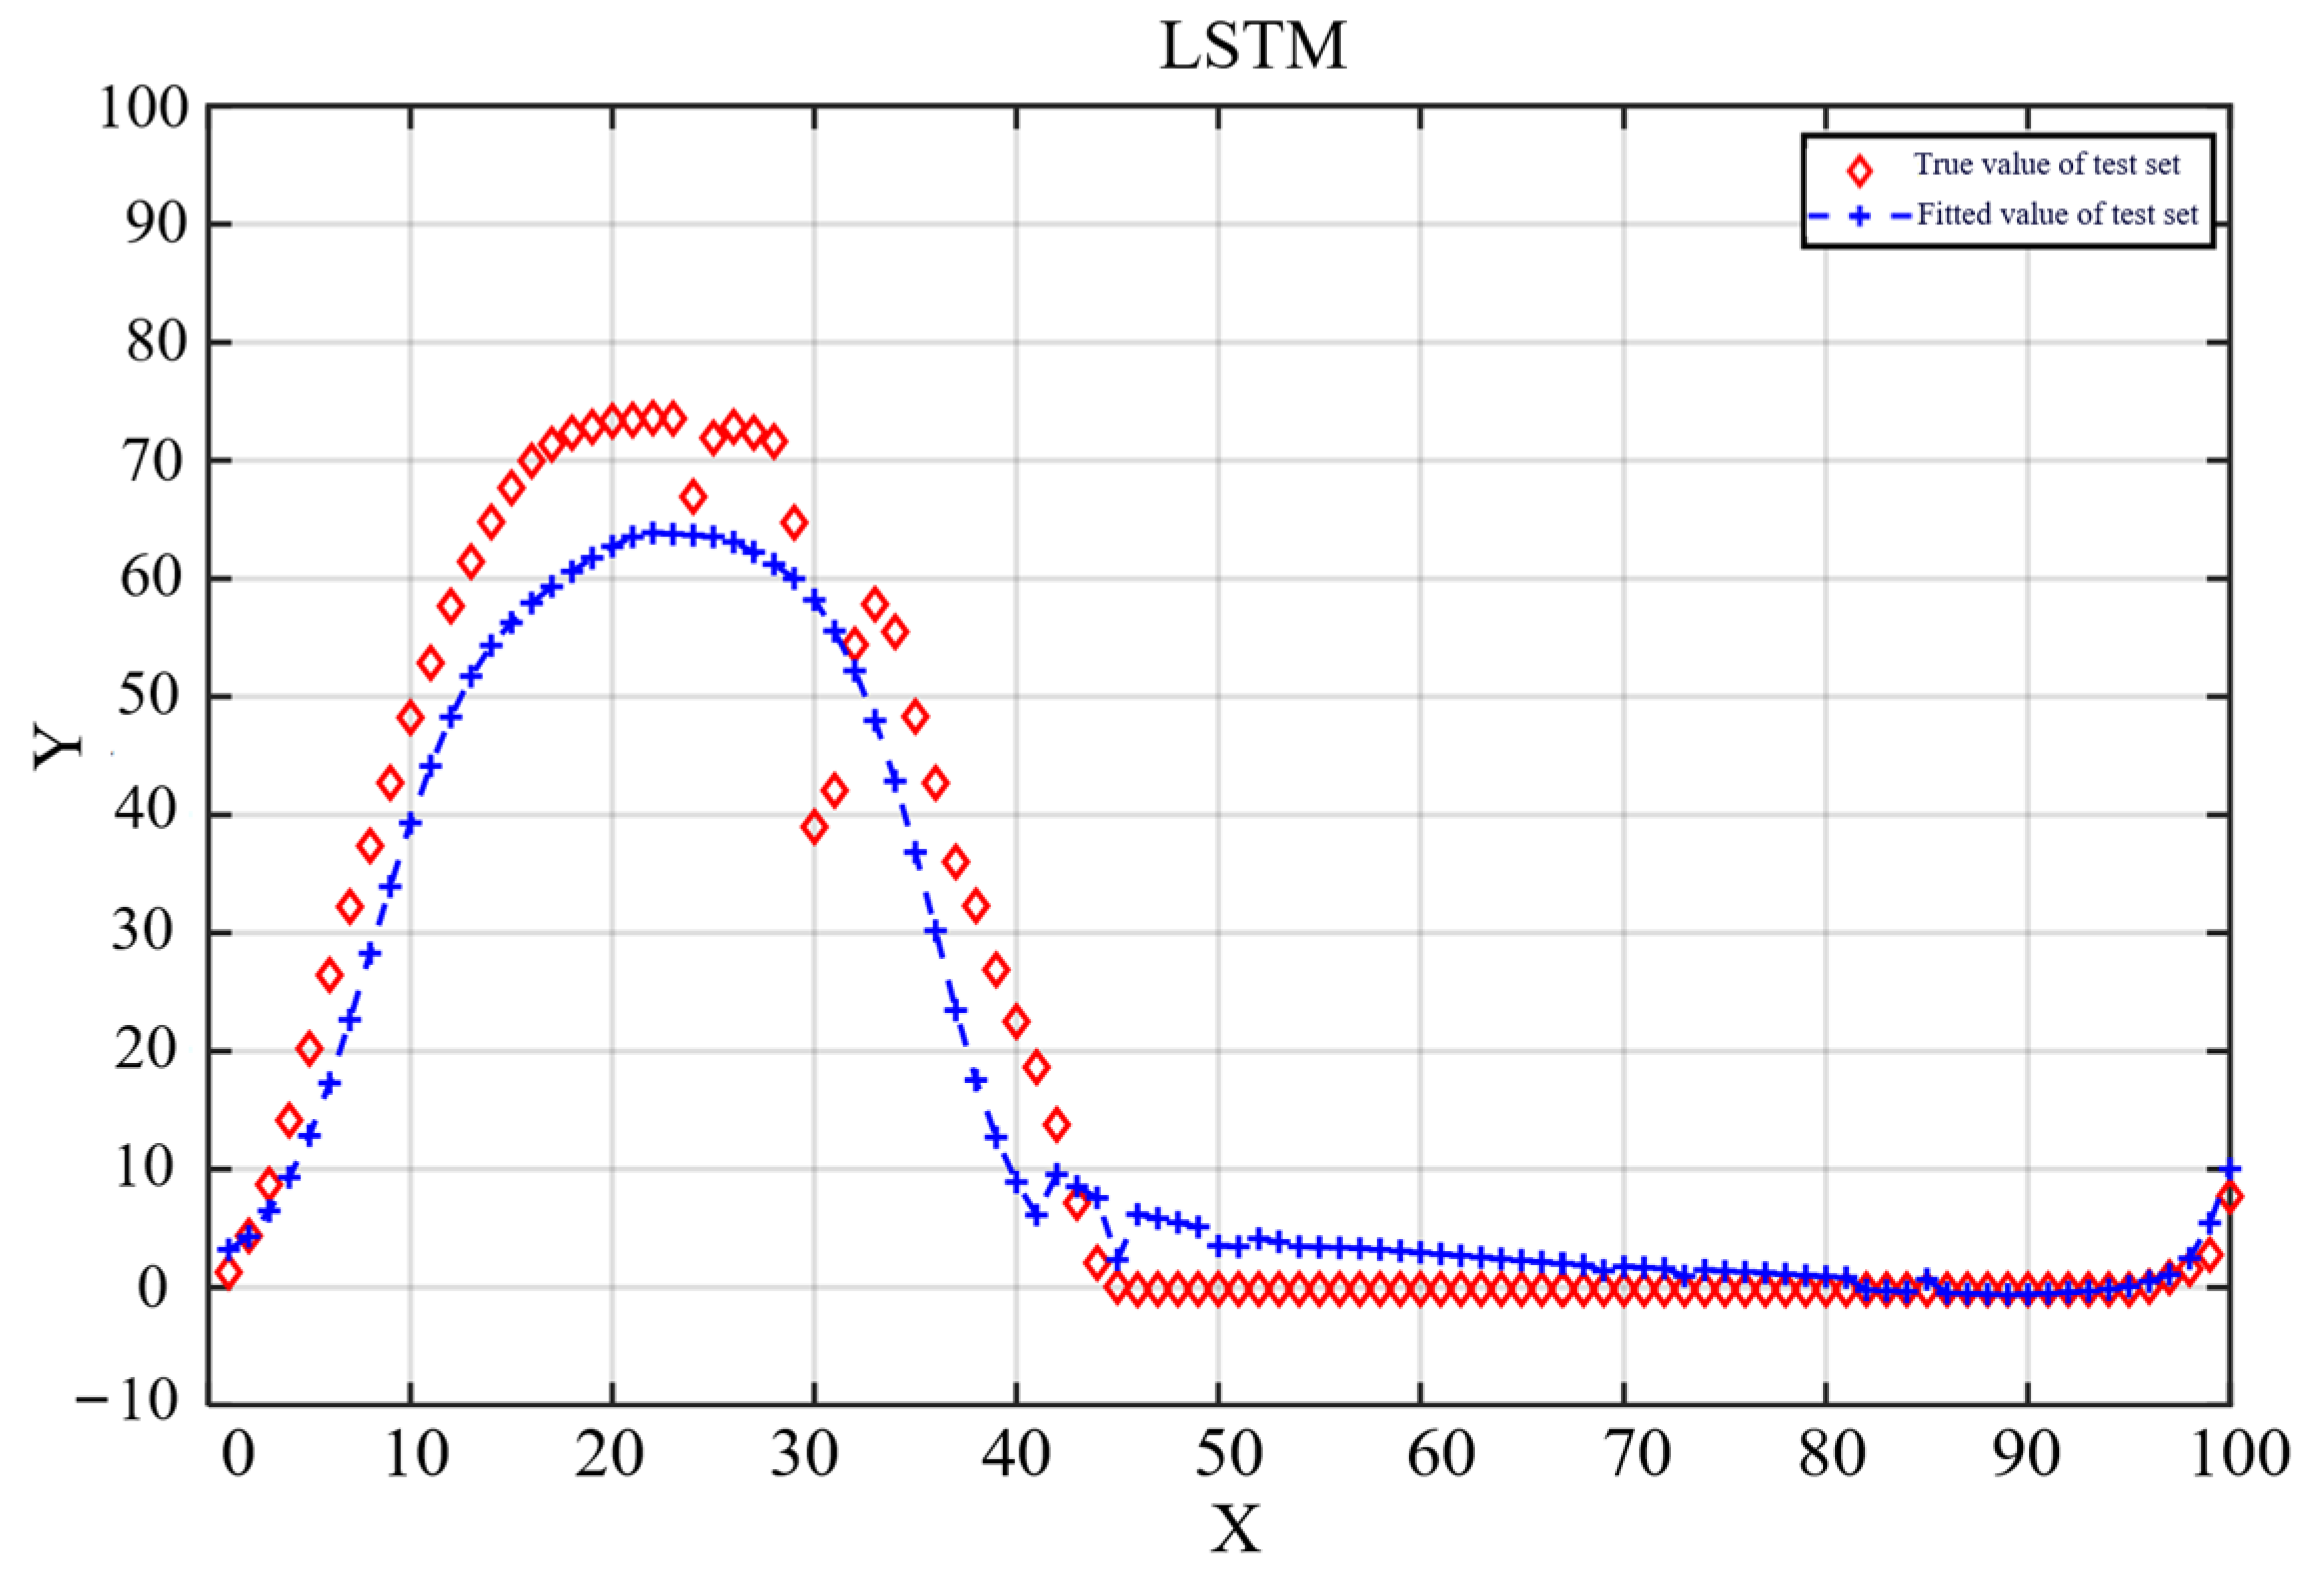
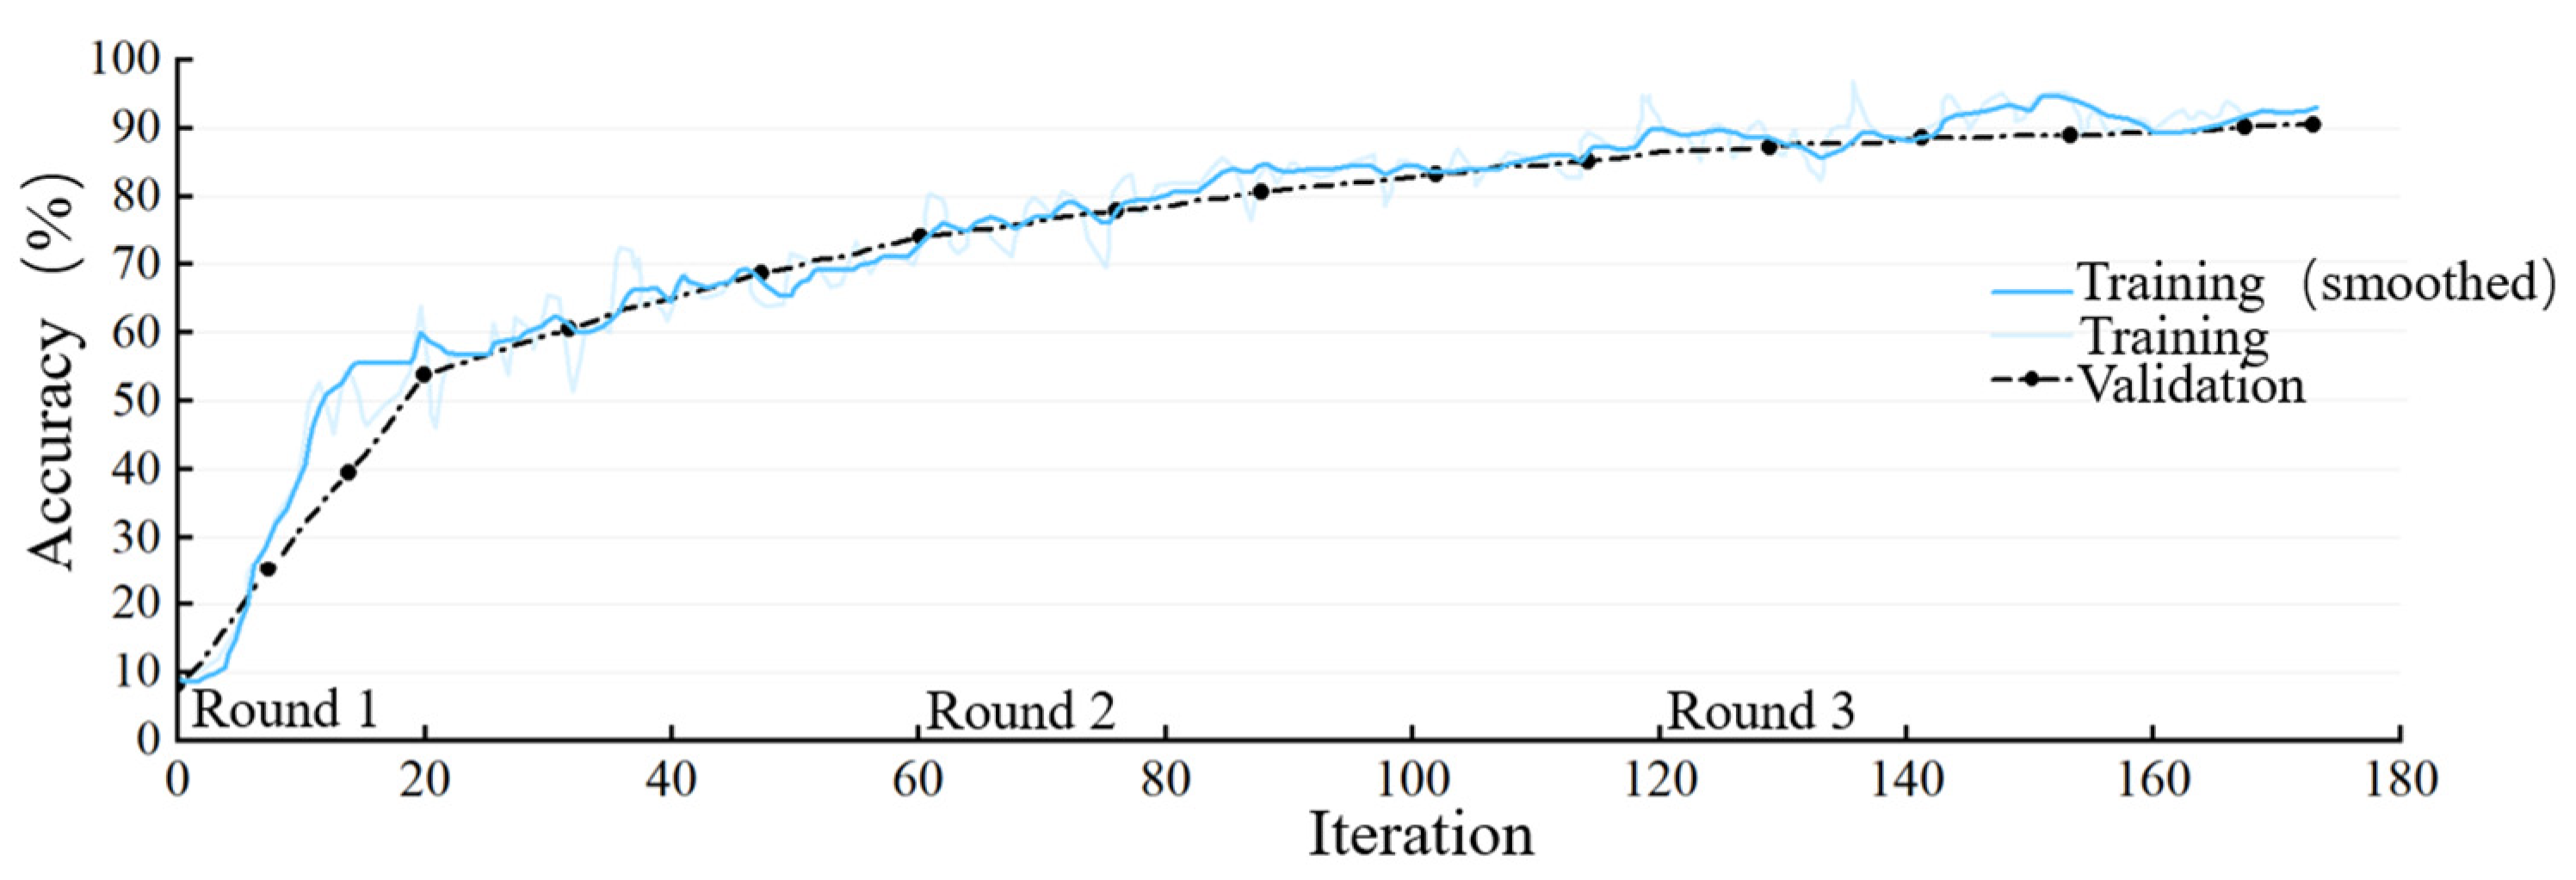
To underscore the superiority of the algorithm presented in this paper, we introduce a convolutional neural network (CNN) and long short-term memory (LSTM) for comparative analysis. The input layer neurons for the CNN, LSTM, and CNN-LSTM are set to 6, with a maximum of 30 training rounds, and the training–test–validation set ratio is 8:1:1. The results obtained are shown in Figure 15, Figure 16, Figure 17, Figure 18, Figure 19 and Figure 20.
RMSE, MAE, and MAPE were used as the main evaluation indicators, and the predicted and true values were, respectively:, The range is [0,+∞), where n denotes the number of samples, denotes the true value, and is the predicted value.
Root Mean Square Error (RMSE): The smaller the value of RMSE, the more accurate the prediction of the model.
Mean Absolute Error (MAE): When the predicted value precisely matches the true value, as in the case of a perfect model, the error is zero. As the error increases, so does the error value. Therefore, a smaller Mean Absolute Error (MAE) indicates higher accuracy in the predictive model
Mean Absolute Percentage Error (MAPE): A Mean Absolute Percentage Error (MAPE) of 0% signifies a flawless model, while a MAPE exceeding 100% indicates a subpar model. Generally, the lower the MAPE value, the higher the accuracy of the predictive model.
Table 2 shows the evaluation results of the main parameters of the three neural networks after training using RMS, MAE, and MAPE as the main evaluation indexes. It can be observed that the main evaluation parameter indicators of the test set after CNN-LSTM training are better.
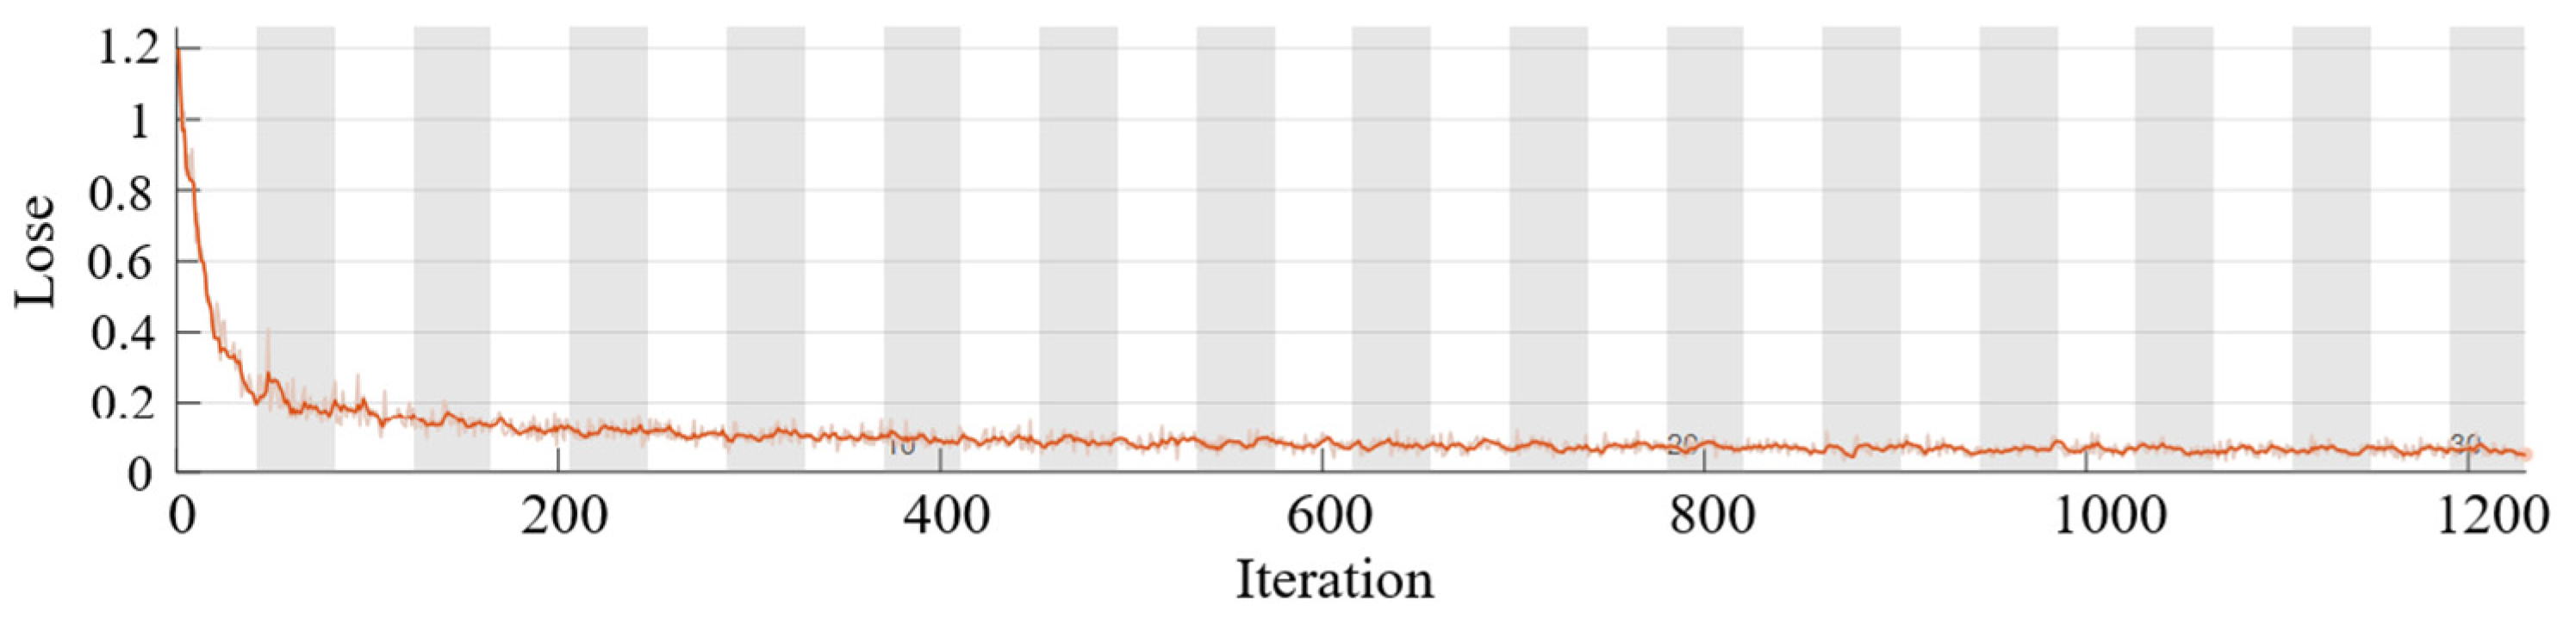
In the constant deceleration braking simulation, the braking system operates under three conditions: normal operation, oil pressure leakage, and air mixed with the cylinder. Each condition comprises 128 sets of samples, with each sample containing 500 sets of training data. In total, 80% of the training data are selected for model training, while 10% are allocated for both testing and validation sets. The input layer consists of three neurons, with nonlinear activation functions chosen as linear rectifiers. A maximum pooling layer of (2, 2) is set up, followed by data flattening. To prevent overfitting and mitigate gradient disappearance, stochastic deactivation weights are set to 0.3. The model is then trained through two fully connected layers to output fault diagnosis classifications (Figure 21).
Figure 21 shows the digital twin model training results, the trained model is migrated to the actual sensor data, using the same convolutional neural network layer as the model training, the sensor data training results are shown in Figure 22.
The predictive model underwent migration to integrate with real-time sensor data, achieving a fault prediction accuracy of 95.35%. This advancement effectively bridges the gap between model and data in predictive maintenance, enhancing the feasibility of predictive maintenance strategies. Specifically, in the design of the maintenance scheme, priority was given to the hydraulic system, brake discs, and brakes within the brake system. Evaluation of the predictive maintenance efficacy was conducted using a fuzzy evaluation method, confirming the effectiveness of the implemented predictive maintenance measures.
6. Conclusions
This study utilizes a data-driven methodology to determine the parameters of each mathematical model for the processes. Subsequently, the data-driven mathematical model is revised to the digital twin model. The study conducted a comparative analysis by implementing CNN, LSTM, and CNN-LSTM models. The experimental results confirmed that the CNN-LSTM predictive maintenance model is more accurate in predicting faults and monitoring the health of the braking system during operation. Additionally, the study verified the feasibility of using the digital twin model for predictive maintenance in the braking system. The CNN and LSTM models were also compared with traditional fault diagnosis methods. Based on the analysis, the following conclusions were drawn. In addition, given the diverse array of mechanical failures and the imperative to integrate numerous sensors, there exists ample opportunity for ongoing iterative refinement of the constructed lifting mechanism system model. Future research endeavors will extend towards employing real-time online updating techniques to continuously enhance the accuracy and efficacy of the digital twin model.
A digital twin model of the mine hoist braking system was meticulously crafted, employing advanced software tools such as AMESim and MATLAB for co-simulation. This approach facilitated the emulation of real-world scenarios with remarkable accuracy. By harnessing the simulation capabilities of AMESim, intricate components of the physical model were faithfully replicated within the digital realm. Furthermore, the inherent complexity of reproducing fault scenarios was effectively addressed through the strategic injection of faults into the twin model. This methodological fusion of digital and physical realms not only enhances the precision of fault analysis but also streamlines the diagnostic process, ultimately optimizing operational reliability and safety within the mine hoist braking system.
Furthermore, the digital twin failure was experimented with. Adopting virtual–real combination digital twin technology, based on the construction of a physical model, the iterative updating of data-driven model parameters, data analysis, and fully considering the changes in key parameters in the whole life cycle of the braking system, intelligent prediction of the overall braking system of the hoisting machine is carried out, intelligent diagnosis of the faults is carried out, and predictive maintenance is carried out for the faults that may arise in the future, so as to reduce unplanned shutdowns and ensure that the mine hoisting machine operation is safe.
Finally, the CNN-LSTM was used for fault prediction. The predictive maintenance method of the digital twin model and data fusion was established, the fault prediction process was established, the simulation data and the actual operation data of normal operation and fault data were pre-processed by two filtering data, the feature parameters were extracted, and after 30 rounds of Bayesian optimization, the accuracy of the CNN-LSTM prediction algorithm was up to 95.35% relative to CNN and LSTM, which solves the predictive maintenance classification prediction algorithm with poor accuracy.
Author Contributions
P.G.: conducted simulations, analyses, and experiments, collated data, and wrote the original manuscript. S.Z.: acquired funding, provided proofreading and supervision. Y.Z.: conducted experiments. All authors have read and agreed to the published version of the manuscript.
Funding
This research received no external funding.
Data Availability Statement
Data are contained within the article.
Acknowledgments
The authors would like to thank CITIC Heavy Industries for providing the ultra-deep mine test platform and the anonymous reviewers and editors for their valuable and insightful suggestions.
Conflicts of Interest
The authors declare no conflicts of interest.
References
- Tao, F.; Zhang, H.; Liu, A.; Nee, A.Y.C. Digital Twin in Industry: State-of-the-Art. IEEE Trans. Ind. Inform. 2019, 15, 2405–2415. [Google Scholar] [CrossRef]
- Aivaliotis, P.; Arkouli, Z.; Georgoulias, K.; Makris, S. Degradation curves integration in physics-based models: Towards the predictive maintenance of industrial robots. Robot. Comput. Integr. Manuf. 2021, 71, 102177. [Google Scholar] [CrossRef]
- Boloz, L.; Bialy, W. Automation and Robotization of Underground Mining in Poland. Appl. Sci. 2020, 10, 7221. [Google Scholar] [CrossRef]
- Nakamatsu, K. Research Status and Trend Analysis of Coal Mine Electro-Mechanical Equipment Maintenance under the Background of Smart Mine Construction; Springer: Singapore, 2022; pp. 263–272. [Google Scholar]
- Aivaliotis, P.; Georgoulias, K.; Arkouli, Z.; Makris, S. Methodology for enabling Digital Twin using advanced physics-based modelling in predictive maintenance. Procedia CIRP 2019, 81, 417–422. [Google Scholar] [CrossRef]
- Zhang, R.; Wang, F.; Cai, J.; Wang, Y. Digital twin and its applications: A survey. Int. J. Adv. Manuf. Technol. 2022, 123, 4123–4136. [Google Scholar] [CrossRef]
- Wu, J.; Yang, Y.; Cheng, X.; Zuo, H.; Cheng, Z. The Development of Digital Twin Technology Review. In Proceedings of the 2020 Chinese Automation Congress (CAC), Shanghai, China, 6–8 November 2020. [Google Scholar]
- Li, L.; Aslam, S.; Wileman, A.; Perinpanayagam, S. Digital Twin in Aerospace Industry: A Gentle Introduction. IEEE Access 2022, 10, 9543–9562. [Google Scholar] [CrossRef]
- Qi, Q.; Tao, F.; Zuo, Y.; Zhao, D. Digital Twin Service towards Smart Manufacturing. Procedia CIRP 2018, 72, 237–242. [Google Scholar] [CrossRef]
- Ding, H.; Zhao, L.; Yan, J.; Feng, H.-Y. Implementation of Digital Twin in Actual Production: Intelligent assembly paradigm for large-scale industrial equipment. Machines 2023, 11, 1031. [Google Scholar]
- He, Y.; Gao, Z. Joint Optimization of Preventive Maintenance and Spare Parts Ordering Considering Imperfect Detection. Systems 2023, 11, 445. [Google Scholar] [CrossRef]
- Wang, X.; Hu, X.; Ren, Z.; Tian, T.; Wan, J. Knowledge-graph-based multi-domain model integration method for digital-twin workshops. Int. J. Adv. Manuf. Technol. 2023, 128, 405–421. [Google Scholar] [CrossRef]
- Duan, J.; Ma, T.-Y.; Zhang, Q.-L.; Liu, Z.; Qin, J.-Y. Design and application of digital twin system for the blade-rotor test rig. J. Intell. Manuf. 2023, 34, 753–769. [Google Scholar] [CrossRef]
- Liu, S.; Qi, Y.; Gao, X.; Liu, L.; Ma, R. Transfer learning-based multiple digital twin-assisted intelligent mechanical fault diagnosis. Meas. Sci. Technol. 2024, 35, 25133. [Google Scholar] [CrossRef]
- Zhiyu, Z.; Xiangfeng, Z.; Hong, J. A time–frequency ridge extraction diagnostic method for composite faults of bearing gears in wind turbine gearboxes. Meas. Sci. Technol. 2024, 35, 26105. [Google Scholar] [CrossRef]
- Lin, H.; Lin, C.; Xie, D.; Acuna, P.; Liu, W. A Counter-Based Open-Circuit Switch Fault Diagnostic Method for a Single-Phase Cascaded H-Bridge Multilevel Converter. IEEE Trans. Power Electron. 2024, 39, 814–825. [Google Scholar] [CrossRef]
- Xie, D.; Lin, C.; Lin, H.; Liu, W.; Du, Y.; Basler, T. OC Switch Fault Diagnosis, Pre- and Postfault DC Voltage Balancing Control for a CHBMC Using SVM Concept. IEEE Trans. Power Electron. 2024, 39, 677–692. [Google Scholar] [CrossRef]
- Choksi, K.; Mirza, A.B.; Zhou, A.; Singh, D.; Hijikata, M.; Luo, F. Self-Evolving Digital Twin-Based Online Health Monitoring of Multiphase Boost Converters. IEEE Trans. Power Electron. 2023, 38, 16100–16117. [Google Scholar] [CrossRef]
- Li, J.; Jiang, S.; Li, M.; Xie, J. A Fault Diagnosis Method of Mine Hoist Disc Brake System Based on Machine Learning. Appl. Sci. 2020, 10, 1768. [Google Scholar] [CrossRef]
- Fan, J.; Zheng, P.; Lee, C.K.M. A Vision-Based Human Digital Twin Modeling Approach for Adaptive Human-Robot Collaboration. J. Manuf. Sci. Eng.-Trans. Asme 2023, 145, 121002. [Google Scholar] [CrossRef]
- Yin, C.; Yang, R.; Zou, X. Research of Command Entity Intelligent Decision Model based on Deep Reinforcement Learning. In Proceedings of the 2018 5th Ieee International Conference on Cloud Computing and Intelligence Systems (Ccis), Nanjing, China, 23–25 November 2018; pp. 552–556. [Google Scholar]
- Li, B.; Lv, X.; Zhou, F.; Yan, B. A life prediction method of rolling bearing based on signal reconstruction and fusion dual channel network. Meas. Sci. Technol. 2024, 35, 15137. [Google Scholar] [CrossRef]
- Bernstein, I.A.; Koornwinder, A.; Hwang, H.H.; Wang, S.Y. Automated Recognition of Visual Acuity Measurements in Ophthalmology Clinical Notes Using Deep Learning. Ophthalmol. Sci. 2024, 4, 100371. [Google Scholar] [CrossRef]
- Garshasbi, J.; Teimouri, M. CNNPRE: A CNN-Based Protocol Reverse Engineering Method. IEEE Access 2023, 11, 116255–116268. [Google Scholar] [CrossRef]
- Ahsan, F.; Dana, N.H.; Sarker, S.K.; Li, L.; Muyeen, S.M.; Ali, F.; Tasneem, Z.; Hasan, M.; Abhi, S.H.; Islam, R.; et al. Data-driven next-generation smart grid towards sustainable energy evolution: Techniques and technology review. Prot. Control Mod. Power Syst. 2023, 8, 43. [Google Scholar] [CrossRef]
- Jiang, H.; Cai, Z.; Zhang, T.; Peng, C. Prediction of Boiler Combustion Energy Efficiency via Deep Reinforcement Learning. In Proceedings of the 2021 40th Chinese Control Conference (CCC), Shanghai, China, 26–28 July 2021. [Google Scholar]
- Qian, C.; Zhu, J.; Shen, Y.; Jiang, Q.; Zhang, Q. Deep Transfer Learning in Mechanical Intelligent Fault Diagnosis: Application and Challenge. Neural Process. Lett. 2022, 54, 2509–2531. [Google Scholar] [CrossRef]
- Guo, J.; Liu, P.; Xiao, B.; Deng, L.; Wang, Q. Surface defect detection of civil structures using images: Review from data perspective. Autom. Constr. 2024, 158, 105186. [Google Scholar] [CrossRef]
- Liu, J.; Ji, Q.; Zhou, H.; Du, C.; Liu, X.; Li, M. A multi-dimensional evolution modeling method for digital twin process model. Robot. Comput. Integr. Manuf. 2024, 86, 102667. [Google Scholar] [CrossRef]
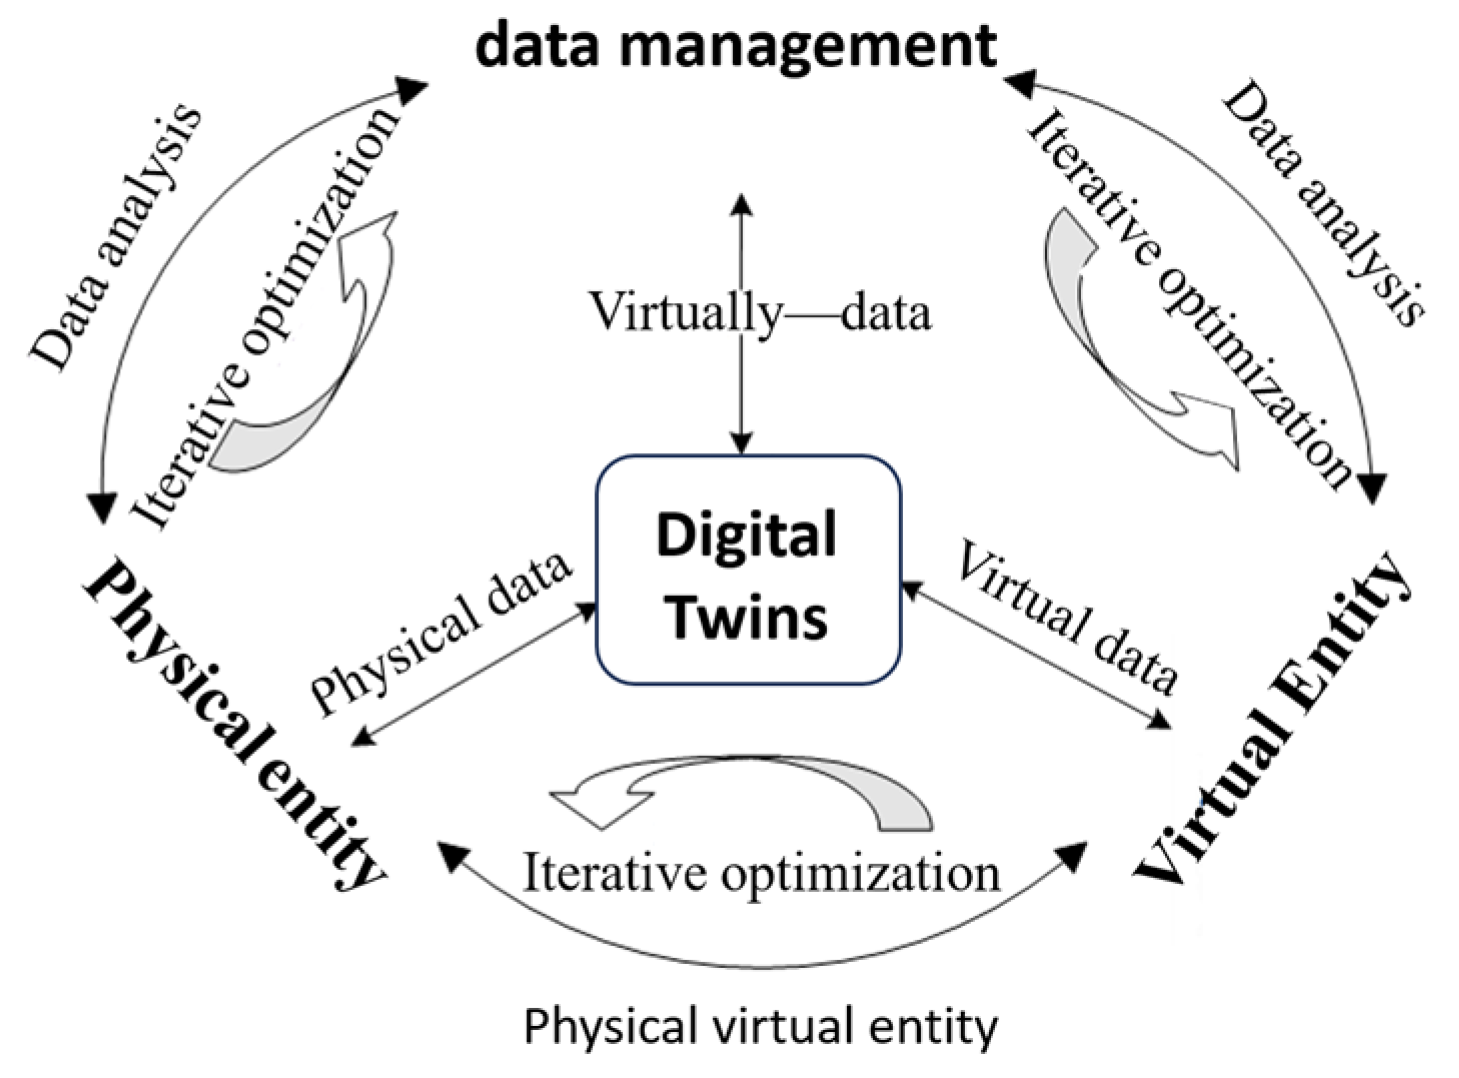
Figure 1.
Mine hoist digital twin five-dimensional mode.

Figure 2.
Disc brake force analysis diagram.

Figure 3.
Block diagram illustrating the control principle of the hoist braking system.

Figure 4.
Block diagram of brake transfer function controlled by a proportional directional valve.

Figure 5.
Modeling the constant deceleration brakes in AMESim.

Figure 6.
MATLAB control signals and interfaces.

Figure 7.
Joint simulation model of the constant deceleration braking system.

Figure 8.
Simulation results of the constant deceleration braking of the hoist.

Figure 9.
Relief valve performance and brake deceleration.

Figure 10.
Relief valve performance and brake system pressure.

Figure 11.
CNN for fault diagnosis.

Figure 12.
Computing process of the LSTM model.

Figure 13.
Feature labels.

Figure 14.
CNN-LSTM network structure diagram.

Figure 15.
CNN-LSTM networks test set fitting.

Figure 16.
Rounds of CNN-LSTM iterations.

Figure 17.
LSTM test set fitting.

Figure 18.
Rounds of LSTM iterations.

Figure 19.
CNN test set fitting.

Figure 20.
Rounds of CNN iterations.

Figure 21.
Digital twin model training results.

Figure 22.
Sensor data model diagnosis results.


Table 1.
Elevator simulation process.
| Times | Hoist Action |
|---|---|
| 0~2 s | Air accumulator charging |
| 2~5 s | Brake opening |
| 5~8 s | Safety brake |
| 8~10 s | Elevator stop |
Table 2.
Prediction model key evaluation index scores.
| Training Models | RMSE | MAE | MAPE |
|---|---|---|---|
| CNN-LSTM | 6.0062 | 3.4943 | 7.0451 |
| LSTM | 16.0224 | 4.6422 | 8.3186 |
| CNN | 14.2554 | 3.9905 | 8.3948 |
Disclaimer/Publisher’s Note: The statements, opinions and data contained in all publications are solely those of the individual author(s) and contributor(s) and not of MDPI and/or the editor(s). MDPI and/or the editor(s) disclaim responsibility for any injury to people or property resulting from any ideas, methods, instructions or products referred to in the content. |
© 2024 by the authors. Licensee MDPI, Basel, Switzerland. This article is an open access article distributed under the terms and conditions of the Creative Commons Attribution (CC BY) license (https://creativecommons.org/licenses/by/4.0/).
Share and Cite
MDPI and ACS Style
Gao, P.; Zhao, S.; Zheng, Y. Failure Prediction of Coal Mine Equipment Braking System Based on Digital Twin Models. Processes 2024, 12, 837. https://doi.org/10.3390/pr12040837
AMA Style
Gao P, Zhao S, Zheng Y. Failure Prediction of Coal Mine Equipment Braking System Based on Digital Twin Models. Processes. 2024; 12(4):837. https://doi.org/10.3390/pr12040837
Chicago/Turabian StyleGao, Pubo, Sihai Zhao, and Yi Zheng. 2024. "Failure Prediction of Coal Mine Equipment Braking System Based on Digital Twin Models" Processes 12, no. 4: 837. https://doi.org/10.3390/pr12040837
Note that from the first issue of 2016, this journal uses article numbers instead of page numbers. See further details here.