
Pulsation Stability Analysis of a Prototype Pump-Turbine during Pump Mode Startup: Field Test Observations and Insights

1
Department of Energy and Power Engineering, Tsinghua University, Beijing 100084, China
2
Institute of New Energy and Energy Storage of Power China, Beijing 300134, China
3
Baishan Storage Power Station, State Grid Xinyuan Co., Ltd., Huadian 132400, China
*
Author to whom correspondence should be addressed.
Processes 2024, 12(4), 838; https://doi.org/10.3390/pr12040838
Submission received: 11 March 2024
/
Revised: 11 April 2024
/
Accepted: 18 April 2024
/
Published: 21 April 2024
(This article belongs to the Special Issue Advanced Simulation and Experiment Methods of Flow Instability in Hydraulic Machinery)
Abstract
:Pump-turbines experience complex flow phenomena and fluid–structure interactions during transient operations, which can significantly impact their stability and performance. This paper presents a comprehensive field test study of the pump mode startup process for a 150 MW prototype pump-turbine. By analyzing pressure fluctuations, structural vibrations, and their short-time Fourier transform (STFT) results, multiple stages were identified, each exhibiting distinct characteristics. These characteristics were influenced by factors such as runner rotation, free surface sloshing in the draft tube, and rotor–stator interactions. The natural frequencies of the metallic components varied during the speed-up and water-filling stages, potentially due to gyroscopic effects or stress-stiffening phenomena. The opening of the guide vanes and dewatering valve inside the guide vanes significantly altered the amplitude of the rotor–stator interaction frequency, transitioning the vibration behavior from forced to self-excited regimes. Interestingly, the draft tube pressure fluctuations exhibited sloshing frequencies that deviated from existing prediction methods. The substantial phenomena observed in this study can help researchers in the field to deepen the understanding of the complex behavior of pump-turbines during transient operations and identify more meaningful research directions.
1. Introduction
With the pursuit of green and sustainable development, the installed capacity of new energy sources, led by wind and solar power, has been growing continuously in China in recent years [1]. To address the power grid stability issues brought about by wind and solar energy, the pumped storage industry has experienced explosive growth in the past three years, with the total capacity of pumped storage projects under construction exceeding 20 million kilowatts [2]. As the core component of pumped storage power stations, pump-turbines often face complex hydraulic and mechanical stability problems during operation, especially under off-design conditions, such as partial load in turbine mode, pump mode, and transient processes during mode switching [3]. These stability issues not only affect the operating performance and lifespan of the units but also pose challenges to the peak shaving and frequency regulation capabilities of the power grid. Over the years, scholars have conducted extensive research on the stability problems of pump-turbines through theoretical analysis, experimental testing, and numerical simulations. Sun et al. [4] reviewed the hydraulic and mechanical vibration characteristics of pump-turbines and their inducing factors, pointing out that vortices in the flow passage, Karman vortices, draft tube vortices, as well as the S-shaped and hump characteristics, are the main causes of hydraulic vibrations. In contrast, factors such as stator deformation, rotor misalignment, and eccentricity can lead to mechanical vibration problems. In variable-speed pumped storage units, the vibration modes of the shaft system may also pose potential risks to the vibration stability under low-speed conditions.
The hydraulic performance and stability characteristics of pump-turbines under transient conditions differ significantly from those under steady-state conditions. From a macro perspective, under the influence of flow inertia, the external characteristics exhibit a delay in change during transient processes. From a micro perspective, brief but intense flow instabilities can cause strong pressure pulsations, which in turn lead to increased structural vibrations. Zhang et al. derived a generalized Euler equation considering transient effects [5] and experimentally verified its superiority in predicting head changes during the startup process of pump-turbines [6]. They emphasized that during the startup and shutdown transient processes, the influence of runner acceleration on the head is much greater than that of flow inertia. Zhang et al. [7] connected two model pump-turbines in reverse and studied the effects of slow, medium, and fast rotational speed acceleration on the external and internal flow characteristics of the system through experiments and CFD simulations. The results showed that a rapid increase in rotational speed leads to a parabolic trend in the head curve and a significant flow lag. They also discussed that during the startup process, similarity laws are not applicable for predicting pump characteristics, while Junjinger [8] attempted to achieve temporal similarity through the Strouhal number to address the shortcomings of model tests in transient testing in his latest work.
Liu et al. [9] used three-dimensional numerical simulations, combined with dynamic mesh technology and fluid–structure coupling methods, to study the transient process of a pump-turbine during power failure in pump mode. They analyzed the transient characteristics of parameters such as flow rate, head, and rotational speed, and examined the significant influence of reverse flow and stall phenomena on head changes under pump braking conditions. Yang et al. [10] simulated the startup process of a pump-turbine at the lowest operating head, considering the governor equations. They analyzed the effects of different regulation parameters on macro parameters such as rotational speed, flow rate, and torque, as well as internal flow. They found that the instability during the startup process is closely related to the periodic evolution of backflow at the runner inlet. Hu et al. [11] used a combination of field testing and numerical simulations to study the transient pressure pulsation characteristics of a 300 MW pump-turbine under load rejection and power failure conditions and discussed the causes of pressure pulsations under different operating conditions. Fu et al. [12] used one-dimensional and three-dimensional coupled simulation methods to study the high-amplitude pressure pulsation problem of a pump-turbine with a large head variation range during the load rejection process in turbine mode. They employed a joint time-frequency analysis method to reveal that, in addition to rotor–stator interference and local backflow vortices, Dean vortices in the volute are also important factors causing pressure pulsations. Mao et al. [13] focused on the axial hydraulic force during the startup process in pump mode and its impact on the support structure and main shaft. They found that the structural deformation and stress distribution are closely related to the resultant forces on the crown and band.
Another important issue is that during transient processes, pump-turbines often experience gas–liquid two-phase flow inside the unit. One type is the cavitation phenomenon that occurs in low-pressure regions of the flow, while the other is the two-phase flow intentionally introduced by injecting air into the unit. Fu et al. [14] considered the cavitation effect and investigated the hydraulic pulsation problem of a pump-turbine under the runaway condition after pump power failure. They found that extreme pulsations mostly occur near the critical transition points between two operating modes and are mainly related to local backflow at the runner inlet and unstable cavitation phenomena in the runner and draft tube. Tao et al. [15] carefully examined the evolution process of vortex structures generated by guide vane jets in the vaneless space during the pump startup condition and discussed the possibility of cavitation caused by jets at small openings. The condenser mode of pump-turbines is an important transitional condition in many transient processes, involving complex two-phase flow of water and air. A more in-depth study was conducted by Vagnoni et al. through model experiments [16]. They observed the size and velocity characteristics of bubbles in the vaneless space at a Froude number of 0.5 under condenser mode and investigated the variation of the gas–liquid interface in the draft tube with the Froude number. The results showed that the sloshing frequency of the free surface in the draft tube has an important relationship with the natural frequency of the water body and the wavenumber of gravity waves [17]. Zhang et al. [18] further used the VOF model to numerically simulate the changes in the water ring surface near the guide vanes and the free liquid surface in the draft tube cone section during the pump startup process, demonstrating the flow characteristics of bubble invasion into the water ring and the inclination angle of the draft tube free surface. Overall, existing research is limited to the analysis of stable condenser mode, and studies on the transient processes involving condenser mode are relatively lacking, which is insufficient to meet the needs of engineering applications.
The above-mentioned studies indicate that the transient processes of pump-turbines involve complex hydraulic, mechanical, and control characteristics, as well as strong coupling effects of multiphase and multi-physical fields, posing severe challenges to the safe and stable operation of the units. Based on field tests of the startup process of a prototype pump-turbine, this paper analyzes the influence of factors such as runner rotation, draft tube free surface sloshing, and rotor–stator interaction on pressure pulsations and structural vibrations, revealing the main excitation sources at different stages. This provides important references for deepening the understanding of the transient behavior of pump-turbines. Some of the illuminating findings of this paper include the following:
- (1)
- The natural frequency of the metal structure can be affected by the speed variation and water-filling.
- (2)
- Guide vanes and dewatering valve inside the guide vanes can significantly affect the vibration behavior of the unit, making it switch between self-excited vibration and forced vibration.
- (3)
- The frequency of free surface sloshing in the draft tube shows a bended frequency band in STFT, and the mathematical model for predicting its frequency still needs to be improved.
2. Test Object and Method
2.1. Unit Information
The field test was conducted on a 150 MW prototype pump-turbine at Baishan Pumped Storage Hydropower Station, Jilin province, China, as shown in Figure 1. In addition to the general features possessed by most pump-turbines, the specific characteristics of this unit include the following: (1) In the upper-crown cavity, there are four branches of balancing pipes that merge into a single main pipe at a higher position and connect to the draft tube. This differs from some studies [19]. The specifics of each plant are also different. (2) The draft tube has a pier, which actually originates from the design of high-flow conventional turbines but is rarely seen in pump-turbines. There are hardly any similar cases in the current literature. The typical design parameters are listed in Table 1. According to Equation (1), the specific speed ns is calculated to be 228.
2.2. Test Scheme
The field test monitored the entire startup process of the pump, starting from zero rotational speed, through the pump condenser mode, followed by a period of stable operation, then opening the guide vanes, and finally reaching a stable pumping state. The total duration was approximately 15 min.
2.3. Sensor Configuration
A total of nine pressure sensors were installed to monitor the pressure at typical locations inside the flow passage, and nine IEPE accelerometers were used to monitor the vibration at key positions of fixed structural components. Additionally, a separate displacement sensor was installed on the floor, which was the reason why the power plant staff requested this study. They believed that the vibration during the transient process was too large, affecting the health of on-site personnel and making the unit operation feel unsafe. All the measuring points and sensor information are shown in Figure 2, Figure 3 and Figure 4. Please note the abbreviation of each measuring point name. Moreover, we retrieved the stored data from the governor slave computer, including guide vane opening, rotational speed, and active power, which helped grasp the key moments of unit operation.
The analog signals from all sensors were acquired using data acquisition cards, i.e., high-speed A/D conversion systems. Pressure data and vibration data were collected using separate testing systems, with an acquisition time difference of <1 ms between channels in each testing system, ensuring the accuracy of the phase relationship between signals of the same type. Before the unit startup, data acquisition was initiated in advance and maintained at a sampling rate of 4096 Hz until the unit reached stable operation.
Due to the presence of multiple acquisition cards, all computers, including the governor slave computer, underwent time difference calibration to ensure that the time difference between all acquisition systems at the start of acquisition did not exceed 0.5 s. Furthermore, to ensure the time alignment of the test data throughout the entire process, the effective signal lengths of each acquisition system were checked. Then, a peak at the same location in each signal was manually selected to calculate the difference in clock multiplier between multiple acquisition systems, which was used to correct the actual sampling rate. This operation is crucial for long-duration, high-sampling-rate test samples. The sampling rate of the governor slave computer was corrected from the nominal 833 Hz to the actual 815 Hz, undoubtedly having a significant impact on the analysis results.
2.4. Analytical Method
For pulsating signals, their variation over time exhibits characteristics similar to random variables. For the measured discrete data, histograms can be used to evaluate the amplitude distribution of the signals, or peak-to-peak values can be employed to assess the pulsation intensity. For long-duration pulsating signals, the sliding window method is utilized to evaluate the pulsation intensity within short time segments.
is the discrete signal to be analyzed, represents all moments of the original signal, is the sliding rectangle window, is the window length, denotes the confidence level, and indicates the quantile. It should be noted that although peak-to-peak values can quickly and preliminarily evaluate the relative changes in pulsation intensity across different time periods, the absolute values of the peak-to-peak values themselves do not have sufficient credibility. According to the authors’ experience, when two-wire current output sensors work in a hydropower station, the negative end of the signal must be uniformly grounded, bringing considerable ground loop noise.
Moreover, it is undeniable that even with the same peak-to-peak values, the probability distributions of different discrete signals within the peak-to-peak values can still vary greatly. In this case, the signals need to undergo frequency domain analysis. This paper employs the short-time Fourier transform (STFT) technique based on the Fourier transform (FFT). STFT utilizes the sliding window technique to analyze the local frequency domain information of the signal. Although there are currently some studies on adaptive STFT [20] and multi-resolution STFT [21], in terms of STFT improvement, the signal processing field lacks relatively mature and widely applicable consensus. For complex power plant signals, the influence brought by the analysis method itself should be minimized as much as possible. Therefore, this paper adopts the basic STFT, and its calculation method is as follows:
The power plant site has numerous mechanical actions that are close to single-pulse excitations, which will exhibit broadband characteristics in the spectrum and can be used for division of the pump-turbine operating periods. In addition, before performing spectral analysis, all signals need to be filtered using a high-pass filter with a cutoff frequency of 0.01 Hz.
To facilitate the observation of changes in various unit parameters, this paper defines the following coefficients:
where is the normalized rotational speed, is the normalized guide vane opening, is the normalized power, is the normalized pressure. is the rated head of 105.8 m, is the water density of 1000 kg/m3, and is the gravitational acceleration of 9.8 m/s2.
When describing frequency, the ratio of the actual frequency to the rated rotational frequency is used to evaluate the frequency level. For example, a 33.33 Hz component is referred to as 10 fn, indicating that the frequency is 10 times the rated rotational frequency.
3. Results and Discussion
3.1. A general Startup Process of Pump Mode
Since the pump startup process involves the condenser mode, the startup processes of different units are not exactly the same. Therefore, a generalized dewater-startup process for a pump-turbine in pump mode is first clarified here, as shown in Figure 5. It is derived from the authors’ statements on the relevant literature and the abstracted summary of field test data from three pump-turbines with different specific speeds.
= 0–0.1: Dewatered State. Due to the earlier air pressuring process, the region from the main valve upstream of the volute case to the straight cone section of the draft tube has filled with air.
= 0.1–0.2: The Static Frequency Converter (SFC) drives the runner to increase its speed to the rated speed. Due to the increasing of speed, the power rises synchronously.
= 0.2–0.3: The speed no longer increases, the input power drops sharply, and the unit enters the pump condenser mode.
= 0.3–0.4: The main valve (usually a ball valve or butterfly valve, whose opening corresponding to the in the figure) gradually opens. The volute gradually fills with water, and a high-speed water ring is formed in the vaneless space, causing a rapid increase in pressure. Although the main valve opening has a certain influence on various parameters, this influence is mainly concentrated in the period from the fully closed to the small opening of the ball valve. When the opening is large, the influence of opening changes is relatively small, and various parameters may change slowly.
= 0.4–0.5: The power is completely stable, which is called the Primary Splash Power Stabilization Stage.
= 0.5–0.6: Runner Chamber Pressurizing Process. Through air releasing from the runner chamber, the water level in the draft tube rises, submerging the vaneless space, crown cavity, and band cavity. In this stage, the unit will undergo a certain degree of over-pressurization to prevent the possible backflow phenomenon at the moment of guide vane opening.
= 0.6–0.7: The power is completely stable, which is called the Secondary Splash Power Stabilization Stage, also known as the No-discharge Condition of the pump.
= 0.7–0.75: The guide vanes open. To reduce the negative impact brought by the hump characteristic, this stage is often relatively fast. However, this also causes the internal flow of the unit to be unstable after the guide vanes are fully opened, and the pressure will produce short-term oscillations.
> 0.8: We consider the unit to have entered the stable pump mode.
3.2. Stage Division
This study investigates a pump startup process that differs from the general startup process due to some adjustments made by the power plant staff to the control parameters. To facilitate discussion, the entire process needs to be divided into stages. During the startup process, there are hundreds or thousands of mechanical actions, and we can only focus on the relatively critical ones. The criterion for determining whether an action is critical or not is whether it affects the power or the pressure inside the flow passage. This is related to the rationality of boundary and initial condition settings in many numerical simulation studies in this field. The authors conducted a detailed second-by-second comparison of information from multiple sources, including field test data of multiple startup processes from two units, online monitoring data from the power plant, historical data from the remote control center, and message logs from the central control room. This comparison clarified the causes of most pressure changes. It should be noted that even for the same startup process, there are some differences in the sequence of mechanical actions each time. This is because the judgment criteria for some mechanical actions are independent, such as oil pressure, air pressure, and water pressure, which are related to the working conditions of the oil tank, air compressor, and turbine, respectively, while the essential connections between the three are not closely related. Then, the mechanical action based on the pressure limit is not necessarily order preserving. Figure 6 shows a schematic diagram of the stage division.
This paper divides the entire process into eight stages, S1–S8, with reference to the general pump startup process. The names of each stage are as follows.
S1: Runner Speedup Stage;
S2: Pump Condenser Stage;
S3: Butterfly Valve Opening Stage;
S4: Primary Splash Power Stabilization Stage;
S5: Runner Chamber Pressurizing Stage;
S6: Guide Vane Opening Stage;
S7: Pumping Stage.
This case does not have a Secondary Splash Power Stabilization Stage because the period has a certain impact on unit safety. Some units start opening the guide vanes early during the runner chamber pressurizing process when the pressure in the vaneless space rises to a set value. The air in the runner chamber has not been completely evacuated, and the secondary splash power has not yet stabilized.
3.3. S1: Runner Speedup Stage
3.3.1. Pressure Change and Key Moments
The data from 0–300 s is selected, and the amplitudes are appropriately adjusted to observe the changes in all parameters simultaneously, as shown in Figure 7. During the Runner Speedup Stage, apart from the sealing water ring on the inner side of the guide vanes and the lubricating water in the labyrinth seals of the crown cavity and band cavity, most of the space inside the flow passage is filled with air. The runner accelerates in the air, so the active power is closely related to the change in rotational speed. The pressure values at the measuring points inside the flow passage are relatively stable, but the pressure at point C1 increases with the rotational speed. The pressures at the V1, V2, and B also experience a slight increase.
We can evaluate the process of rotational speed and active power changes through a simple analysis. The static frequency converter (SFC) continuously increases the runner speed, and the power is used to increase the total kinetic energy of the shaft system. At 16 s (marked by the vertical line (1)), the generator frequency reaches 10%. According to the working logic of the SFC, it switches from the Pulse Commutation Stage to the Natural Commutation Stage. The machine bridge inside the SFC acts as an inverter bridge, utilizing the back electromotive force of the generator rotor to control the switching sequence [22,23]. The positive feedback control of the back electromotive force on the switching sequence is milder than the SFC forced fire, resulting in a sudden decrease in the main shaft’s rotational acceleration. The rotational acceleration of the main shaft essentially originates from power. According to the principle of energy conservation, we have Equation (9), which can be simplified to Equation (10).
is the power, is the rotational inertia of the shaft system, and is the instantaneous angular velocity. We convert to rotational speed and then determine a coefficient using the least squares method. It can be observed that has a certain agreement with the active power, as shown in Figure 8. However, at the turning points of the power, the difference between the two is relatively large. An important fact is that the active power cannot change its sign during actual operation, but the shaft system speed has its own control characteristics. After basically reaching the rated speed, it will experience short-term oscillations, and its differential will briefly become negative. In actual units, this oscillation is regulated by reactive power. Since the reactive power is generally small, accounting for about 2% of the rated power, the difference between the speed differential and the active power will only be significant when the active power is small.
3.3.2. Pressure Fluctuation
The STFT results of the pressure signals are shown in Figure 9. The frequency components of most signals are dominated by low-frequency noise. The author has observed this type of noise in almost every power plant, and its time-domain signal exhibits long-period pressure fluctuations with unfixed frequencies. Although the author tends to believe that it originates from the global design defect of the pressure measurement system, detailed research is insufficient; therefore, this study will not expand on this topic. At the draft tube elbow, there is a distinct 2 fn component, and its amplitude increases with the rotational speed, possibly originating from the sloshing of the free surface of the liquid inside the draft tube.
3.3.3. Vibration
The STFT results of the vibration signals are shown in Figure 10. To enhance contrast, the colormap of the vibration uses a logarithmic scale. The data during the rotational speed change period are quite valuable as a reference because the process of rotational speed change is similar to a sweep frequency excitation, which can excite multiple natural frequencies of the structural field. It can be seen that regardless of whether the unit is in operation or not, the vibration signals always contain background noise at certain fixed frequencies, which appear as several relatively thick horizontal lines in the STFT plot. These horizontal lines mostly originate from the natural frequencies generated by the structural components under the ubiquitous broadband excitation inside the plant. Of course, some horizontal lines are also the working frequencies of auxiliary equipment in the power plant or hydraulic excitation frequencies. However, these horizontal lines often have stable main frequencies and high kurtosis, appearing as very thin horizontal lines, which are relatively easy to distinguish from natural frequency lines. For example, the 90 fn of UBX and UBY corresponds to the magnetic field rotation frequency, and the 21 fn of HCZ corresponds to the rotor–stator interaction phenomenon. At the moments when the rotational speed curve intersects with the natural frequency lines, the vibration intensity can often reach a maximum. The test results reveal three important features.
- (1)
- Maximum value of vibration intensity: Compared to other measuring points, the vibration measuring points near the lower bracket exhibit significantly stronger vibrations. After the rotational speed exceeds 60%, intense broadband vibrations appear around 50 fn. Especially at 66.7% rotational speed, 3 intersecting curves appear in the STFT plots: the vertical line corresponding to the mechanical action, the 90 times rotational speed curve, and the 58.35 fn horizontal line. The intersection of the three curves causes the vibration to reach its maximum value throughout the Runner Speedup Stage at 178 s. Among them, the 58.35 fn horizontal line suddenly disappears at 260 s, which happens to be when the Generator Current Breaker (GCB) switches on. Therefore, this frequency may be related to the interaction between the SFC and the power grid. We selected the STFT of point LBZ for detailed observation to substantiate the above statements, as shown in Figure 11.
- (2)
- Impact of GCB switch on: The frequency range of the broadband vibration further expands after the rotational speed reaches 100%. This may be due to the fact that after the rotational speed meets the standard, the GCB switches on, the unit is connected to the power grid, and the power supply stability decreases. The SFC or the power grid has a replacement relationship for the excitation timing control of the generator magnetic poles [24]. When the unit’s rotational speed reaches 98%, the GCB is closed. At this time, there is a slight difference between the dragging frequency of the SFC and the power grid frequency, causing the unit’s rotational speed to oscillate between the two. The rotational frequency curve in the STFT splits (indicated by the white arrows in Figure 11). According to the unit message log, the SFC completely exits about 40 s after the GCB switches on, so this oscillation lasts for a period of time.
- (3)
- Changes in natural frequencies: In this test, we observed the bending of the broadband lines corresponding to the natural frequencies. In the STFT plots of the lower bracket measuring points (LBX, LBY, and LBZ), a downward bending texture can be seen starting from 150 s. A bent texture produces local maxima of vibration whenever it sweeps over different multiples of the rotational speed. The natural frequency variation characteristics are most prominent in LBY, so we carefully observe the STFT heatmap of LBY (Figure 12a). Using the peak picking method, the natural frequency variation curve can be plotted based on the intersection points of the natural frequency and rotational speed curves (Figure 12b). From the results, when the rotational speed is low, the natural frequency variation is not obvious; from 70 s to 150 s, the natural frequency slightly increases; after 150 s, the natural frequency undergoes a rapid decline. The natural frequency variation can be observed at all measuring points except for the floor, but this phenomenon is not evident for the upper bracket and head cover (Figure 13). This is because the natural frequencies at these two locations are mainly distributed in the high-frequency range. On the one hand, the change in natural frequency is about 1 fn, which means the frequency variation rate is relatively small, making it difficult to observe. On the other hand, the amplitude of high multiples of the rotational speed is very small, and it is difficult to form a noticeable resonance when intersecting with the natural frequency lines. Therefore, it is challenging to plot a complete natural frequency variation history curve.
The reason for the natural frequency variation involves rotor dynamics. As the rotational speed increases, the natural frequencies corresponding to the bending modes of the shaft system are affected by the gyroscopic effect and will split, generating forward and backward whirling frequencies. In the field of rotor dynamics, Campbell diagrams are often used to describe this phenomenon. Recently, some scholars have attempted to examine the gyroscopic effect of pump-turbine shaft systems [25]. Additionally, the increase in rotational speed leads to changes in the water body in the runner region, bearing characteristics, and generator magnetic torque, which also affect the natural frequencies. Compared to the unloaded structure, the natural frequencies of the loaded structure will increase, which we refer to as the stress-stiffening effect [26].
3.4. S2: Pump Condenser State
After experiencing short-term fluctuations in rotational speed, the unit enters a stable Pump Condenser Stage. The data from various measuring points are relatively close to the data at the end of the S1 stage. Since the frequency range of the pressure data is narrow, only vibration is analyzed in this section. Selecting data from 300–312 s, the single-sided FFT spectrum of the vibration is shown in Figure 14. We select the five frequency components with the highest amplitudes among all measuring points, as shown in Table 2. Bold fonts indicate that a frequency band exists near that frequency, while non-bold fonts indicate that the frequency is a concentrated single peak; underlines indicate peaks that are the same as the Floor. The results show that the vibration of the plant floor is closely related to the head cover vibration (102.5 fn, 139 fn) and generator rotation (30 fn).
3.5. S3: Butterfly Valve Opening Stage
3.5.1. Action Flow of Butterfly Valve
It is necessary to clarify the working process of the main valve first. For the large valve in high-pressure pipelines, the bypass valve is generally connected upstream and downstream of the main valve. Before opening the main valve, the bypass valve is used to pre-connect the front and rear of the main valve, reducing the pressure difference and protecting the main valve’s sealing ring to extend its service life. The opening degree changes of the butterfly valve and its bypass valve are shown in Figure 15. After issuing the valve opening command, the butterfly valve locking is released, and the electrically driven bypass valve opens simultaneously. After the bypass valve reaches a certain opening degree, the oil pump that drives the hydraulic main valve completes its preparation, and the oil pump starts to operate. Since the power supply for the oil pump and the pump-turbine comes from the same power grid, the instant start of this heavy-load oil pump impacts the unit’s power. When the main valve reaches its maximum opening degree, the bypass valve immediately starts to close, while the oil pump shuts down independently after a fixed 1 min delay.
3.5.2. Pressure Change and Key Moments
Figure 16 shows the parameter changes during the Butterfly Valve Opening Stage. The figure uses black vertical lines to display four key moments.
Moment 1: The butterfly valve oil pump operates.
Moment 2: The butterfly valve is fully open. At the same time, the dewatering valve inside the guide vanes closes.
Moment 3: The volute air release valve closes.
Moment 4: The butterfly valve oil pump stops.
The dewatering valve inside the guide vanes, also called the “disge valve”, is used to drain the water ring attached to the inner wall of the movable guide vanes in the vaneless space. The purpose of the water ring is to prevent air in the runner chamber from being pumped into the volute, causing air pressure loss and structural vibration. The closing of the dewatering valve inside the guide vanes signifies an increase in the water ring thickness, and some fluid will splash onto the runner blades, resulting in a power increase. From Moment 2, the unit gradually enters the Primary Priming Stage. In the initial stage, the power exhibits an oscillating rise with a period of approximately 4 s. Simultaneously, the pressure in the crown cavity and band cavity also experiences a similar oscillating rise because the water source of the water ring just comes from the lubricating water of the labyrinth sealing. When the volute is nearly filled with water, closing the volute air release valve further increases the pressure in the volute.
3.5.3. Pressure Fluctuation
The STFT plots of the pressure signals are shown in Figure 17. It needs to be emphasized again that low-frequency noise has no analytical value. The volute measuring points gradually develop a 3 fn component during the water-filling process, which disappears at Moment 2. After Moment 3, i.e., closing the volute air release valve, 2.8 fn and 3.3 fn appear and disappear at Moment 4. From the timing, the 3 fn in the volute pressure signal is related to the influence of runner rotation on the water ring during the drainage process, while 2.8 fn and 3.3 fn may be due to the frequency of vortices inside the volute caused by the butterfly valve action. After Moment 2, the 2 fn at D2 gradually disappears, while 1 fn and 2 fn gradually appear at C1 and B. This indicates that the thickening of the water ring, on the one hand, increases the influence of runner rotation on the crown cavity and band cavity and, on the other hand, increases the flow into the draft tube, changing its pressure fluctuation characteristics.
3.5.4. Vibration
The STFT plots of the vibration signals are shown in Figure 18. The results reveal two important features.
- (1)
- Natural frequencies are still changing. After careful comparison, the natural frequency changes in the S3 stage are mainly manifested in the upper bracket and lower bracket, while the natural frequencies of the head cover do not change. Since the broadband vibration of the lower bracket measuring points is quite strong, making it difficult to extract natural frequency characteristics, UBY is selected here as the measuring point with the most obvious frequency decline line for analysis. Figure 19 shows the characteristics of 3 natural frequencies near 50 fn of UBY declining during the S3 period. We selected two relatively complete ones and plotted the frequency variation curve based on the weighted average of the amplitudes within the frequency band. Due to the lack of resonance points generated by the intersection of multiple frequency lines, the accuracy of the curve is relatively low. A more noticeable frequency decline occurs after Moment 1, with the fastest decline during the volute water-filling period and a continued slow decline after the water-filling is completed. The overall frequency decline in the S3 stage is relatively large, reaching 6-8 fn, and resonance will also occur to a certain extent when passing the power frequency line. Generally speaking, the reason for the frequency decline in this stage is related to the change in the surface area of the structural field immersed in water. In water, the frequencies of most mode shapes will decrease [27], and the frequency order of different types of modes may also change or even merge [28].
- (2)
- There are significant differences in vibration characteristics before and after closing the dewatering valve inside the guide vanes (Moment 3). On the one hand, high-frequency noise is enhanced, which is related to the lack of absorption boundaries for water sound after the water body is completely enclosed. On the other hand, there are obvious changes in the frequency components below 50 fn, especially in the head cover. We select data from 350–362 s and 400–412 s for a spectral comparison, as shown in Figure 20.
From the timing perspective, in the pressure fluctuation results, the crown cavity and band cavity show a significant increase in rotational-frequency-related components after Moment 3, indicating that the difference in vibration characteristics before and after Moment 3 is most likely due to the hydraulic excitation force of the water body inside the crown cavity and band cavity on the structure.
From the frequency perspective, almost all vibration measuring points exhibit a prominent 21 fn. Before closing the dewatering valve inside the guide vanes, the point Floor is dominated by 12 fn and 30 fn, while after closing the dewatering valve inside the guide vanes, the most prominent 21 fn appears, followed by 19 fn and 22 fn. For the upper bracket, 11 fn dominates before the valve closure, followed by 7 fn as the blade passing frequency (BPF). After the valve closure, 11 fn and other nearby multiples merge and shatter into a frequency band, and 19 fn additionally appears. For the lower bracket, before the valve closure, 12 fn, 36 fn, and 48 fn dominate the vibration. Since the number of coupling bolts is 6, these frequencies may originate from main shaft eccentricity or misalignment. After the valve closure, the 36 fn of LBX and LBY is enhanced, while LBZ exhibits a frequency band around 23.25 fn. For the head cover, it is mainly dominated by 19 fn and 21 fn, with HCY dominated by 19 fn, HCZ dominated by 21 fn, and both being relatively prominent in HCX. The main frequency of vibration in HCZ is 21 fn both before and after the valve closure, with the amplitude increasing from 0.0109 m3/s to 0.5368 m3/s, a 48-fold increase.
Combining the results of the pressure and vibration signals, it is not difficult to see that after closing the dewatering valve inside the guide vanes, the rotational-speed-related pressure fluctuations abruptly increase. According to the pressure diameter mode theory [29], through Equation (11), it can be known that 21 fn is the rotational frequency of the 1ND, 2ND, and 3ND pressure modes caused by rotor–stator interaction (for example, 1 = 3 × 7 − 1 × 20). This indicates that the opening and closing of the dewatering valve inside the guide vanes play a decisive role in the intensity of the hydraulic excitation of the rotor–stator interaction phenomenon on the unit.
3.6. Primary Splash Power Stabilization Stage
The S4 stage has a relatively long stable period, during which all signals do not exhibit significant time-varying characteristics. Therefore, data of 520–550 s are selected for analysis, and the single-sided FFT spectrum of the vibration is shown in Figure 21. At Floor, 21 fn and 42 fn are absolutely dominant. Following the analysis in S3, this indicates that the pressure fluctuations caused by the rotor–stator interaction phenomenon have a significant impact on the hydraulic excitation of structural components and the overall vibration situation of the plant during this stage. In the upper bracket, 90 fn, which is 4 times the number of magnetic poles, dominates, followed by 7 fn and 21 fn. In the lower bracket, in addition to the large amplitude of 21 fn, 36 fn, 48 fn, and 60 fn, which are frequencies related to the coupling bolts, are also relatively prominent. Near the head cover, the amplitudes of 21 fn and 42 fn are larger than in all previous stages, and the high-frequency natural frequency components are almost submerged. This indicates that the head cover is affected by the rotor–stator interaction and is in an absolutely dominant forced vibration state in the S4 stage. This is in contrast to the S2 stage, where the natural frequencies of the head cover occupied the main components of the vibration.
This is one of the most illuminating findings of this study. In current numerical simulations of Francis pump-turbines, the dewatering valve inside the guide vanes is almost universally neglected, with researchers assuming its impact to be negligible compared to that of the guide vanes. However, the closure of the dewatering valve inside the guide vanes induces a fundamental transition in the vibrational behavior of the structural components, shifting from predominantly self-excited vibrations to forced vibrations. This transition fundamentally alters the stability characteristics of the unit, which will bring key inspiration for numerical studies.
3.7. S5–S7: Guide Vane Opening and Adjacent Time Period
3.7.1. Pressure Change and Key Moments
Since there are many short-lived stages near the moment of guide vane opening, we will examine S5, S6, and S7 together. Due to a deviation in the estimation of the crown cavity pressure, the sensor installed at C1 exceeded the range after opening the guide vanes. Its DC value is supplemented using the power plant monitoring data, but the pressure fluctuation information is missing. In fact, C1 and B have similar characteristics, and readers can use the information from point B for appropriate reference. Figure 22 shows the detailed parameter changes in the S5–S7 stage. The figure uses black vertical lines to display five key moments, which are 613 s, 665 s, 682 s, 700 s, and 736 s.
Moment 1: the crown cavity evacuation valve opens.
Moment 2: the runner chamber evacuation valve opens.
Moment 3: the guide vanes start to move.
Moment 4: the guide vanes stop moving.
Moment 5: the head cover evacuation valve and the runner chamber evacuation valve close simultaneously.
The impact of these three “valves”:
- (1)
- Influence of the crown cavity evacuation valve
The crown cavity evacuation valve is located around C2. Inside the crown cavity, there are two levels of labyrinth seals, which prevent the air in the crown cavity from being evacuated in time during the water-filling and air evacuation of the runner chamber. Therefore, the crown cavity evacuation valve needs to be opened in advance before the water-filling of the runner chamber. After the crown cavity evacuation valve is opened, the pressure in front of and behind the crown labyrinth seal, the band cavity, and the draft tube inlet continuously decreases, while the draft tube elbow is slightly affected (Figure 23). This phenomenon has not been reported in previous studies. Before opening the runner chamber evacuation valve, the pressure drop of the three is about 15 m, which is relatively significant. Among them, the pressure changes in front of the crown labyrinth seal and the band cavity are delayed. The air evacuation first occurs behind the crown labyrinth seal, the balancing pipe is relatively thick, so the pressure change at the draft tube inlet is basically synchronized with that behind the crown labyrinth seal. The front of the crown labyrinth seal and the band cavity are connected to them through labyrinth seals, while the lubricating water supply to the labyrinth seals is not interrupted, making it difficult for the air to be evacuated from the two cavities, resulting in a delay in pressure changes.
- (2)
- Influence of the runner chamber evacuation valve
After the runner chamber evacuation valve is opened, the pressure changes in the crown cavity and the band cavity are not synchronized. Table 3 shows the inflection point moments of the pressure rise at various locations after opening the runner chamber evacuation valve. It can be seen that the pressure rise is divided into three batches: the pressure in the band cavity and in front of the crown labyrinth seal rises first, with the band cavity slightly faster than the crown cavity. After 2 s, the pressure behind the crown labyrinth seal, at the draft tube elbow, and at the draft tube inlet rises successively. The pressure in the vaneless space rises last after the following 1s. From the curve shape, the data in the vaneless space may have potential problems, which we will discuss in the later text. It should be clarified that the core purpose of pressurizing the runner chamber is to increase the pressure in the runner chamber and the vaneless space. The areas behind the crown labyrinth seal and the draft tube are not on the outflow path of the high-pressure fluid, so the pressure drops and remains low in the subsequent stages. However, during the rapid pressurization process, asynchronous temporary pressure rises still occur, which means that the pressure response characteristics of the pump startup transient process will be significantly influenced by the labyrinth seals.
- (3)
- Influence of guide vane opening
At the beginning of the guide vane opening, the volute pressure exhibits a sudden increase. Here, we compare the test data and the simulation results of the one-dimensional method of characteristics (1D-MOC) for this phenomenon. The MOC simplifies the pressure pipeline as a one-dimensional system, simplifies the continuity equation and momentum equation according to pipeline assumptions, and, finally, solves a set of quasi-hyperbolic partial differential equations using the method of characteristics to predict water hammer waves in complex pipeline systems [30]. Figure 24 shows a comparison of the test data and the MOC simulation results for the pressure at the volute inlet and the volute tongue.
The overall results are easy to understand: the opening of the guide vanes causes high-pressure fluid to rush into the volute, quickly generating a large pressure, which then gradually oscillates and stabilizes. The simulation results are quite accurate in predicting the pressure before the guide vane opening and after the guide vanes are fully opened, with an error of less than 0.5 m compared to the test data. The moments when the pressure reaches its maximum are also relatively accurate, with the first 4 peaks having an error of no more than 0.1 s compared to the test results. However, deviations appear afterwards, mainly because the test data lose their regular oscillation waveform, which is obviously related to the internal flow characteristics of the unit. The complex geometric field internal flow characteristics are factors that the 1-D MOC cannot examine. Additionally, there are certain deviations in the prediction of the maximum pressure. The simulation results predict that the maximum pressure at the volute tongue appears at the first peak, reaching 198 m, while the test results show that the maximum pressure at the volute tongue appears at the fourth peak, with a maximum pressure of 167 m. However, the maximum pressure at the volute inlet does occur at the first peak, with a pressure of 164 m. Evidently, the 1D-MOC simply simplifies the transient characteristics of the pump-turbine to the movement of the operating point on the characteristic curve, significantly underestimating the absorption capacity of the runner internal flow in on the water hammer wave.
3.7.2. Pressure Fluctuation
Figure 25 shows the STFT plots of the pressure fluctuation during the 600–800 s. The pressure fluctuation exhibits the following features.
V1 and V2 are dominated by low-frequency noise before the guide vane opening (Moment 3), and clear 1 fn and 2 fn components appear after the guide vane opening. D3 shows slight 2.6 fn and 3.6 fn components. VS exhibits a stable 3 fn component after the opening of the runner chamber evacuation valve (Moment 2), but it disappears in the latter half of the guide vane opening process. B has relatively clear 1 fn and 2 fn components before the guide vane opening, and 3 fn and its multiples appear during the guide vane opening process. After the guide vane opening, 1 fn and 2 fn disappear. Considering the high similarity between the area behind the crown labyrinth seal and the band cavity, C1 may also possess these characteristics. There are no obvious features at C2 throughout S5–S7.
The draft tube elbow (D2) exhibits very clear characteristic changes, and its enlarged view is shown in Figure 26. Between Moment 1 and Moment 2, the opening of the crown cavity evacuation valve means that the free surface inside the draft tube has already begun to gradually rise, while the active power remains unchanged during this stage, indicating that the water level has not yet risen to the runner blades. At this time, there is a clear 5 fn frequency band, producing an upward bending branch. Since the increase in liquid column length will lead to an increase in the sloshing frequency of the free surface, it further explains that this frequency band may originate from the sloshing frequency of the free surface or its multiples. As the pressurization process begins, the free surface will be shattered by the runner blades, and the flow phenomenon corresponding to the frequency band will change. The center frequency decreases and rises again after closing the two evacuation valves. Additionally, after the guide vane opening, 7 fn and 21 fn appear at the elbow, which are almost non-existent before the guide vane opening, indicating that the increase in discharge enhances the influence of the runner blades on the upstream. The author’s previous numerical study also mentioned that in the No-discharge Condition of the pump mode, the relative velocity between the runner and the fluid inside the runner is very low, and the water body and blades rotate as a whole rigid body, with only the fluid migration at the runner edge being evident [31]. In addition, after the guide vane opening, 2 fn and the frequency band centered at 1.5 fn are significantly enhanced, with the center frequency of the 1.5 fn band being slightly lower than that before the guide vane opening.
3.7.3. Vibration
Figure 27 shows the STFT results of the vibration. Since the S5–S7 period has relatively obvious changes in vibration intensity, we have plotted Figure 28 to show the 95% confidence peak-to-peak values of the vibration during the 600–800 s period. The guide vane opening process is the stage with the strongest vibration, lasting about 17 s. There are 2 extreme points in this process, located at the moment when the guide vanes just start to open (4.3 s/17 s) and when the guide vanes are close to being fully open (14.5 s/17 s). After the guide vanes are fully open, the vibration intensity of the floor and head cover continues to increase for a period of time (about 8 s).
During the guide vane opening process, the main frequency band of enhanced vibration is between 10 and 50 fn, which is relatively narrow and within the main distribution range of hydraulic excitation frequencies. This means that the superposition of multiple factors may produce strong vibrations. During this stage, the power plant staff reported the occurrence of strong vibrations inside the plant. Figure 29 shows the p-p values of the head cover displacement sensor reported by the power plant during one of the previous startups. Although the time accuracy is low, it can still be seen that two vibration peaks also appear during the guide vane opening process, with the maximum p-p value reaching as high as 280 μm. According to the standard IEC60994, this value should be lower than 90 μm. Although this value can be appropriately relaxed for transient conditions, for pumped storage power stations that frequently undergo startup and shutdown processes, p-p values above 200 μm undoubtedly increase the safety risks of the plant.
Except for the guide vane opening stage, Moments 1, 2, and 5 do not significantly influence the frequency characteristics of the acceleration signals. Therefore, it is more concise and intuitive to compare the spectral characteristics before and after the guide vane opening. The vibration spectra of 620–650 s and 710–740 s are compared, as shown in Figure 30. For the Floor, 21 fn and 42 fn further increase after opening the guide vanes, with an increase of 128% and 97%, respectively. For the upper bracket measuring points, 21 fn is significantly enhanced after opening the guide vanes, but the dominant frequency remains 90 fn, which is four times the number of magnetic pole pairs. For the lower bracket measuring points, the 21 fn of LBZ is significantly enhanced; the 21 fn amplitude of LBX and LBY does not change significantly, but the coupling-related frequency of 48 fn decreases notably, and the single peak of 60 fn shatters into a frequency band. This indicates that the stability of the coupling is improved after opening the guide vanes. For the head cover measuring points, surprisingly, 21 fn and 42 fn decrease substantially after opening the guide vanes, while the amplitude of the frequency bands corresponding to the natural frequencies in the high-frequency range increases significantly. For HCX, 21 fn dominates absolutely before opening the guide vanes, while after opening the guide vanes, continuous frequency bands appear around 174 fn, 186 fn, 201 fn, 220 fn, and 271 fn, dominating the spectrum. For HCY, before opening the guide vanes, the amplitudes of 19 fn, 21 fn, 42 fn, the 180 fn band, and the 215 fn band are roughly equal, with the frequency band energy being stronger and the natural frequencies slightly dominating. After opening the guide vanes, 21 fn slightly decreases, while the amplitudes of the 180 fn and 215 fn bands increase substantially, making the natural frequencies dominate absolutely.
Similar phenomena have been reported: Doujak et al. [32] conducted a field test for the fatigue characteristics of a Francis turbine and found that the amplitude of the blade passing frequency and its multiples in the accelerometer signals at the bearing was lower under partial load conditions than under rated conditions, while the high-frequency amplitude increased significantly. However, the study did not explain the reason for the decrease in low-frequency amplitudes and speculated that the reason for the high-frequency increase was the vortex shedding frequencies (VOS), but still lacked sufficient evidence. In fact, the vibration measuring points above the head cover are close to the outflow of the movable guide vanes, which is the closest position to the 21 fn vibration source. If the 21 fn of the plant floor measuring points farther away has already been enhanced, then, in accordance with the past mental inertia, the 21 fn of the head cover should be more enhanced. This has been verified in the comparison before and after the opening of the dewatering valve inside the guide vanes, but it is not the case for before and after the guide vane opening. 21 fn and 42 fn are essentially pulsations in the horizontal plane, and their excitation effect is closely related to the flow rate. Before the guide vane opening, the high-pressure fluid cannot be discharged and undergoes intense mixing inside the unit. Under the influence of viscous forces, the pressure fluctuation will manifest in various directions inside the unit. After the guide vane opening, the flow rate increases, and the fluid containing large 21 fn pressure fluctuation rapidly discharges from the guide vane, producing a more widespread impact on the areas outside the unit. This causes the vibration of the areas outside the unit to increase, while the vibration of the metal structural components near the head cover decreases.
3.8. Other Discussions
3.8.1. Sloshing Frequency of Draft Liquid Level
In the previous discussion, the pressure fluctuation frequency bands at the draft tube elbow were mentioned. One is 2 fn, which appears as the rotational speed increases. The other is the upward bending texture during the runner chamber pressurization. Here, we provide a simple evaluation of this pressure fluctuation. Figure 31 shows the full-process STFT of the draft tube pressure fluctuation. It can be clearly seen that there are 2 frequency bands near 2 fn and 5 fn, and their center frequencies are in a state of continuous and slow decline. For the pump condenser mode, since the air in the runner chamber is constantly lost, the unit continuously injects high-pressure air into the runner chamber to keep the water level from rising. Some units start to supplement air when the water level rises to a specified value, while others, like in this study, supplement air continuously. At this time, the water level will keep slowly declining, causing the center of the frequency band to slowly shift downward until the water level rises rapidly during the runner pressurization, and the center of the frequency band also rises accordingly.
According to Vagnoni’s research [17], the rotation of the runner excites the liquid surface through air, and the response of the liquid surface is also affected by the natural frequency of the water body and the wavenumber of the gravity waves. Based on the definition of the Froude number for the free liquid surface inside a cylindrical container:
where is the equivalent diameter of the draft tube (4.1 m), is the gravitational acceleration, and is the oscillation frequency (2 fn), it can be obtained that Fr ≈ 7.6. Vagnoni’s research confirmed that when the Froude number is around 1, the sloshing behavior of the free surface in the draft tube will undergo a qualitative change. Therefore, the Froude number in this study is already quite large, and the inertial force of the flow in the draft tube dominates, while gravity waves become a secondary factor. At the same time, according to the theoretical formula for the natural frequency of free surface sloshing [33]:
is the root of the th order Bessel function, which is 1.841, 5.331, and 8.536 for = 1, 2, 3. Therefore, it can be obtained that < 1.0045 Hz << 6.67Hz (2 fn). Equations (12) and (13) explain that the sloshing frequency of the free surface at the draft tube elbow is far from the natural frequency of the water body, and the pressure fluctuation appears to be influenced by the forced excitation related to the runner rotation. However, as the rotational speed gradually increases, the main frequency does not change; instead, the water level height affects this frequency. Therefore, the 2 fn and 5 fn components cannot be explained from the perspective of either “self-excited vibration” or “forced vibration,” which may require further in-depth exploration in the field of multiphase flow in the future.
3.8.2. Defects of Pressure Measurement Point at Vaneless Space
The pressure-measuring point in the vaneless space may have fatal defects. Except for the pressure increase during the Runner Chamber Pressurization Stage, there are no obvious characteristics in any previous stages. In fact, there are two pressure-measuring points in the vaneless space on-site, but they both exhibit the same problem. The data from the other measuring point are even worse, with a serious lag in the change of the DC value of the pressure. One tentative speculation is that there is a problem with the installation location of the measuring points. The vaneless space pressure-measuring points are drilled at positions between two movable guide vanes on the head cover. Due to the close distance between the guide vanes and the runner in this unit and the limitations of the head cover structure, the pressure-measuring holes are easily installed at guide vane end wall clearance. This leads to the situation where, before the runner chamber pressurization, the pressure-measuring holes can only measure the air pressure inside the end wall clearance. Only when the runner chamber is completely filled with water and the pressure is high can the pressure-measuring holes measure the water body. Moreover, it is not until the guide vanes open and misalign with the pressure-measuring holes that the holes are fully immersed in water. Figure 32 shows the installation position of the pressure-measuring pipes in the vaneless space, and it can be seen that the radial range for installing the pressure-measuring holes is very limited. Figure 33 shows the pressure change in the vaneless space during the guide vane opening process, and it can be observed that the pressure in the vaneless space exhibits a sudden increase in slope at 697 s, increasing the possibility of the above speculation.
3.8.3. Credible Frequency Range of Pressure Fluctuation
The diameter and length of the piezometer tube have an important influence on the measurement of the amplitude and phase of the pressure [34]. According to the standard document from the International Electrotechnical Commission (IEC60994), when conducting pressure fluctuation tests for long-distance pressure measurement pipelines, the calculation method for the first critical frequency is as follows:
where is the sound velocity in the pipeline, is the length of the pipeline, is the volume of the transducer chamber, and is the cross-sectional area of the pipeline. Based on the estimation of the actual pipeline data on-site, 7 Hz, which means that pressure pulsations above 70 Hz are unreliable, while pressure fluctuations between 7 and 70 Hz will experience a certain degree of attenuation. The on-site testing conditions can only be like this—although it is fatal for some high-frequency information (such as pressure fluctuation caused by rotor–stator interaction). The accelerometers arranged around the flow passage can provide compensation for high-frequency information to a certain extent.
4. Conclusions
This paper conducted a stability test on the pump mode startup process of a prototype pump-turbine and carried out a comprehensive investigation of the key moments during the startup process, combining information from multiple sources. The instability factors for each time period were analyzed, and some of the more inspiring conclusions are as follows:
- (1)
- The strongest vibration occurs in the guide vane opening stage. The instantaneous vibration intensity (280 μm) in this process is far beyond the specified value of the IEC standard (90 μm), dominated by the broadband vibration of 10–50 fn.
- (2)
- During the process of rotational speed change and water-filling, the natural frequencies of the unit’s metal structural components varied, which may be related to the gyroscopic effect of the rotor or the stress stiffening effect.
- (3)
- The opening of the guide vanes and dewatering valve inside the guide vanes can significantly reduce the amplitude of the rotor–stator interaction frequency (21 fn) in the head cover vibration. The head cover transitions from a tendency to exhibit forced vibration to a tendency to exhibit self-excited vibration.
- (4)
- During the pump condenser process, the pressure fluctuation in the draft tube exhibited the frequency of free liquid surface sloshing, and the prediction of this frequency by current similar studies is not accurate.
The startup process of pump-turbines in pump mode is a fascinating yet challenging area of study, as it involves intricate multiphase flow dynamics and fluid–structure interactions. While field tests offer invaluable insights into the critical phenomena that occur during this transient operation, the complexity of the system often hinders a thorough analysis. The various trivial phenomena described in this paper aim to provide a reference for researchers in this field, helping them discover more meaningful research directions.
Author Contributions
Conceptualization, M.X. and Z.W.; data curation, M.X. and W.Z.; formal analysis, M.X.; funding acquisition, Z.W. and M.Q.; investigation, M.X. and W.Z.; methodology, M.X. and W.Z.; resources, Z.W. and M.Q.; software, M.Q.; supervision, Z.W.; validation, M.X., W.Z., Z.W. and M.Q.; writing—original draft, M.X.; writing—review and editing, W.Z., Z.W. and M.Q. All authors have read and agreed to the published version of the manuscript.
Funding
This research was supported by the project “Research Project on Strong Vibrations in the Head Cover of Baishan Pumped Storage Power Station (No. 525784270002)” of State Grid Xinyuan Co., Ltd.
Data Availability Statement
For the sake of information security, the original data used in this paper will not be disclosed.
Acknowledgments
The authors thank the leadership and field staff of Baishan Power Station in the testing work, and Hunan Shuhua Technology for the support of testing equipment and debugging technology.
Conflicts of Interest
Author Mu Qiao was employed by the company State Grid Xinyuan Co., Ltd. The remaining authors declare that the research was conducted in the absence of any commercial or financial relationships that could be construed as a potential conflict of interest.
References
- Mallapaty, S. How China Could Be Carbon Neutral by Mid-Century. Nature 2020, 586, 482–483. [Google Scholar] [CrossRef]
- Liu, Y.X.; He, Q.; Shi, X.P.; Zhang, Q.X.; An, X.G. Energy storage in China: Development progress and business model. J. Energy Storage 2023, 72, 108240. [Google Scholar] [CrossRef]
- Yang, Z.Y.; Cheng, Y.G.; Xia, L.S.; Meng, W.W.; Liu, K.; Zhang, X.X. Evolutions of flow patterns and pressure fluctuations in a prototype pump-turbine during the runaway transient process after pump-trip. Renew. Energ. 2020, 152, 1149–1159. [Google Scholar] [CrossRef]
- Sun, L.; Ma, Y.; Xie, T.; Kang, H.; Li, Z.; He, R. A Review of Hydraulic and Mechanical Vibration Characteristics of Pumped Storage Units. In Proceedings of the 2023 6th International Conference on Power and Energy Applications (ICPEA), Weihai, China, 24–26 November 2023; pp. 50–58. [Google Scholar]
- Zhang, Y.-L.; Zhu, Z.-C.; Dou, H.-S.; Cui, B.-L. A Generalized Euler Equation to Predict Theoretical Head of Turbomachinery. Int. J. Fluid Mech. Res. 2015, 42, 26–38. [Google Scholar] [CrossRef]
- Zhang, Y.-L.; Zhao, Y.-J. The atypical startup characteristics of a pump as turbine. Energy Sci. Eng. 2022, 10, 132–144. [Google Scholar] [CrossRef]
- Zhang, Y.L.; Li, J.F.; Zhu, Z.C. The acceleration effect of pump as turbine system during starting period. Sci. Rep. 2023, 13, 4913. [Google Scholar] [CrossRef] [PubMed]
- Junginger, J. Feasibility of Transient Model Tests in a Closed-Loop Test Rig with the Example of a Reversible Pump Turbine; Universität Stuttgart, Institut für Strömungsmechanik und Hydraulische Strömungsmaschinen: Stuttgart, Germany, 2023. [Google Scholar]
- Liu, J.T.; Liu, S.H.; Sun, Y.K.; Jiao, L.; Wu, Y.L.; Wang, L.Q. Three-dimensional flow simulation of transient power interruption process of a prototype pump-turbine at pump mode. J. Mech. Sci. Technol. 2013, 27, 1305–1312. [Google Scholar] [CrossRef]
- Yang, Z.Y.; Cheng, Y.G.; Liu, K.; Hou, X.X.; Zhang, X.X.; Wang, X.; Ding, J.H. Three-Dimensional CFD Simulations of Start-Up Processes of a Pump-Turbine Considering Governor Regulation. Energies 2021, 14, 8507. [Google Scholar] [CrossRef]
- Hu, J.H.; Yang, J.D.; Zeng, W.; Yang, J.B. Transient Pressure Analysis of a Prototype Pump Turbine: Field Tests and Simulation. J. Fluids Eng. 2018, 140, 071102. [Google Scholar] [CrossRef]
- Fu, X.L.; Li, D.Y.; Song, Y.C.; Wang, H.J.; Wei, X.Z. High-amplitude pressure fluctuations of a pump-turbine with large head variable ratio during the turbine load rejection process. Sci. China Technol. Sc. 2023, 66, 2575–2585. [Google Scholar] [CrossRef]
- Mao, Z.Y.; Tao, R.; Chen, F.N.; Bi, H.L.; Cao, J.W.; Luo, Y.Y.; Fan, H.G.; Wang, Z.W. Investigation of the Starting-Up Axial Hydraulic Force and Structure Characteristics of Pump Turbine in Pump Mode. J. Mar. Sci. Eng. 2021, 9, 158. [Google Scholar] [CrossRef]
- Fu, X.L.; Li, D.Y.; Wang, H.J.; Cheng, Y.G.; Wei, X.Z. Hydraulic fluctuations during the pump power-off runaway transient process of a pump turbine with consideration of cavitation effects. J. Hydrodyn. 2021, 33, 1162–1175. [Google Scholar] [CrossRef]
- Tao, R.; Zhou, X.Z.; Xu, B.C.; Wang, Z.W. Numerical investigation of the flow regime and cavitation in the vanes of reversible pump-turbine during pump mode’s starting up. Renew. Energ. 2019, 141, 9–19. [Google Scholar] [CrossRef]
- Vagnoni, E.; Andolfatto, L.; Guillaume, R.; Leroy, R.; Avellan, F. Rotating air-water ring in the vaneless gap of a pump-turbine operating in condenser mode. Int. J. Multiphas Flow. 2018, 105, 112–121. [Google Scholar] [CrossRef]
- Vagnoni, E.; Favrel, A.; Andolfatto, L.; Avellan, F. Experimental investigation of the sloshing motion of the water free surface in the draft tube of a Francis turbine operating in synchronous condenser mode. Exp. Fluids 2018, 59, 95. [Google Scholar] [CrossRef]
- Zhang, F.; Chen, S.; Chen, Z.; Zhu, B. Internal flow characteristics of water-ring of pump-turbine during pump mode’s starting-up. J. Phys. Conf. Ser. 2022, 2217, 012030. [Google Scholar] [CrossRef]
- Hou, X.X.; Cheng, Y.G.; Yang, Z.Y.; Liu, K.; Zhang, X.X.; Liu, D.M. Influence of Clearance Flow on Dynamic Hydraulic Forces of Pump-Turbine during Runaway Transient Process. Energies 2021, 14, 2830. [Google Scholar] [CrossRef]
- Li, L.; Cai, H.Y.; Han, H.X.; Jiang, Q.T.; Ji, H.B. Adaptive short-time Fourier transform and synchrosqueezing transform for non-stationary signal separation. Signal Process 2020, 166, 107231. [Google Scholar] [CrossRef]
- Mateo, C.; Talavera, J.A. Bridging the gap between the short-time Fourier transform (STFT), wavelets, the constant-Q transform and multi-resolution STFT. Signal Image Video Process. 2020, 14, 1535–1543. [Google Scholar] [CrossRef]
- Wang, D.; Yang, B.; Li, G.; Tao, Y.; Sang, B. Analysis of a Static Start-up Control Strategy for Pumped Storage Power Plant Unit. Phys. Procedia 2012, 24, 155–162. [Google Scholar] [CrossRef]
- Long, F.; Wan, L.; Pan, S.; Liu, X.; Wang, Z.; Zhao, R. Research on the Differential Protection of the SFC Output Transformer for Pumped Storage Hydro Unit. J. Phys. Conf. Ser. 2021, 2005, 012118. [Google Scholar] [CrossRef]
- Deng, W.T.; Zhang, Z.; Lin, Z.W.; Zhu, C.C.; He, Q. GCB Crust Discharge Analysis during Transformer Surge Closing. Hubei Electr. Power 2008, 32, 26–27,43. (In Chinese) [Google Scholar] [CrossRef]
- Cao, J.; Luo, Y.; Liu, X.; Presas, A.; Deng, L.; Zhao, W.; Xia, M.; Wang, Z. Numerical theory and method on the modal behavior of a pump-turbine rotor system considering gyro-effect and added mass effect. J. Energy Storage 2024, 85, 111064. [Google Scholar] [CrossRef]
- Peng, G.J.; Zhang, Z.R.; Bai, L. Wet Modal Analyses of Various Length Coaxial Sump Pump Rotors with Acoustic-Solid Coupling. Shock. Vib. 2021, 2021, 8823150. [Google Scholar] [CrossRef]
- Valero, C.; Huang, X.; Egusquiza, E.; Farhat, M.; Avellan, F. Modal behavior of a reduced scale pump turbine impeller. Part II: Numerical simulation. In IOP Conference Series: Earth and Environmental Science; Iop Publishing: Bristol, UK, 2010; Volume 12. [Google Scholar] [CrossRef]
- Wang, W.; Zhou, L.J.; Wang, Z.W.; Escaler, X.; De la Torre, O. Numerical Investigation Into the Influence on Hydrofoil Vibrations of Water Tunnel Test Section Acoustic Modes. J. Vib. Acoust. 2019, 141, 051015. [Google Scholar] [CrossRef]
- Doerfler, P. On the role of phase resonance in vibrations caused by blade passage in radial hydraulic turbomachines. In Proceedings of the 12th IAHR Symposium, Stirling, UK, 27–30 August 1984. [Google Scholar]
- Zhou, X.J.; Ye, Y.J.; Zhang, X.Y.; Yang, X.W.; Wang, H.J. Refined 1D-3D Coupling for High-Frequency Forced Vibration Analysis in Hydraulic Systems. Energies 2022, 15, 6051. [Google Scholar] [CrossRef]
- Hu, H.P.; Xia, M.; Qiao, M.; Wang, W.; Wang, J.Z.; Wang, Z.W. A Simulation Study of Hydraulic Vibration caused by Clearance Flow in a Pump Turbine. In IOP Conference Series: Earth and Environmental Science; IOP Publishing: Bristol, UK, 2022; Volume 1079. [Google Scholar] [CrossRef]
- Doujak, E.; Maly, A.; Unterluggauer, J.; Haller, F.; Maier, M.; Blasbichler, C.; Stadler, S. Fatigue Strength Analysis of a Prototype Francis Turbine in a Multilevel Lifetime Assessment Procedure Part III: Instrumentation and Prototype Site Measurement. Energies 2023, 16, 1148. [Google Scholar] [CrossRef]
- Ibrahim, R.A. Liquid Sloshing Dynamics: Theory and Applications; Cambridge University Press: Cambridge, UK, 2005. [Google Scholar]
- Yadav, H.; Venugopal, A.; Prabhu, S.V.; Agrawal, A. Study on connecting tube dynamics for transient pressure measurement. Sādhanā 2020, 45, 82. [Google Scholar] [CrossRef]
Figure 1.
Baishan Pumped Storage Hydropower Station.

Figure 2.
Position of the pressure-measuring points and abbreviations.

Figure 3.
Position of vibration measuring points and abbreviations.

Figure 4.
Installation of sensors. (a) Pressure sensor. (b) Displacement sensor—point F. (c) Acceleration sensor—point HCZ.
Figure 4.
Installation of sensors. (a) Pressure sensor. (b) Displacement sensor—point F. (c) Acceleration sensor—point HCZ.

Figure 5.
Abstract general startup process of pump mode.

Figure 6.
Stage division of studied startup process.

Figure 7.
Pressure of Runner Speedup Stage (S1). (1): SFC switches to Natural Commutation Stage.

Figure 8.
Comparison of active power and . (1): SFC phase switching.

Figure 9.
STFT of the pressure signals (0–300 s).

Figure 10.
STFT of the vibration signals (0–300 s).


Figure 11.
High contrast STFT image of LBZ.

Figure 12.
High-contrast vibration STFT heatmap of LBY and peak picking.

Figure 13.
High contrast partial vibration STFT heatmap of UBY and HCY. The black arrows indicate the change of natural frequencies.
Figure 13.
High contrast partial vibration STFT heatmap of UBY and HCY. The black arrows indicate the change of natural frequencies.

Figure 14.
Vibration spectrum of Pump Condenser State (S2).

Figure 15.
Opening sequence diagram of butterfly valve and its bypass valve.

Figure 16.
Pressure of Butterfly Valve Opening Stage (S2).

Figure 17.
STFT of the pressure signals (300–500 s).


Figure 18.
STFT of the vibration signals (300–500 s).

Figure 19.
High-contrast vibration STFT heatmap of UBY and peak picking. The black arrows indicate the change of natural frequencies.
Figure 19.
High-contrast vibration STFT heatmap of UBY and peak picking. The black arrows indicate the change of natural frequencies.

Figure 20.
Vibration spectrum before and after closing the disge valves.

Figure 21.
Vibration spectrum of Primary Splash Power Stabilization Stage. The red dashed box represents the y-coordinate zoom-in indicated by the red arrow.
Figure 21.
Vibration spectrum of Primary Splash Power Stabilization Stage. The red dashed box represents the y-coordinate zoom-in indicated by the red arrow.

Figure 22.
Pressure change around the Guide Vane Opening Stage (S5–S7).

Figure 23.
Pressure drop before runner chamber pressurizing.

Figure 24.
Volute pressure variation during guide vane opening.

Figure 25.
STFT of the pressure signals (600–800 s).


Figure 26.
Detailed STFT of Draft Tube Elbow (D2).

Figure 27.
STFT of the vibration signals (600–800 s).

Figure 28.
95% confidence acceleration p-p values (600–800 s).

Figure 29.
95% confidence displacement p-p values of head cover from plant report.

Figure 30.
Vibration spectrum before and after opening GVs. The blue dashed box represents the y-coordinate zoom-in indicated by the blue arrow.
Figure 30.
Vibration spectrum before and after opening GVs. The blue dashed box represents the y-coordinate zoom-in indicated by the blue arrow.

Figure 31.
Pressure fluctuation STFT of point D2.

Figure 32.
Structure diagram near the vaneless space pressure hole. The relative proportions are consistent with the design drawings.
Figure 32.
Structure diagram near the vaneless space pressure hole. The relative proportions are consistent with the design drawings.

Figure 33.
Guide vane opening and vaneless space pressure (600–800 s). Black vertical line: the moment of abrupt change of .
Figure 33.
Guide vane opening and vaneless space pressure (600–800 s). Black vertical line: the moment of abrupt change of .


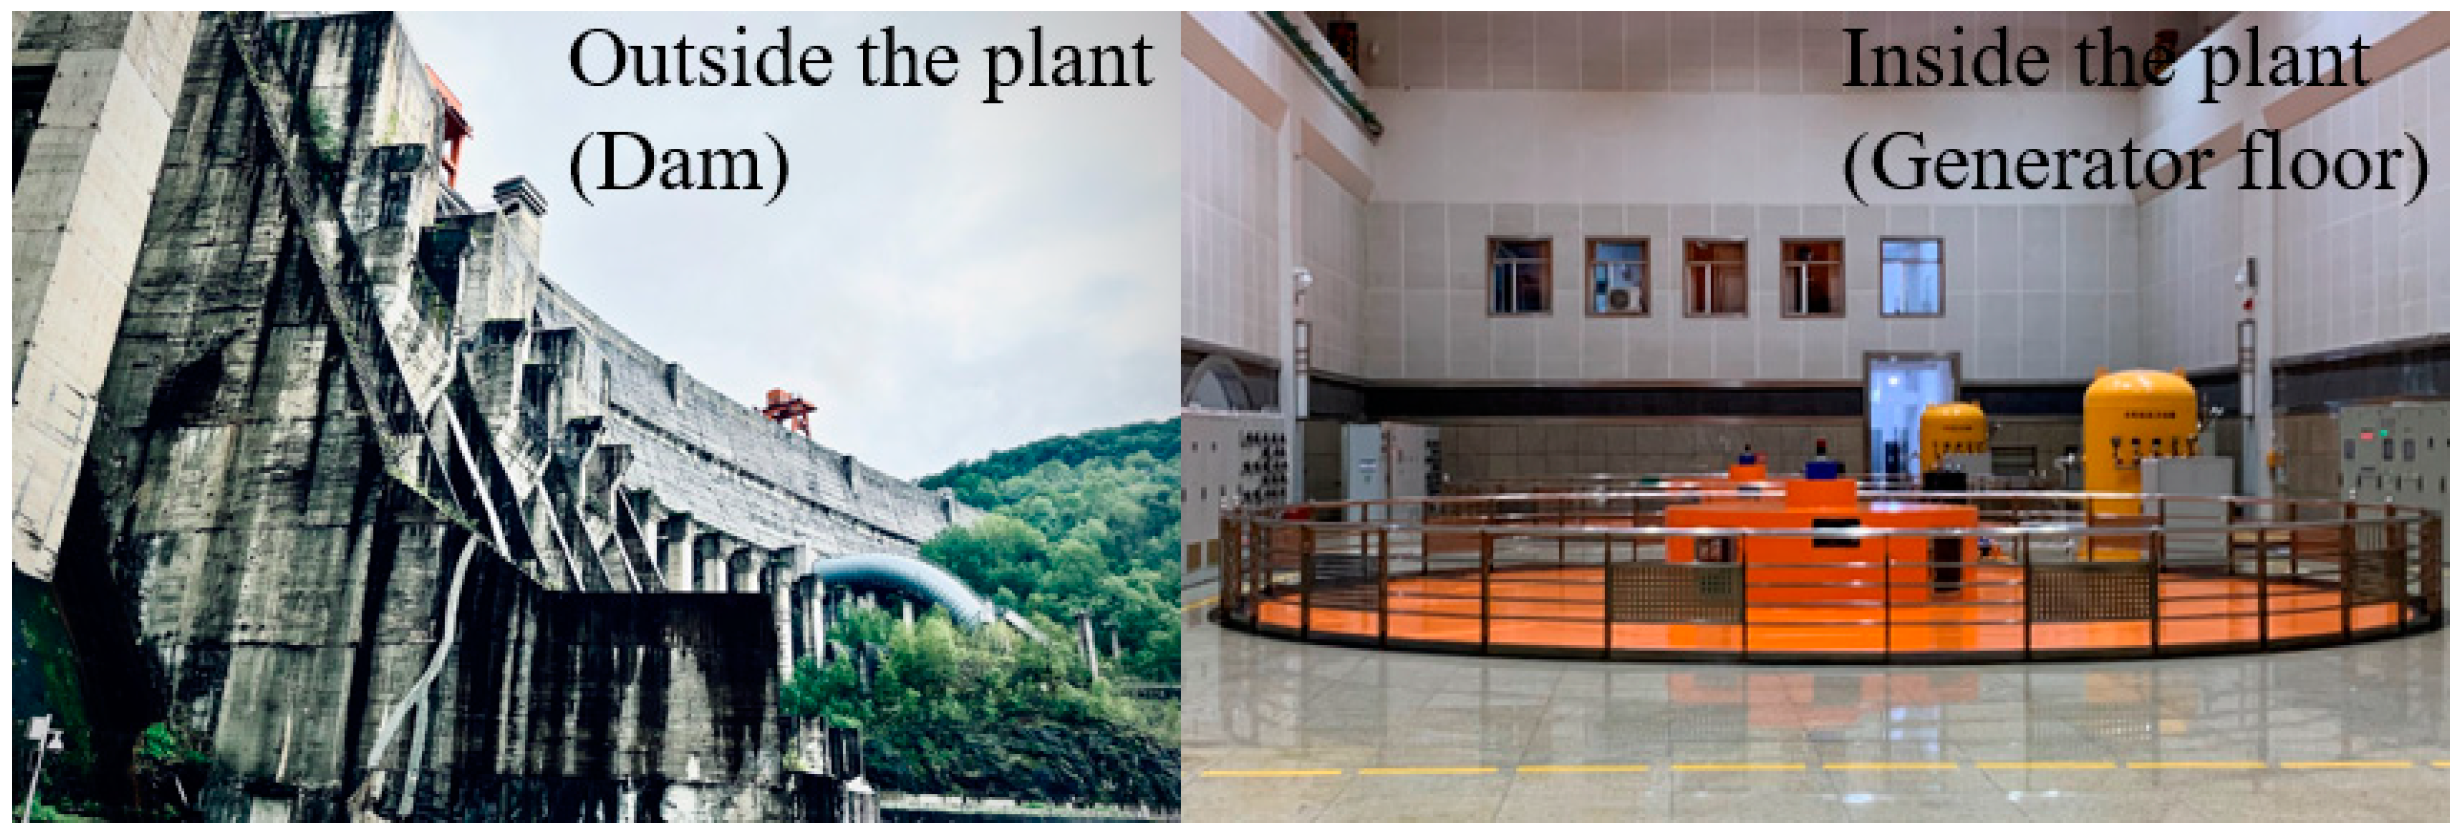
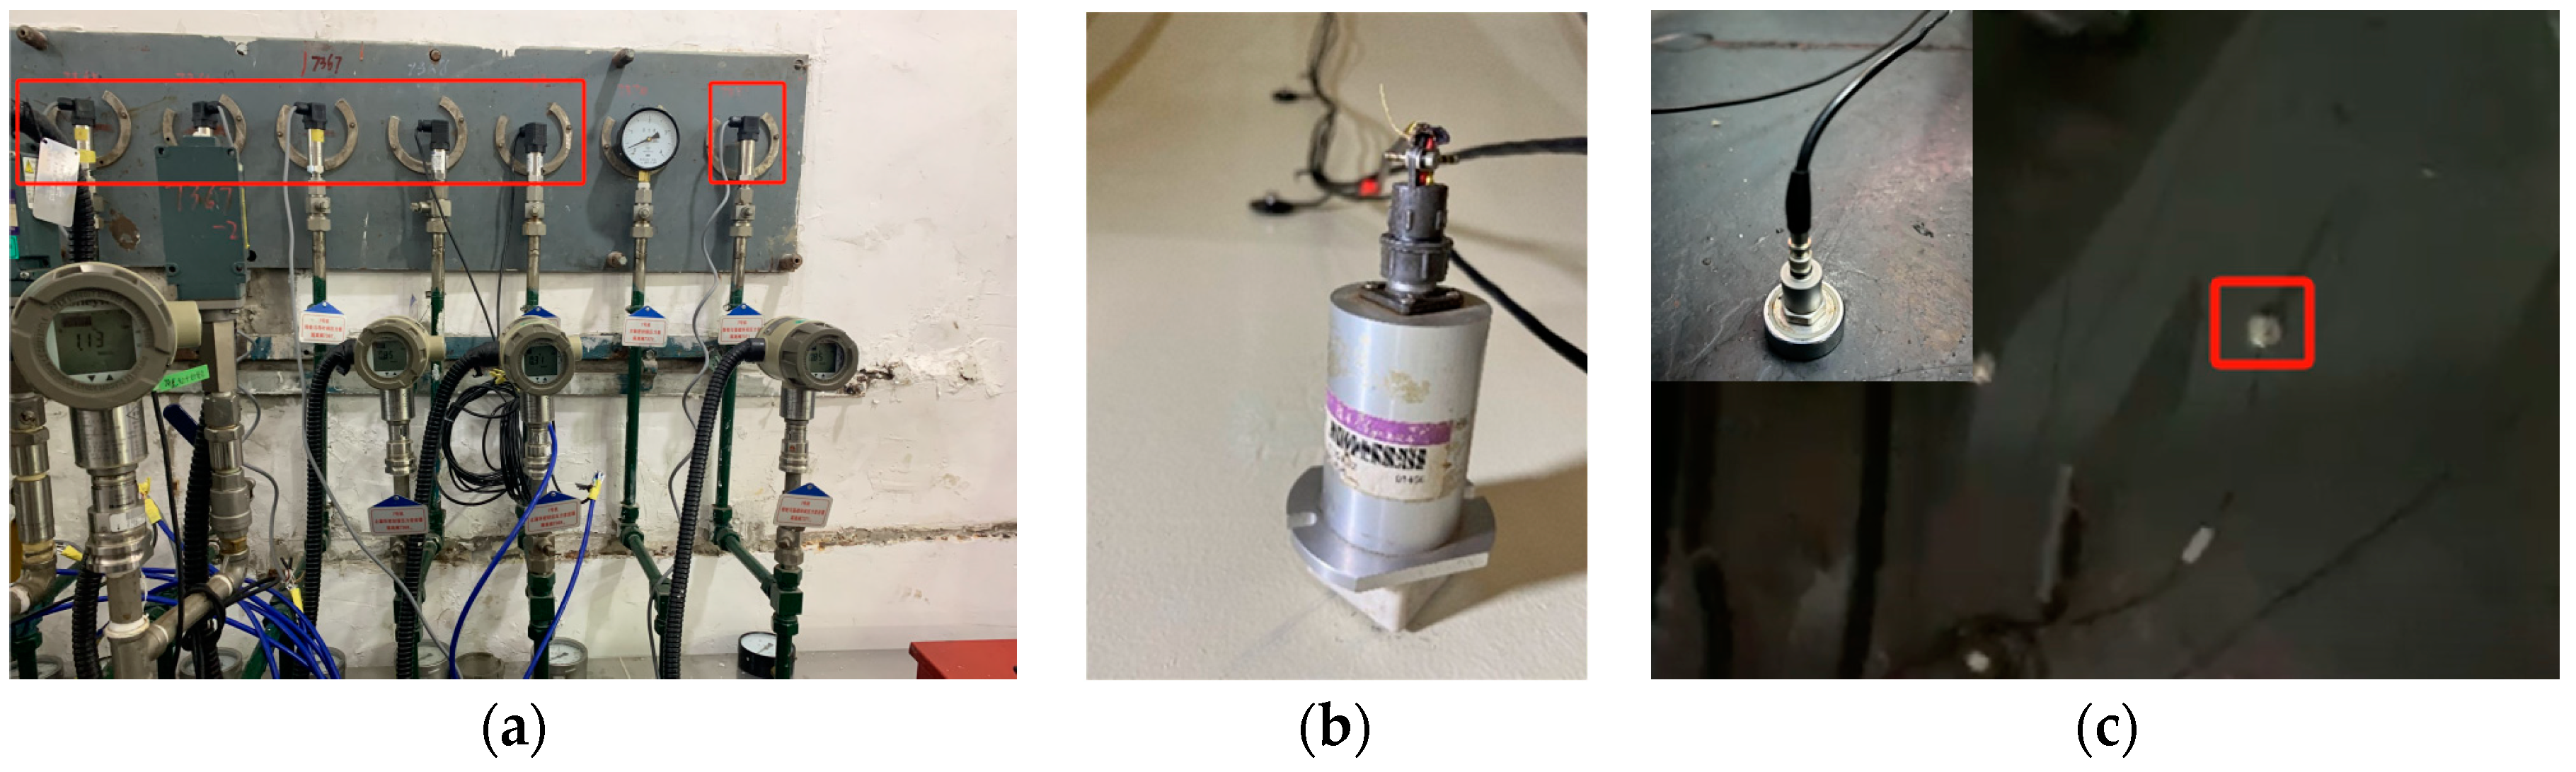
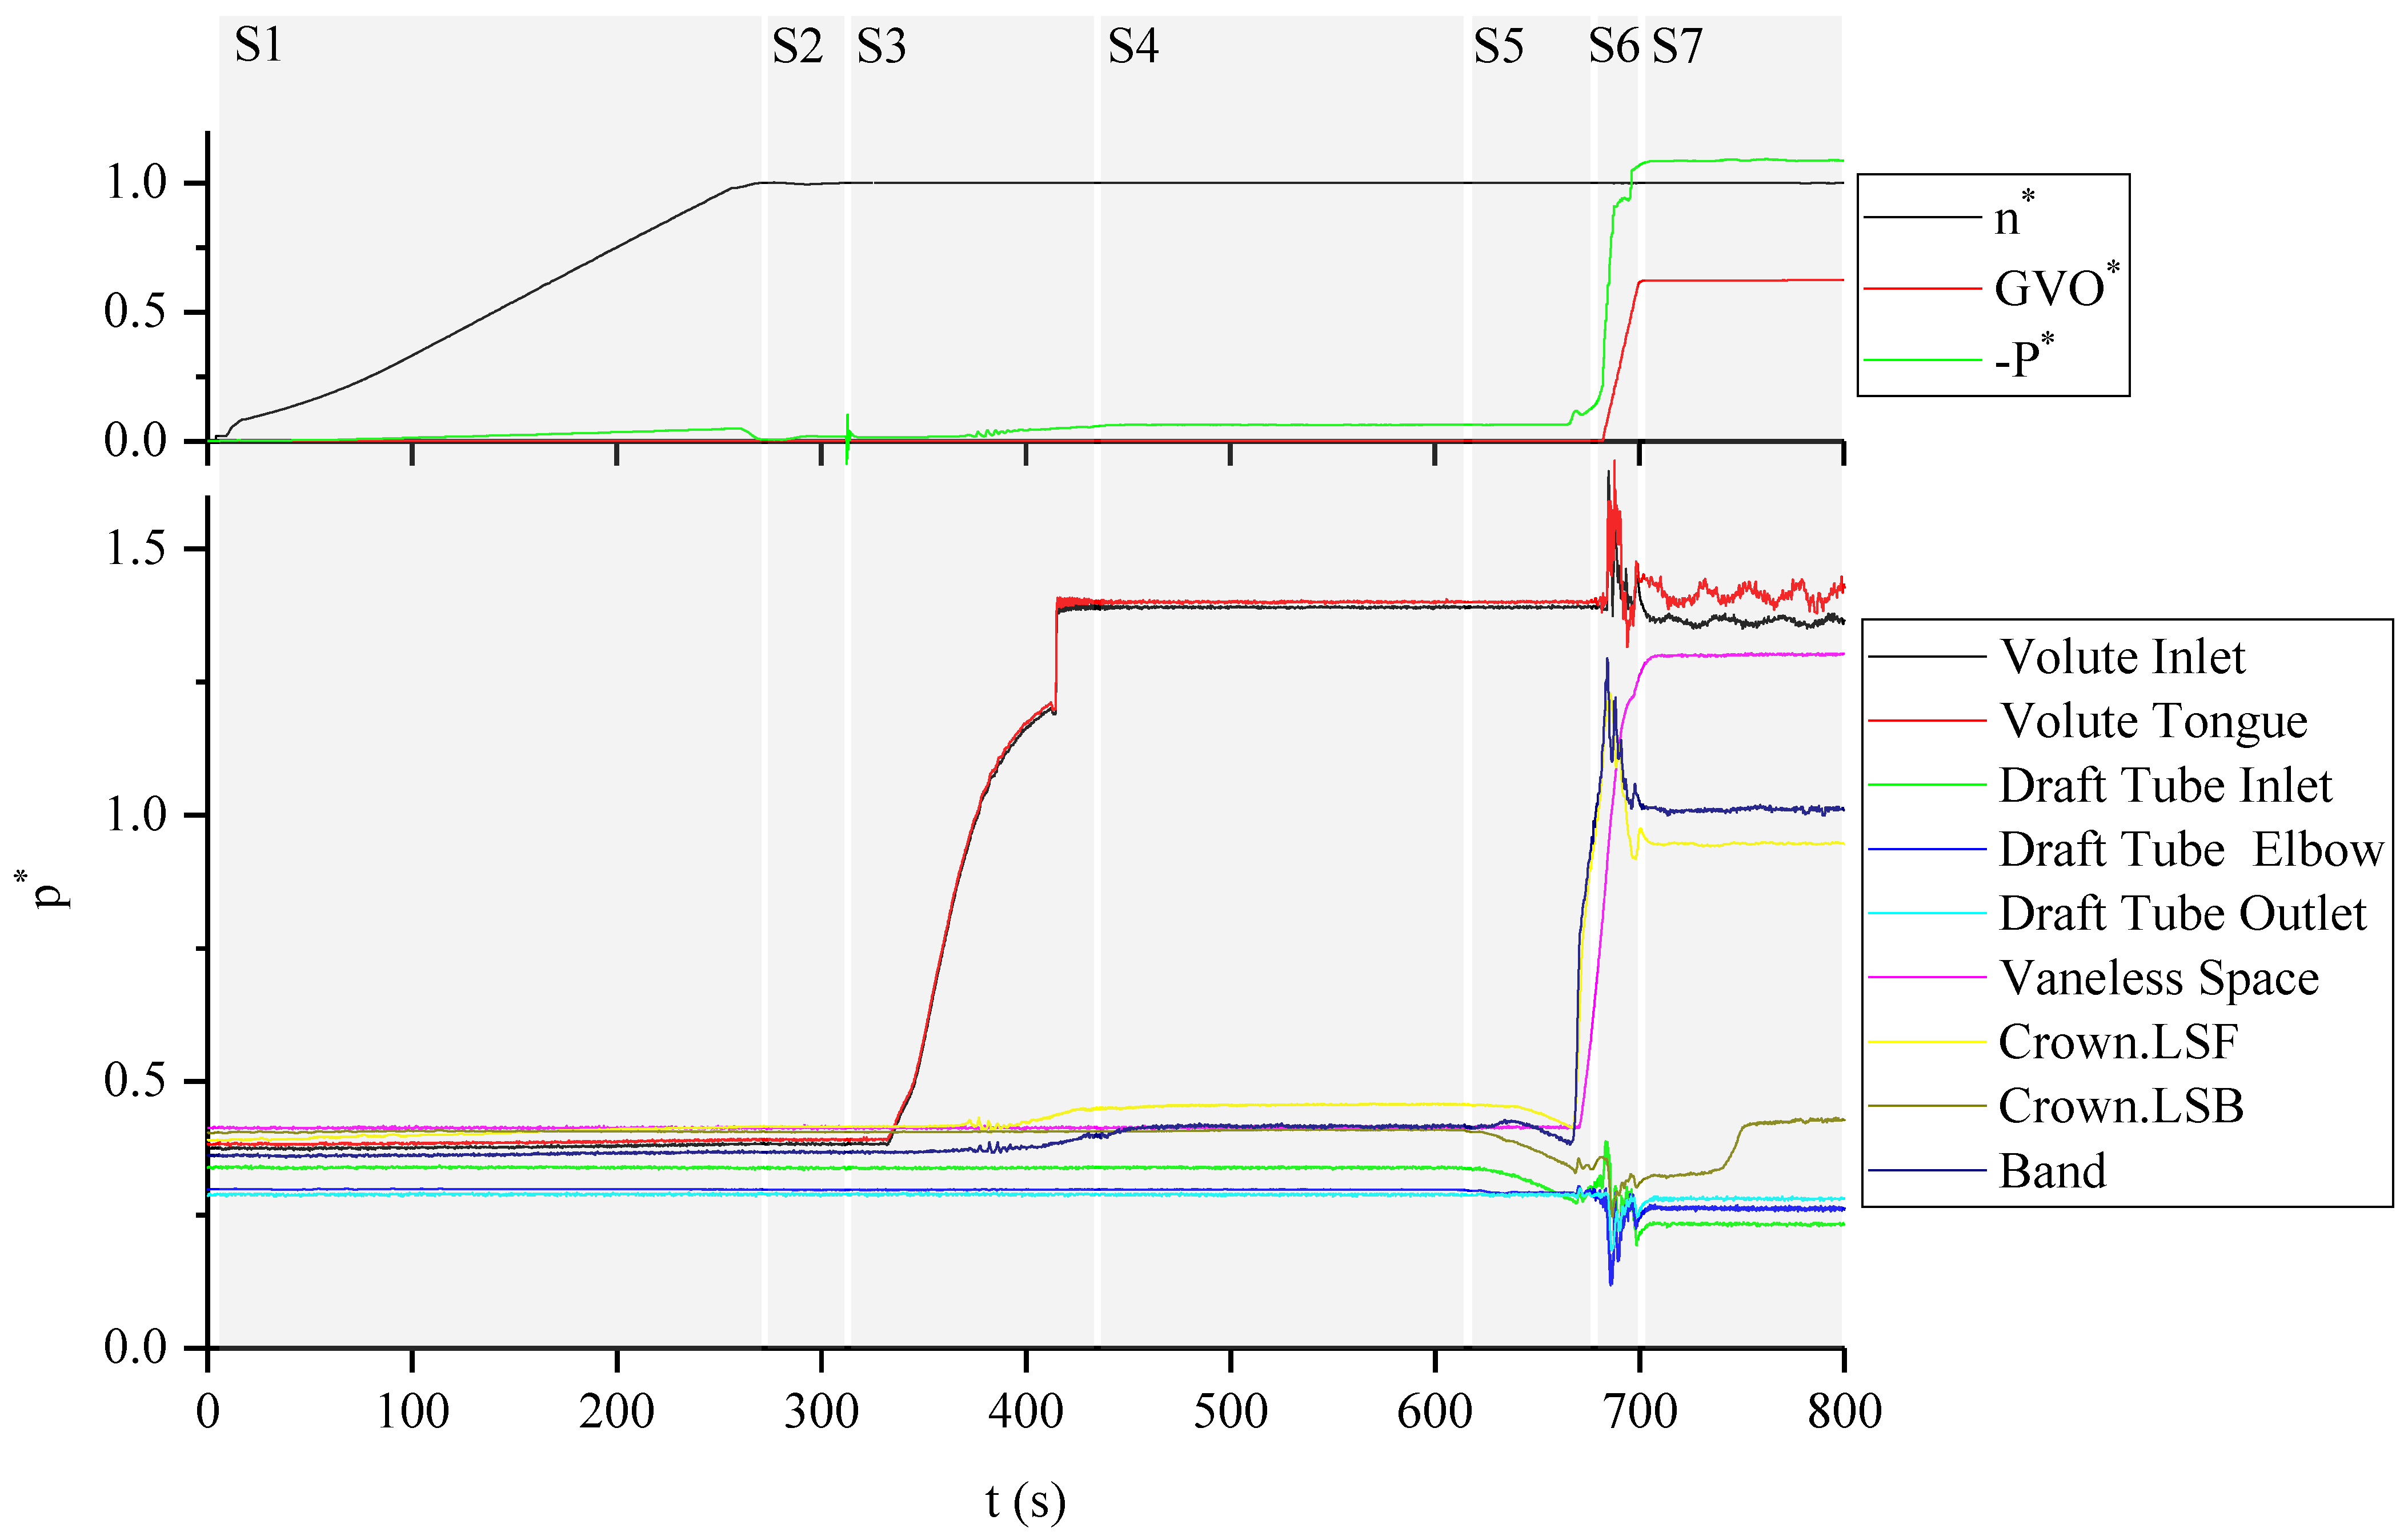
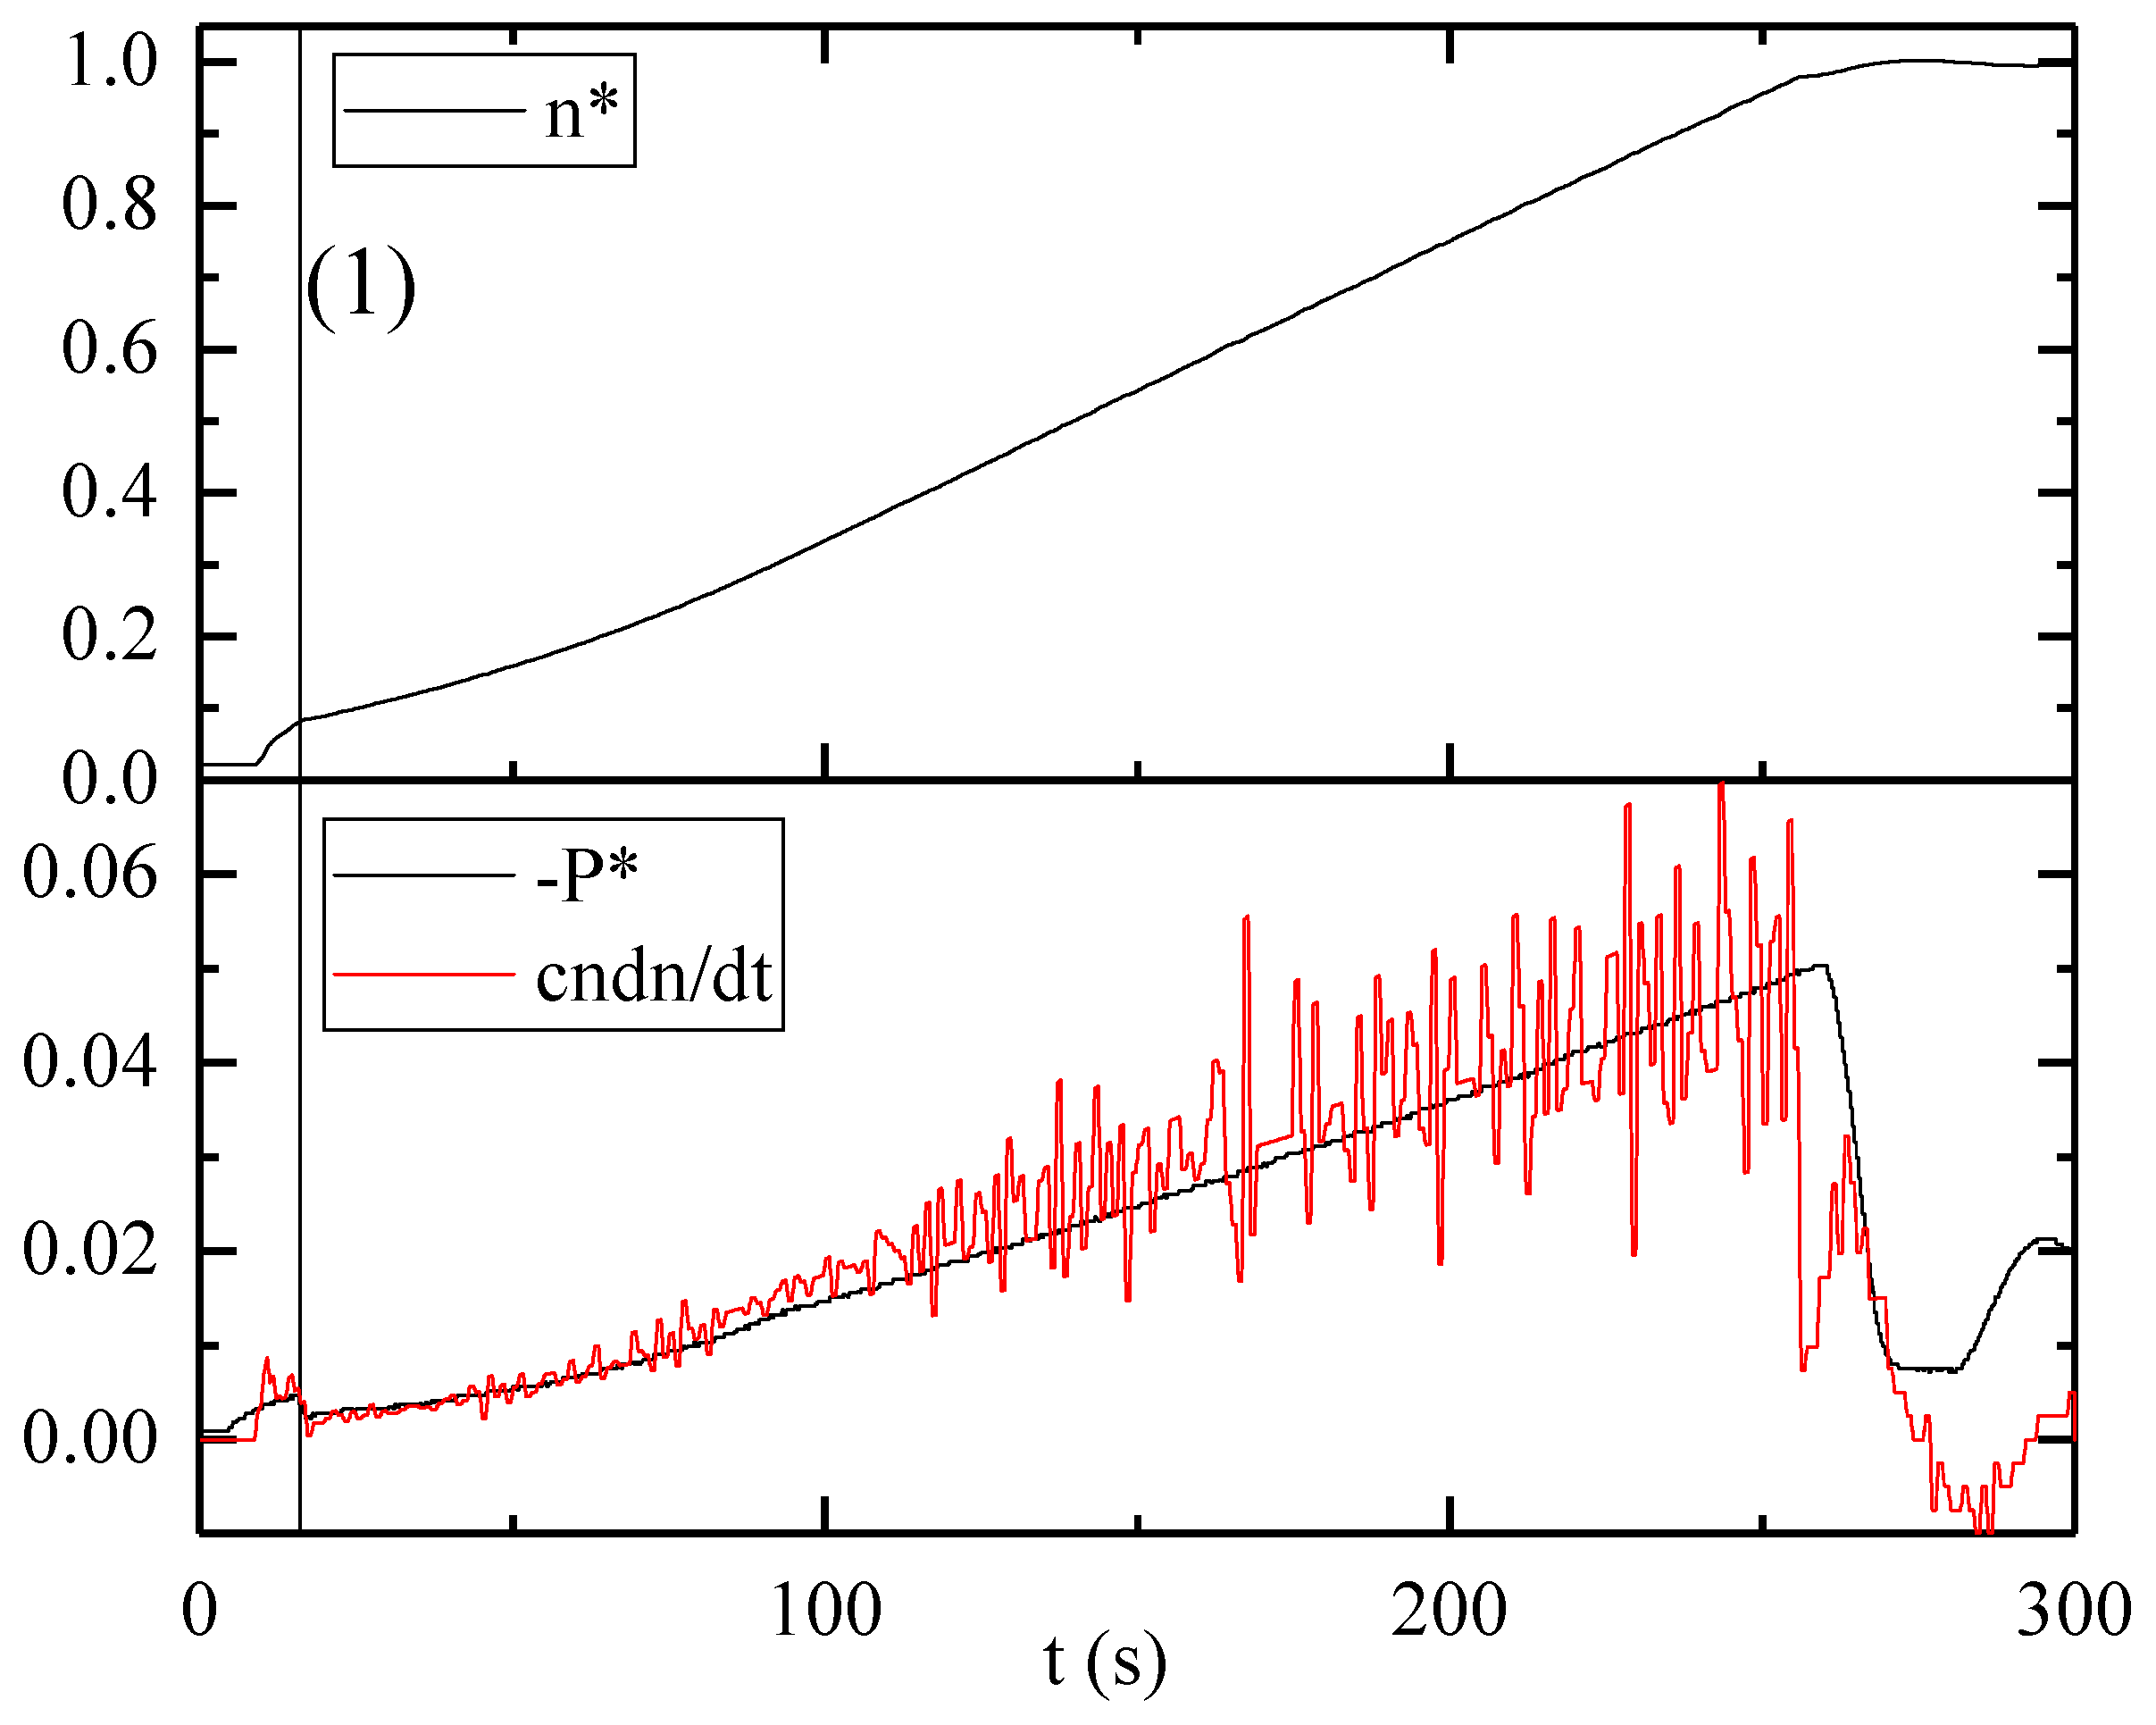
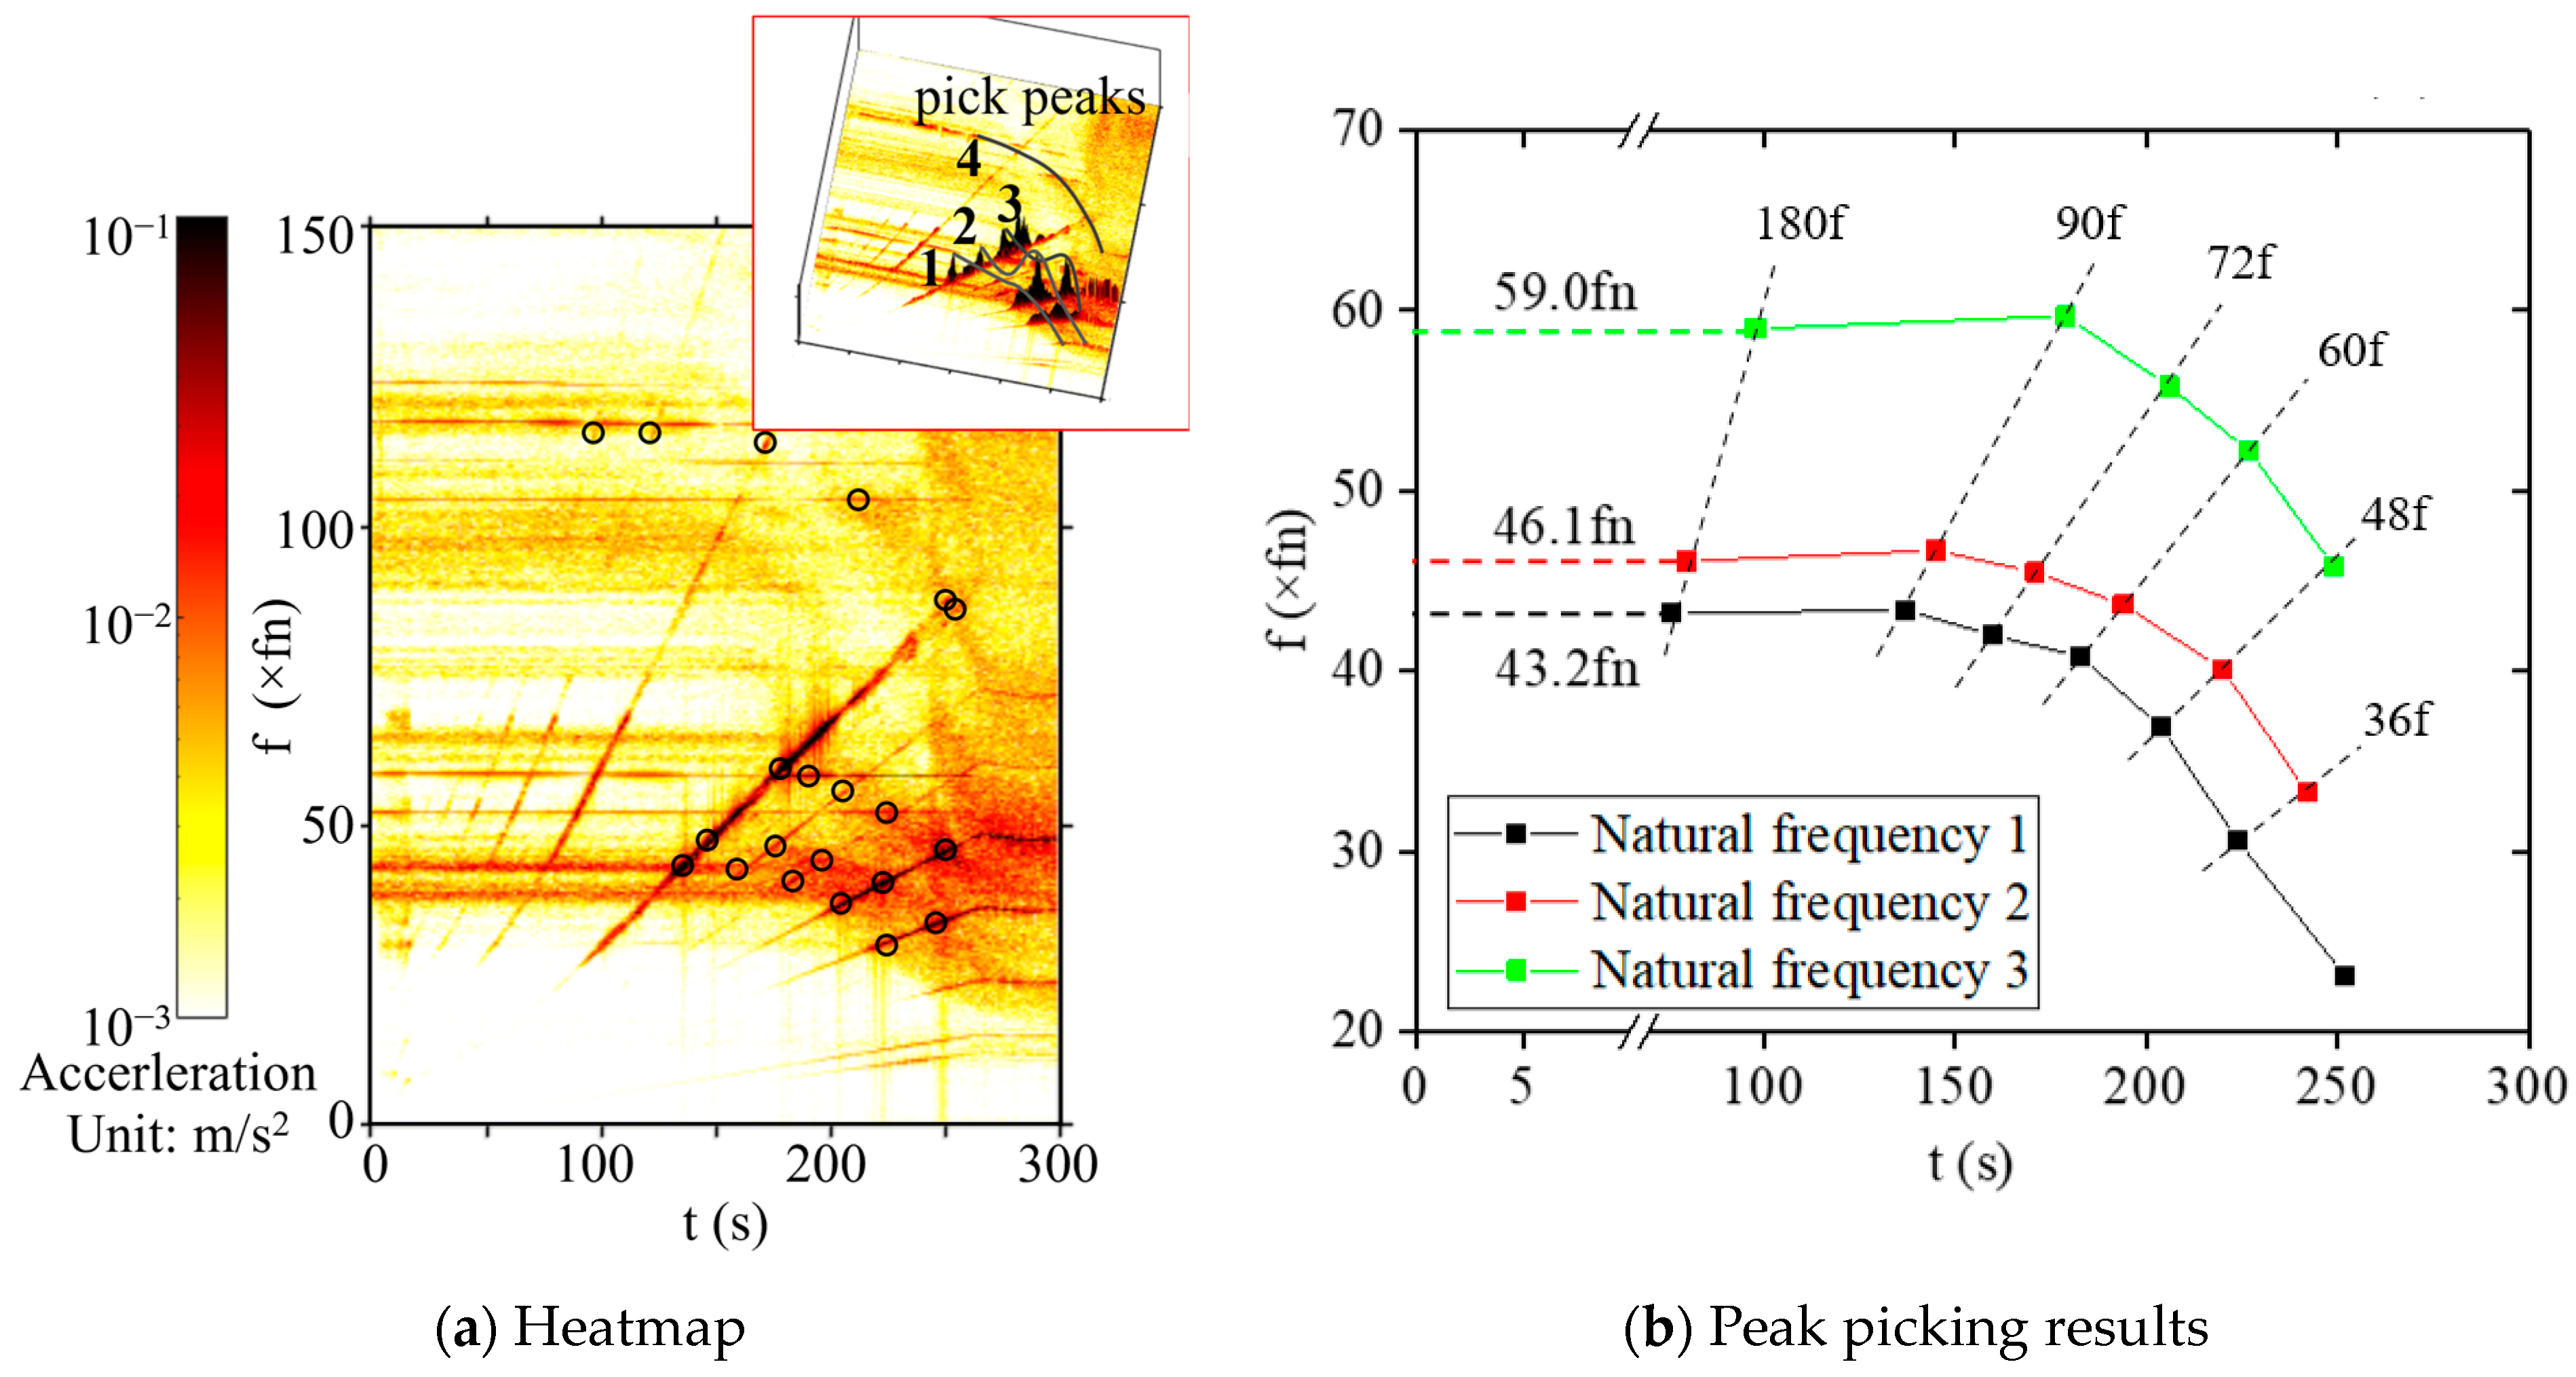
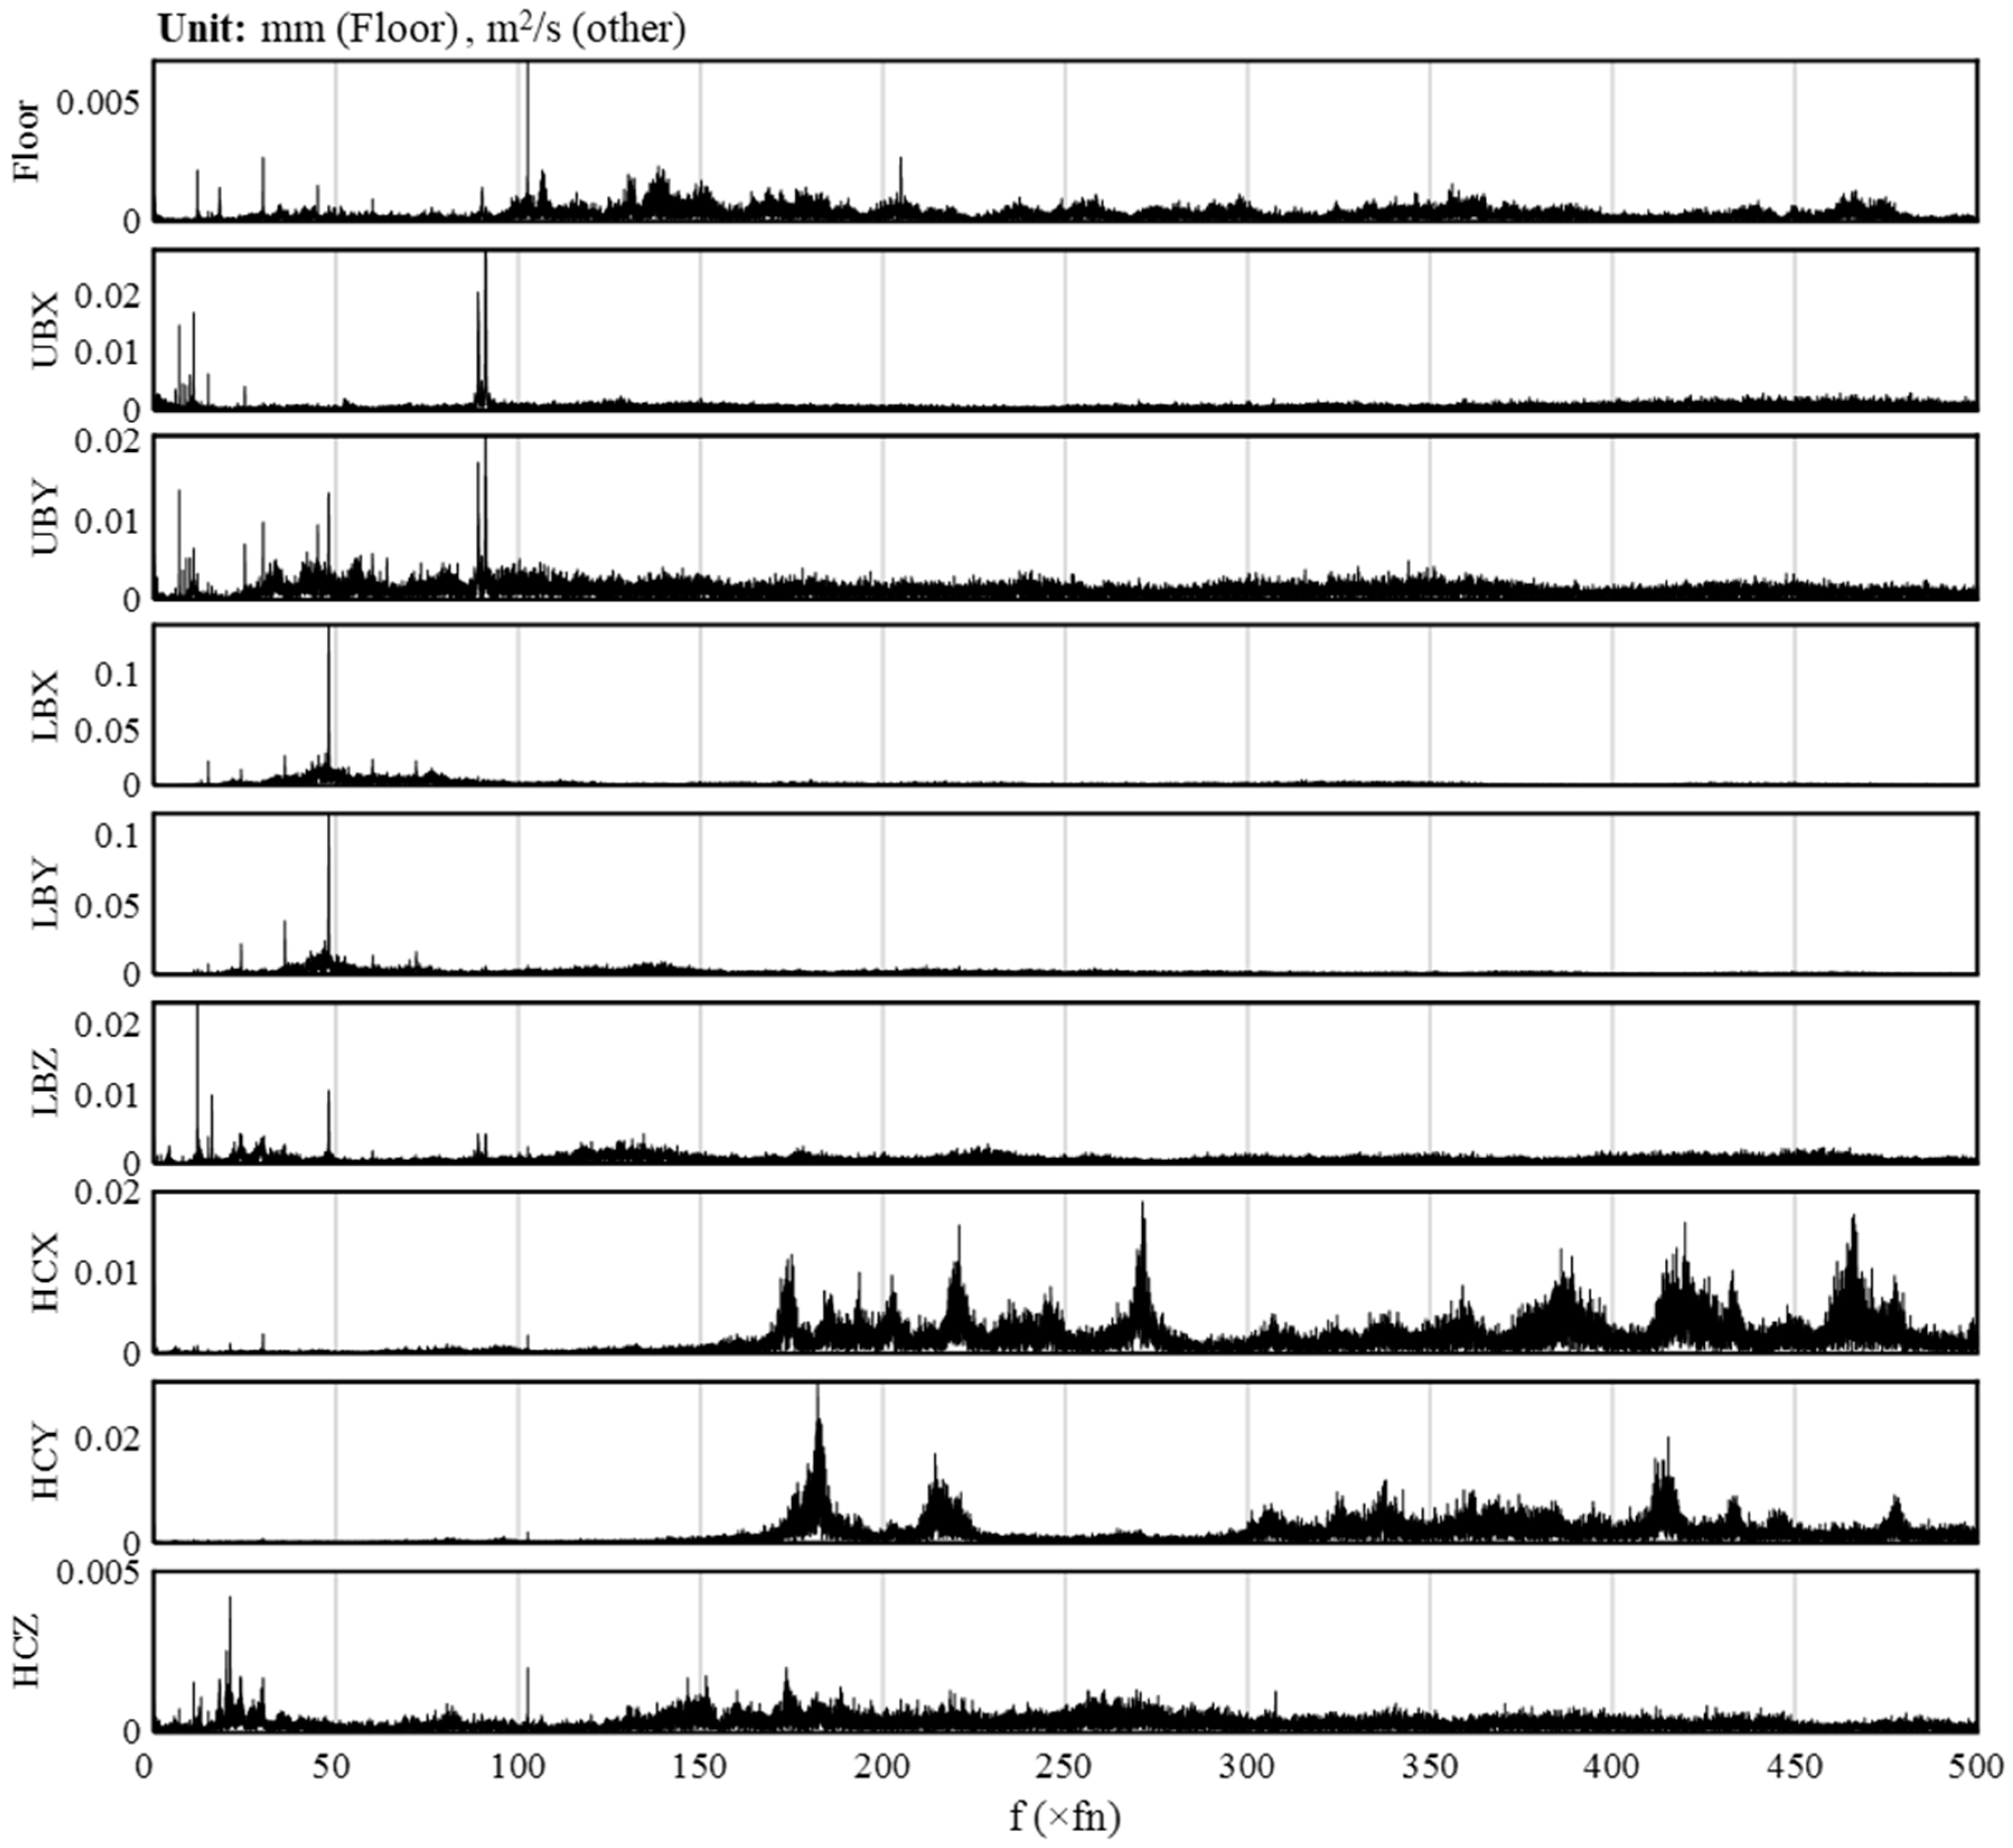
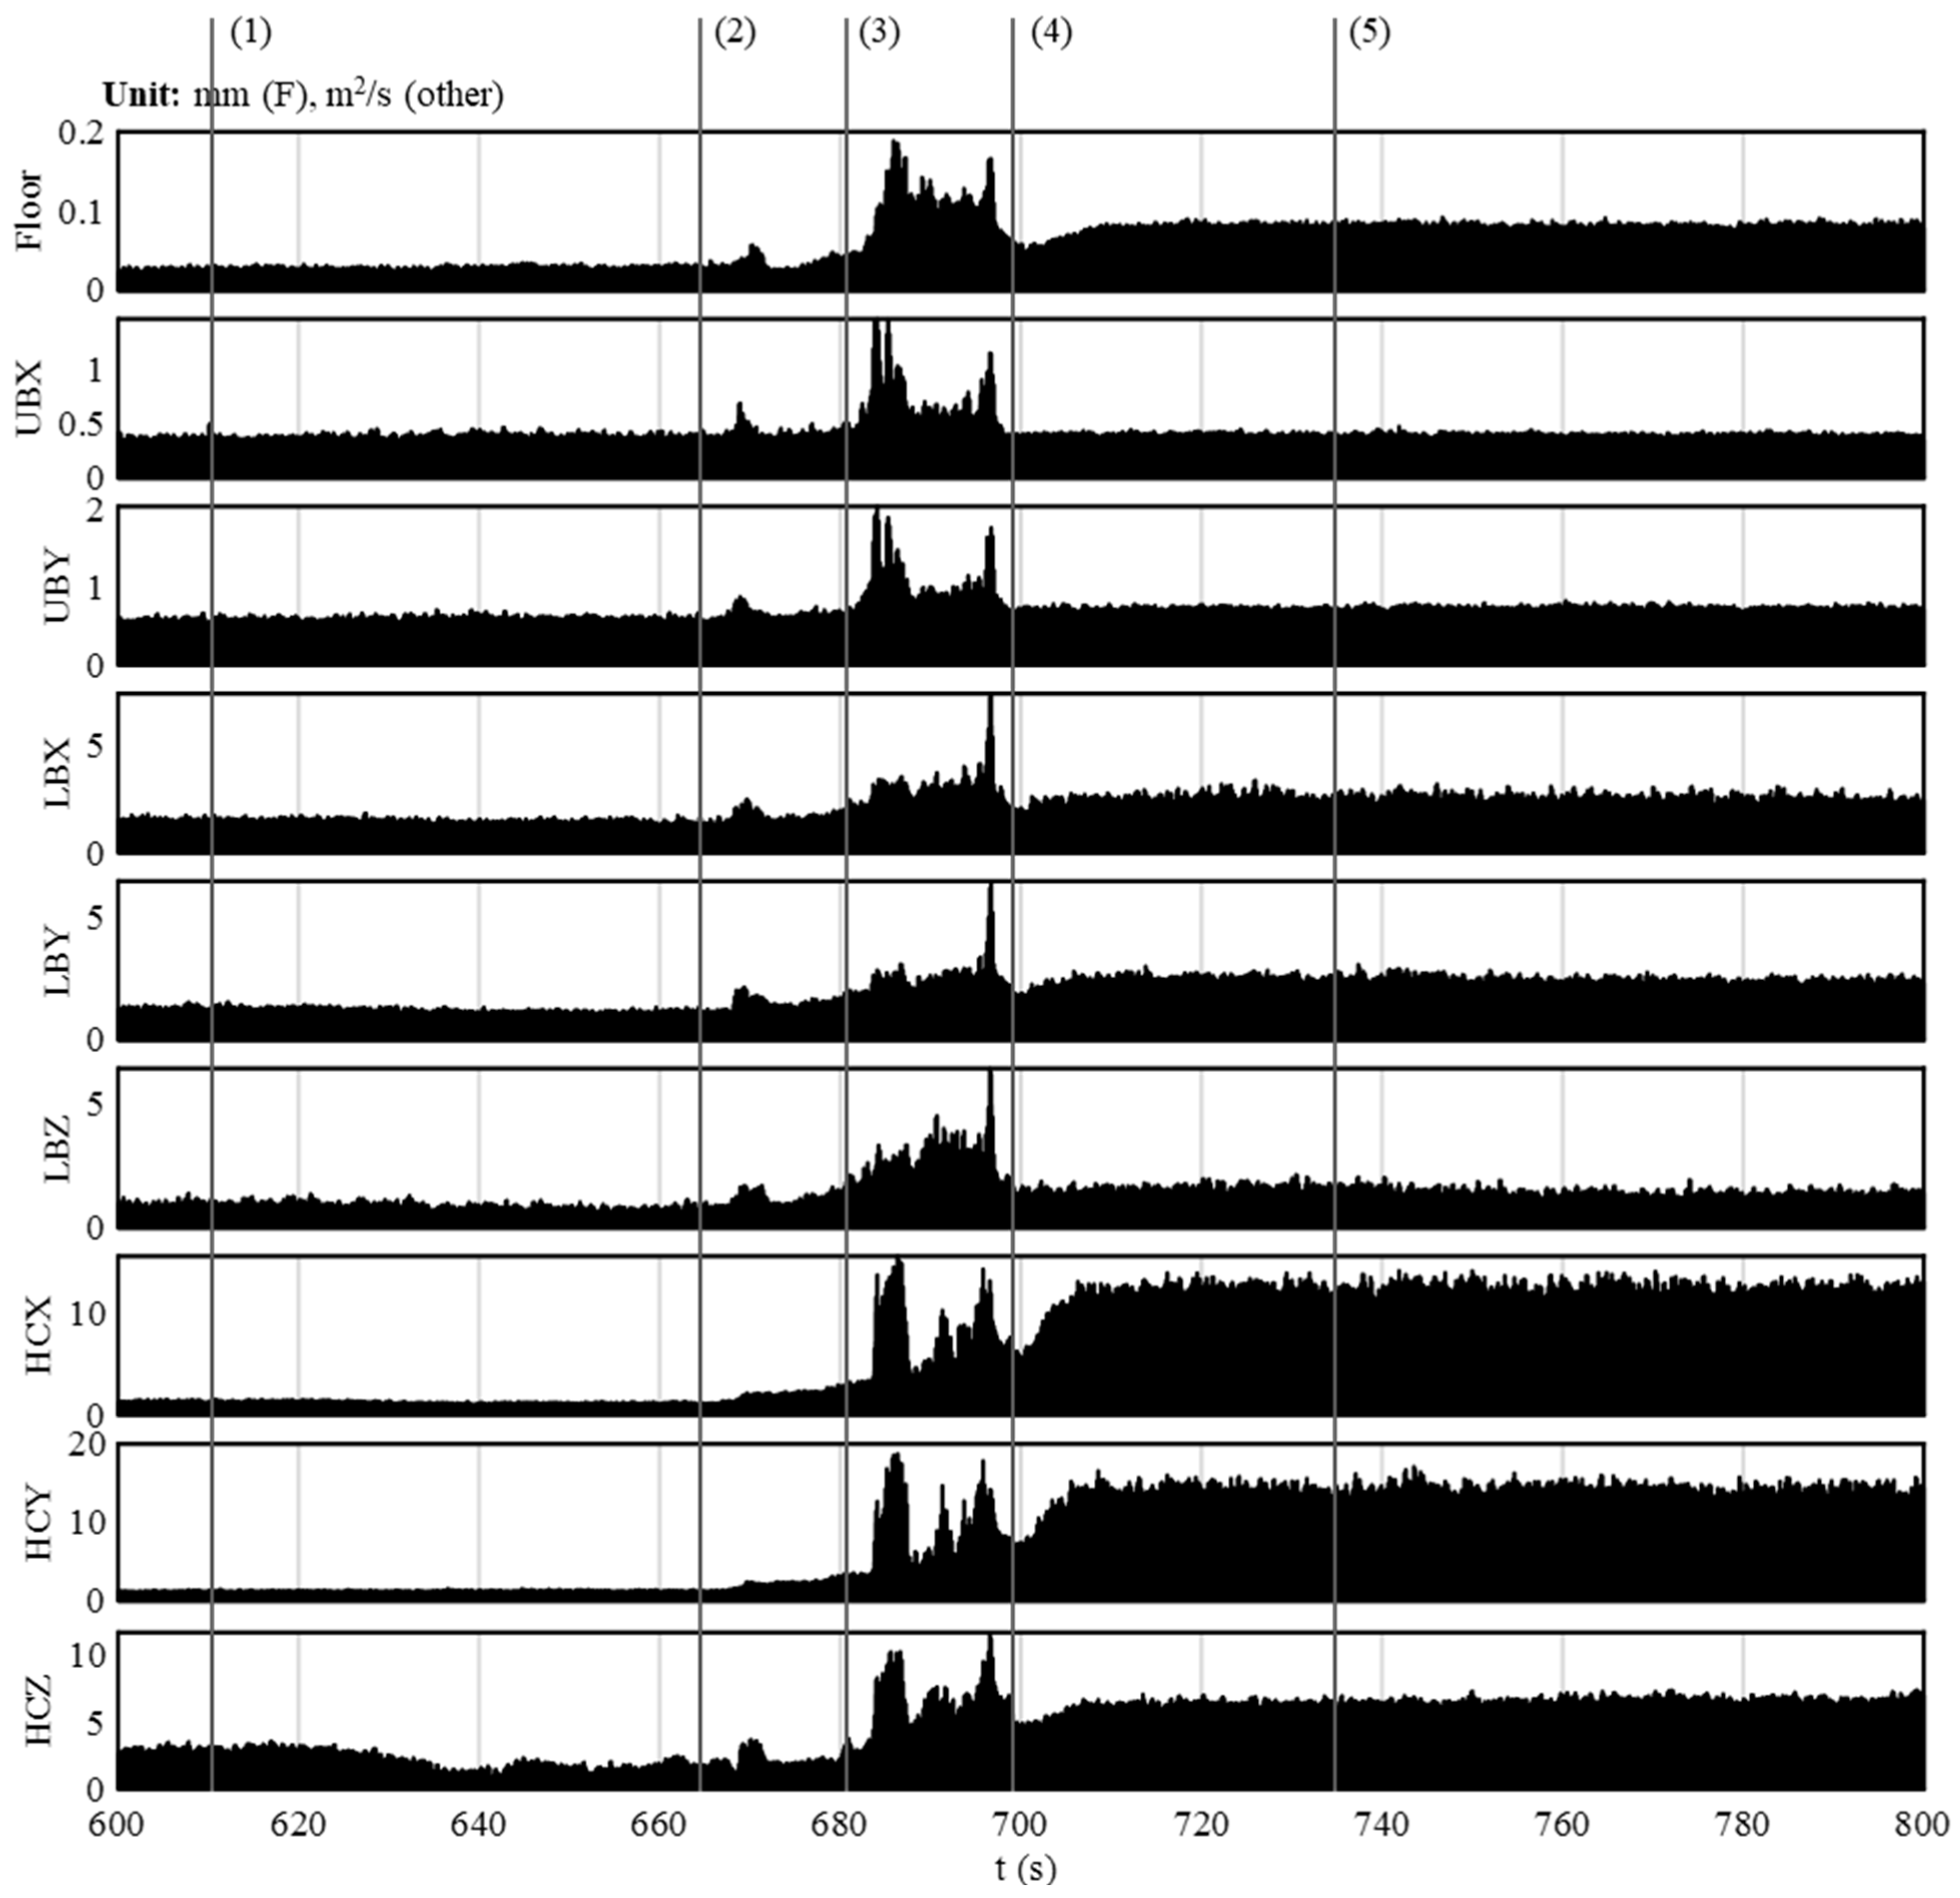
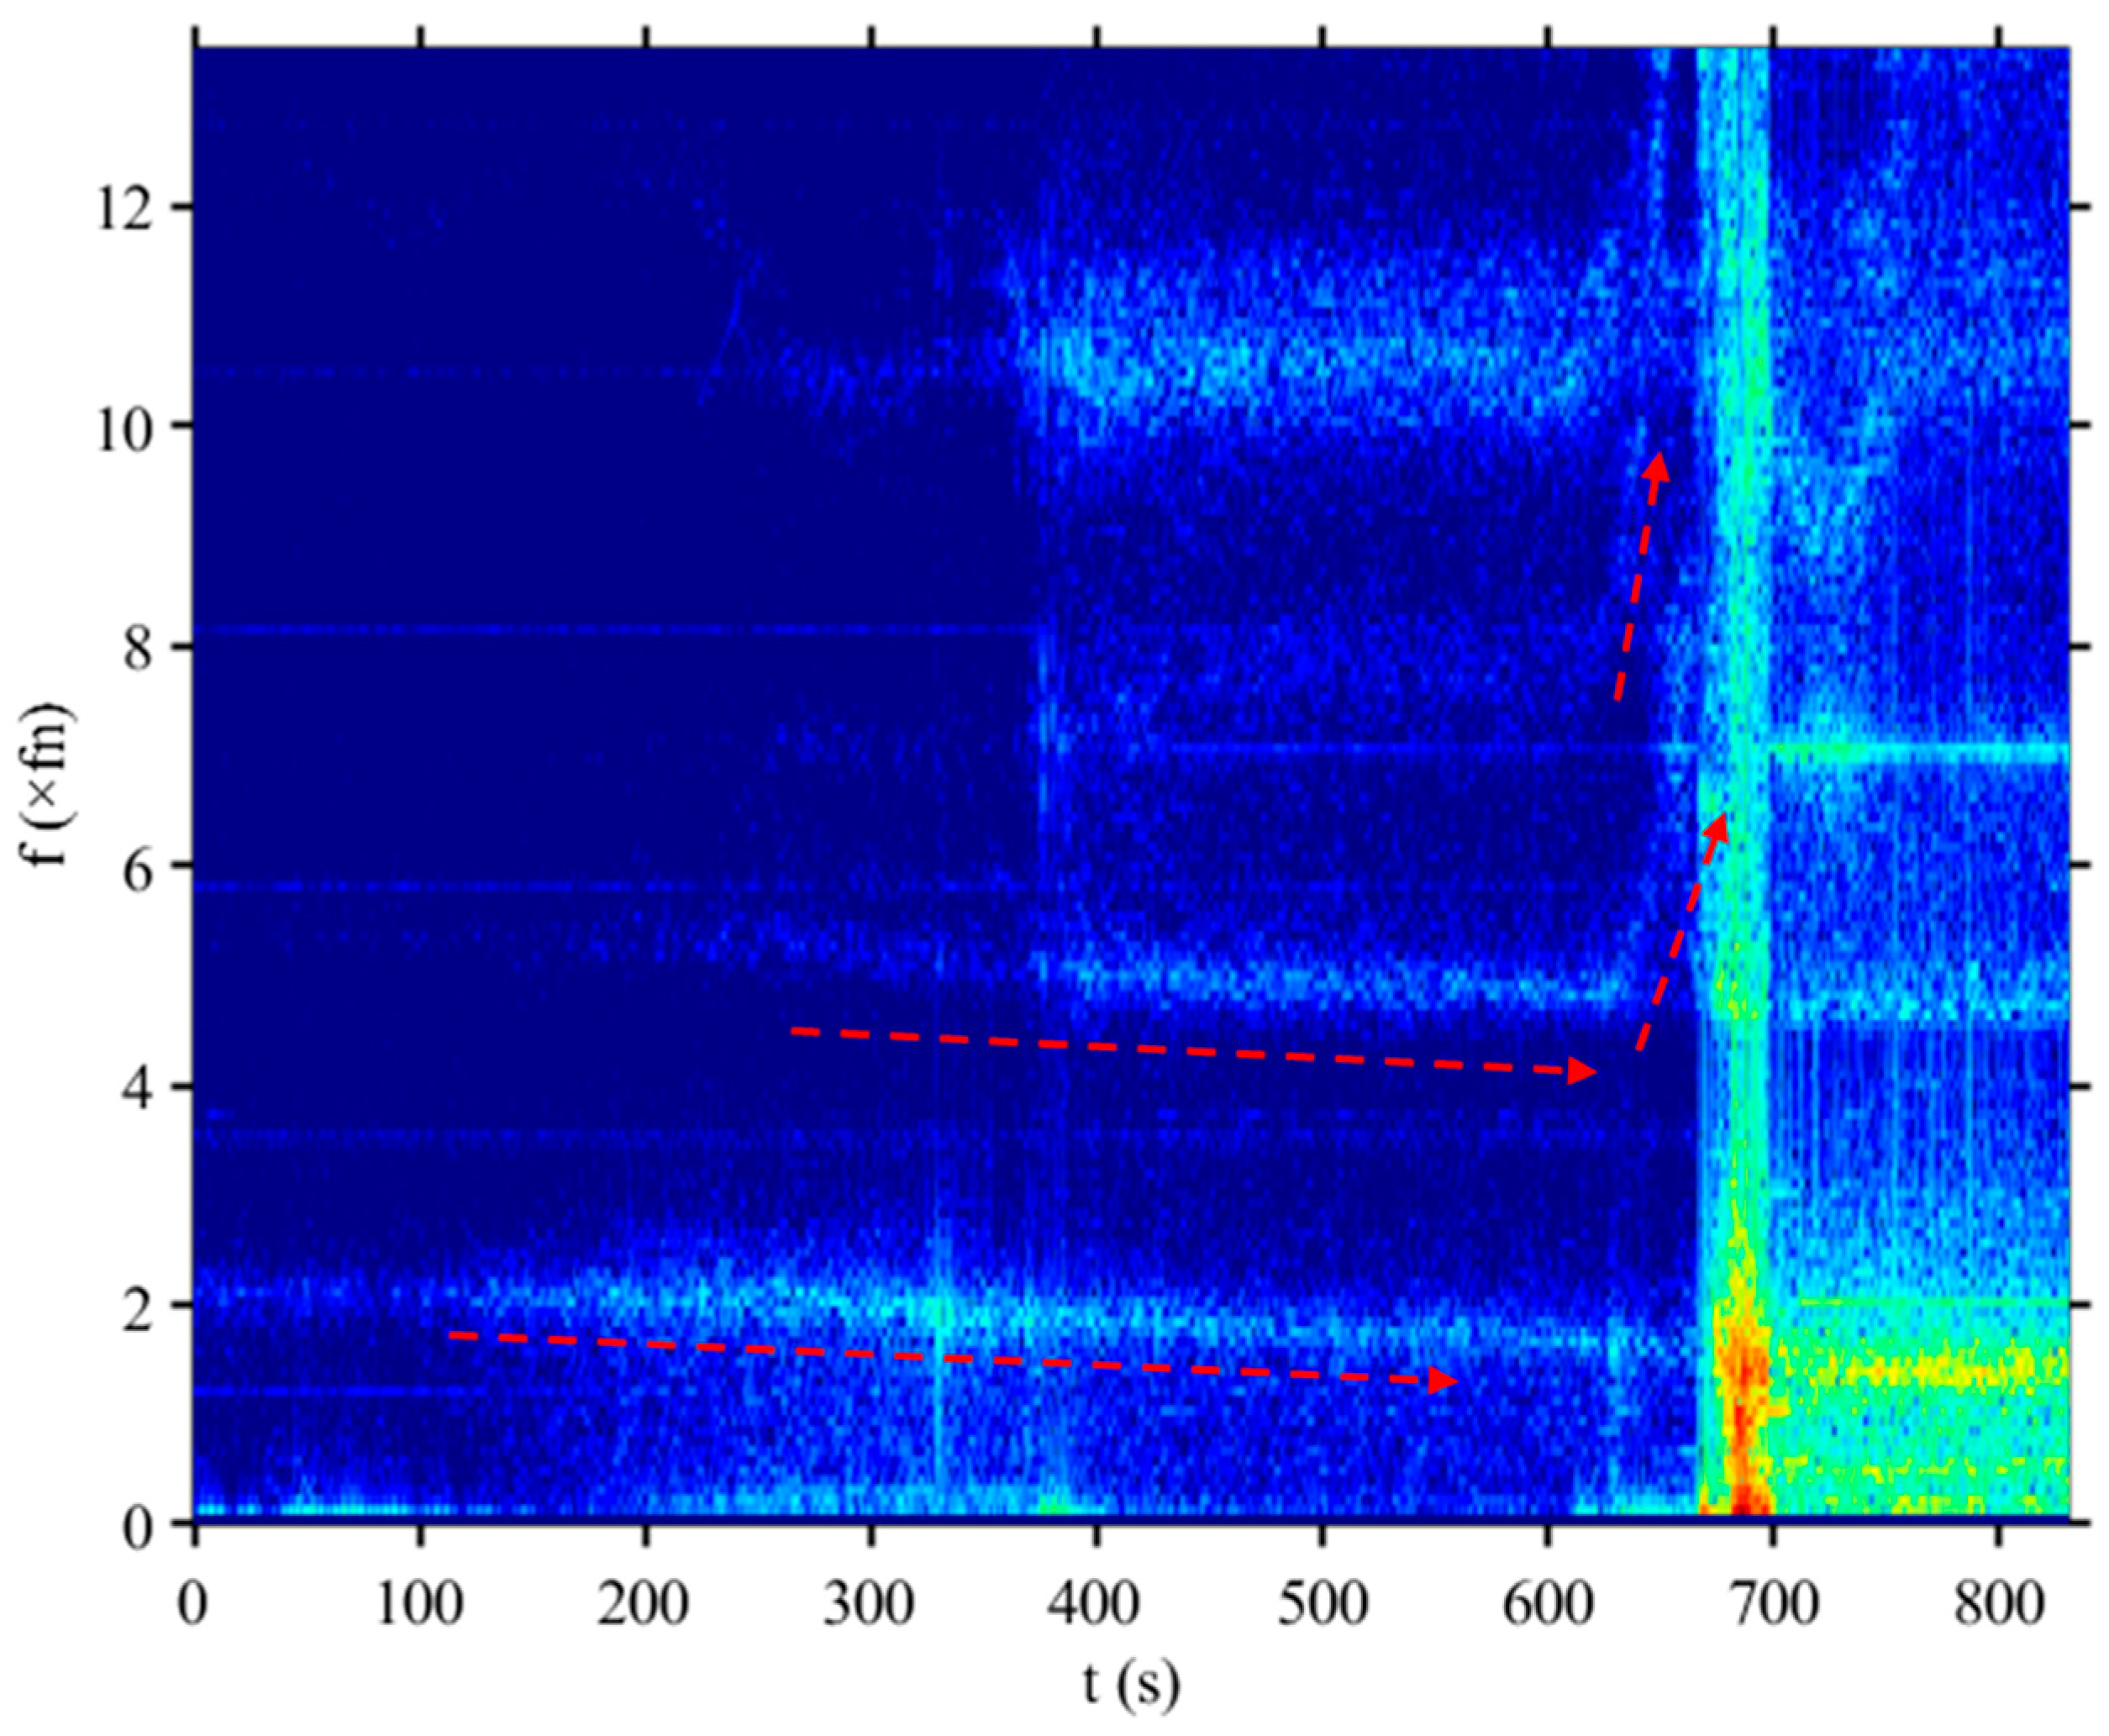
Table 1.
Basic parameters of the unit.
| Parameter | Unit | Value | |
|---|---|---|---|
| Geometry | Specific speed (ns) | / | 228 |
| Impeller inlet Diameter (D1) | m | 5.2 | |
| Impeller outlet Diameter (D2) | m | 4.1 | |
| Stay vane number (Zs) | / | 20 | |
| Guide vane number (Zg) | / | 20 | |
| Blade number (Zb) | / | 7 | |
| Magnetic pole number | / | 15 | |
| Coupling bolts number | / | 6 | |
| Turbine mode | Rated head | m | 105.8 |
| Rated power | MW | 150 | |
| Rated discharge | m3/s | 149 | |
| Rated speed | rpm | 200 | |
| Pump mode | Design head | m | 126.7 |
| Maximum input power | MW | 158 | |
| Maximum discharge | m3/s | 138 |
Table 2.
The frequency of the top five amplitudes.
| Rank | Floor | UBX | UBY | LBX | LBY | LBZ | HCX | HCY | HCZ |
|---|---|---|---|---|---|---|---|---|---|
| 1 | 102.5 | 91 | 91 | 48 | 48 | 12 | 271 | 182 | 21 |
| 2 | 205 | 89 | 89 | 36 | 36 | 48 | 466 | 415 | 20 |
| 3 | 30 | 11 | 7 | 60 | 47 | 16 | 420 | 214 | 174 |
| 4 | 139 | 7 | 48 | 72 | 24 | 24 | 220 | 338 | 102.5 |
| 5 | 12 | 15 | 30 | 15 | 72 | 134 | 386 | 360 | 150 |
Underline—frequency peaks that are consistent with that of Floor. Bold—frequency band, represented by the frequency at the local maximum amplitude.
Table 3.
Inflection points of the pressure rise during runner chamber pressurizing.
| Rank | Position | Inflection Moment (s) |
|---|---|---|
| 1 | B | 666.031 |
| 2 | C1 | 666.652 |
| 3 | C2 | 668.382 |
| 4 | D2 | 668.796 |
| 5 | D1 | 668.917 |
| 6 | VS | 610.234 |
Disclaimer/Publisher’s Note: The statements, opinions and data contained in all publications are solely those of the individual author(s) and contributor(s) and not of MDPI and/or the editor(s). MDPI and/or the editor(s) disclaim responsibility for any injury to people or property resulting from any ideas, methods, instructions or products referred to in the content. |
© 2024 by the authors. Licensee MDPI, Basel, Switzerland. This article is an open access article distributed under the terms and conditions of the Creative Commons Attribution (CC BY) license (https://creativecommons.org/licenses/by/4.0/).
Share and Cite
MDPI and ACS Style
Xia, M.; Zhao, W.; Wang, Z.; Qiao, M. Pulsation Stability Analysis of a Prototype Pump-Turbine during Pump Mode Startup: Field Test Observations and Insights. Processes 2024, 12, 838. https://doi.org/10.3390/pr12040838
AMA Style
Xia M, Zhao W, Wang Z, Qiao M. Pulsation Stability Analysis of a Prototype Pump-Turbine during Pump Mode Startup: Field Test Observations and Insights. Processes. 2024; 12(4):838. https://doi.org/10.3390/pr12040838
Chicago/Turabian StyleXia, Ming, Weiqiang Zhao, Zhengwei Wang, and Mu Qiao. 2024. "Pulsation Stability Analysis of a Prototype Pump-Turbine during Pump Mode Startup: Field Test Observations and Insights" Processes 12, no. 4: 838. https://doi.org/10.3390/pr12040838
Note that from the first issue of 2016, this journal uses article numbers instead of page numbers. See further details here.