
Critical Failure Characteristics of a Straight-Walled Arched Tunnel Constructed in Sandstone under Biaxial Loading
1
CNPC EastChina Design Institude Co., Ltd., Qingdao 266000, China
2
School of Civil Engineering, Qingdao University of Technology, Qingdao 266033, China
*
Author to whom correspondence should be addressed.
Processes 2024, 12(4), 841; https://doi.org/10.3390/pr12040841
Submission received: 13 March 2024
/
Revised: 2 April 2024
/
Accepted: 19 April 2024
/
Published: 22 April 2024
(This article belongs to the Special Issue Process Safety and Monitoring of Intelligent and Green Mining Technology)
Abstract
:To characterize the failure of rock mass surrounding underground tunnels, biaxial compression tests were conducted on a real sandstone model with a straight-walled arched hole. The acoustic emission (AE) system and digital image correlation (DIC) optical inspection equipment were used to investigate the crack evolution process and failure precursors of the tunnel. A two-dimensional particle flow code (PFC2D) was used to conduct numerical simulations on the sample, so as to investigate the mesoscopic failure mechanism of rock mass. The results show that the failure of the single tunnel constructed in sandstone occurs mainly in the walls on both sides (between the spandrels and arch feet), showing slabbing failure characteristics and a certain abruptness. The crack initiation in sandstone in early stage is not obvious, and the crack propagation in rock mass is rapid when acoustic emissions are enhanced. The small increments in the AE count and amplitude and the continuous reduction in the b-value can be used as precursors for the failure of rock mass. When the height–span ratio is 0.8 and 1.0, the stress distribution around the chamber is more uniform, and when the height–span ratio is greater than 1.0, the stress is mainly concentrated in the vault and arch bottom. In the PFC simulations, tensile fractures firstly initiate in the middle of walls and at the arch feet, arcuate fracture concentration zones are then formed, in which shear fractures appear and a few particles spall from the surfaces. When approaching the ultimate bearing capacity, rock masses on both sides of the tunnel are fractured over large areas, and the slender coalesced fractured zone develops to the deep part of rock mass, causing failure of the sample.
1. Introduction
The mechanical properties of rock containing caverns have always been a hot research topic in the field of rock mechanics and underground engineering. As a common defective rock, it has different mechanical properties compared with intact rock, and its strength, deformation, and failure characteristics are much more complicated than intact rock. In particular, the growth and evolution of cracks around holes have an important impact on project quality, construction safety, and production efficiency [1].
Previous studies mostly focused on the strength and deformation characteristics of rock in circular or oval caverns [2,3,4,5,6], while in actual engineering, straight-walled arched caverns are more common [7,8]. Fengqiang Gong et al. [9] conducted true triaxial tests on a single arch with a wall of red sandstone, and found that the arch hole failure mainly occurred between the arch foot and the arch waist on both sides, showing typical tensile plate fracture characteristics. Xiaojun Zhang et al. [10] carried out uniaxial compression testing of gabbro wall semi-circular arched tunnel, and found that the fracture rockburst phenomenon occurred in straight-walled arched tunnel, the fracture surface of tunnel surrounding rock was undulated and rough, and the surrounding rock was split into thin blocks. Lei Zhou et al. [11] studied the influence of cracks at different angles and positions around the tunnel on the stability of surrounding rock by using a walled arched single tunnel model with similar materials, and found that cracks at the foot of the tunnel wall were the most unfavorable position to experience tunnel damage. Abil et al. [12] used a similar model test method to study the development process of the failure surface of the confining pressure of a single arch with a wall during overload and excavation unloading. They found that the surrounding rocks on both sides of the wall were overall spalling during overload, and the surrounding rocks on both sides of the wall were extruded to the free surface layer by layer during excavation and unloading. Zhibin Zhong et al. [7] conducted biaxial compression tests on square rock samples of arched chambers with walls, and found that the variation law of vertical and horizontal stress of surrounding rock of arched chambers is related to the boundary shape of the chamber and the distance between the chamber. Xiao Liu et al. [13] carried out the stress relaxation process test of cyclic loading and unloading of a walled arched tunnel under low, medium, and high loads, and obtained the stress relaxation law. Yetao Qin et al. [14] studied the stability of surrounding rock of an arched tunnel with deeply buried wall.
The acoustic emission phenomenon is accompanied by the rock mass failure process, and the acoustic emission activity contains rich information about the internal failure process of the rock, which is helpful to study the failure mechanism of the rock [15]. In recent years, many scholars have studied the rock fracture process from the perspective of acoustic emission signals. Yanbo Zhang et al. [16] and Chuangye Wang et al. [17] analyzed the acoustic emission information of granite uniaxial compression test, and found that different acoustic emission parameters could reflect the evolution process of cracks inside rocks from different angles, providing early warning for rock fracture disasters in joints. Liming Zhang et al. [18] analyzed the acoustic emission change characteristics of marble during the whole process of unloading confining pressure deformation and failure, and showed that the acoustic emission ringing count rate increased rapidly after expansion point, which could be used as a precursor of rock failure. Haonan Zhang et al. [19] analyzed the acoustic emission characteristics and rules of granite under uniaxial loading and unloading conditions, and found that the acoustic emission quiet period before rock failure is helpful to predict rockburst.
Most of the above studies on straight-walled arched chambers use rock-like materials to analyze the failure characteristics and surrounding rock stability, and there are few studies on the macro- and micro-failure characteristics of natural rocks. Therefore, this paper carried out a large-scale single-tunnel model test of real rock mass, combined with acoustic emission testing system and DIC optical measurement equipment, to directly reflect the deformation law and failure characteristics of rock mass, explore the crack evolution and failure mechanism during the failure process, and use acoustic emission information to give early warning to the single tunnel. In order to understand the mesoscopic failure mechanism inside the rock mass, a numerical simulation of the sample is carried out by using the discrete element computing software PFC2D to obtain the variation trend of mesoscopic fracture, main chain, and other parameters during the failure process, and to supplement and explain the macroscopic test phenomenon from the mesoscopic perspective, which is of great significance for the stability analysis and disaster prevention of engineering rock mass.
2. Biaxial Compression Test of Arched Sandstone Chamber Samples with Wall
2.1. Preparation of Samples
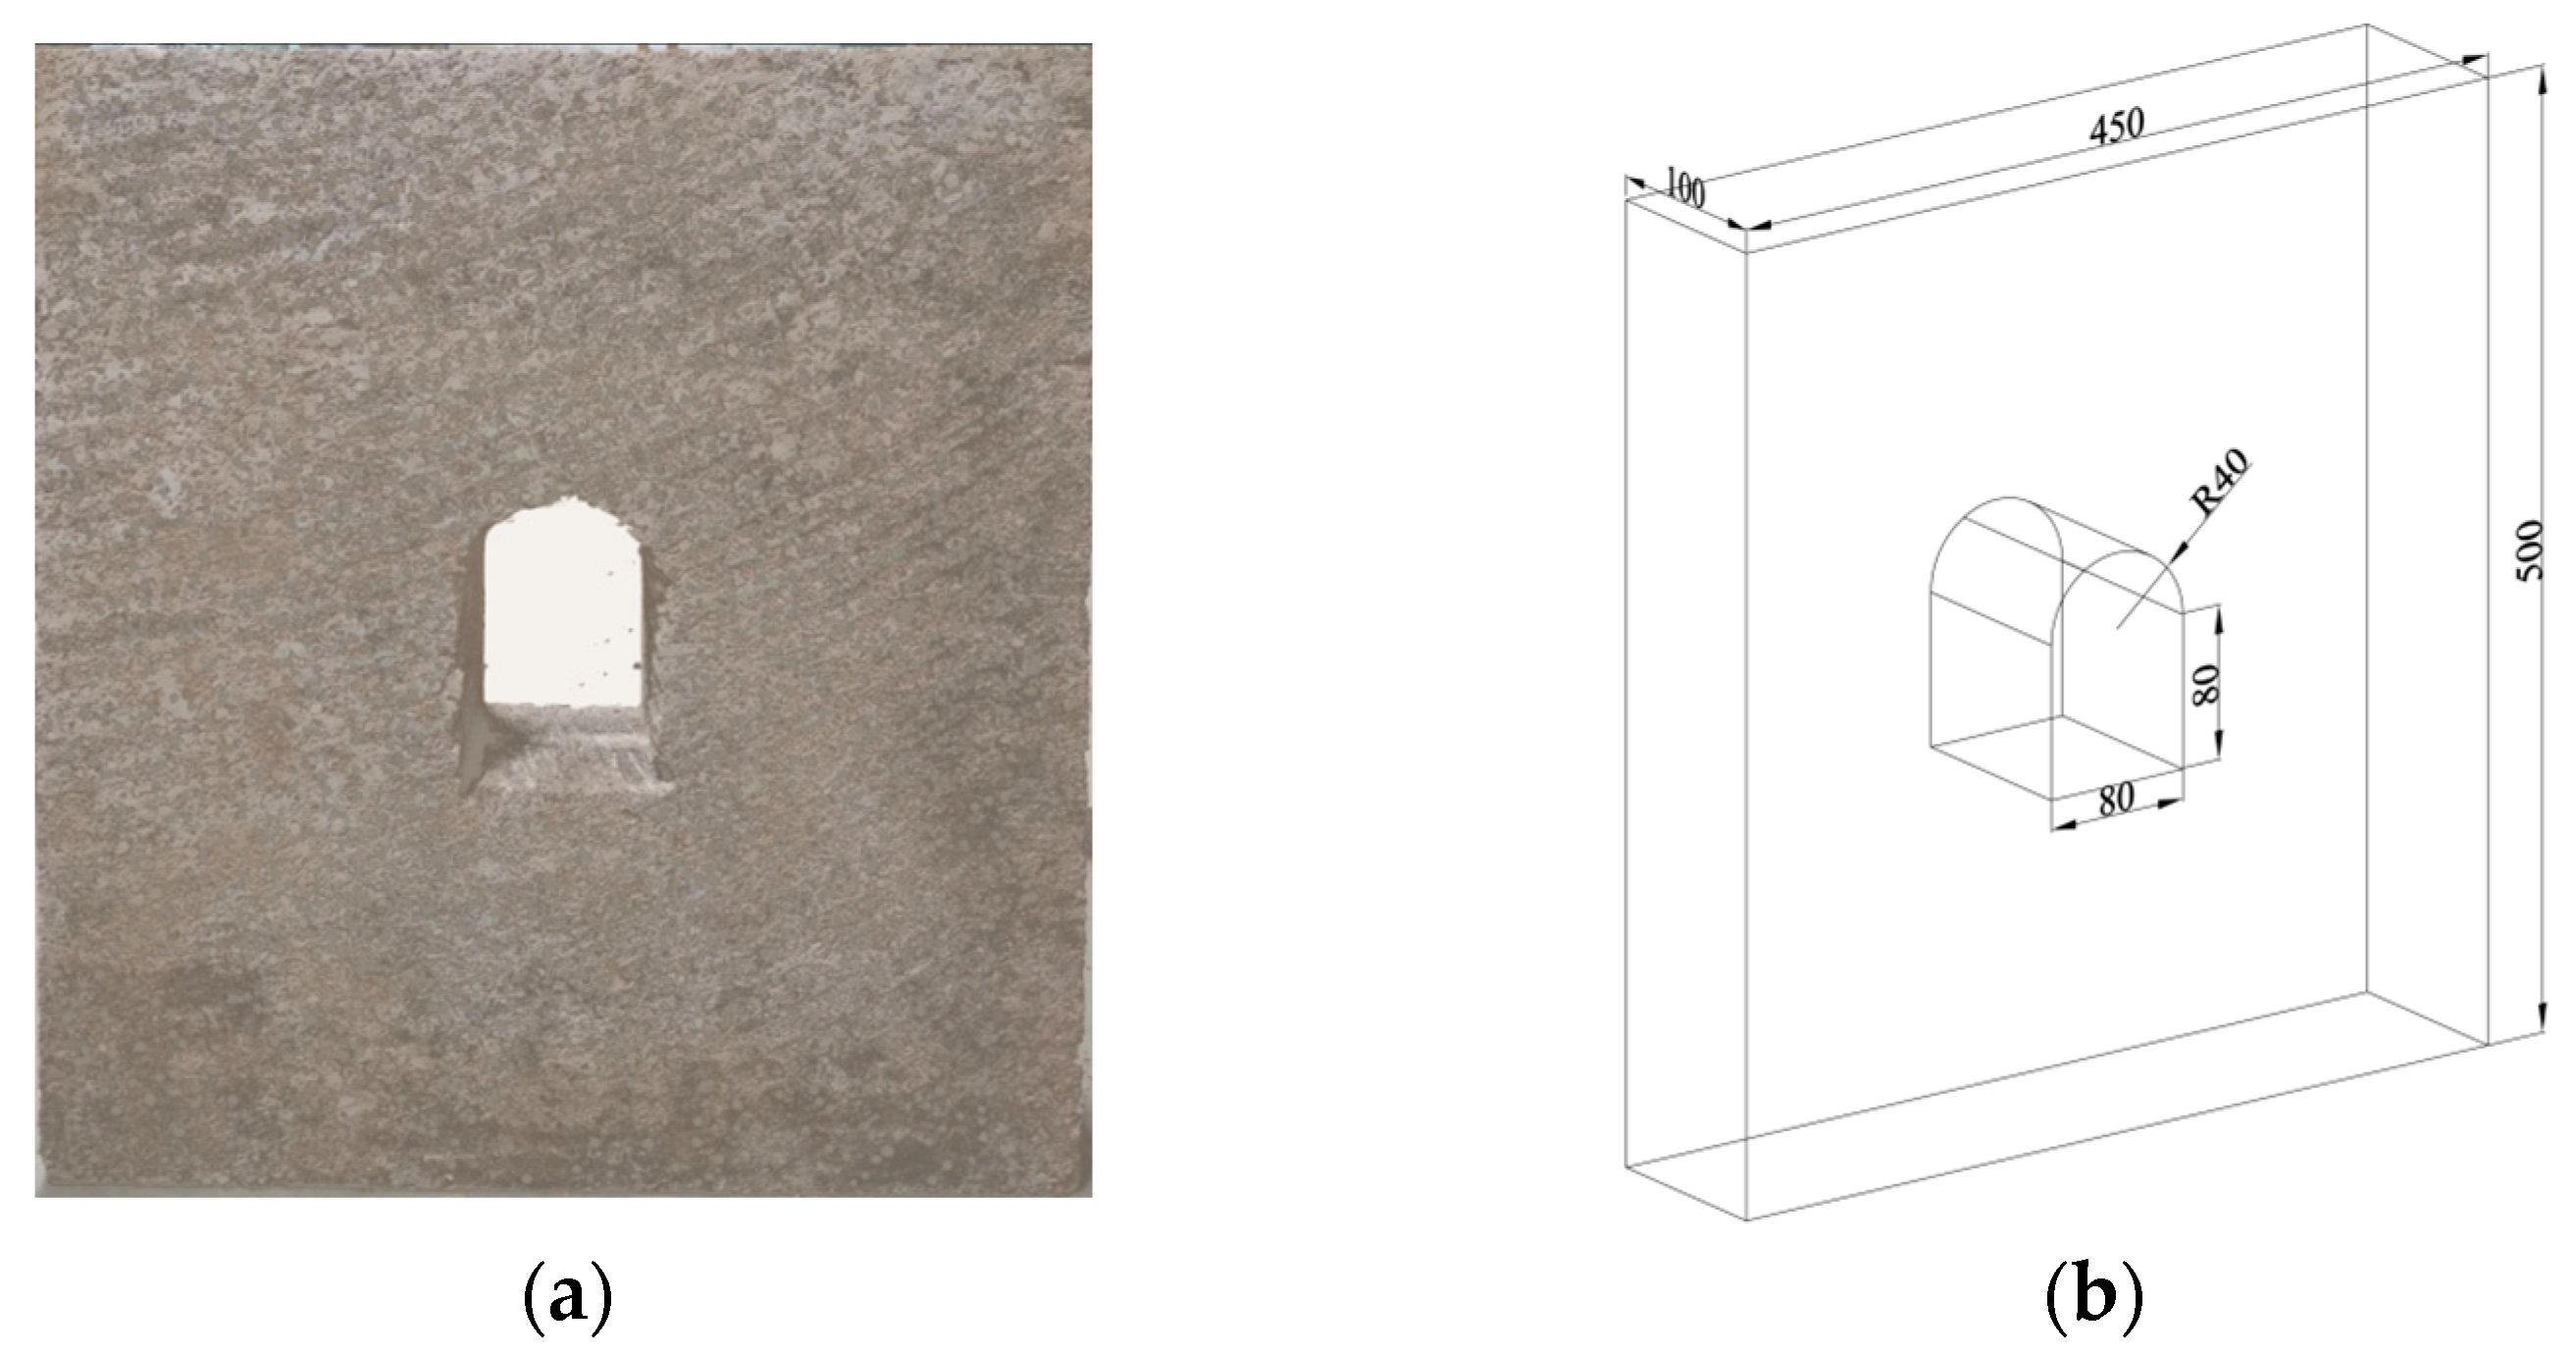
A large highly weathered natural sandstone block was extracted from an underground tunnel field; according to the experimental requirements, the block was cut into a square specimen and a standard cylinder specimen, and the surface of the specimen was polished to ensure the flatness of the loading surface. The length, width, and thickness of the square specimen model were 450 × 500 × 100 mm respectively. A straight-walled arched hole was dug through the specimen in the model with a water knife. The radius of the semi-circular arch was 40 mm, the height of the wall was 80 mm, and the length of the bottom was 80 mm, as shown in Figure 1. Then, the model surface was ground, and then black and white matte paints were sprayed on the model surface to attain the randomly distributed black speckle patterns against the background of the primary color of the rock, so as to facilitate data monitoring in the subsequent test process.
The standard cylinder specimen model size is Φ50 × 100 mm, laboratory tests showed that the uniaxial compressive strength, elastic modulus, density, and wave velocity of the standard cylindrical sandstone sample were 43 MPa, 10.1 GPa, 2100 to 2500 kg/m3, and 2940 m/s, respectively.
2.2. Acoustic Emission Monitoring System
The acoustic emission (AE) system was a PCI-2 multi-channel AE monitor (Physical Acoustics Corporation (PAC), West Windsor Township, NJ, USA), equipped with a Nano30 resonant high-sensitivity sensor. An Express-8 analyzer was employed to determine parameters including the ring-down count. The equipment is used to collect acoustic emission information and give early warning of rock mass failure.
The AE threshold, resonant frequency, preamplifier threshold, and sampling frequency in the tests were set to be 28 dB, 20 to 400 KHz, 40 dB, and 1 MHz, and four AE data acquisition channels were used. After setting the parameters, a coupler was smeared onto the sensor and the model surface at to enhance the intimacy of contact between the two. Moreover, the sensor was fixed onto the tunnel surface with an adhesive tape. The lead break tests were performed to check whether signals in each channel of the AE system were normal or not. The loading and monitoring systems in the tests are shown in Figure 2.
2.3. Single Tunnel Biaxial Compression Test of Sandstone
A TATW-2000 triaxial testing machine (Changchun Chaoyang Test Instrument Co., Ltd., Changchun City, Jilin Province, China), for rocks was used to conduct biaxial compression tests on the single-tunnel sandstone model. The testing machine could monitor information, including the load and deformation, in real time during tests. On the left- and right-hand sides of the model were steel pressing plates, which were connected to hydraulic pumps, by which uniform confining pressures were applied to the left and right sides of the model. To ensure that the model was uniformly stressed, a steel pressing plate was placed on the top and bottom of the model. The four sides of the model, including the upper, lower, left, and right sides were coated with a layer of Vaseline™ in a bid to reduce the influence of friction on the test results. To avoid eccentric compression, the center of the vertical loading cylinder of the testing machine was on the same perpendicular line as the tunnel center. The stress state is illustrated in Figure 3a; the loading device used in the tests is shown in Figure 3b.
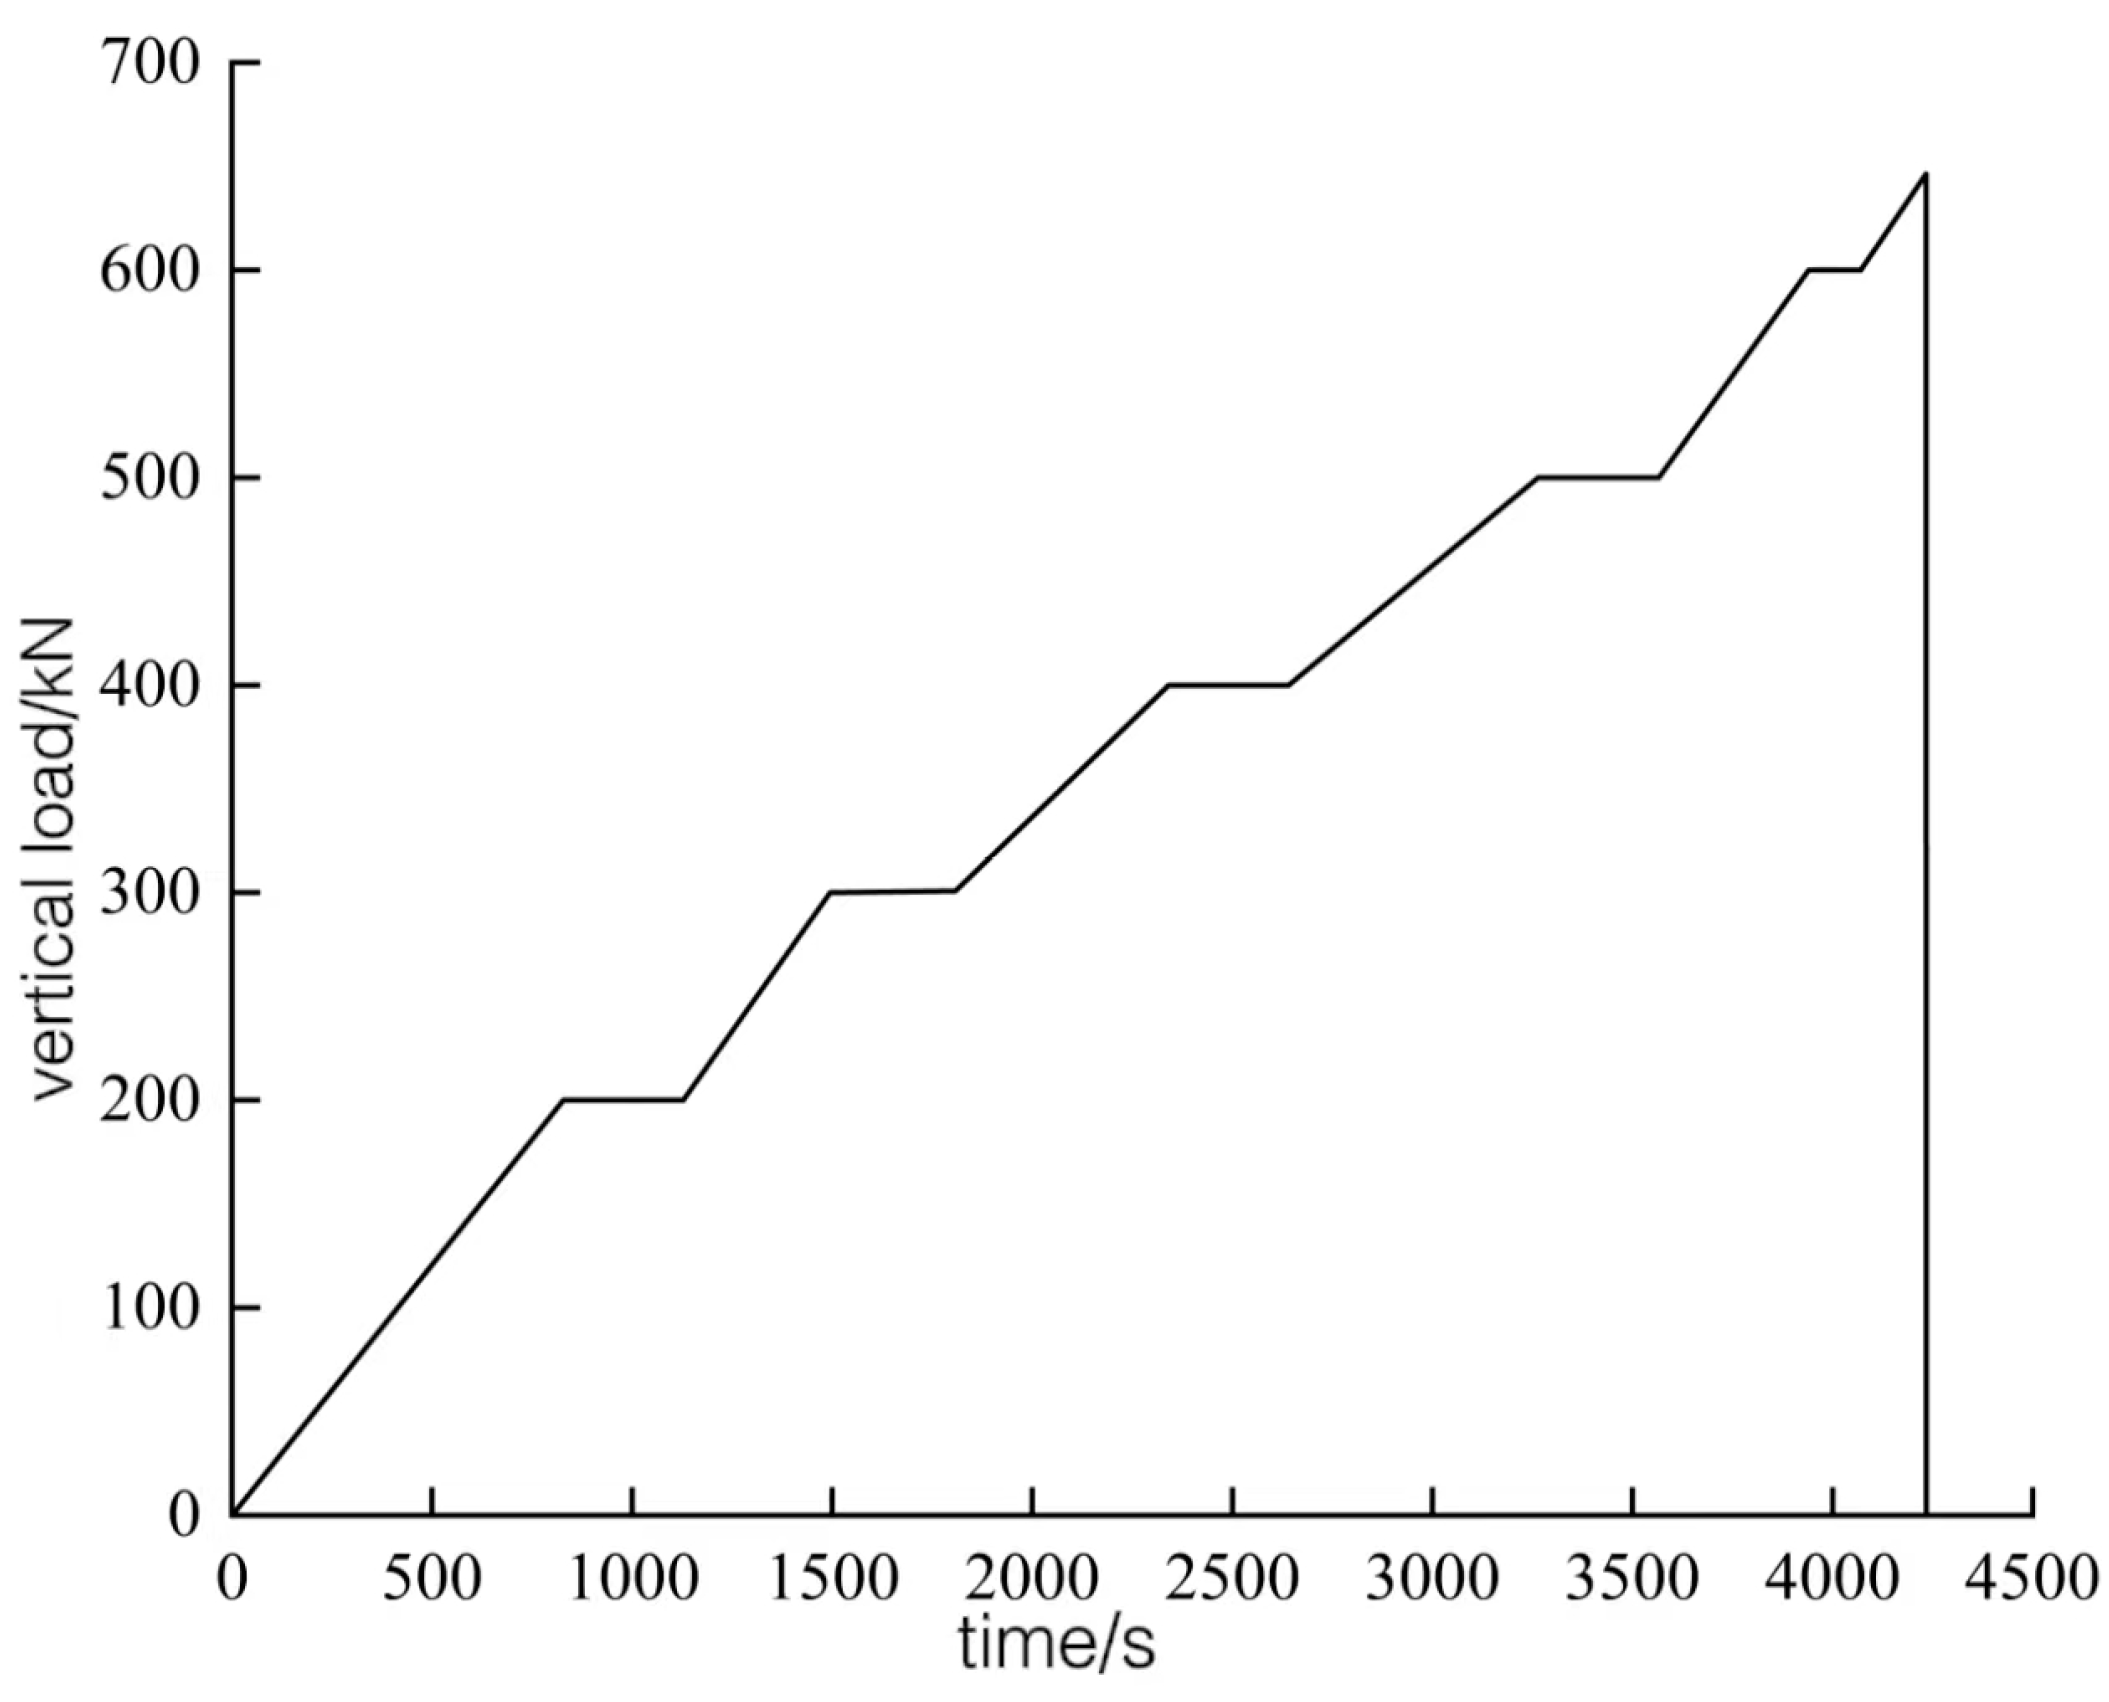
Confining pressures of 3 MPa were applied to both sides of the tunnel model, while the vertical load was applied in multiple stages (Figure 4). The ultimate vertical load that could be borne by the tunnel in the highly weathered sandstone was about 700 kN. The loading path of the vertical load Fz was designed as follows: the stress-controlled mode was used to increase Fz to 200 kN at 500 N/s, followed by holding for 300 s; multi-stage loading was the adopted to increase the load to 100 kN at 0.02 mm/min in displacement-controlled mode (also held for 300 s after loading in each stage). Loading continued until failure of the tunnel.
Digital image correlation (DIC) was adopted to record the deformation process of the model surface based on the biaxial loading scheme of the model with a single straight-walled arched tunnel. In the test process, a high-speed camera was put separately in front and behind the model to record the development of surface deformations of the tunnel, as shown in Figure 2. The images were acquired at 5 frame/s to collect acoustic emission data simultaneously.
2.4. PFC Simulations
The discrete element of PFC advocates natural simulation of large deformation of rock mass or soil mass, so it will not destroy the change form caused by rock and soil sliding. The discrete element method has the advantage of not being constrained by deformation. It can automatically simulate the basic properties of the medium, reflect the anisotropy of stiffness and strength caused by the stress–strain path, and simulate the natural generation of micro cracks in the medium and the natural diffusion of energy when the medium is broken. The discrete element method overcomes the limitation of the traditional macroscopic continuity hypothesis, allowing the examination of the macroscopic mechanical behaviors of geomaterials from the mesoscopic perspective, and explore the relationship between macroscopic and mesoscopic characteristics, providing a visualization approach for revealing the internal failure mechanism of rock mass.
2.4.1. Contact Models
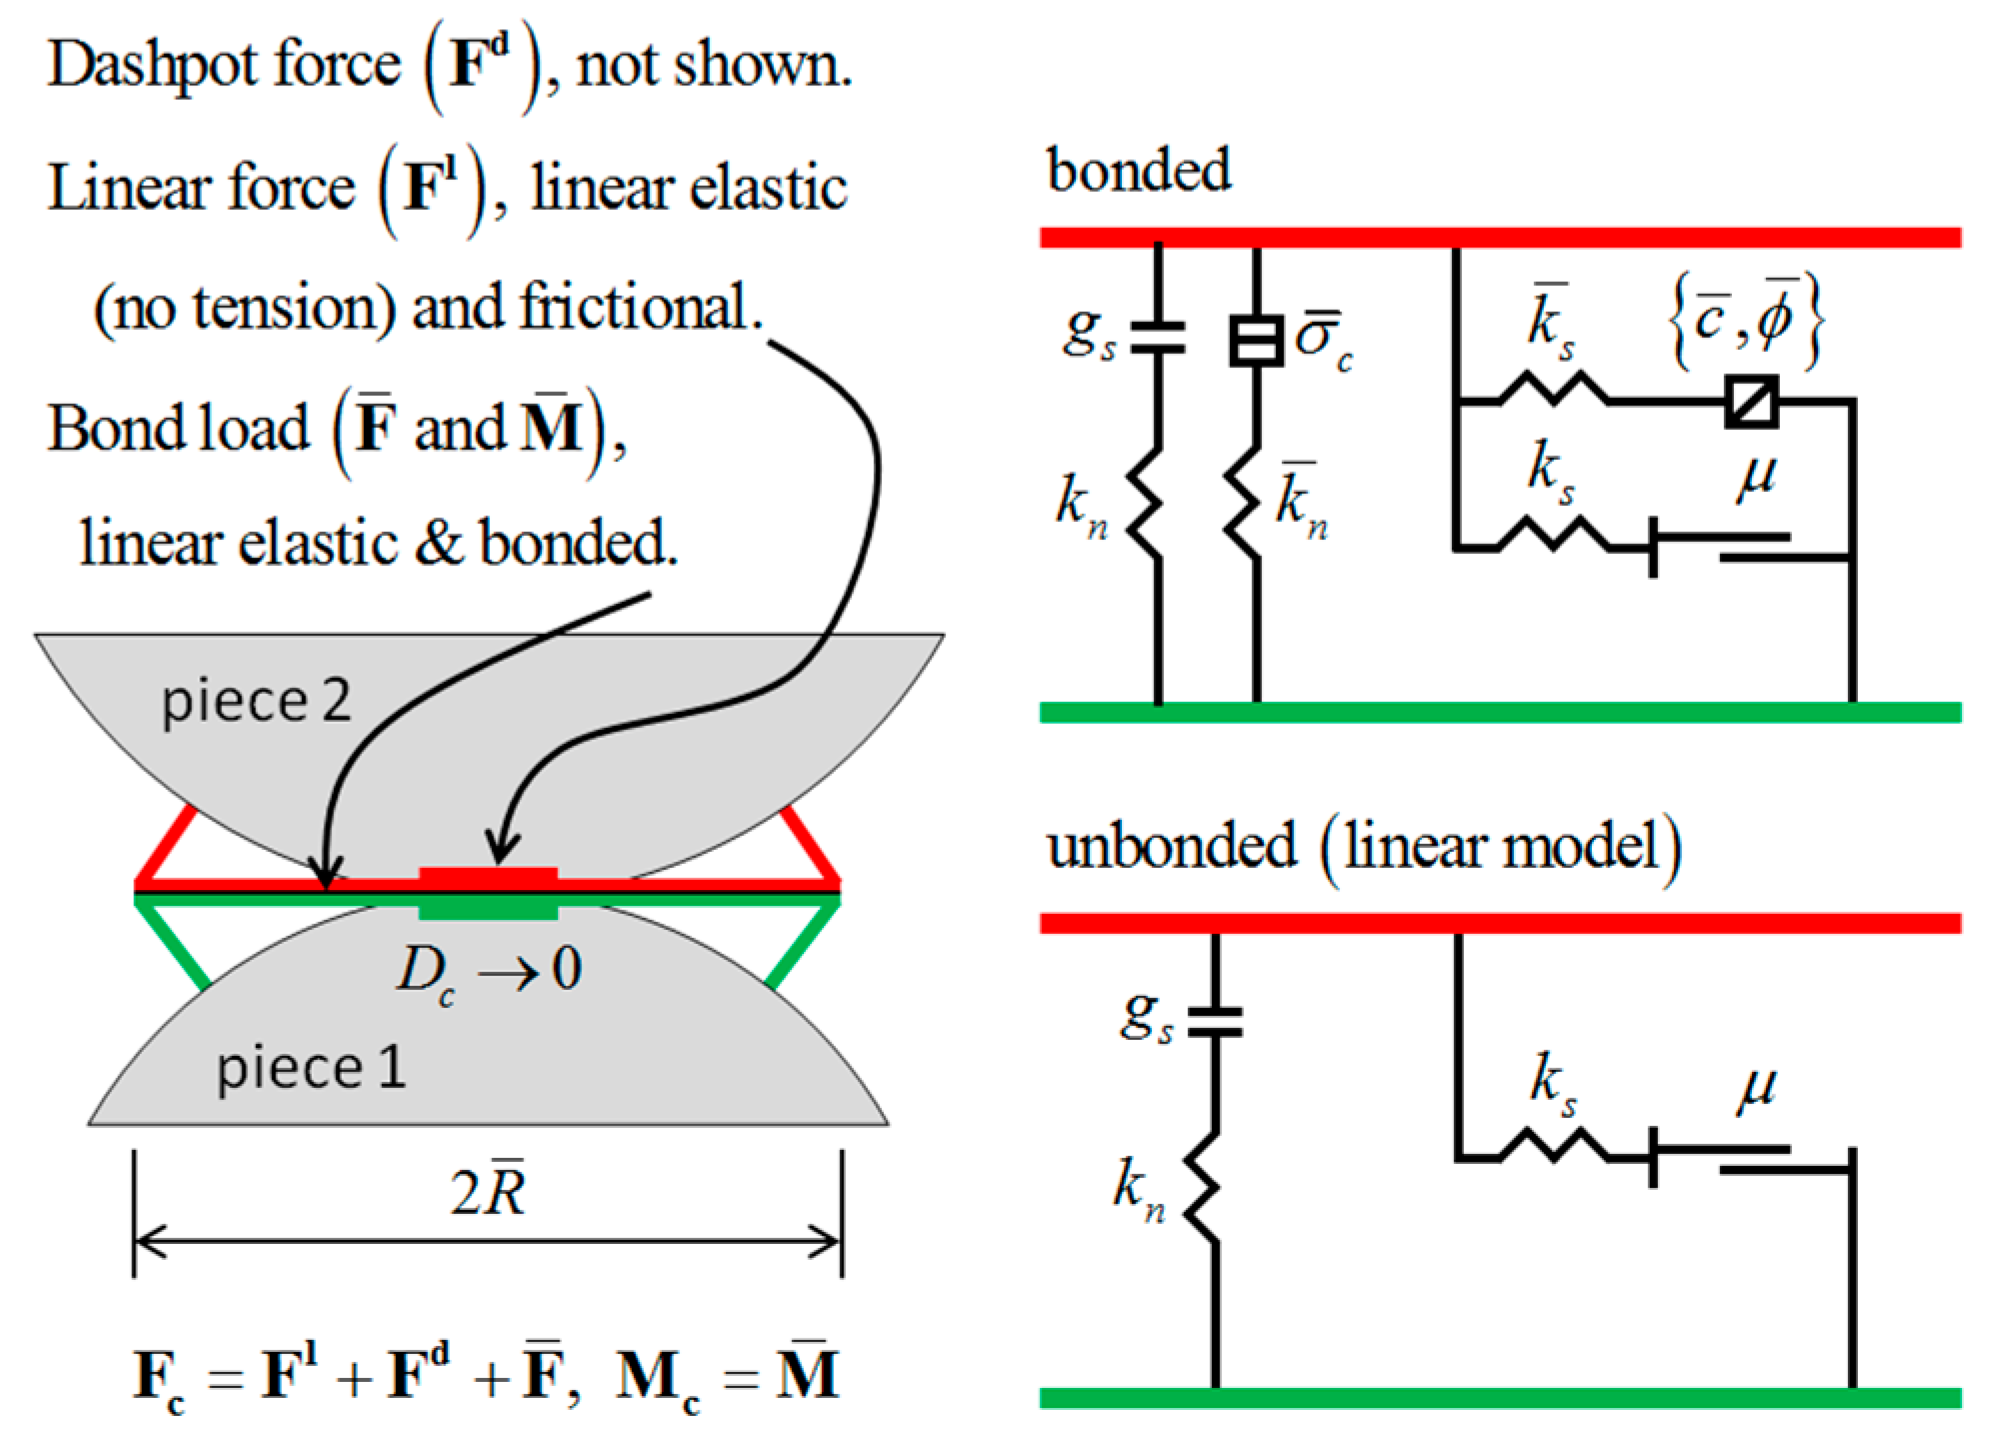
As rigid particles in the discrete element program cannot be deformed, the interaction between particles is solved by establishing the particle–particle contact. When a particle comes into contact with boundaries such as other particles or a wall, a contact model is formed at the surface connection of each particle, as shown in Figure 5. In the constitutive model of contact elements, the parallel-bond model is regarded as a set of elastic springs of constant normal stiffness and shear stiffness that are uniformly distributed on the cross-section centered on the contact point, as shown in Figure 6.
2.4.2. Mesoscopic Parameters
Parameters were adjusted using the control variable method. Influences of each mesoscopic parameter and mesoscopic parameters of the material itself on the overall macroscopic mechanical properties of the model were analyzed one-by-one, thus acquiring the influence between (or trend in) macroscopic and mesoscopic parameters. In the adjustment process, the numerical model was loaded until failure. As characteristics including the overall compressive strength, distribution characteristics of surface cracks, and failure modes of surrounding rocks tend to be consistent with test results of the model of the straight-walled arched tunnel, it means that this group of PFC mesoscopic parameters can correspond to the macroscopic mechanical properties of sandstone. After adjusting the parameters multiple times, the PFC mesoscopic parameters were finally obtained, as listed in Table 1.
2.4.3. Model Design
The design size of the PFC model remains identical to the size of the similarity model in the laboratory tests. Taking the surrounding walls of the model as boundaries, the overall size of the sample was 450 mm × 500 mm, as shown in Figure 7. The walls were set as rigid bodies that can be translated; that is, the walls could be translated vertically or transversely in the overall failure process, but could not be rotated or deformed. By setting random seeds, a total of 13,861 rigid spheres with particle sizes of 4 to 5 mm were generated randomly in the walls. A wall in the specified shape was generated at the center of the model, and particles therein were deleted to realize excavation. The span and height of the wall in the straight-walled arched tunnel were both 80 mm, and the wall was deleted after excavation to reproduce the free state of the rock surrounding the tunnel.
3. Results
3.1. Test Results
3.1.1. Characteristics of Load–Deformation Curves
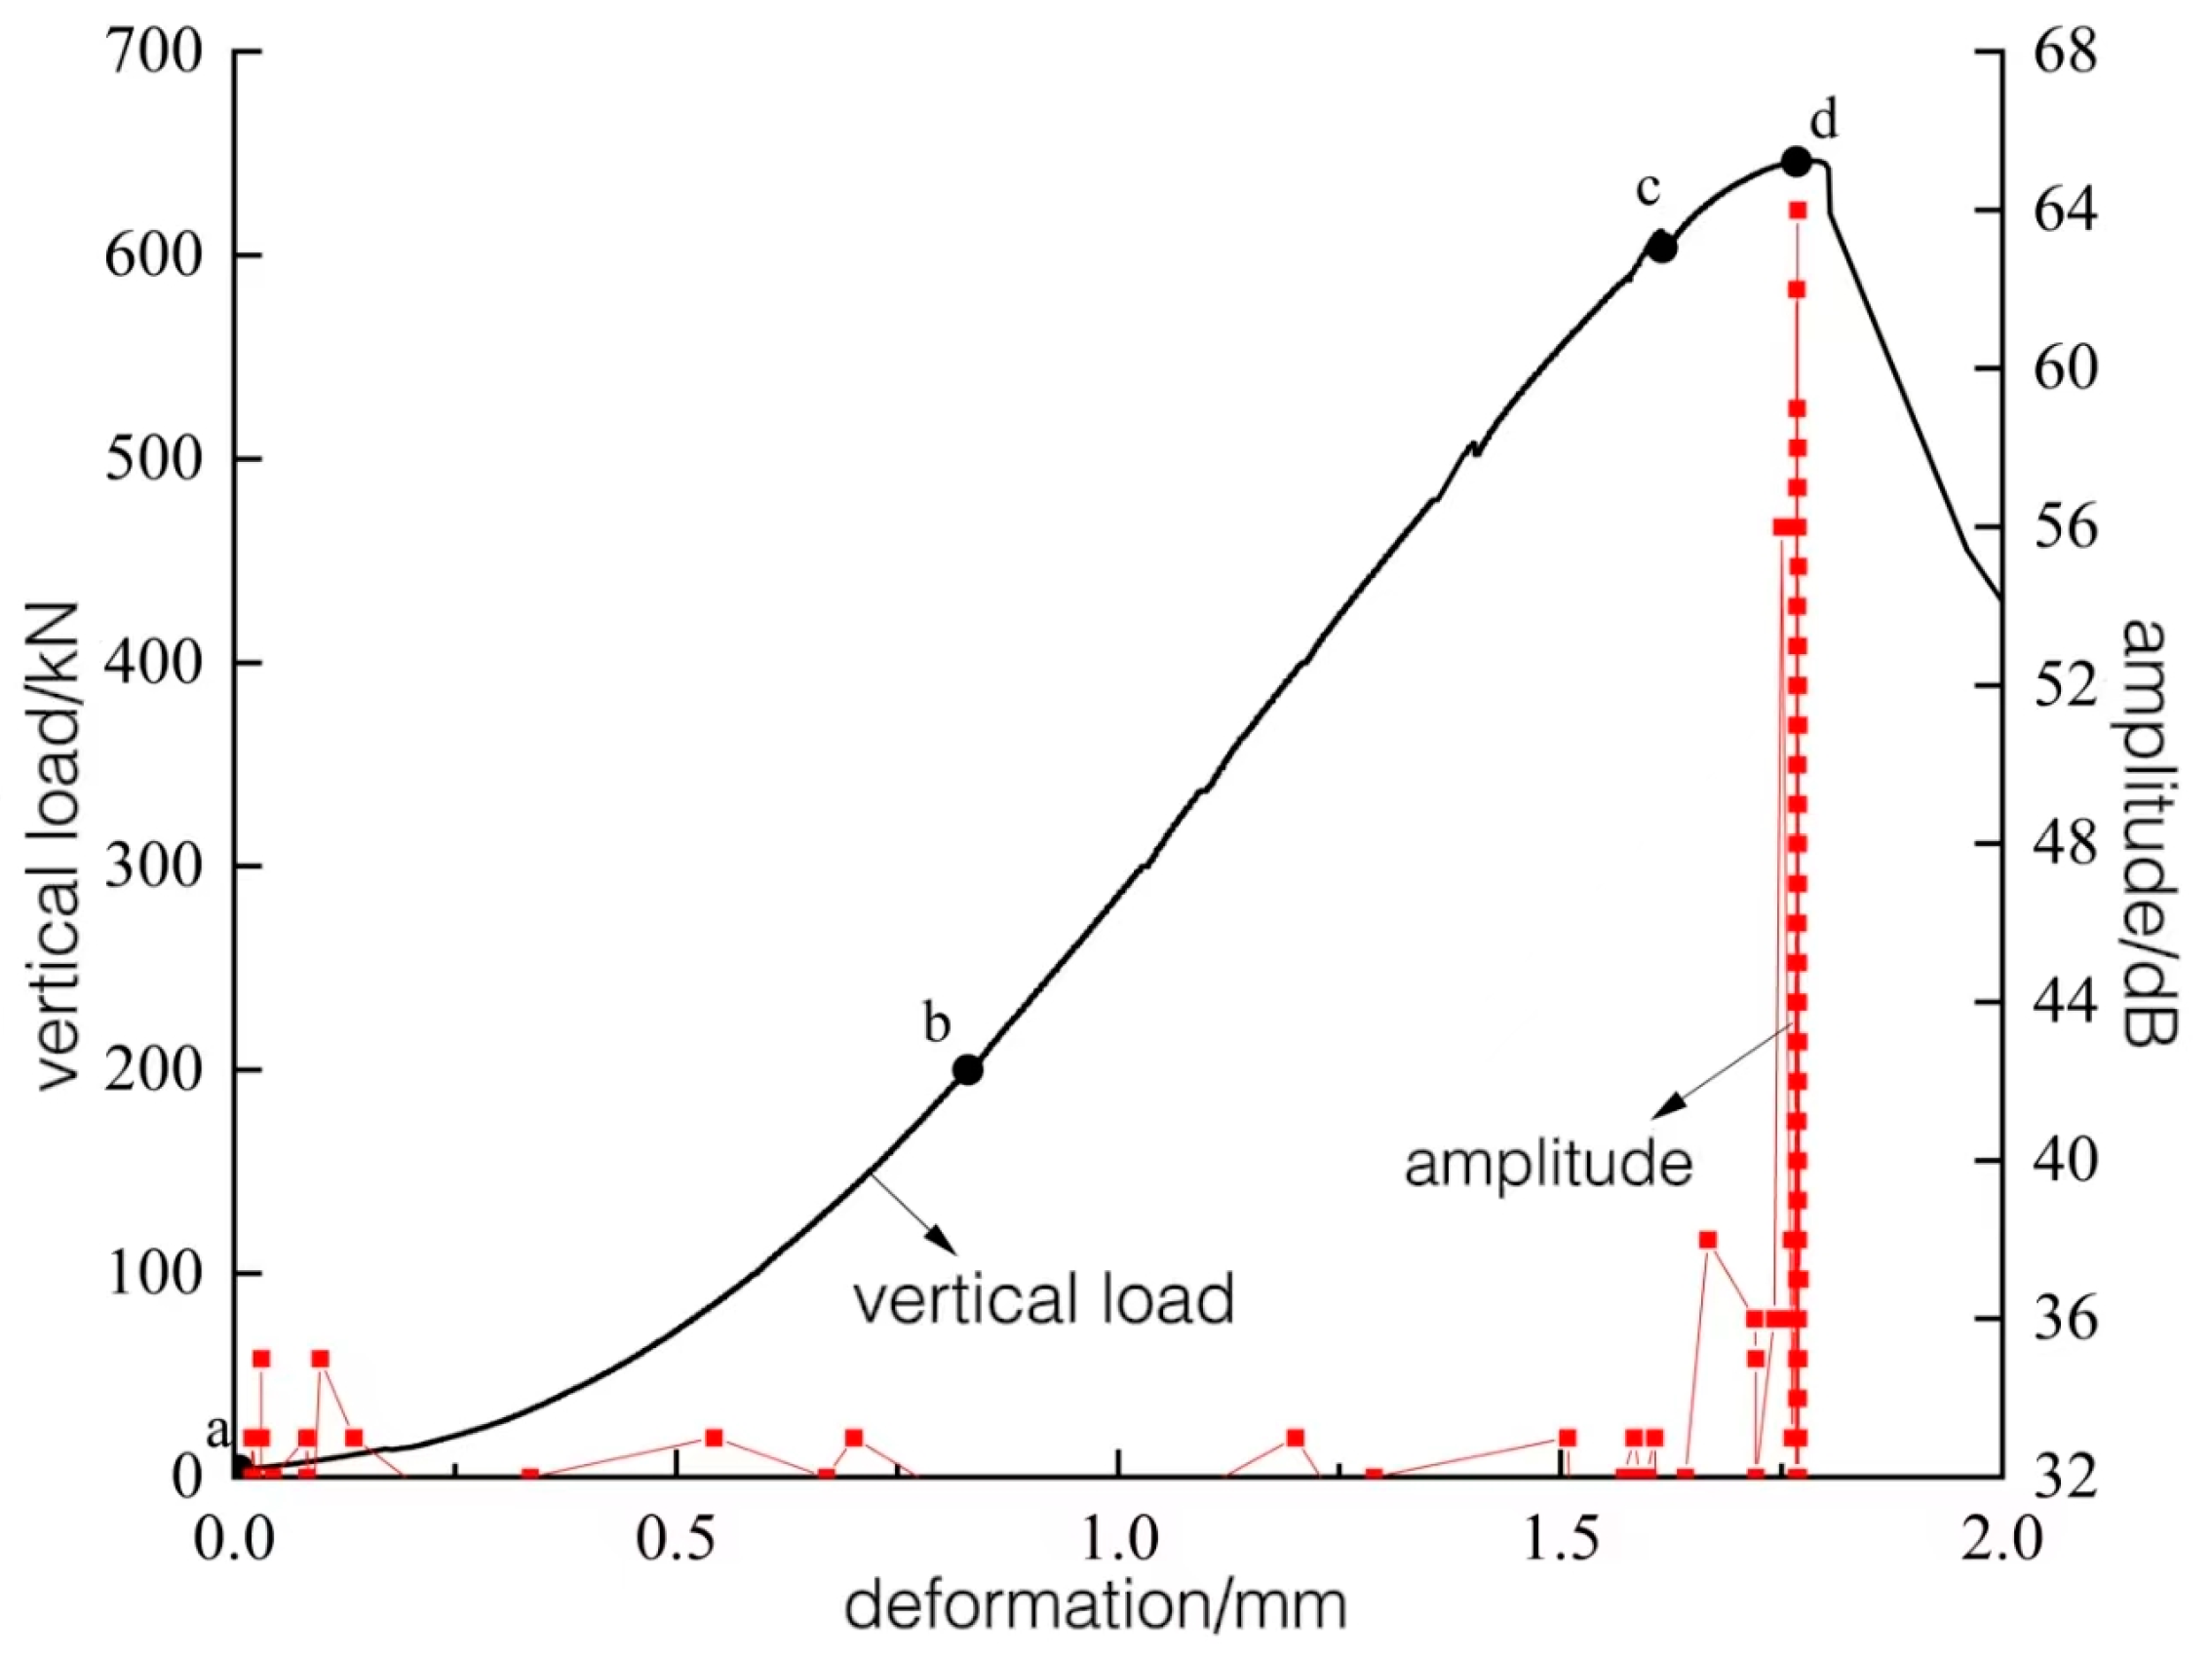
The vertical load–deformation curves of the straight-walled arched tunnel are shown in Figure 8. The tunnel deformation mainly experiences four stages: closure stage of pores in surrounding rocks of the tunnel (ab), elastic deformation stage (bc), crack propagation stage (cd), and post-peak drop stage (de). In section ab, the opened structural planes or micropores in rock mass around the tunnel are gradually compacted, and the load–deformation curve is concave. In section bc, the load–deformation curve changes linearly, without visible new cracks. The load–deformation curve in section cd deviates from the straight line from point c, after which the curve becomes convex, indicating that macrocracks initiate and constantly propagate and finally the load reaches the peak stress (point d). In the post-peak stage, the bearing capacity of the tunnel declines rapidly, internal cracks coalesce, surface rock mass is exfoliated, and large areas of rock mass around the tunnel are damaged. After a short time (point e in Figure 8), the tunnel shows overall failure accompanied by a loud sound. The displacement at the peak load is about 1.8 mm.
3.1.2. Failure Characteristics
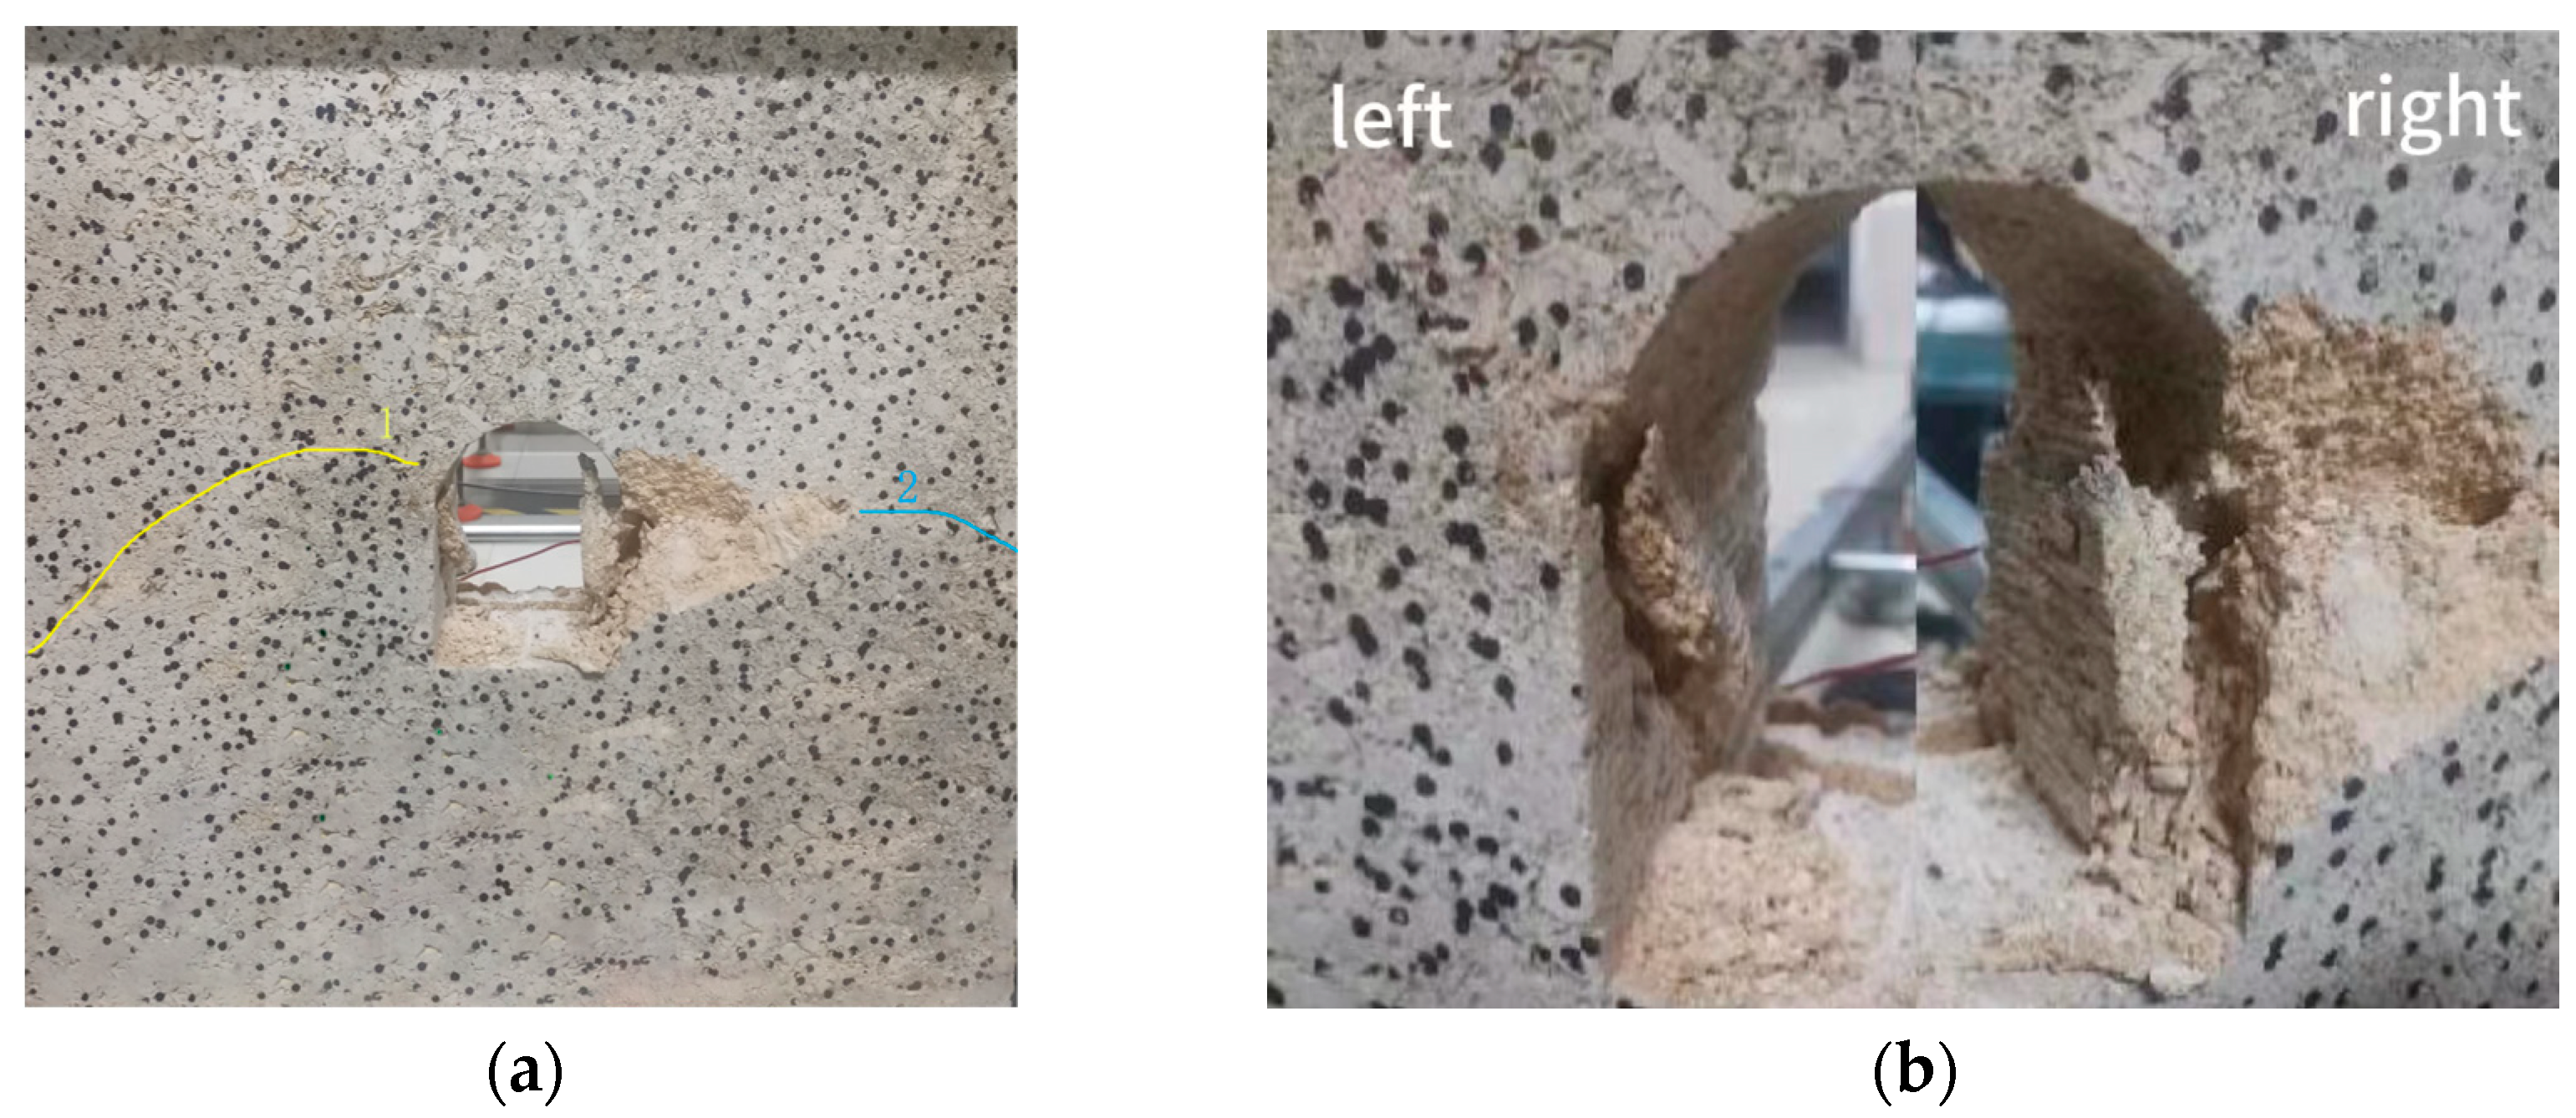
Failure of the tunnel constructed in sandstone mainly occurs in the walls on both sides, that is, between the spandrels and arch feet, as shown in Figure 9a. Crack 1, developing obliquely from the spandrel to the lower left part, is found in the left-hand side of the tunnel, and an approximately horizontal crack (Crack 2) appears on the right of the tunnel entrance after the rock spalled off. Walls on both sides differ in their degree of damage, with the right-hand wall damaged more severely than the left. The vault is not obviously damaged. A macrocrack going through the whole tunnel along the horizontal direction occurs at the center of the floor. As a result, the straight-walled arched tunnel experiences brittle failure, accompanied by the loud sound.
A V-shaped notch is formed after exfoliation of rock mass in the right side of the entrance, as shown in Figure 9b. The tunnel wall is cut into tabular rock mass by cracks that develop upwards along the right wall from the arch foot, and surrounding rocks are separated and exfoliated from the side wall. The exfoliated rock blocks are 30 mm thick. In comparison, the left-hand wall is damaged slightly, on which a small rock block cut by cracks is separated from the tunnel wall while not exfoliated. No cracks appear at the vault and invert of the tunnel.
3.1.3. Comparison of Failure Patterns of Tunnels
Scholars have studied the failure of real rock mass with an arched cavity with a wall. Zhibin Zhong et al. [7,8] conducted a biaxial compression test on hard rhyolite with an arched cavity with a wall, and found that the samples of an arched cavity with a wall first produced cracks near the arch line and arch foot of the side wall, and the arch roof showed the characteristics of tensile fracture. The tensile fracture divided the rock into wedges attached to the arch roof. The soles and sidewalls were compressed-shear cracked and the sheet side fell off. Fengqiang Gong et al. [9] conducted a simulation test study on slab crack failure in the surrounding rock of a deep walled arched tunnel, and found that the crack first expanded horizontally along the arch foot, then extended upward along the side wall after a certain length, and then evolved into horizontal expansion after a certain height, forming a local slab crack rock sheet, and then extended upward to the arch waist. In this process, the side wall is cut into a multi-layer slab thin rock sheet approximately parallel to the side wall, and the stretched rock sheet accumulates buckling deformation and spalling successively. Compared with the failure patterns of the sandstone tunnels in this paper, the failure of the straight-walled arched tunnel mainly occurs in the wall area (arch foot and spandrel) on both sides, and the slab thin rock slices appear on the side walls and fall off. Because of the non-uniformity of the rock mass and the different buried depth of the tunnel, the development and failure patterns of the three macroscopic cracks are different.
3.1.4. AE Monitoring Results
The changes in the AE count and amplitude with tunnel deformation in the deformation process are illustrated in Figure 10 and Figure 11. AE activities are weak in the initial loading stage. AE activities do not begin to intensify until the mid-to-late loading stage (t = 4238 s, Fz = 646.08 kN), which indicates that cracks do not initiate and propagate to any significant extent in the early loading stage of the weathered sandstone. Only when reaching a high load can microcrack propagation be intensified in the rock.
At t = 4238 s (Fz = 646.08 kN), the AE count jumps at the first time (① in Figure 10). Before this, the AE amplitude fluctuates between 28 and 34 dB, while it begins to increase at that time (from 32 to 39 dB), as shown in Figure 11, foreboding the occurrence of cracks around the tunnel.
At t = 4239 s (Fz = 646.27 kN), the AE count is found to undergo a second jump (② in Figure 10). The AE count and amplitude tend to increase, with the amplitude being 56 dB. At this moment, a crack developing obliquely (30°) towards the lower right appears at the right spandrel of the tunnel. When reaching the peak load, the AE count and amplitude separately reach their maxima (3277 and 64 dB).
At 4240 ≤ t ≤ 4242 s, the AE count and amplitude show abrupt increments. The rock mass is exfoliated from the right wall of the tunnel, the rock mass on the right-hand wall is buckled, and the rock mass on the left side wall bulges, finally leading to the brittle failure of the rock mass.
The parameter b in the relationship between earthquake magnitude and frequency was used to study the deformation and failure process and characteristics of the tunnel. According to the calculation method of the AE b-value in previous research [20], each group of 100 AE events was set as a computing section. In this way, the changes in b were revealed, as shown in Figure 12. The AE b-value always fluctuates within the range of 0.10 to 0.33. After entering the crack propagation stage (point A in Figure 12), the b-value begins to change in a different manner and tends to decrease to the lowest point at 0.05. This indicates that internal cracks around the tunnel begin to propagate unsteadily. In summary, when the AE b-value decreases constantly, it heralds imminent failure.
3.2. Numerical Simulation Results
Figure 13 displays the meso-fracture evolution process in the overload simulations of the model of the straight-walled arched tunnel. The red is the tensile fracture, and the blue is the shear fracture. The overall ultimate bearing capacity of the model is 24.85 MPa. Under a vertical stress of 14.53 MPa (58.47% of the peak stress), a small fracture concentration zone is formed in the middle of the right wall, and one to three tensile fractures are initiated at the left arch foot. Under a vertical stress of 18.29 MPa (73.60% of the peak stress), fractures on the right-hand wall coalesce and cut the rock mass, such that some particles in the middle of the wall are spalled into the tunnel. A few tensile fractures are scattered from the left-hand wall to the middle of the spandrel. Under a vertical stress of 20.25 MPa (81.49% of the peak stress), fractures in the middle of the right-hand wall continue to develop, forming an arcuate fractured zone that develops obliquely from the arch foot to the upper part, in which shear fractures appear. Fractures at the left arch foot are clustered in the middle of the wall, accompanied by the falling of a few particles. A strip tensile fracture of 40 mm long is formed at the invert.
Under a vertical stress of 22.82 MPa (91.94% of the peak stress), the number of fractures clustered on the right-hand wall increases, and rock mass at the arch foot is squeezed into the tunnel after being cut by the fracture; an arc-shaped fractured zone with the width of 30 mm is formed in the left side, which is distributed on the whole wall. A lot of fractures are clustered at the position 25 mm from the lower left arch foot, which tend to develop obliquely downwards. When the vertical stress is 23.75 MPa (95.57% of the peak stress), a slender fracture concentration zone, distributed obliquely upwards, is formed in the right spandrel, and the number of fractures in the wall further increases; the fractured zone on the left-hand wall enlarges and begins to coalesce with the fractured zone at the arch foot. Under a vertical stress of 24.85 MPa, the overall load on the model reaches its peak. Under the condition, large areas of fractured zones are formed in walls on both sides of the tunnel. The slender fractured zone at the arch foot coalesces with the fractured zones in the walls and develop to the boundaries, causing overall failure of the model.
Altogether, in the PFC test of the walled circular arched chamber, the microcracks are mainly tensile cracks, and a few shear cracks are mainly distributed near the mouth. Tensile fractures are initiated in the middle of walls or the arch feet at first, and then arc-shaped fracture concentration zones are formed from the arch feet to the middle of walls, in which shear fractures appear, accompanied by the falling of a few particles. When the upper load exceeds 90% of the peak stress, coalesced fractured zones are formed within a certain range in walls on both sides, and rock blocks cut by fractures are squeezed into the tunnel. When the overall load on the sample approaches the ultimate bearing capacity, the rock mass on both sides of the tunnel is fractured in large areas, and slender coalesced fractured zones develop to greater depth of the rock mass, leading to overall failure of the sample.
Change curves of the number of meso-fractures with the vertical load in the numerical simulations of the straight-walled arched tunnel are shown in Figure 14. When the vertical load is 13.61 MPa, the number of tensile fractures and the total number of meso-fractures increase slightly, and the curve slopes begin to increase thereafter; shear fractures vary (albeit to no significant extent). Under these conditions, tensile fracture initiation begins at the arch foot of the tunnel, and fractures gradually coalesce in the middle of the walls.
Under a vertical pressure of 22.82 MPa, the number of tensile fractures increases abruptly, while that of shear fractures jumps slightly and its rate of growth begins to increase. At that moment, the proportion of shear fractures increases from 7.74% before the abrupt increase to 8.93%. This process corresponds to the formation of fractured zones on the left-hand wall and the occurrence of shear fractures at the right arch foot in the meso-fracture evolution diagram. The numbers of various types of fractures all increase substantially when the vertical load reaches the peak, in which the proportion of shear fractures grows to 11.24%.
4. Simulations of Optimization of the Height–Span Ratio
4.1. Simulation Schemes
The straight-walled arched tunnel commonly seen in the design of main tunnels of water-sealed gas storage projects and showing more obvious failure modes was taken as the research object. The height–span ratios were designed at four levels: 0.8, 1.0, 1.5, and 1.8. The corresponding numerical model was established in PFC2D. The overall size of the model and the span of the tunnel remained unchanged, while only the tunnel height was changed to adjust the height–span ratio. The mesoscopic parameters of various models are consistent with the aforementioned stress paths. The dimensions of the excavated tunnel are displayed in Table 2.
4.2. Change Curves of the Number of Fractures
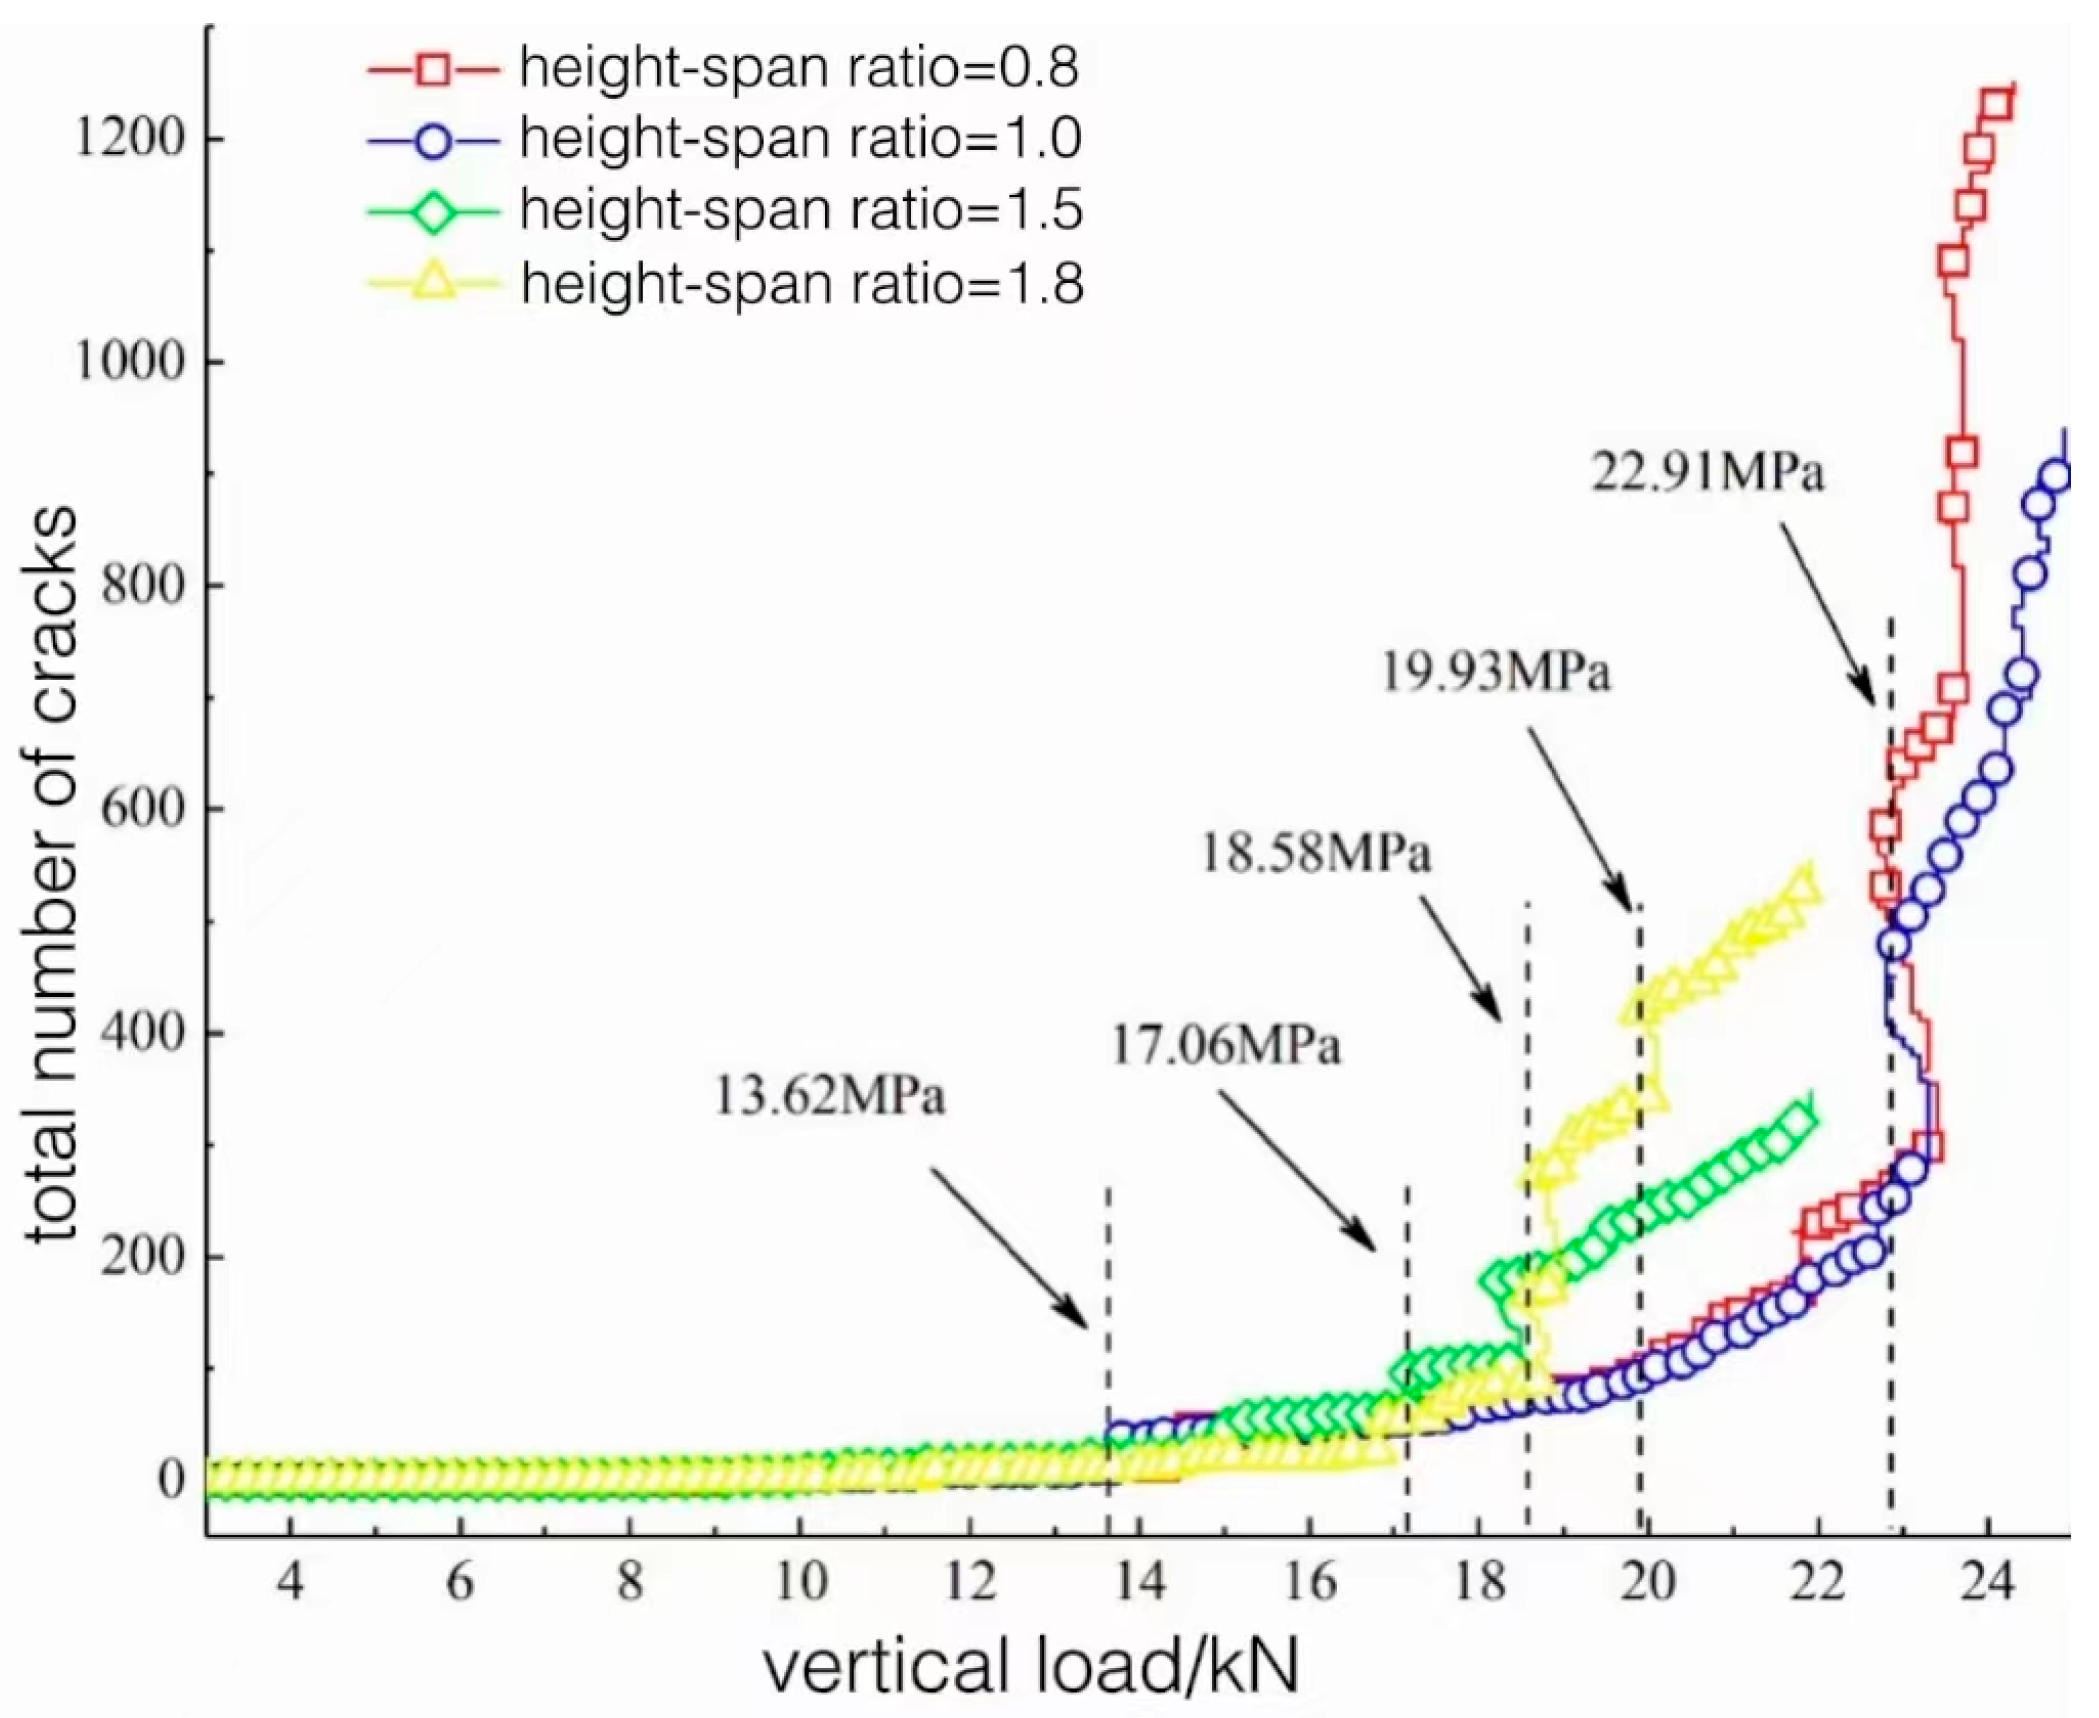
Change curves of the number of meso-fractures in the rock mass before models with different height–span ratios reach the ultimate bearing capacity are shown in Figure 15. When the vertical stress is less than 13.62 MPa, the total numbers of meso-fractures in each model do not change to any significant extent. Under vertical stresses of 13.62 to 17.06 MPa, the total numbers of fractures in the models with height–span ratios of 1.5 and 1.8 show small increments; those of models with height–span ratios of 0.8 and 1.0 maintain the original growth rate. Considering that this load range is about 70% to 80% of ultimate bearing capacities of models with height–span ratios of 1.5 and 1.8, this range is regarded as the crack-initiation range for rocks surrounding the two models.
When the vertical load is 18.58 MPa, the total numbers of fractures in the models with height–span ratios of 1.5 and 1.8 jump substantially, and the latter increases more greatly, of which the absolute number is 1.3 times that of the former. The growth rates of the numbers of fractures in the two models also accelerate obviously after this change.
When the vertical stress is 19.93 MPa, the total number of fractures in the model with the height–span ratio of 1.8 experiences the second substantial jump. After this, the total number of fractures therein is about 1.6 times that of the model with the height–span ratio of 1.5. If the vertical stress is in the range of 17.06 to 19.93 MPa, curves of the numbers of fractures in the models with the height–span ratios of 0.8 and 1.0 do not fluctuate to any significant extent, while the slopes of the curves increase slightly. The load range is about 70% to 80% of the ultimate bearing capacities of models with height–span ratios of 0.8 and 1.0 and 80% to 90% of those with height–span ratios of 1.5 and 1.8. Therefore, the former two are considered in the crack-initiation stage, while the latter two were deemed to apply in the rapid fracture-development stage.
When the vertical load exceeds 19.93 MPa, curves of the numbers of fractures in models with height–span ratios of 1.5 and 1.8 continue to ascend along the slope after the abrupt increase, until reaching the peak load of the model, when the numbers of fractures in the models with height–span ratios of 0.8 and 1.0 increase and do so at a faster rate. In that range, various models are listed in this order 1.8 > 1.5 > 0.8 ≈ 1.0 according to the numbers of fractures therein. The load is higher than 90% of the ultimate bearing capacity of the former two while it is 80% to 90% of the latter two. Therefore, the former two models are regarded in the fracture coalescence stage and the latter two in the rapid fracture development stage.
Under a vertical stress of 22.91 MPa, the numbers of fractures in the models with height–span ratios of 0.8 and 1.0 increase substantially and their rates of growth increase thereafter. Therein, the number of fractures in the model with the height–span ratio of 0.8 increases more greatly and shows the second abrupt change under a vertical stress of 23.50 MPa, and the total number of fractures is 1.5 times that of the one with the height–span ratio of 1.0. This load exceeds 90% of the ultimate bearing capacities of the two models, indicating that the surrounding rocks of the two are in the fracture coalescence stage. Meanwhile, the total numbers of fractures in the two models after the abrupt change exceed those in models with height–span ratios of 1.5 and 1.8 under the peak load, suggesting more intense failure of the rock mass in the two models.
4.3. Stress Characteristics
The peak stress levels and force-chain distribution are separately displayed in Figure 16 and Figure 17. Figure 16 compares the ultimate bearing capacities of models with different height–span ratios. Models with height–span ratios of 0.8 and 1.0 are found to have similar ultimate bearing capacities; while the ultimate bearing capacities of models with height–span ratios of 1.5 and 1.8 are much lower than the above two; the model with the height–span ratio of 1.8 has the lowest ultimate bearing capacity. Benchmarked against the model with the height–span ratio of 1.0, the ultimate bearing capacities of models with height–span ratios of 0.8, 1.5, and 1.8 are 97.95%, 88.17%, and 85.79%, respectively, of the one with the height–span ratio of 1.0. This indicates that an overlarge height–span ratio significantly reduces the ultimate bearing capacity of the rock.
The force-chain evolution in tunnel models with different height–span ratios is shown in Figure 17. It can be seen that stress is always concentrated at both arch feet in the model in each stage (The blue and white areas as shown in the picture), so these positions are most prone to initial fractures. Whereas the overall stress distribution law shows that the stress is uniformly distributed in the four sides of tunnels with height–span ratios of 0.8 and 1.0, stress is mainly concentrated at the vault and invert in models with height–span ratios of 1.5 and 1.8, with low stress in the walls on both sides. It is therefore inferred that an excessively large height–span ratio may give rise to a non-uniform stress distribution in the rock mass and weaken the ultimate bearing capacity thereof.
5. Conclusions
(1) Failure of the tunnel constructed in sandstone mainly occurs in the walls on both sides (between spandrels and arch feet), showing slabbing failure characteristics. The side walls of the tunnel are cut by cracks into multi-layer tabular rock blocks approximately parallel to the side walls. These rock blocks undergo buckling deformation and are finally detached from the side walls. The duration from crack propagation to failure of surrounding rocks is short (5 s), which indicates the abruptness of the failure.
(2) Crack initiation and propagation are not apparent in the early stage of loading of the sandstone. After reaching a high load, AE activities begin to be enhanced and propagation of internal microcracks in the rock is intensified. The slight increments in the AE count and amplitude and the constant reduction in AE b-value forebode that the tunnel is about to be damaged.
(3) In PFC simulations, tensile fractures are initiated in the middle of walls or arch feet, then arcuate fracture concentration zones develop, in which shear fractures appear, accompanied by a few particles falling off. When approaching the ultimate bearing capacity, large areas of the rock mass on both sides of the tunnel are fractured, and the slender coalesced fractured zones develop to greater depth in the rock mass, causing the overall failure of the sample.
(4) Stress is distributed uniformly over the four sides of the tunnels in models with height–span ratios of 0.8 and 1.0, while stress is mainly concentrated at the vault and invert in models with height–span ratios of 1.5 and 1.8. An excessive height–span ratio may give rise to a non-uniform stress distribution in rock mass and weaken the ultimate bearing capacity of the rock mass.
This test is a plane strain model, not a true three-dimensional model, which cannot well reflect the three-dimensional stress state in the field. Moreover, the rock mass is taken as a homogeneous model, without considering the influence of joints and cracks, which has certain limitations. The next step is to consider the occurrence of joints and cracks in the rock mass, and further optimize the model to make it more suitable for real situations in the field, so as to play a greater role in practical engineering applications.
Author Contributions
Conceptualization, J.G.; methodology, Y.C.; software, Y.P.; formal analysis, X.D.; investigation, X.D.; resources, X.W. and Y.P.; writing—original draft preparation, J.G.; writing—review and editing, Q.L.; project administration, X.W. All authors have read and agreed to the published version of the manuscript.
Funding
This research was funded by [National Natural Science Foundation of China] grant number [42207201]; [National Natural Science Foundation of China] grant number [52179104]; [National Natural Science Foundation of China] grant number [42272334].
Data Availability Statement
Data are contained within the article.
Conflicts of Interest
Author Jian Gao, Yequan Pan and Xianglin Ding were employed by the company CNPC EastChina Design Institude Co., Ltd. The remaining authors declare that the research was conducted in the absence of any commercial or financial relationships that could be construed as a potential conflict of interest.
References
- Cui, J.H. Experimental and Numerical Simulation Study on Mechanical Properties of Rock Materials Containing Caverns. Master’s thesis, Shaoxing University, Shaoxing, China, 2019.
- Xu, S.L. Experimental study on fracture of mixed gneiss with cavity under uniaxial compression. Ind. Constr. 2014, 44, 108–111+171. [Google Scholar]
- Li, X.B.; Weng, L.; Xie, X.F.; Wu, Q.H. Experimental study on damage evolution of hard rock with pores under dynamic and static loads by nuclear magnetic resonance. Chin. J. Rock Mech. Eng. 2015, 34, 1985–1993. [Google Scholar]
- Wei, J.L.; Liu, S.J.; Wu, L.X.; Huang, J.W.; Zhang, Y.B.; Tian, B.Z. Comparative analysis of acoustic emission multi-parameter characteristics during biaxial loading of porous rock. J. Min. Saf. Eng. 2015, 32, 1017–1025. [Google Scholar]
- Du, M.R.; Jing, H.W.; Su, H.J.; Zhu, T.T. Experimental study on strength and failure characteristics of sandstone with prefabricated oval caverns. J. China Univ. Min. Technol. 2016, 45, 1164–1171. [Google Scholar]
- Du, M.R.; Jing, H.W.; Su, H.J.; Zhu, T.T. Influence of elliptical cavity on strength and deformation characteristics of sandstone samples. J. Min. Saf. Eng. 2017, 34, 141–147. [Google Scholar]
- Zhong, Z.B.; Deng, R.G.; Xiao, W.M.; Lin, F.; Fu, X.M. Experimental study on biaxial compression of hard rhyolite in arched cavity with straight wall. J. China Railw. Soc. 2016, 38, 110–118. [Google Scholar]
- Cheng, X.H. Support pressure and stability of arch tunnel with deep buried straight wall in viscous stratum. Chin. J. Geotech. Eng. 2017, 39, 2034–2042. [Google Scholar]
- Gong, F.Q.; Luo, Y.; Liu, D.Q. Simulation test of slab crack failure in deep arched tunnel with straight wall. Chin. J. Geotech. Eng. 2019, 41, 1091–1100. [Google Scholar]
- Zhang, X.J.; Wang, D.; Xiao, C.; Zheng, H.C. Rock burst test and splitting and shear analysis of arch tunnel with Straight wall. Rock Soil Mech. 2013, 34, 35–40. [Google Scholar]
- Zhou, L.; Zhu, Z.M.; Liu, B. Study on the influence of radial cracks at different locations around tunnel on the stability of tunnel surrounding rock. Chin. J. Geotech. Eng. 2016, 38, 1230–1237. [Google Scholar]
- Abir; Xiang, Y.Z.; Zheng, Y.R.; Chai, S.B.; Yuan, H.C.; Liu, L. Failure mode of surrounding rock of tunnel under overload and unloading. Adv. Eng. Sci. 2021, 53, 53–61. [Google Scholar]
- Liu, X.; Zhang, X.J.; Wei, J.Z.; He, J.L.; Wang, J.T. Experimental study on stress relaxation characteristics of arch tunnel with straight wall under cyclic loading and unloading. Rock Soil Mech. 2023, 44, 476–484. [Google Scholar]
- Qin, Y.T. Study on Stability of Arch tunnel with Deep Buried Straight Wall. J. Shijiazhuang Inst. Railw. Technol. 2021, 20, 47–51. [Google Scholar]
- Li, A.Q.; Zhang, R.; Ai, T.; Gao, M.Z.; Zhang, Z.T.; Liu, Q.Y.; Xie, J.; Jia, Z.Q. Study on the spatiotemporal evolution of acoustic emission and its failure precursors during uniaxial compression of granite. Chin. J. Geotech. Eng. 2016, 38, 306–311. [Google Scholar]
- Zhang, Y.B.; Yu, G.Y.; Tian, B.Z.; Liu, X.X.; Liang, P. Multi-component precursory information identification of acoustic emission main frequency in granite fracture process. J. Min. Saf. Eng. 2017, 34, 355–362. [Google Scholar]
- Wang, C.Y.; Chang, X.K.; Liu, Y.L. Time-frequency domain signal characteristics and precursor recognition information of acoustic emission in the whole process of granite fracture. J. Chang. River Sci. Res. Inst. 2020, 37, 82–89. [Google Scholar]
- Zhang, L.M.; Ren, M.Y.; Ma, S.Q.; Wang, Z.Q.; Wang, J.L. Acoustic emission and fractal characteristics of marble during the whole process of confining pressure failure. Chin. J. Rock Mech. Eng. 2015, 34, 2862–2867. [Google Scholar]
- Zhang, H.N.; Wang, Y.; Wang, R.H. Study on Acoustic emission Characteristics of rock burst section in deep tunnel. Sichuan Archit. 2019, 39, 164–166. [Google Scholar]
- Zhang, L.M.; Ma, S.Q.; Ren, M.Y.; Jiang, S.Q.; Wang, Z.Q.; Wang, J.L. Acoustic emission frequency and B-value characteristics of rock failure process under different confining pressures. Chin. J. Rock Mech. Eng. 2015, 34, 2057–2063. [Google Scholar]
Figure 1.
Single-tunnel model of arched weathered sandstone with wall. (a) Model photograph. (b) Model diagram.
Figure 1.
Single-tunnel model of arched weathered sandstone with wall. (a) Model photograph. (b) Model diagram.

Figure 2.
Test loading and monitoring system.

Figure 3.
Test loading system. (a) Force mode of chamber; (b) rock triaxial testing machine.

Figure 4.
Biaxial loading test stress path.

Figure 5.
Particle contact model.

Figure 6.
Schematic diagram of parallel bonding model.

Figure 7.
Model and size of PFC test.

Figure 8.
Single tunnel rock load–deformation curve.

Figure 9.
Single tunnel damage picture. (a) Damage condition photograph; (b) photos of cracking failure of tunnel wall panel.
Figure 9.
Single tunnel damage picture. (a) Damage condition photograph; (b) photos of cracking failure of tunnel wall panel.

Figure 10.
Ringing count–deformation curve.

Figure 11.
Amplitude–deformation curve.

Figure 12.
Ae b value–deformation curve.

Figure 13.
Microfracture evolution process. (a) 14.53 MPa, (b) 18.29 MPa, (c) 20.25 MPa, (d) 22.82 MPa, (e) 23.75 MPa, (f) 24.85 MPa.
Figure 13.
Microfracture evolution process. (a) 14.53 MPa, (b) 18.29 MPa, (c) 20.25 MPa, (d) 22.82 MPa, (e) 23.75 MPa, (f) 24.85 MPa.

Figure 14.
Number of cracks–load curve.

Figure 15.
The variation curve of the number of microscopic cracks in the chamber model with different height–span ratio.
Figure 15.
The variation curve of the number of microscopic cracks in the chamber model with different height–span ratio.

Figure 16.
The ultimate bearing capacity of chamber models with different height–span ratio.

Figure 17.
Development process of force chain of chamber models with different height–span ratio. (a) Before 70% of peak load, 17.04 MPa, (b) Before 80% of peak load, 19.47 MPa, (c) Before 90% of peak load, 21.91 MPa, (d) Before 70% of peak load, 17.40 MPa, (e) Before 80% of peak load, 19.88 MPa, (f) Before 90% of peak load, 22.37 MPa. (g) Before 70% of peak load, 15.33 MPa, (h) Before 80% of peak load, 17.53 MPa, (i) Before 90% of peak load, 19.72 MPa, (j) Before 70% of peak load, 14.92 MPa, (k) Before 80% of peak load, 17.06 MPa, (l) Before 90% of peak load, 19.19 MPa.


Table 1.
Mesoscopic parameter.
| Emod (GPa) | Poro | Dense (kg·m−3) | Krat | Tenpbond (MPa) | Copbond (MPa) | Fapbond (°) |
|---|---|---|---|---|---|---|
| 35 | 0.16 | 2119 | 2.0 | 6 | 7.5 | 30 |
Table 2.
Dimensions of chamber models with different height to span ratios.
| Chamber Shape | Straight Arch | |||
|---|---|---|---|---|
| Depth–span ratio | 0.8 | 1.0 | 1.5 | 1.8 |
| Chamber span (cm) | 8 | 8 | 8 | 8 |
| Chamber height (cm) | 6.4 | 8 | 12 | 14.4 |
| Chamber shape |  |  |  |  |
Disclaimer/Publisher’s Note: The statements, opinions and data contained in all publications are solely those of the individual author(s) and contributor(s) and not of MDPI and/or the editor(s). MDPI and/or the editor(s) disclaim responsibility for any injury to people or property resulting from any ideas, methods, instructions or products referred to in the content. |
© 2024 by the authors. Licensee MDPI, Basel, Switzerland. This article is an open access article distributed under the terms and conditions of the Creative Commons Attribution (CC BY) license (https://creativecommons.org/licenses/by/4.0/).
Share and Cite
MDPI and ACS Style
Gao, J.; Wang, X.; Cong, Y.; Li, Q.; Pan, Y.; Ding, X. Critical Failure Characteristics of a Straight-Walled Arched Tunnel Constructed in Sandstone under Biaxial Loading. Processes 2024, 12, 841. https://doi.org/10.3390/pr12040841
AMA Style
Gao J, Wang X, Cong Y, Li Q, Pan Y, Ding X. Critical Failure Characteristics of a Straight-Walled Arched Tunnel Constructed in Sandstone under Biaxial Loading. Processes. 2024; 12(4):841. https://doi.org/10.3390/pr12040841
Chicago/Turabian StyleGao, Jian, Xiaoshan Wang, Yu Cong, Qiqi Li, Yequan Pan, and Xianglin Ding. 2024. "Critical Failure Characteristics of a Straight-Walled Arched Tunnel Constructed in Sandstone under Biaxial Loading" Processes 12, no. 4: 841. https://doi.org/10.3390/pr12040841
Note that from the first issue of 2016, this journal uses article numbers instead of page numbers. See further details here.