
Combining Solution-Blowing and Melt-Blowing Techniques to Produce an Efficient Non-Woven Filter


Faculty of Chemical and Process Engineering, Warsaw University of Technology, 00-645 Warsaw, Poland
*
Authors to whom correspondence should be addressed.
Processes 2024, 12(5), 857; https://doi.org/10.3390/pr12050857
Submission received: 15 March 2024
/
Revised: 19 April 2024
/
Accepted: 22 April 2024
/
Published: 24 April 2024
(This article belongs to the Special Issue 10th Anniversary of Processes: Design of the Chemical Industry of the Future)
Abstract
:New substances and particles appearing in the environment following technological development pose new challenges for separation methods. Moreover, the growing amount of waste also forces us to look for environmentally friendly solutions. One way to create filtration structures with the desired properties is to combine known techniques, thanks to which the advantages of one technique complement the deficiencies and disadvantages of another. Combining the melt-blowing and solution-blowing processes seems to be promising. Fibres created from melt-blowing will provide mechanical strength, while solution-blowing will allow the introduction of nanofibres into the structure with unique filtration and functional properties. Both methods enable working with biodegradable polymers, so the resulting filter can also be environmentally friendly after operation. Our research aimed to check whether combining two fibre production techniques (melt-blown and solution-blowing) is possible and how the joining method will affect the final product. We created a multilayer structure by placing a layer of solution-blowing nanofibres between melt-blown layers, and a mixed structure by simultaneous melt-blowing and solution-blowing. The created multilayer structure was characterised by high filtration efficiency and high-pressure drop. In contrast, the mixed structure achieved a high-quality factor and high mass of deposited droplets per 1 J of energy used for work.
1. Introduction
The increase in the level of air pollution with solid and biological particles of various origins is one of the leading environmental problems affecting humanity. The smaller the particles, the deeper they penetrate the respiratory tract [1], and the efficiency of their capture by filtration systems decreases. Although highly efficient filtration systems such as HEPA or ULPA are available on the market, their operating costs (high energy consumption) and short lifespan have an impact on the environment. Therefore, it is essential to look for new filtration systems that would ensure high filtration efficiency, low-pressure drops, and long operation time; and would be biodegradable and could easily be given additional properties, e.g., bacteriostatic ones, using natural compounds. A practical method of creating new filter materials is combining known fibre production techniques to complement the disadvantages of one method with the advantages of another.
Multilayer structures involve incorporating different filtration media in distinct layers. Each layer can be designed to target specific particle sizes or types of contaminants. The multilayer approach allows for a gradual filtration process, with each layer contributing to the overall efficiency. This can result in improved particle capture and increased filtration capacity. Different layers can be composed of various materials, offering versatility in designing filters with tailored properties. This allows for customisation based on the specific needs of the application. Synergistic effects between layers can be harnessed, creating a filtration system that performs better than the sum of its components. A multilayer structure can be created by superimposing layers from different techniques [2,3,4], or by creating layers using the same method but using different polymers [5,6,7] or process parameters [8]. Toptas et al. [9] show how filtration efficiency and pressure drop change depending on the number and arrangement of fibre layers produced by melt-blowing (MB), solution-blowing (SB) and electrospining methods. A high initial filtration efficiency was achieved, but there was also a high pressure drop (above 140 Pa). The multilayers method of producing filter material is time-consuming and does not ensure a uniform distribution of nanofibres with different properties throughout the entire volume of the filter structure. The presence of nanofibres in the filter increases the filtration efficiency of fine particles, not only due to the increased surface area [10,11], but also due to the tortuosity effect. Nanofibres create a tortuous path for particles, forcing them to navigate through intricate channels. This tortuosity effect enhances the chances of particles colliding with and adhering to the fibres, improving the filter’s efficiency in trapping contaminants [12]. Nanofibres can enhance filtration efficiency without significantly increasing pressure drops [13], but only if they are evenly distributed throughout the filter.
Uniform nanofibre distribution can be ensured by the simultaneous deposition onto the collector fibres produced using the same method but from different polymers or using various techniques. However, this approach is rare. This is due to the difficulty in combining process parameters appropriate for each process. Buivydiene [14] combined melt and solution electrospinning to obtain a filter structure with high filtration efficiency (93.7%—PN1) and low-pressure drop (up to 50.17 Pa). However, the measurements were performed at an airflow speed of 5 cm/s. The disadvantage of electrospinning is the use of high voltage and the low efficiency of fibre production. In the work mentioned above, the polymer dosing rate was 0.2 mL/h. A safer (because the high voltage is not used) and more efficient (based on higher polymer flow rates) method is solution-blowing. However, SB does not allow obtaining of fibres with diameters as small as those produced by electrospinning.
In this context, combining solution-blowing and melt-blown techniques in manufacturing opens the possibility of creating non-woven efficient filters with unique properties. The melt-blowing process involves the extrusion of molten polymer through fine nozzles to form microfibres that intertwine randomly, creating a non-woven fabric [15,16,17]. This technique is renowned for producing materials with a high surface area, making it an ideal candidate for filtration applications. Solution-blowing complements the melt-blowing method by utilising a different approach. In this technique, a polymer is dissolved in a solvent to form a solution and then spun into fibres using compressed air [18,19,20]. The result is a controlled and uniform fibre structure, allowing for precise customisation of filtration characteristics. Combining solution-blowing and melt-blowing processes can harness the strengths of both techniques. The melt-blown layer establishes a robust base with its high surface area, while the solution-blowing process adds ultrafine fibres (submicron size) with controlled diameters, contributing to enhanced filtration efficiency. This synergistic approach addresses the limitations of individual methods, resulting in a material that outperforms filters produced using a single technique.
Some notable limitations of solution-blowing include scale-up challenges. Solution-blowing is a complex process. The need for precise control over parameters, such as solution concentration and viscosity, polymer flow, airflow, nozzle diameter, humidity, and temperature, adds complexity to the production process and causes scale-up challenges [21,22]. The polymer flow rate is usually approximately 0.5 mL/min per nozzle. Therefore, when scaling up, multi-nozzle systems are necessary. The multi-nozzle configuration introduces challenges related to delivering the appropriate air stream to each nozzle outlet, the proper polymer flow rate, and the efficient collection of the produced fibres.
On the other hand, solution-blowing allows the introduction into the system of not only the nanometric fibres that enhance filtration efficiency but also fibres manufactured from materials or admixed with compounds that have lost their properties at high temperatures, making them unsuitable for use in melt-blowing [23,24,25,26]. Such additives will give the fibre additional properties, e.g., bacteriostatic ones. Both techniques can also use biodegradable polymers, which makes the produced material environmentally friendly; this should be particularly taken into account nowadays.
Therefore, this research attempted to produce a filter material by combining melt-blowing and solution-blowing. Mixing fibres produced by both techniques can provide the filtration structure with excellent properties (high efficiency, low-pressure drop, and long operating time). The produced structure can be biodegradable. Additionally, solution-blowing allows the introduction of fibres modified with, e.g., zinc oxide particles or propolis into the filter material, which can provide unique features to the produced filters.
2. Materials and Methods
2.1. Solution-Blowing Fibres Production
For polymer solution-blowing, a 10% (w/w) polylactide (PLA) (Ingeo™ 6202D, NatureWorks® LLC, Minneapolis, MN, USA) (relative viscosity 3.1; specific gravity 1.24; melt index, g/10 min (210 °C) 15–30 and melt density (230 °C) 1.08) solution in a 3:1 mixture of chloroform/acetone (Sigma-Aldrich, Poznań, Poland) was used. PLA was dissolved at room temperature for 24 h on a magnetic stirrer in a tightly closed container.
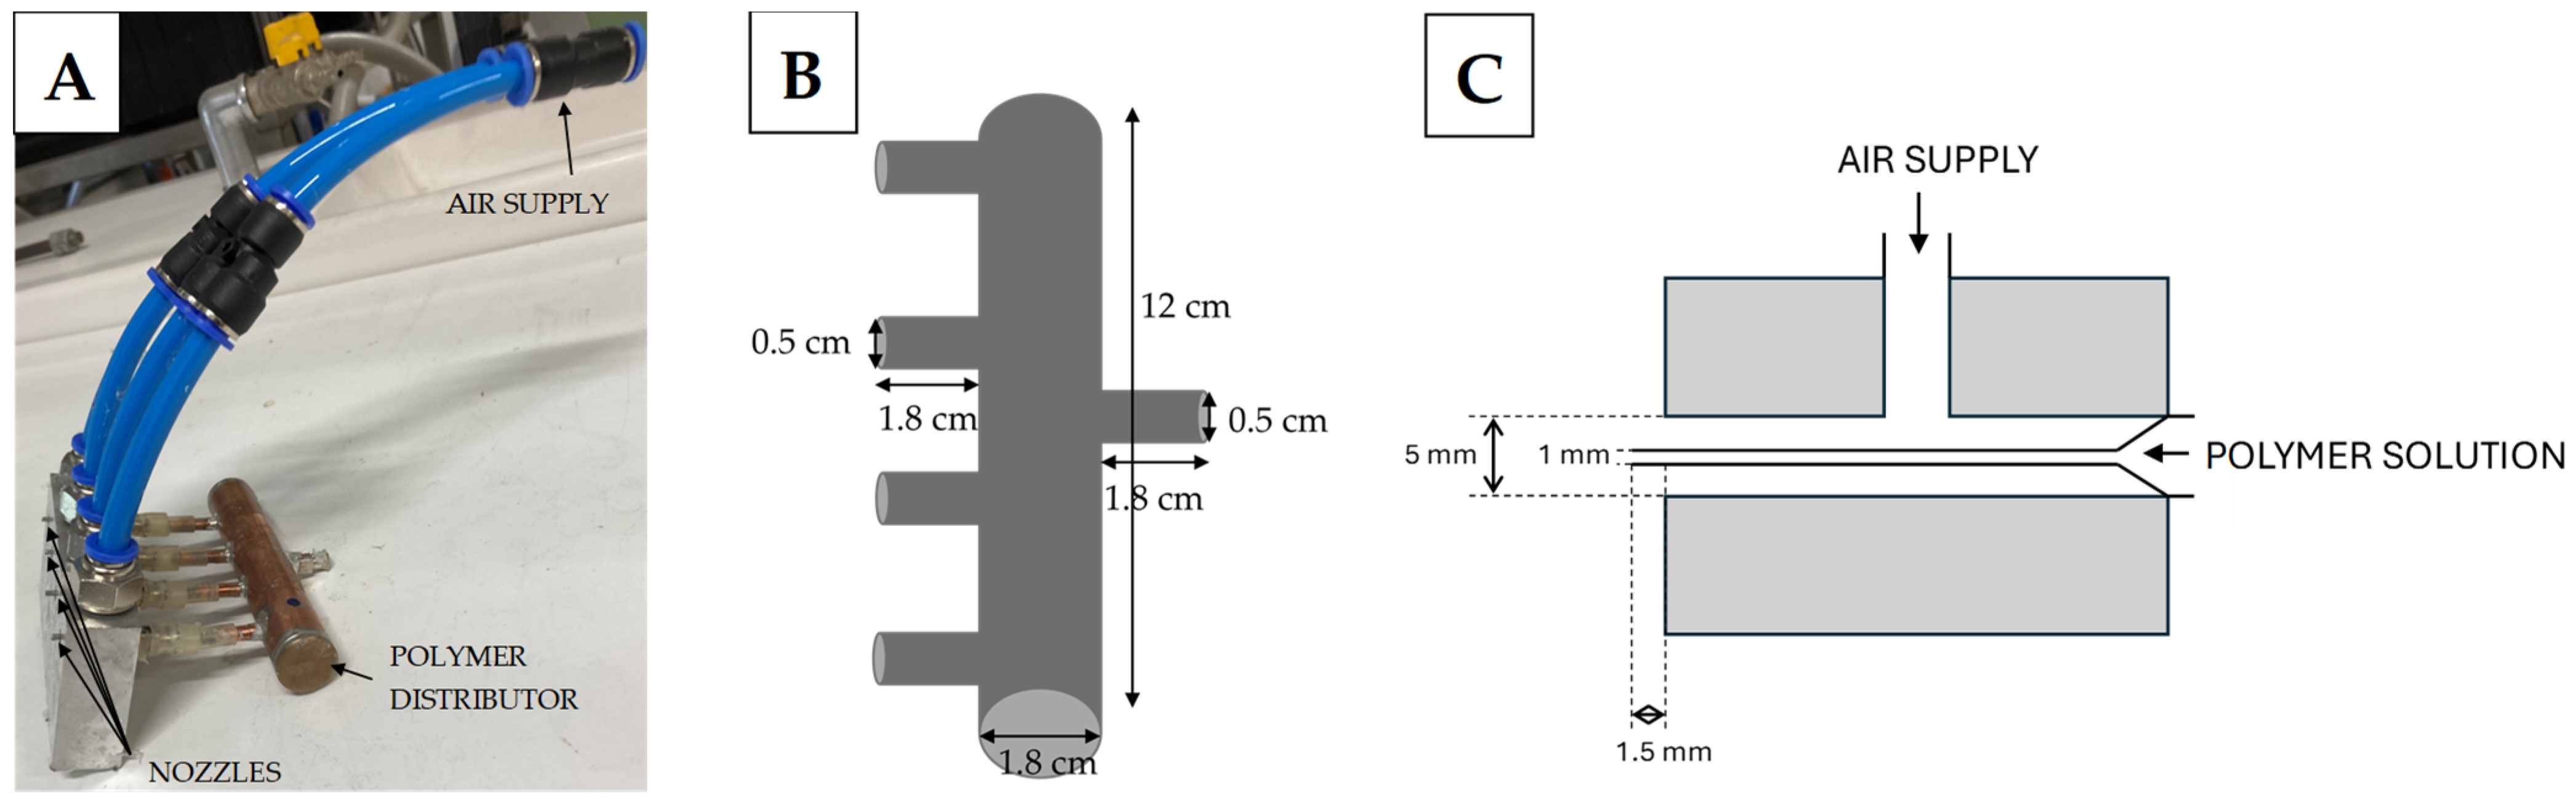
Solution-blowing was carried out using a system consisting of the following elements: a syringe pump (Legato270, KDScientific, Holliston, MA, USA) equipped with a 50 mL syringe, a compressed air supply system, a polymer distributor, and 4 coaxial nozzles with an internal diameter of 1 mm and an external diameter of 5 mm (the nozzles are homemade devices) (Figure 1). The polymer distributor allowed the supply of the same polymer stream to each nozzle. It was made of a copper cylinder with dimensions of 12 cm × 1.8 cm, which was equipped with one inlet hole (connected to the syringe) and four outlet holes (related to 4 nozzles). The polymer distributor was placed horizontally.
The air stream supplied to the system was 320 L/min, which allowed for an air stream of 80 L/min at the outlet from each nozzle. A flow meter (model 4001, TSI, Shoreview, MN, USA) measured the air flow rate. The polymer stream dispensed by the syringe to the polymer dispenser was 2 mL/min, making it possible to obtain a 0.5 mL/min polymer stream at the outlet from each of the 4 nozzles.
Fibres in the solution-blowing process are created as a result of stretching the polymer stream coming out of the nozzle. The air fed to the nozzle, after expansion into the atmosphere at the nozzle outlet, transforms the polymer drop into a cone and then into the stream. The high shear stresses the airflow generates cause the polymer stream to be pulled out. The solvent evaporates from the polymer stream on its way to the collector. The fibre is deposited on the collector. In the solution-blowing process, the morphology of the fibres depends on many factors, including the type of polymer and its concentration, the nozzle geometry, the polymer flow rate, and the airflow rate at the nozzle outlet. Due to numerous process parameters, it is possible to use solution-blowing to produce fibres from various polymers and with different morphologies and properties.
2.2. Melt-Blowing Fibre Production
The tested non-wovens were produced using the polymer melt-blowing method (in detail described in our previous work [27]) in combination with the solution-blowing technique. Figure 2 shows the scheme of the MB equipment used during the non-woven manufacturing process.
The MB non-wovens were prepared from polypropylene (PP) (HL712FB, Borealis AG, Vienna, Austria) which is a homopolymer resin with a high melt flow index (MFI), high purity, and very narrow molecular weight distribution. Typical properties of this polymer are: MFI (230 °C/2.16 kg)—1200 g/10 min and density (23 °C) 0.90 g/cm3.
The process of MB filter manufacturing begins with the transfer of granulated polymer from a container to an extruder through a screw feeder, which also serves as a stirrer. Within the extruder, the polymer undergoes melting. The flow rate of the polymer is determined by the rate of the screw rotation, which is controlled via an inverter through an electronic motor with the gear system. Subsequently, the molten polymer is conveyed to the nozzle, where a hot (260 °C) pressurised air stream fiberises it. The polymer takes the form of microfibres, which are collected on a high-speed rotating receiving shaft, which additionally moves backwards and forwards (sliding speed 90 mm/s). The distance between the collector and the nozzle was 35 cm. The nozzle through which the melted polymer is extruded has 77 channels arranged in a row. Each channel has a diameter of 0.5 mm, and the distance between channels is also 0.5 mm. The stream of hot air surrounding the polymer is coming out through a rectangular cross-section channel with dimensions of 2 mm × 85 mm.
The thickness of the obtained filters depends on the time of the fibres’ deposition onto the collector. The rotational speed of the drum has an impact on fibre arrangement in the non-woven fabric structure. Higher rotation speeds lead to a less random spatial organisation of the fibres, aligning them according to the direction of shaft rotation and increasing the material’s porosity. The distance between the nozzle and the collecting shaft also affects the fibrous material’s porosity.
The fibres’ thickness can be varied by selecting appropriate process parameters, e.g., the temperatures of the melted polymer (which influence the rheology of the melted polymer) and the air supplied to the nozzle [28,29,30]. Higher temperatures cause an increase in the MFI, and consequently, achieving polymer fiberisation becomes more accessible, and smaller-diameter fibres can be obtained. It is crucial to note that each polymer has an upper limit of stability for polymer chains, beyond which the material degrades.
2.3. Combining Solution-Blowing and Melt-Blowing Techniques
The research compared two methods of combining solution-blowing and melt-blowing. The first method simultaneously applied solution-blowing and melt-blowing fibres to the collector (mixed structure). The deposition time was 15 min. The filtration structure obtained this way should be characterised by an even distribution of fibres created from solution-blowing throughout its entire thickness. In the second variant (multilayer structure), a layer of melt-blown fibres was applied to the collector (deposition time 7.5 min), then a layer of solution-blown fibres was applied (deposition time 15 min), and then a layer of melt-blown fibres was applied again (deposition time 7.5 min). For comparison, filtration structures consisting only of melt-blown fibres (PP fibres) (deposition time 15 min) and only solution-blowing fibres (PLA fibres) (deposition time 15 min) were also produced. The blowing time of a pure PP fibre layer was twice as long as that of single layers of PP fibres in a multilayer structure. The blowing time of the pure PLA fibre layer was the same as in the case of the PLA fibre layer in the multilayer structure.
The collector was 90 cm long and 10 cm in diameter. It was covered with the base material (made of polypropylene, 50 g/m2, GF AGRO, GardenFlora, Bydgoszcz, Poland) (90 cm × 31.4 cm) and rotated at a speed of 300 rpm. The distance of the solution-blowing nozzles from the collector was 37 cm. The solution-blowing and melt-blowing nozzles setting method is shown in Figure 3. Each time, the same volume of polymers (PLA and PP) was used to create the filtration structure.
2.4. Fibres’ Characterisation
The average fibre diameter was determined using scanning electron microscope photos (TM-1000, Hitachi, Tokyo, Japan). Before taking an SEM photo, the fibres were sputtered in an argon atmosphere for 2 min with a layer of gold (K550X EMITECH Quorum, East Sussex, UK). The average fibre diameter was obtained by analysing 100 fibres from different areas of the filtration structure. The presence of PLA fibres in a mixed filtration structure was determined using Fourier Transform Infrared (FTIR) spectroscopy with the Attenuated Total Reflectance (ATR) mode. The Nicolet iS10 spectrometer (Thermo Fisher Scientific, Walsham, MA, USA), which recorded spectra ranging from 5000 to 600 cm–1 (4 cm−1 resolution) in the wavenumber range, was used. For one FTIR characterisation, 32 scans were performed.
2.5. Filtration Efficiency
The modular MFP 1000 HEPA test bench (PALAS GmbH, Karlsruhe, Germany) was used to perform a DEHS (di-ethyl-hexyl-sebacat) (Sigma-Aldrich, Poznań, Poland) oil mist filtration experiment in a range of droplet diameters from 0.2 μm to 2 μm. The scheme of the test bench is presented in Figure 4. The aerosol generator used to produce submicrometric and micrometric droplets was a PLG1000 (PALAS GmbH, Karlsruhe, Germany). The aerosols were fed directly to the filtration chamber and then through the dilution column to the optical particle counter (light-scattering spectrometer system—WELAS digital 1000 [PALAS GmbH, Karlsruhe, Germany]).
The measurement conditions have been selected to meet the test standards for respiratory protective devices—filtering half masks for protection against particles [31]. The working area of the filtrating material was 0.01 m2. During the separation measurements, the air face velocity was equal to 0.158 m/s (corresponding to an airflow rate of 95 L/min). The average concentration of DEHS droplets was 206,741 particle/cm3 and 20.4 mg/m3 for numerical and mass concentration, respectively. The diagrams of size distributions of the generated DEHS oil droplets used in the experiments are presented in Figure 5.
The aerosol filtration efficiency η is calculated as follows [32]:
where Cin and Cout are aerosol droplet concentrations before (upstream) and after (downstream) the filter material. The airflow resistance across the non-woven material (∆P) was also determined during the tests.
The MFP 1000 HEPA setup has only one sample suction probe. Therefore, it was necessary to perform measurements in the sequence, conducting measurements without a filter (upstream) and with a filter (downstream) in the tested chamber. Each series comprised three alternating upstream and downstream measurements. Moreover, to evaluate the influence of material structure and to eliminate the effects of electrostatic interactions on filtration efficiency, the non-wovens were conditioned for 24 h in isopropanol (IPA) (Sigma-Aldrich, Poznań, Poland) vapours to eliminate electrical charges from the fibres’ surface. Subsequently, the filters were allowed to air-dry at room temperature for 1 h. The filtration efficiency tests were conducted only after treatment filters with IPA vapours.
3. Results and Discussion
3.1. Fibres’ Characterisation
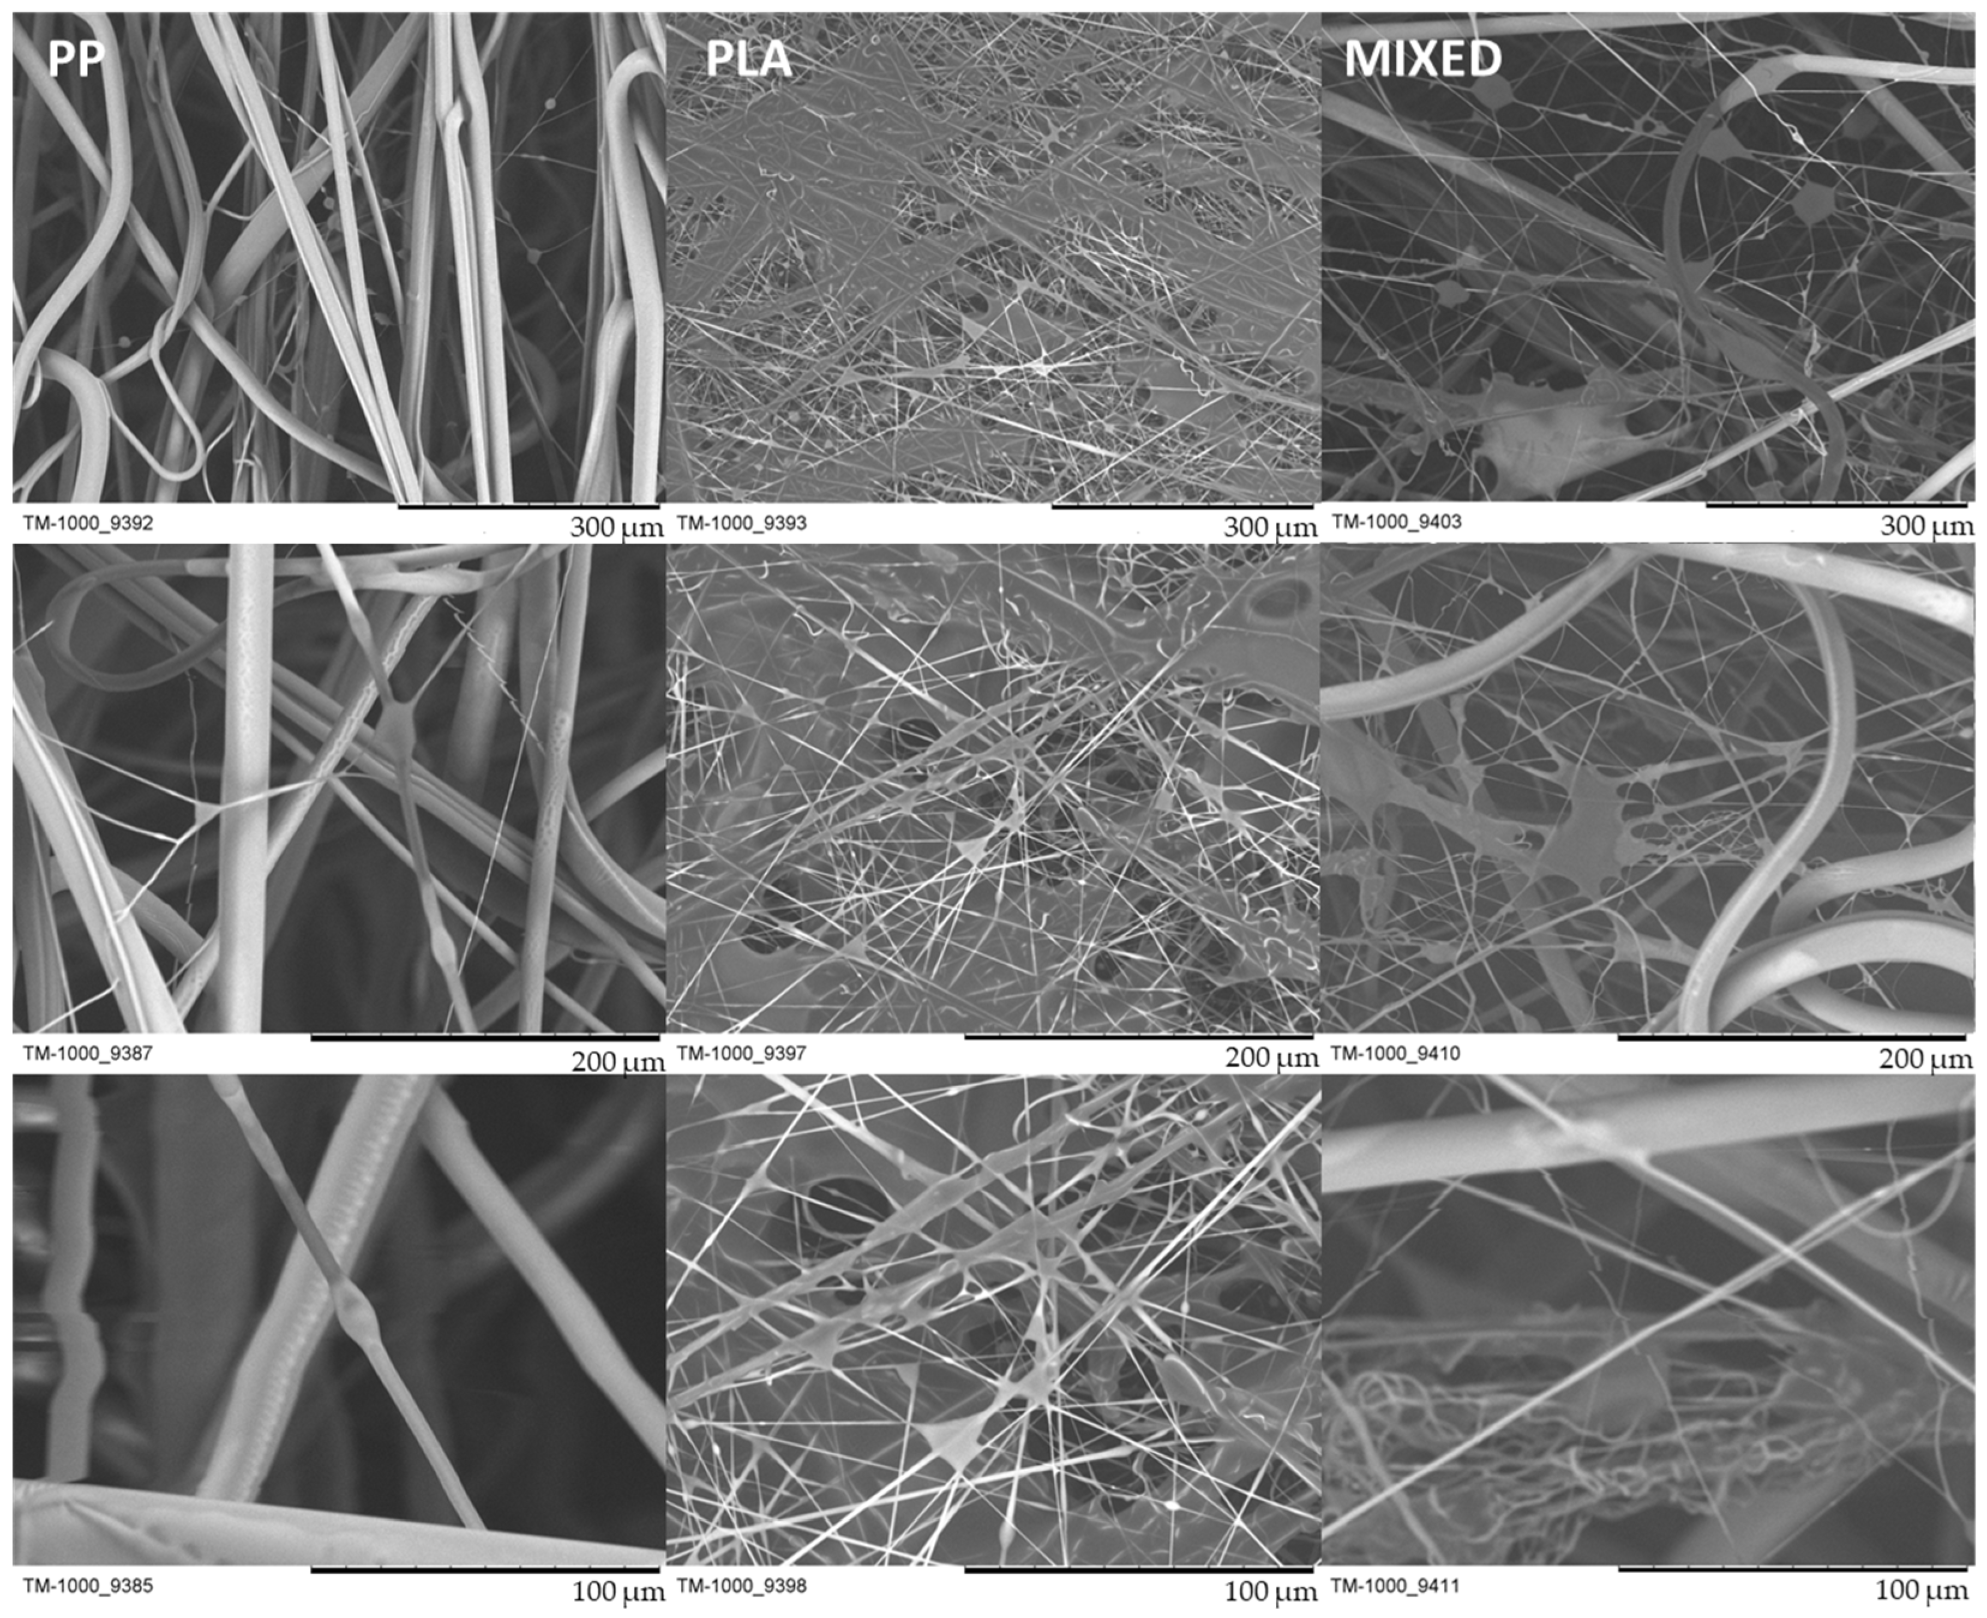
SEM photos of PP fibres made using the melt-blowing process and PLA fibres made using the solution-blowing process are shown in Figure 6A and Figure 6B, respectively. As expected, the fibres created in melt-blowing have a large diameter, smooth edges, and are less tangled. However, the fibres made of PLA using the solution-blowing process have a small diameter and a high degree of entanglement. The PLA and PP fibre mean diameters are 0.79 μm and 11.61 μm, respectively. The distribution of fibre diameters obtained from melt-blowing (PP fibres) and solution-blowing (PLA fibres) are shown in Figure 7. Figure 6C shows a mixed structure in which nanometric PLA fibres entwine PP fibres and fill the pores between PP fibres. Figure 6D shows the edge of the PLA fibre layer (in a multilayer structure), under which a much thicker PP fibre layer is visible.
FTIR-ATR was used to determine the presence of PLA fibres in the mixed structure. The results are shown in Figure 8. The PLA and PP fibres spectrum is typical for the PLA and PP fibres from the solution-blowing and melt-blowing spectrum described in the literature [26,33].
The mixed structure spectrum (black line) shows a peak at a wavelength range between 1780 cm−1 and 1760 cm−1 and approximately 1100 cm−1; both of which are characteristic of ester bonds present in polyesters. Similar peaks are also observed in the spectrum of pure PLA fibres (light grey line). However, they are not present in the spectrum of PP fibres (dark grey line).
On the other hand, in the mixed structure spectrum, peaks in the wavelength range between 2800 cm−1 and 3000 cm−1, which come from C–H stretching vibrations, can be observed. They are also visible in the spectrum of pure PP fibres but not in the pure PLA fibres spectrum.
The occurrence of the same peaks in the FTIR-ATR spectrum of the mixed structure as in the spectra of pure PP and PLA confirms the presence of fibres in this structure originating from both the melt-blowing and solution-blowing processes. There is also an evident disproportion in the size of the peaks characteristic for PP and PLA, which confirms the smaller ratio of PLA fibres in the mixed structure, which was also clearly visible in Figure 6C.
3.2. Filtration Efficiency
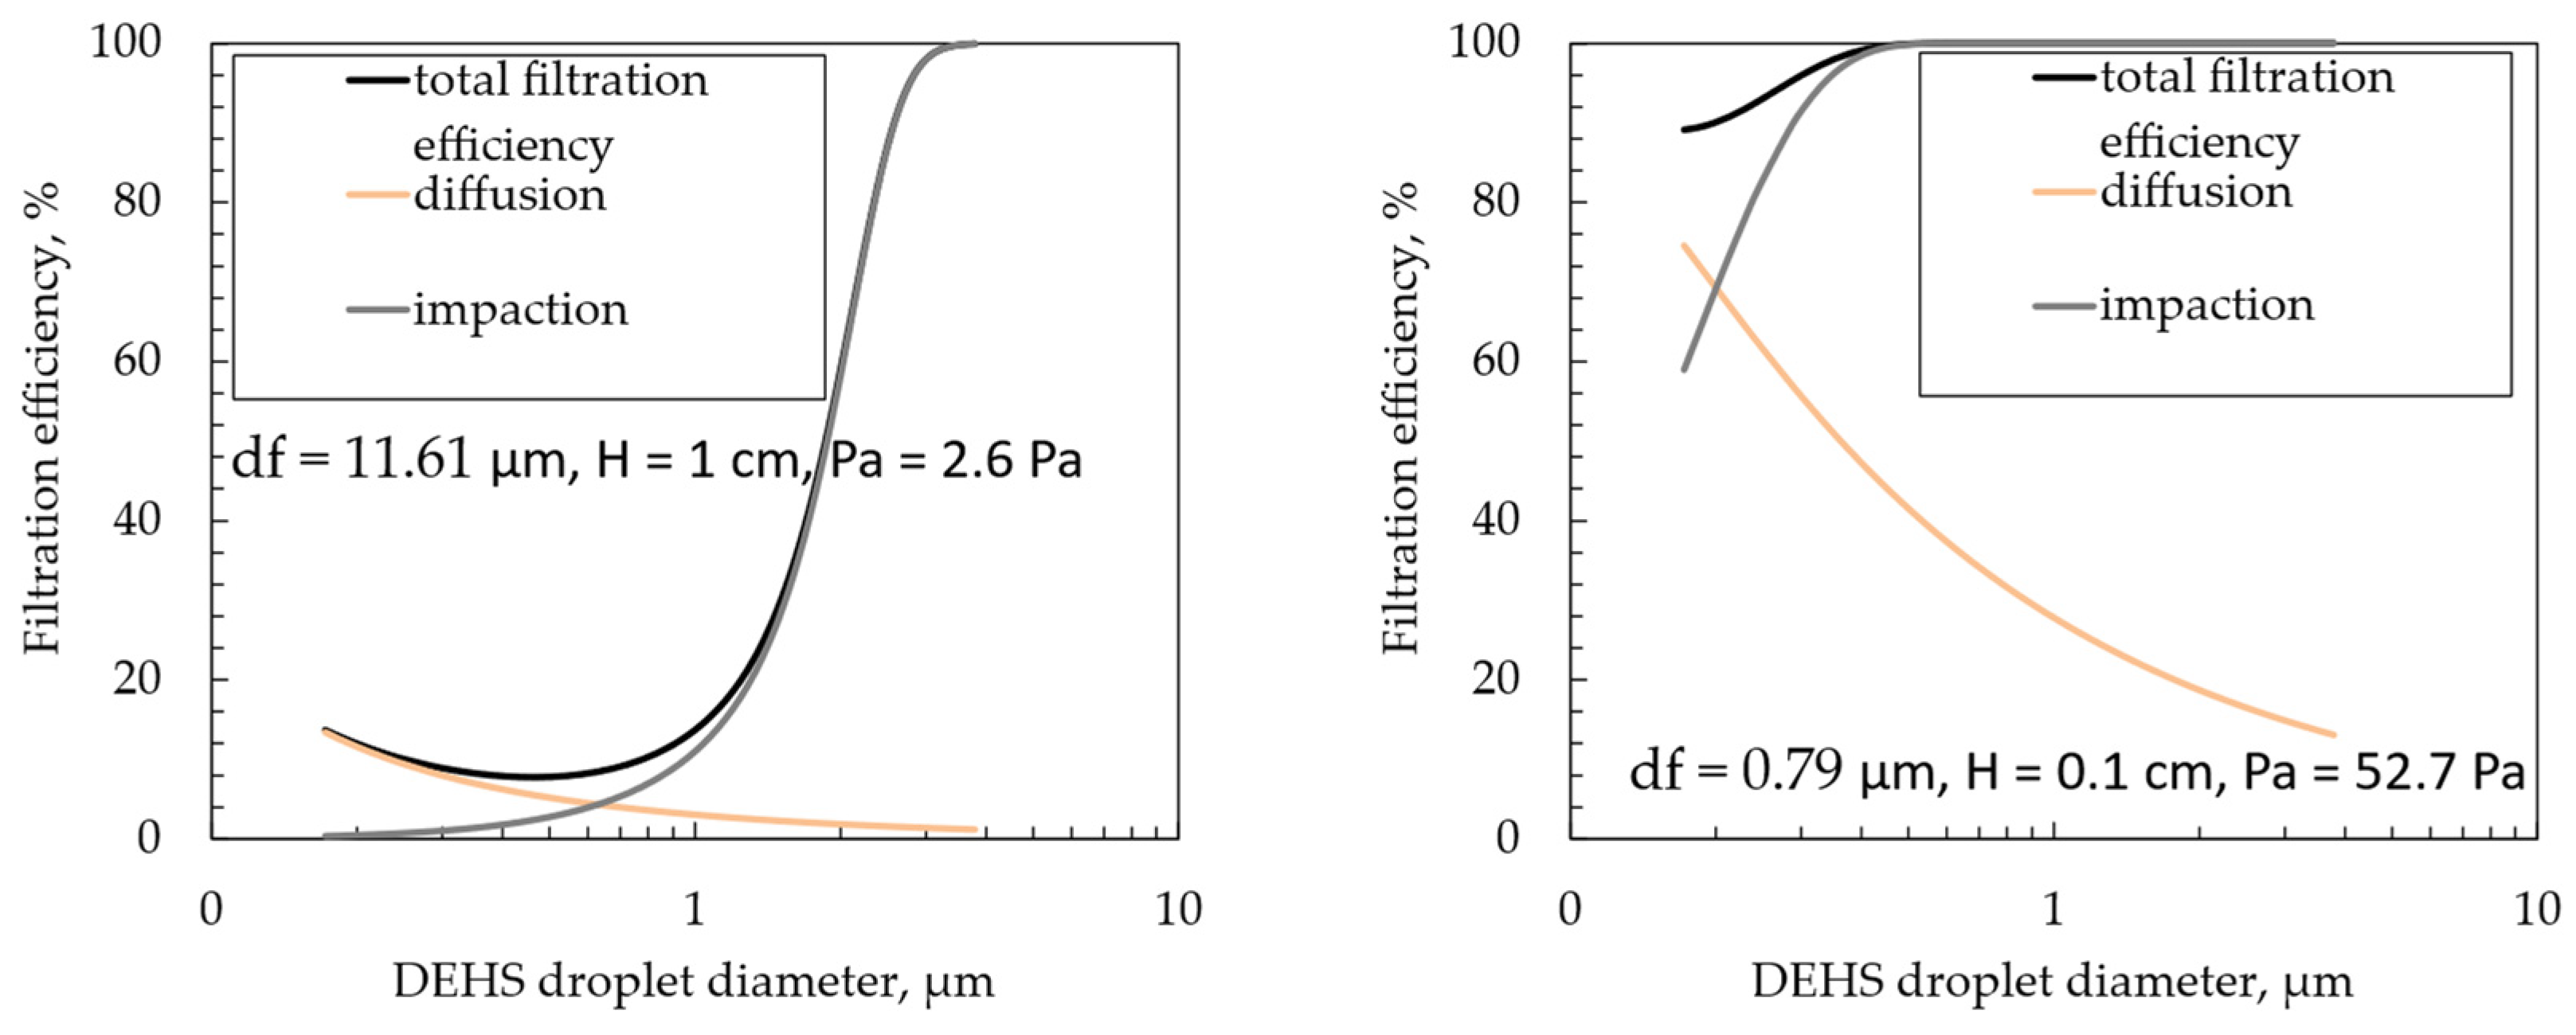
The initial filtration efficiency and pressure drop determined for the four analysed structures are presented in Table 1. The structure made of PP in the melt-blowing process has the lowest filtration efficiency (7.30%) and the lowest pressure drop (22.35 Pa). The filtration structure made only of PLA fibres produced from solution-blowing is characterised by over four times higher efficiency (30.72%) than the filtration structure consisting only of PP fibres; but, at the same time, it is also over twice the pressure drop (51.42 Pa). Such results are consistent with the classical theory of depth filtration. A filtration structure consisting of fibres with an average diameter of 11.61 μm and a thickness of 1 cm will be characterised by low filtration efficiency and low-pressure drops (Figure 9 left graph). A filtration structure dominated by fibres with a diameter of 0.79 μm and thickness not exceeding 0.1 cm will achieve significantly higher filtration efficiency and pressure drops (Figure 9 right graph). Figure 9 shows the theoretically determined filtration efficiency for two filter structures with fibre diameter and thickness of 11.61 μm, 1 cm and 0.79 μm, 0.1 cm, respectively, assuming that their porosity is the same.
The filtration efficiency (E) of filter layer is described by correlation:
where α is a porosity, H is a filter layer thickness, df is a fibre diameter, and n is a total single fibre efficiency. The total single fibre efficiency may be calculated assuming that the diffusion and impaction are independent mechanisms of particle deposition on the fibres.
The pressure drop across a filter (ΔP) was calculated using the equation:
where U denotes gas face velocity, μ is a gas viscosity, KnF is a Knudsen number for fibre, and Ku is a Kuwabara number.
A detailed description of the calculation and used correlations can be found in previous work [34].
Incorporating a high-efficiency filtration layer into the filtration structure should increase filtration efficiency. In the conducted tests, the highest filtration efficiency (46.55%) was obtained for a multilayer structure in which a layer of thin PLA fibres was between the PP fibres’ layers. Due to the high filtration efficiency, a high-pressure drop was also achieved (89.06 Pa). A high-pressure drop significantly affects a vital parameter describing filter materials, which is the filter quality factor (Qf). The Qf determined from the correlation (4) for the four tested filtration structures is presented in Table 2.
The quality factor combines filtration efficiency and pressure drop. High-efficiency filters such as HEPA or ULPA usually have low-quality factor values due to high-pressure drops. Filters that have to work for a long time and not generate high costs should have a high Qf value. In the tests, the highest Qf value was obtained for the mixed structure. The number of nanometric fibres formed from PLA in the mixed structure is the same as in pure PLA and the multilayer structure. However, the way they are arranged in the filter structure differs from the multilayer and pure PLA structures. Przekop and Gradoń [13] showed in a theoretical model that adding nanofibres to the filtration structure significantly increases its nanoparticle filtration efficiency. The nanofibre is an attractor for the deposition of nanoparticles, and their small share does not considerably increase the pressure drop. However, how the nanofibres are arranged relative to the microfibres is very important. The presence of nanofibres in the vicinity of microfibres changes the airflow field around the microfibres, which leads to changes in the particle capture efficiency of a single fibre. Mixing nanometric fibres with micrometric fibres during the simultaneous blowing of molten polymer and polymer solution causes an even distribution of nanometric fibres throughout the filtration structure. One compact layer of nanofibres is not created, as in the case of multilayer and pure PLA structures (with high efficiency but also high-pressure drop). The dispersion of nanofibres throughout the filtration structure volume increases filtration efficiency without increasing the pressure drop. Due to the low-pressure drop, it is possible to extend the operating time of the filtration structure, which leads to the retention of a larger mass of filtered impurities.
3.3. Loading Study
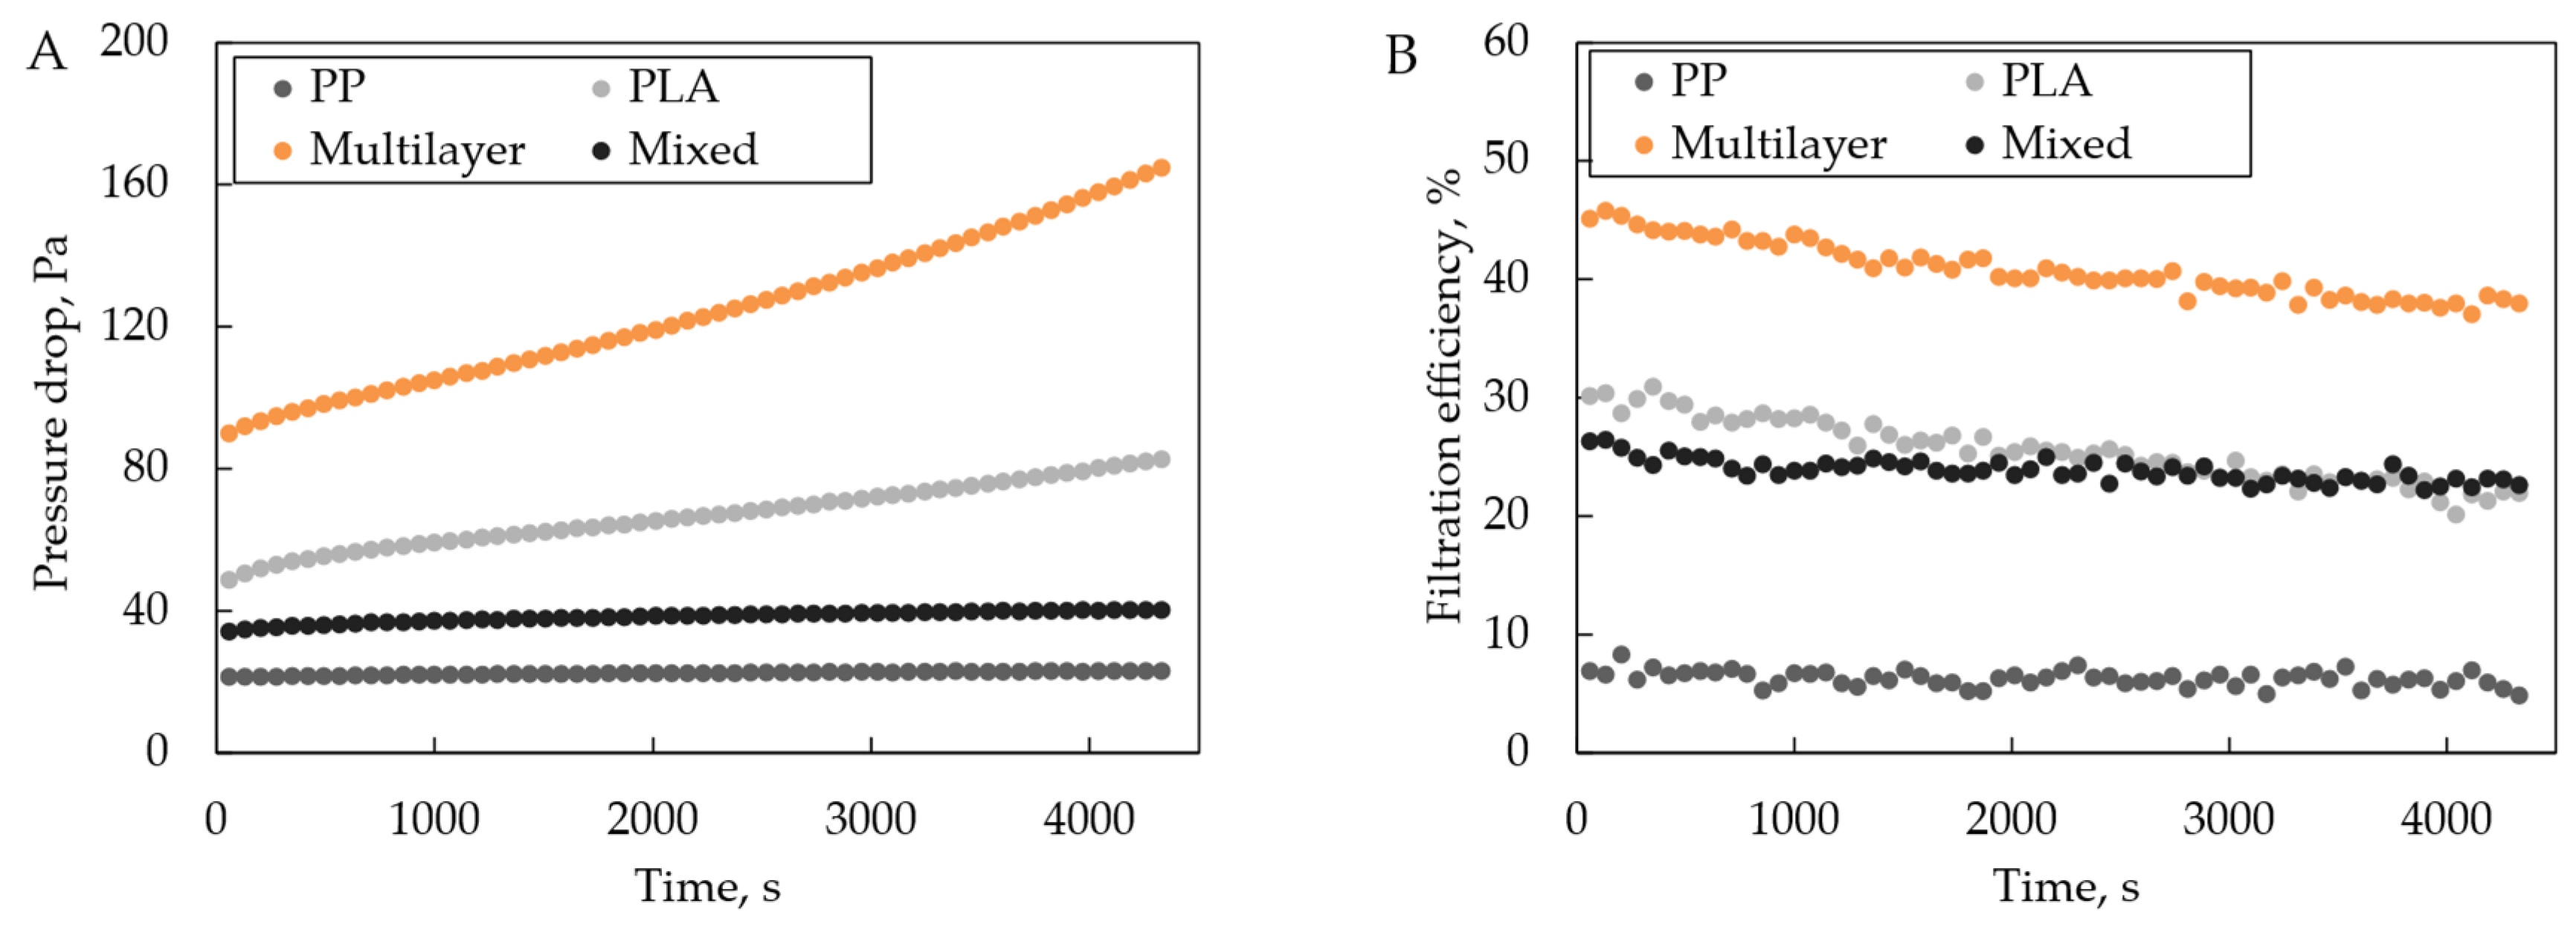
The four produced filtration structures were subjected to the loading study for 60 min. Based on the results, charts were prepared to show the relationship between filtration efficiency and pressure drop during the loading study (Figure 10).
The increase in filter pressure drop and the decrease in filtration efficiency are visible in the case of pure PLA and multilayer structures, but are very insignificant in the case of the mixed and pure PP structures. During the loading process with DEHS droplets, the pressure drop increases due to the decrease in the porosity of the material (free spaces between the fibres begin to fill with liquid bridges), and the filtration efficiency decreases as a result of the increase in the average diameter of the fibres covered with the oil film. For materials with a layer of nanofibres (PLA and multilayer structures), an intense increase in pressure drop and a decrease in filtration efficiency are a consequence of how the nanofibres are distributed in the material. A uniform layer of nanofibres effectively retains DEHS drops and quickly reduces its porosity, which results in a rapid increase in pressure drop. Where the nanofibres are not arranged in layers (mixed structure) or are absent (PP structure), the change in the material’s porosity due to the capture of drops is slower, so the increase in pressure drop is also slower. Changes in the filtration structure due to exposure to DEHS drops are presented in Figure 11.
Analysing the value of the quality factor during the loading process, one can also notice significant differences in its course for the tested structures (Figure 12). It is worth noting that at the end of the loading study, the quality factor of pure PLA and multilayer structure was at the comparable level to the quality factor of PP structure. The high filtration efficiency of those structures and high flow resistance, which at the end of the loading process is almost twice as high as the initial one, leads to low Qf values.
Two periods are visible in the curves, showing the change in the Qf value over time. The Qf value decreases rapidly in the first phase (up to approximately 1000 s). In the second phase, the decline in the Qf value is slower. Figure 13 shows the course of Qf in both phases and the adjustment to the course of a linear function. The accuracy of function fitting for Qf waveforms for structures containing nanofibres (PLA, multilayer, and mixed) is satisfactory. Table 3 lists the values of the slope coefficients of linear functions describing the Qf course during the loading study. The slope coefficient shows the Qf value reduction rate during the loading process. The smaller the slope coefficient, the slower the Qf will decrease over time.
The appearance of two phases of filter operation, particularly the slowdown in the decline in Qf of the mixed structure, may be related to the dripping of DEHS deposited in the filter structure. In the initial filtration phase, DEHS drops are retained by the fibres, the fibre diameter increases, liquid bridges are formed, and porosity decreases. After some time, the DEHS drops deposited on the fibres begin to flow, which gives rise to the second phase. However, Figure 11 shows that the degree of pore filling with liquid in filtration structures with a compact layer of PLA fibres is much greater than in the mixed structure. A compact layer of nanofibres holds DEHS better in the space between the fibres than a mixed structure. It is possible that dripping in such a structure is slower; hence, a more significant increase in pressure drop and a more rapid decrease in Qf value than in a mixed structure is observed.
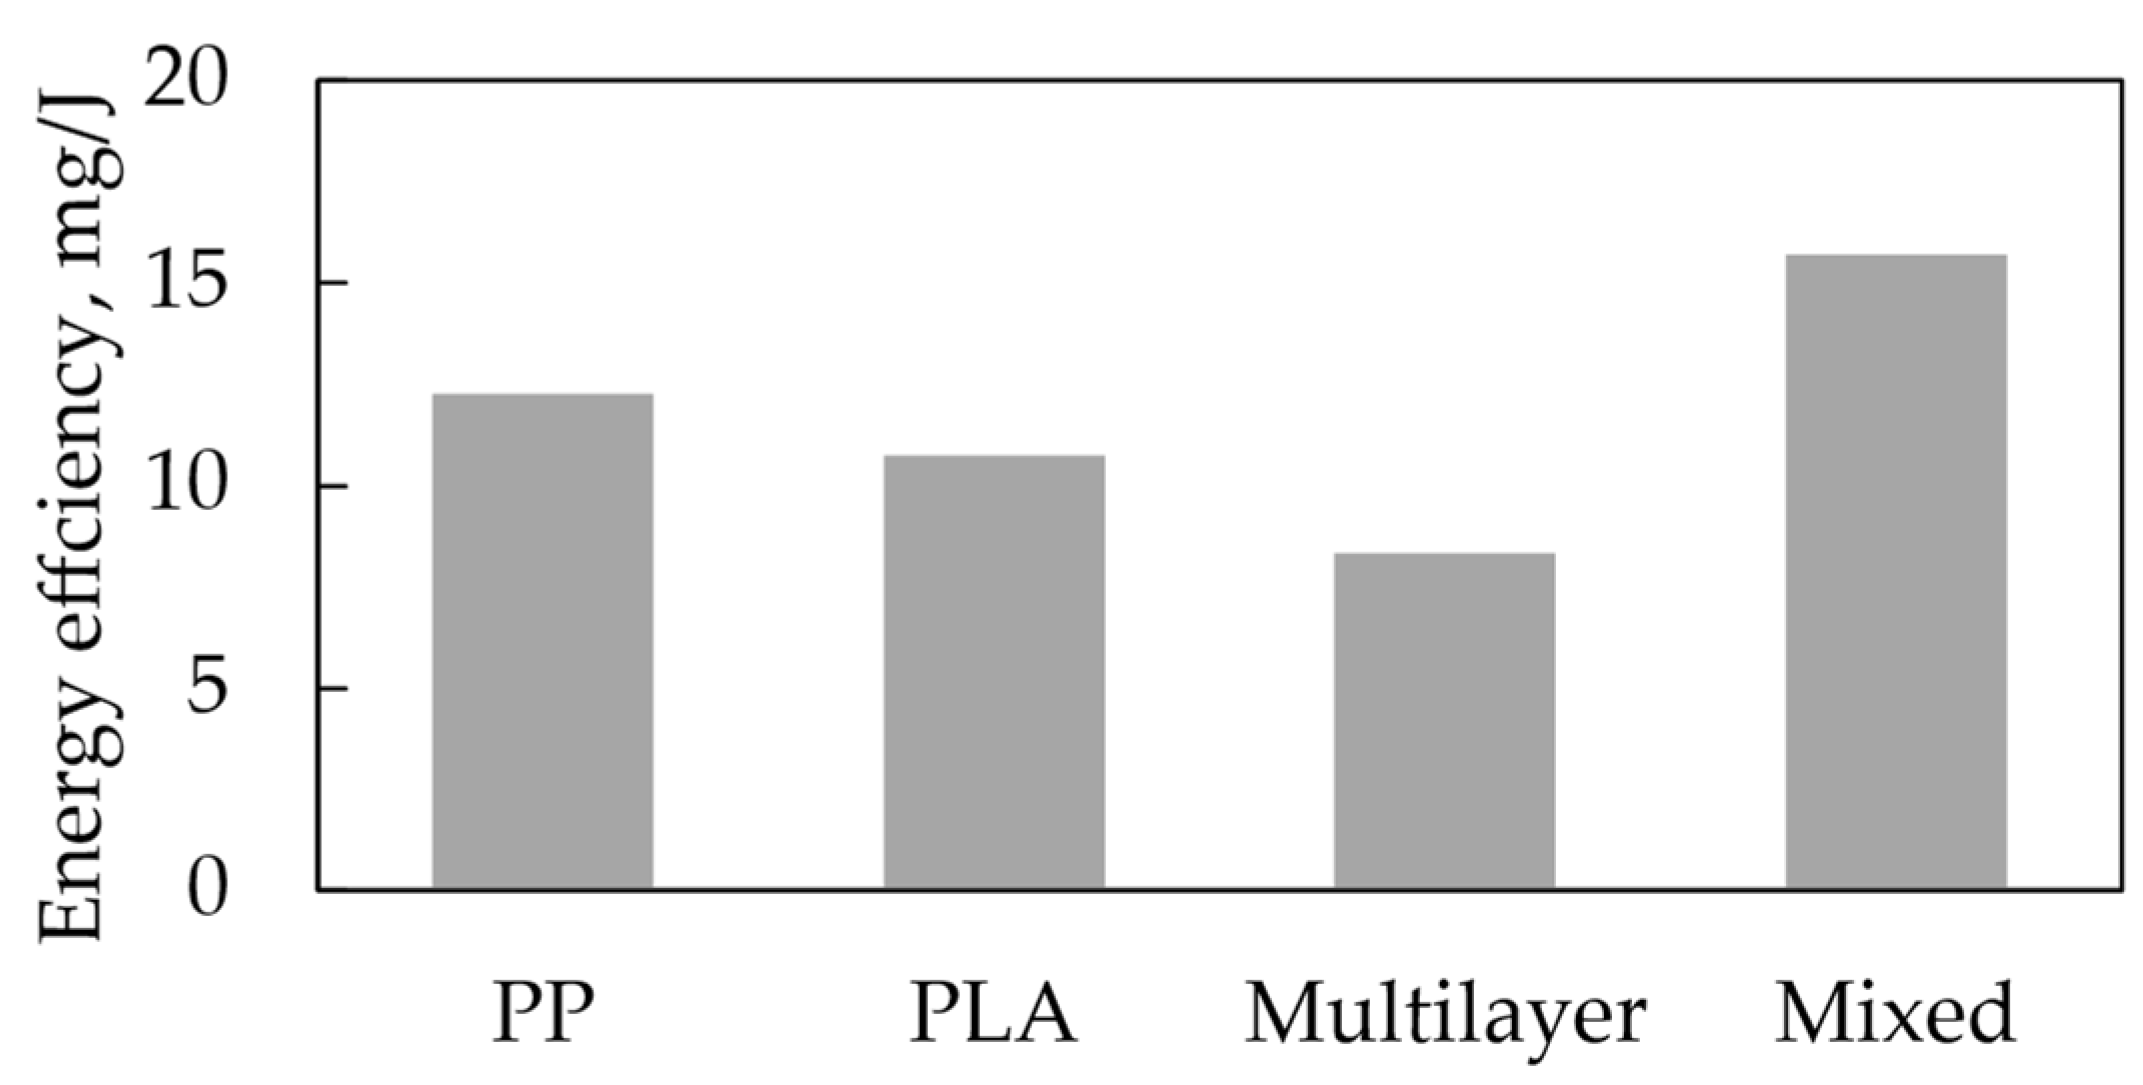
A filter structure with low Qf will consume more energy during operation. By dividing the mass of DEHS retained in the filtration structure by the power needed for the filter operation, determined as the multiplication of time, flow and pressure drop, it was calculated the droplets mass the filter would retain using 1 J of energy [8]. The results are summarised in Figure 14. As expected, the most energy-efficient filter is a mixed structure. It retains nearly 15.70 mg of DEHS using 1 J, while the highly efficient multilayer structure retains only 8.36 mg. However, it is worth remembering that low energy consumption cannot be the only criterion for assessing a filtration structure because low-efficiency filters (PP structure) rank high in such a ranking.
4. Conclusions
By combining melt-blowing and solution-blowing, two filtration structures were created: multilayer, in which a layer of fibres obtained from solution-blowing was placed between the layers of fibres produced from melt-blowing, and the mixed structure from simultaneous solution-blowing and melt-blowing. The high filtration efficiency and high-pressure drop characterises the obtained multilayer structure. Mixed structures achieve high quality factor values, which are maintained for a longer filtration time and are characterised by a high mass of DEHS deposited per 1 J of energy used for work.
The research shows that it is possible to combine both fibre production techniques. However, each connection method will have its advantages and disadvantages. The choice of combining both techniques should be based on a thorough analysis of the specific filtration requirements and the benefits offered by each approach in meeting those needs.
Author Contributions
Conceptualisation, A.P., Ł.W. and A.M.; methodology, A.P. and Ł.W.; formal analysis, A.P.; investigation, A.P. and Ł.W.; writing—original draft preparation, A.P. and Ł.W.; writing—review and editing, A.P., Ł.W. and A.M.; visualisation, A.P. and Ł.W.; supervision, A.M. All authors have read and agreed to the published version of the manuscript.
Funding
This research received no external funding.
Data Availability Statement
Data are contained within the article.
Conflicts of Interest
The authors declare no conflicts of interest.
References
- Manisalidis, I.; Stavropoulou, E.; Stavropoulos, A.; Bezirtzoglou, E. Environmental and Health Impacts of Air Pollution: A Review. Front. Public Health 2020, 8, 14. [Google Scholar] [CrossRef] [PubMed]
- Kang, Y.O.; Im, J.N.; Park, W.H. Morphological and Permeable Properties of Antibacterial Double-Layered Composite Nonwovens Consisting of Microfibers and Nanofibers. Compos. Part B Eng. 2015, 75, 256–263. [Google Scholar] [CrossRef]
- Liu, Y.; Qian, X.; Wang, L.; Qian, Y.; Bai, H.; Wang, X. Hierarchical Micro/Nanofibrous Filter for Effective Fine-Particle Capture. Powder Technol. 2020, 360, 1192–1199. [Google Scholar] [CrossRef]
- Yang, Y.; Zhang, S.; Zhao, X.; Yu, J.; Ding, B. Sandwich Structured Polyamide-6/Polyacrylonitrile Nanonets/Bead-on-String Composite Membrane for Effective Air Filtration. Sep. Purif. Technol. 2015, 152, 14–22. [Google Scholar] [CrossRef]
- Cai, R.-R.; Li, S.-Z.; Zhang, L.-Z.; Lei, Y. Fabrication and Performance of a Stable Micro/Nano Composite Electret Filter for Effective PM2.5 Capture. Sci. Total Environ. 2020, 725, 138297. [Google Scholar] [CrossRef] [PubMed]
- Amin, A.; Merati, A.A.; Bahrami, S.H.; Bagherzadeh, R. Effects of Porosity Gradient of Multilayered Electrospun Nanofibre Mats on Air Filtration Efficiency. J. Text. Inst. 2017, 108, 1563–1571. [Google Scholar] [CrossRef]
- Sun, Q.; Leung, W.W.-F. Charged PVDF Multi-Layer Filters with Enhanced Filtration Performance for Filtering Nano-Aerosols. Sep. Purif. Technol. 2019, 212, 854–876. [Google Scholar] [CrossRef]
- Penconek, A.; Jackiewicz-Zagórska, A.; Przekop, R.; Moskal, A. Fibrous Structures Produced Using the Solution Blow-Spinning Technique for Advanced Air Filtration Process. Materials 2023, 16, 7118. [Google Scholar] [CrossRef] [PubMed]
- Toptas, A.; Calisir, M.D.; Gungor, M.; Kilic, A. Enhancing Filtration Performance of Submicron Particle Filter Media through Bimodal Structural Design. Polym. Eng. Sci. 2024, 64, 901–912. [Google Scholar] [CrossRef]
- Cui, J.; Wang, Y.; Lu, T.; Liu, K.; Huang, C. High Performance, Environmentally Friendly and Sustainable Nanofiber Membrane Filter for Removal of Particulate Matter 1.0. J. Colloid Interface Sci. 2021, 597, 48–55. [Google Scholar] [CrossRef] [PubMed]
- Rashid, T.U.; Gorga, R.E.; Krause, W.E. Mechanical Properties of Electrospun Fibers—A Critical Review. Adv. Eng. Mater. 2021, 23, 2100153. [Google Scholar] [CrossRef]
- Yuk, J.; Chakraborty, A.; Cheng, S.; Chung, C.-I.; Jorgensen, A.; Basu, S.; Chamorro, L.P.; Jung, S. On the Design of Particle Filters Inspired by Animal Noses. J. R. Soc. Interface 2022, 19, 20210849. [Google Scholar] [CrossRef] [PubMed]
- Przekop, R.; Gradoń, L. Deposition and Filtration of Nanoparticles in the Composites of Nano- and Microsized Fibers. Aerosol Sci. Technol. 2008, 42, 483–493. [Google Scholar] [CrossRef]
- Buivydiene, D.; Todea, A.M.; Asbach, C.; Krugly, E.; Martuzevicius, D.; Kliucininkas, L. Composite Micro/Nano Fibrous Air Filter by Simultaneous Melt and Solution Electrospinning. J. Aerosol Sci. 2021, 154, 105754. [Google Scholar] [CrossRef]
- Hao, X.; Zeng, Y. A Review on the Studies of Air Flow Field and Fiber Formation Process during Melt Blowing. Ind. Eng. Chem. Res. 2019, 58, 11624–11637. [Google Scholar] [CrossRef]
- Banerji, A.; Jin, K.; Mahanthappa, M.K.; Bates, F.S.; Ellison, C.J. Porous Fibers Templated by Melt Blowing Cocontinuous Immiscible Polymer Blends. ACS Macro Lett. 2021, 10, 1196–1203. [Google Scholar] [CrossRef] [PubMed]
- Wu, W.; Han, W.; Sun, Y.; Yi, H.; Wang, X. Experimental Study of the Airflow Field and Fiber Motion in the Melt-Blowing Process. Polymers 2024, 16, 469. [Google Scholar] [CrossRef] [PubMed]
- Zhang, L.; Kopperstad, P.; West, M.; Hedin, N.; Fong, H. Generation of Polymer Ultrafine Fibers through Solution (Air-) Blowing. J. Appl. Polym. Sci. 2009, 114, 3479–3486. [Google Scholar] [CrossRef]
- Gao, Y.; Zhang, J.; Su, Y.; Wang, H.; Wang, X.-X.; Huang, L.-P.; Yu, M.; Ramakrishna, S.; Long, Y.-Z. Recent Progress and Challenges in Solution Blow Spinning. Mater. Horiz. 2021, 8, 426–446. [Google Scholar] [CrossRef] [PubMed]
- Sinha-Ray, S.; Sinha-Ray, S.; Yarin, A.L.; Pourdeyhimi, B. Theoretical and Experimental Investigation of Physical Mechanisms Responsible for Polymer Nanofiber Formation in Solution Blowing. Polymer 2015, 56, 452–463. [Google Scholar] [CrossRef]
- Medeiros, E.S.; Glenn, G.M.; Klamczynski, A.P.; Orts, W.J.; Mattoso, L.H.C. Solution Blow Spinning: A New Method to Produce Micro- and Nanofibers from Polymer Solutions. J. Appl. Polym. Sci. 2009, 113, 2322–2330. [Google Scholar] [CrossRef]
- Lou, H.; Li, W.; Li, C.; Wang, X. Systematic Investigation on Parameters of Solution Blown Micro/Nanofibers Using Response Surface Methodology Based on box-Behnken Design. J. Appl. Polym. Sci. 2013, 130, 1383–1391. [Google Scholar] [CrossRef]
- Sinha-Ray, S.; Khansari, S.; Yarin, A.L.; Pourdeyhimi, B. Effect of Chemical and Physical Cross-Linking on Tensile Characteristics of Solution-Blown Soy Protein Nanofiber Mats. Ind. Eng. Chem. Res. 2012, 51, 15109–15121. [Google Scholar] [CrossRef]
- Sinha-Ray, S.; Zhang, Y.; Yarin, A.L.; Davis, S.C.; Pourdeyhimi, B. Solution Blowing of Soy Protein Fibers. Biomacromolecules 2011, 12, 2357–2363. [Google Scholar] [CrossRef] [PubMed]
- Penconek, A.; Kasak, D.; Moskal, A. Soy Protein Nanofibers Obtained by Solution Blow Spinning. Processes 2023, 11, 2310. [Google Scholar] [CrossRef]
- Penconek, A.; Kilarski, M.; Soczewka, A.; Wojasiński, M.; Moskal, A. Production of Nanofibers by Blow Spinning from Polylactide Containing Propolis and Beeswax. Fibers 2024, 12, 8. [Google Scholar] [CrossRef]
- Werner, Ł.; Nowak, B.; Jackiewicz-Zagórska, A.; Gołofit-Szymczak, M.; Górny, R.L. Functionalized Zinc Oxide Nanorods—Polypropylene Nonwoven Composite with High Biological and Photocatalytic Activity. J. Environ. Chem. Eng. 2023, 11, 111079. [Google Scholar] [CrossRef]
- Tan, D.H.; Zhou, C.; Ellison, C.J.; Kumar, S.; Macosko, C.W.; Bates, F.S. Meltblown Fibers: Influence of Viscosity and Elasticity on Diameter Distribution. J. Non-Newton. Fluid Mech. 2010, 165, 892–900. [Google Scholar] [CrossRef]
- Soltani, I.; Macosko, C.W. Influence of Rheology and Surface Properties on Morphology of Nanofibers Derived from Islands-in-the-Sea Meltblown Nonwovens. Polymer 2018, 145, 21–30. [Google Scholar] [CrossRef]
- Ellison, C.J.; Phatak, A.; Giles, D.W.; Macosko, C.W.; Bates, F.S. Melt Blown Nanofibers: Fiber Diameter Distributions and Onset of Fiber Breakup. Polymer 2007, 48, 3306–3316. [Google Scholar] [CrossRef]
- EN 149:2001+A1:2009; Respiratory Protective Devices. Filtering Half Masks to Protect against Particles. Requirements, Testing, Marking. European Committee for Standardization: Bruselas, Belgium, 2009.
- Hinds, W.C. Aerosol Technology: Properties, Behavior, and Measurement of Airborne Particles, 2nd ed.; Wiley: Hoboken, NJ, USA, 1999. [Google Scholar]
- Brochocka, A.; Nowak, A.; Majchrzycka, K.; Puchalski, M.; Sztajnowski, S. Multifunctional Polymer Composites Produced by Melt-Blown Technique to Use in Filtering Respiratory Protective Devices. Materials 2020, 13, 712. [Google Scholar] [CrossRef] [PubMed]
- Penconek, A.; Jackiewicz, A.; Moskal, A. Penetration of Diesel Exhaust Particles (DEPs) through Fibrous Filters Produced Using Melt-Blown Technology. KONA Powder Part. J. 2015, 32, 184–195. [Google Scholar] [CrossRef]
Figure 1.
The nozzles with the polymer distributor (A), the scheme of the polymer distributor (B), the scheme of nozzle cross-section (C).
Figure 1.
The nozzles with the polymer distributor (A), the scheme of the polymer distributor (B), the scheme of nozzle cross-section (C).

Figure 2.
The scheme of melt-blowing equipment used to produce non-woven filters. Reproduced with permission [27] Copyright © 2023 Elsevier Ltd. (Amsterdam, The Netherlands).
Figure 2.
The scheme of melt-blowing equipment used to produce non-woven filters. Reproduced with permission [27] Copyright © 2023 Elsevier Ltd. (Amsterdam, The Netherlands).
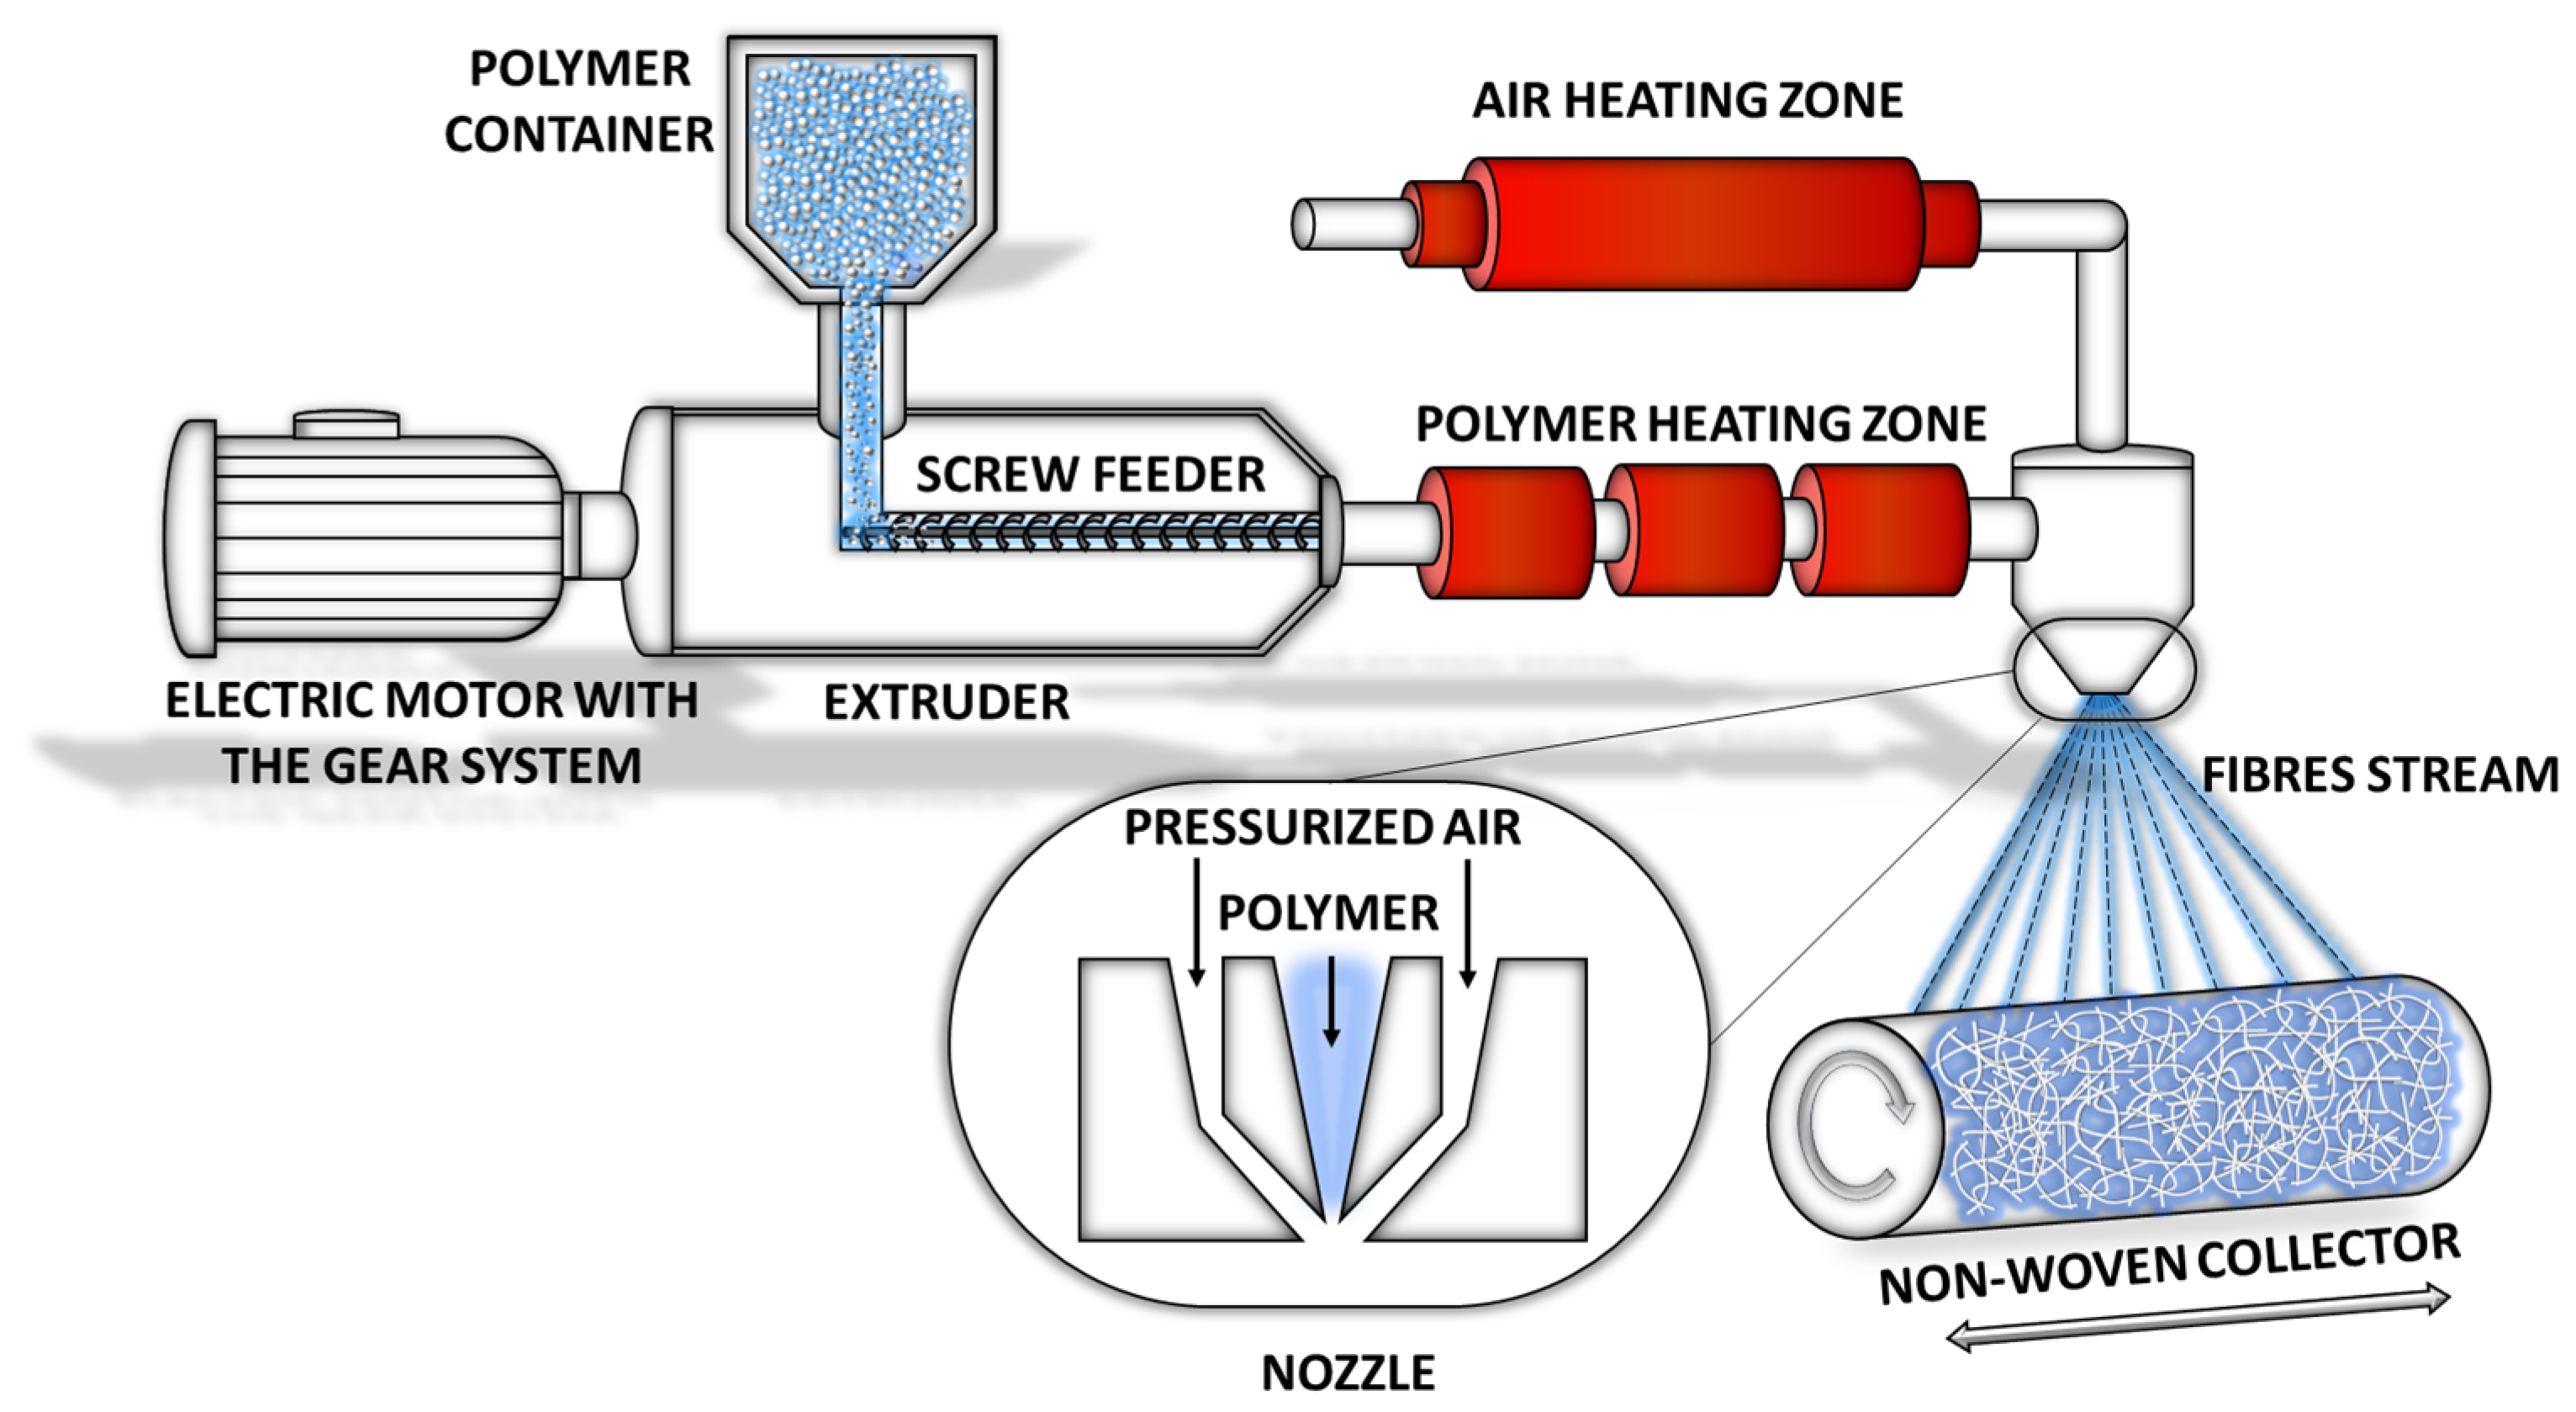
Figure 3.
Scheme showing of positioning the nozzles to the collector.

Figure 4.
Schematic presentation of MFP 1000 HEPA testing rig for filtration droplet with a 0.2–2 μm diameter.
Figure 4.
Schematic presentation of MFP 1000 HEPA testing rig for filtration droplet with a 0.2–2 μm diameter.

Figure 5.
The size distributions (0.2–2 μm) of tested DEHS oil droplets.
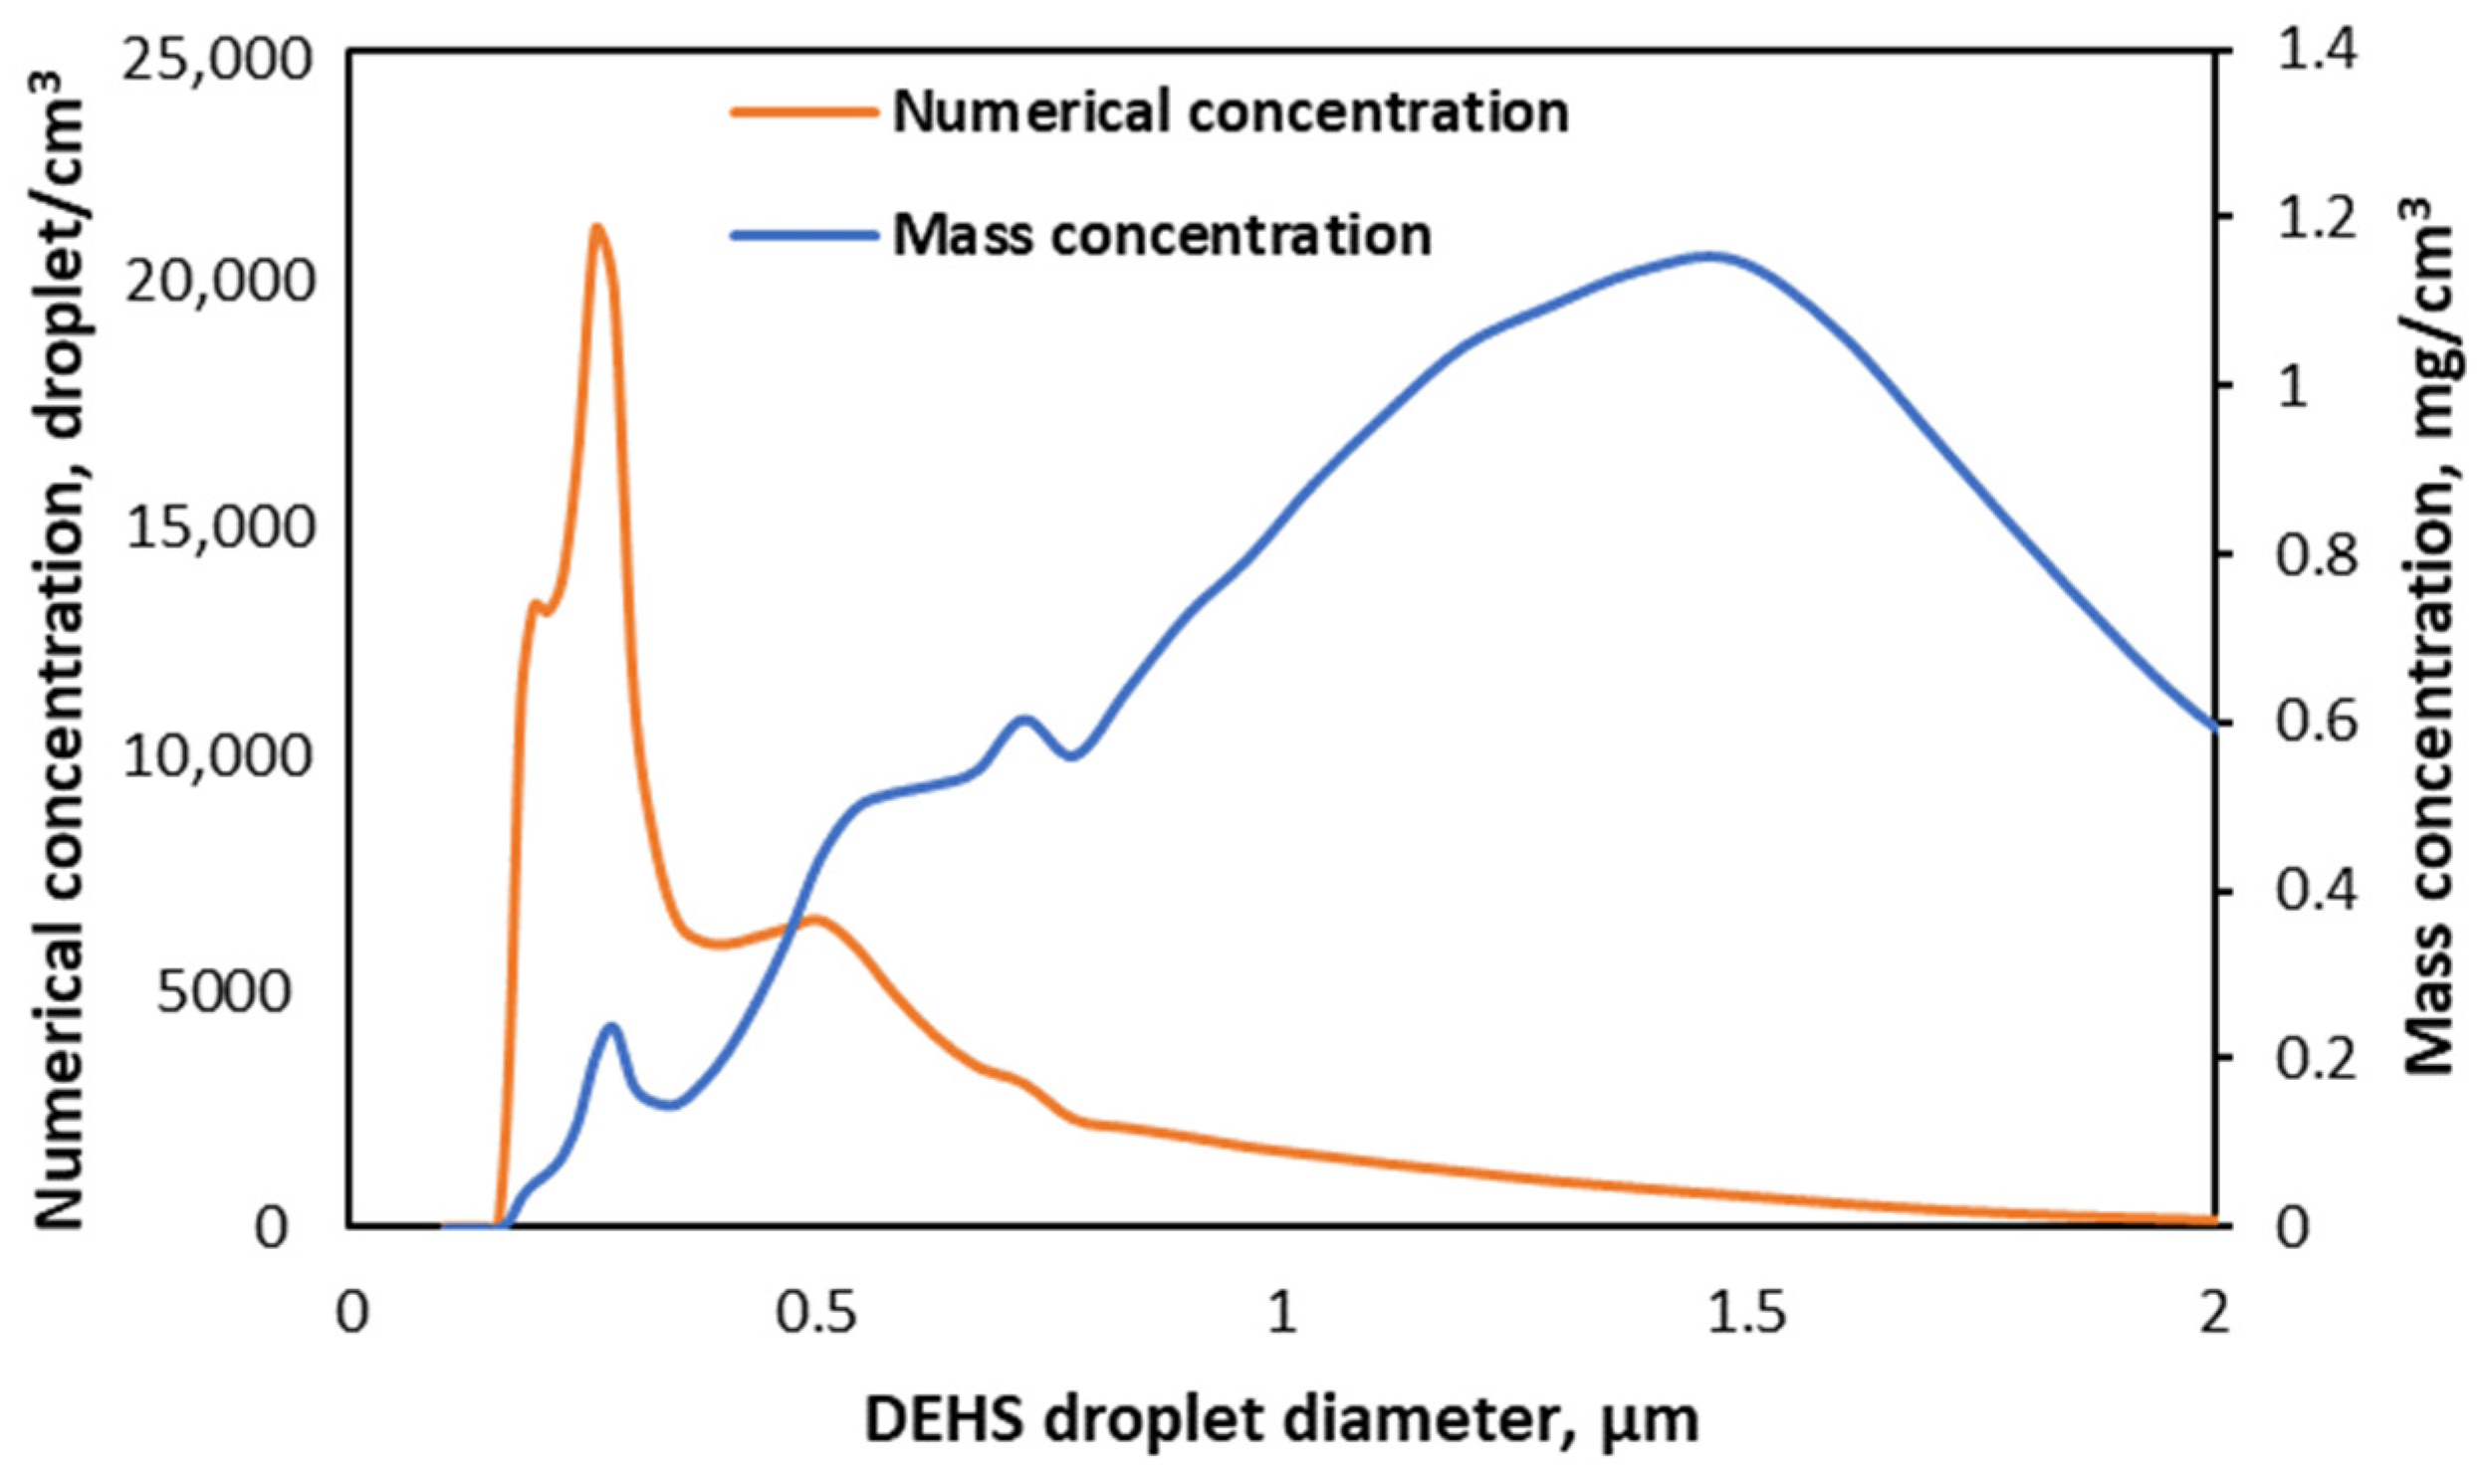
Figure 6.
SEM photo of obtained filtration structures: (A) PP fibres, (B) PLA fibres, (C) mixed structure, (D) multilayer structure; the thickness of the structures (H, mm) and the surface density (q, g/cm2) were marked in the figure.
Figure 6.
SEM photo of obtained filtration structures: (A) PP fibres, (B) PLA fibres, (C) mixed structure, (D) multilayer structure; the thickness of the structures (H, mm) and the surface density (q, g/cm2) were marked in the figure.
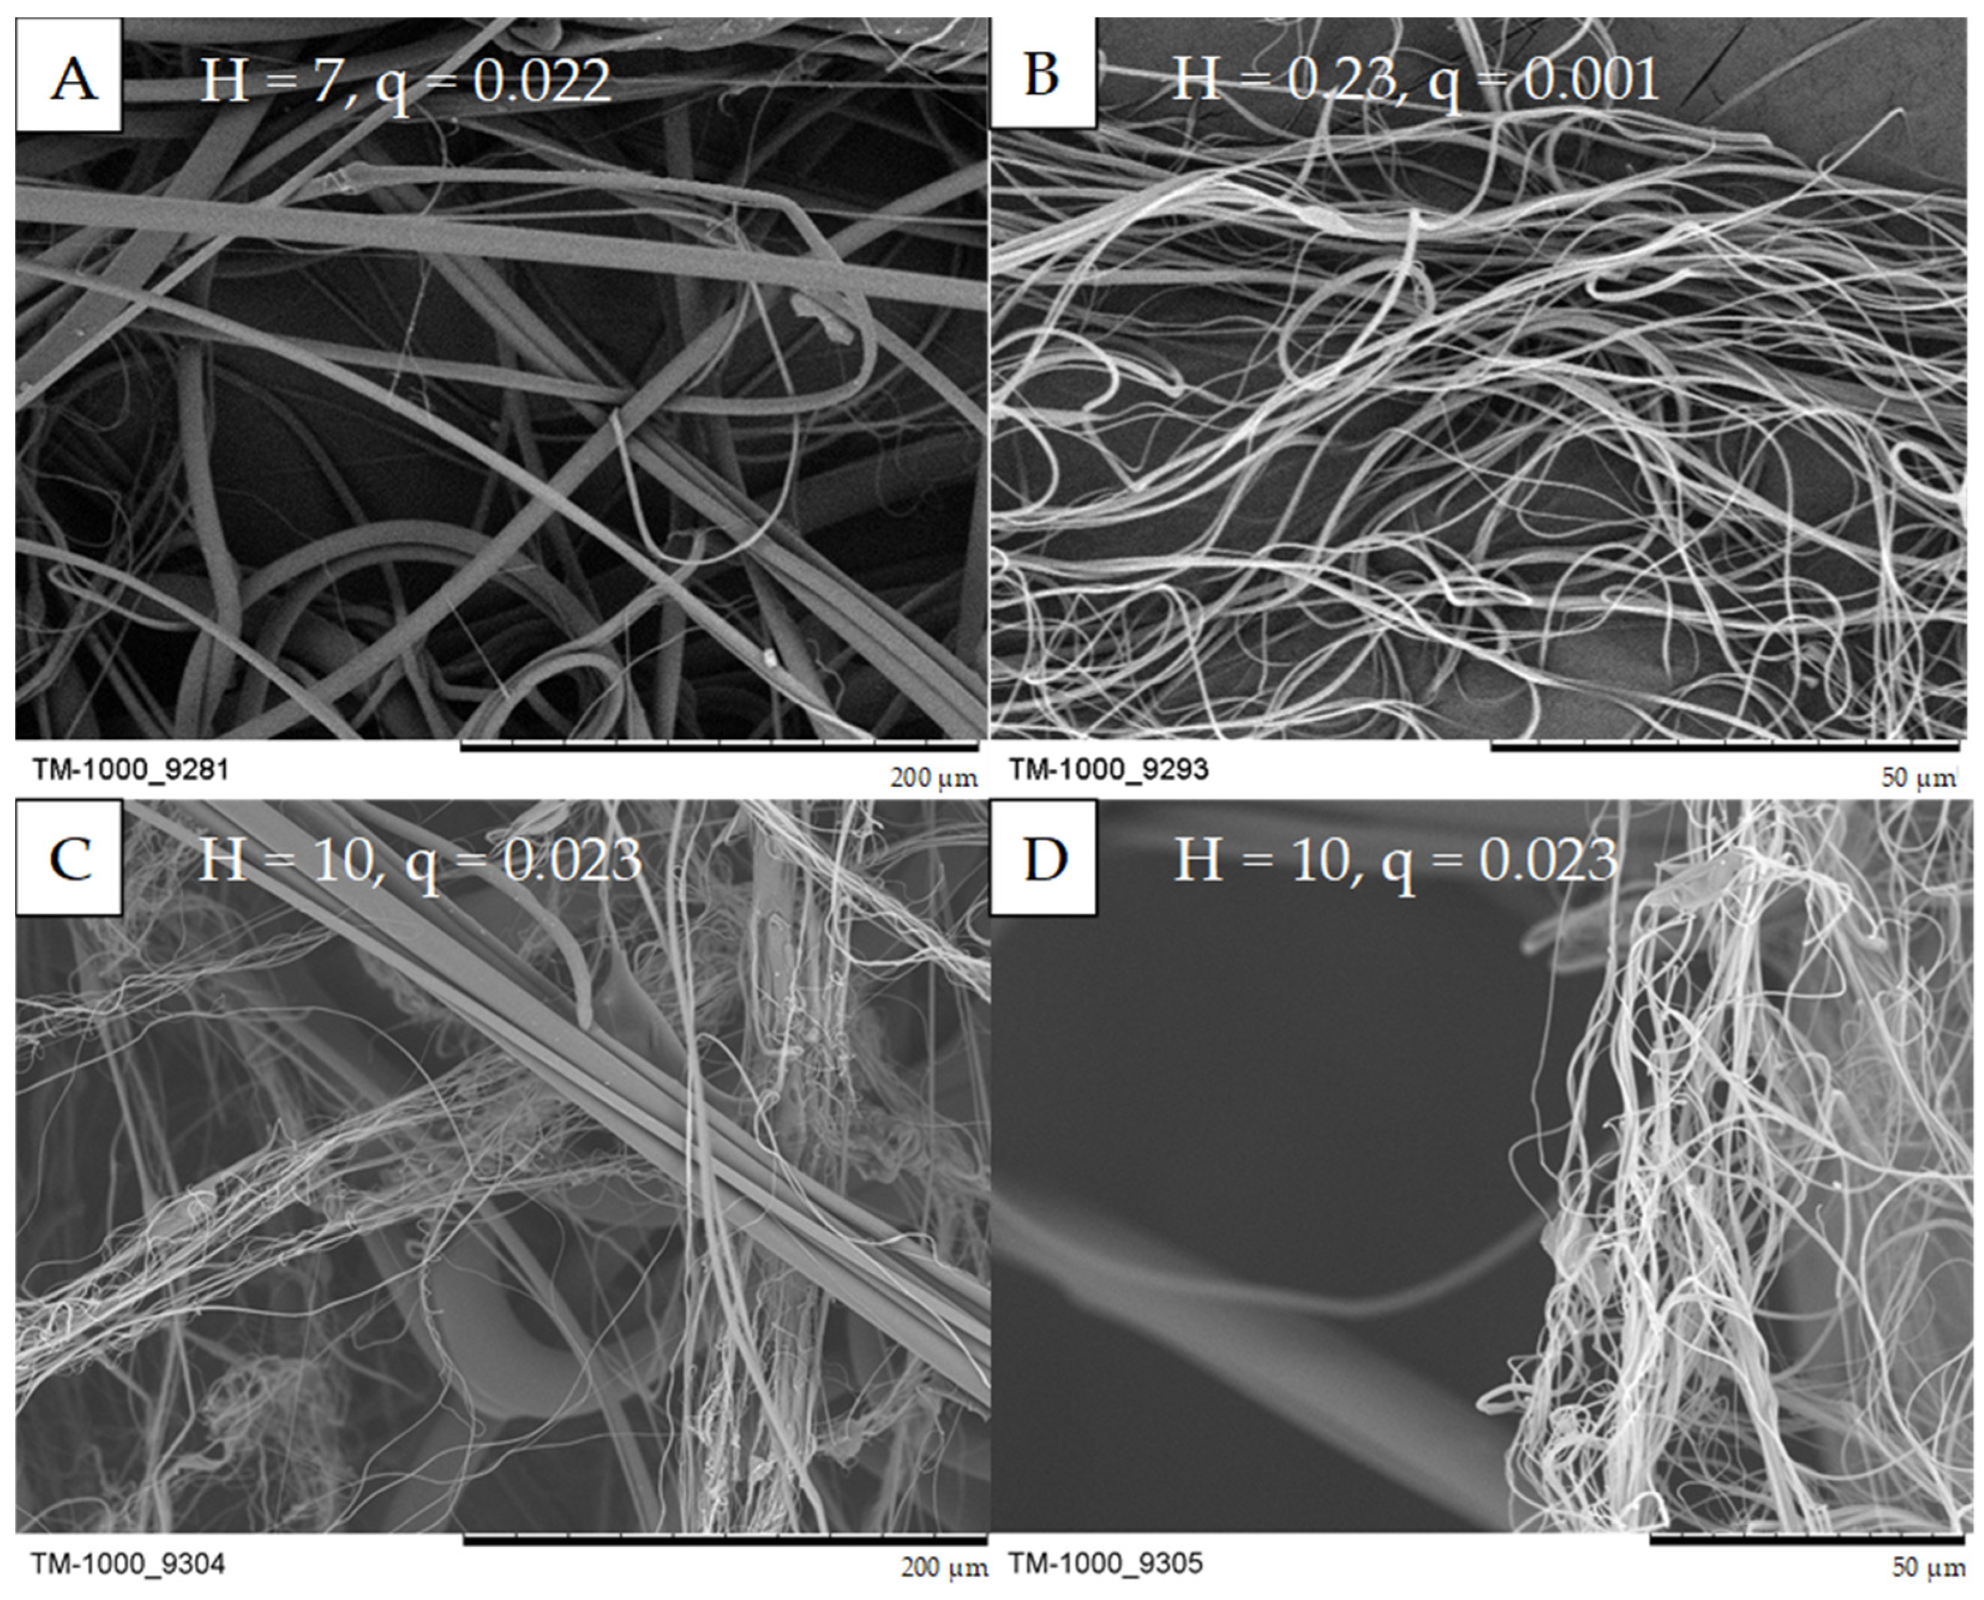
Figure 7.
Fibre diameter distribution: (A) PLA fibres, (B) PP fibres.

Figure 8.
FTIR-ATR spectra of PP fibres, PLA fibres and mixed structure.
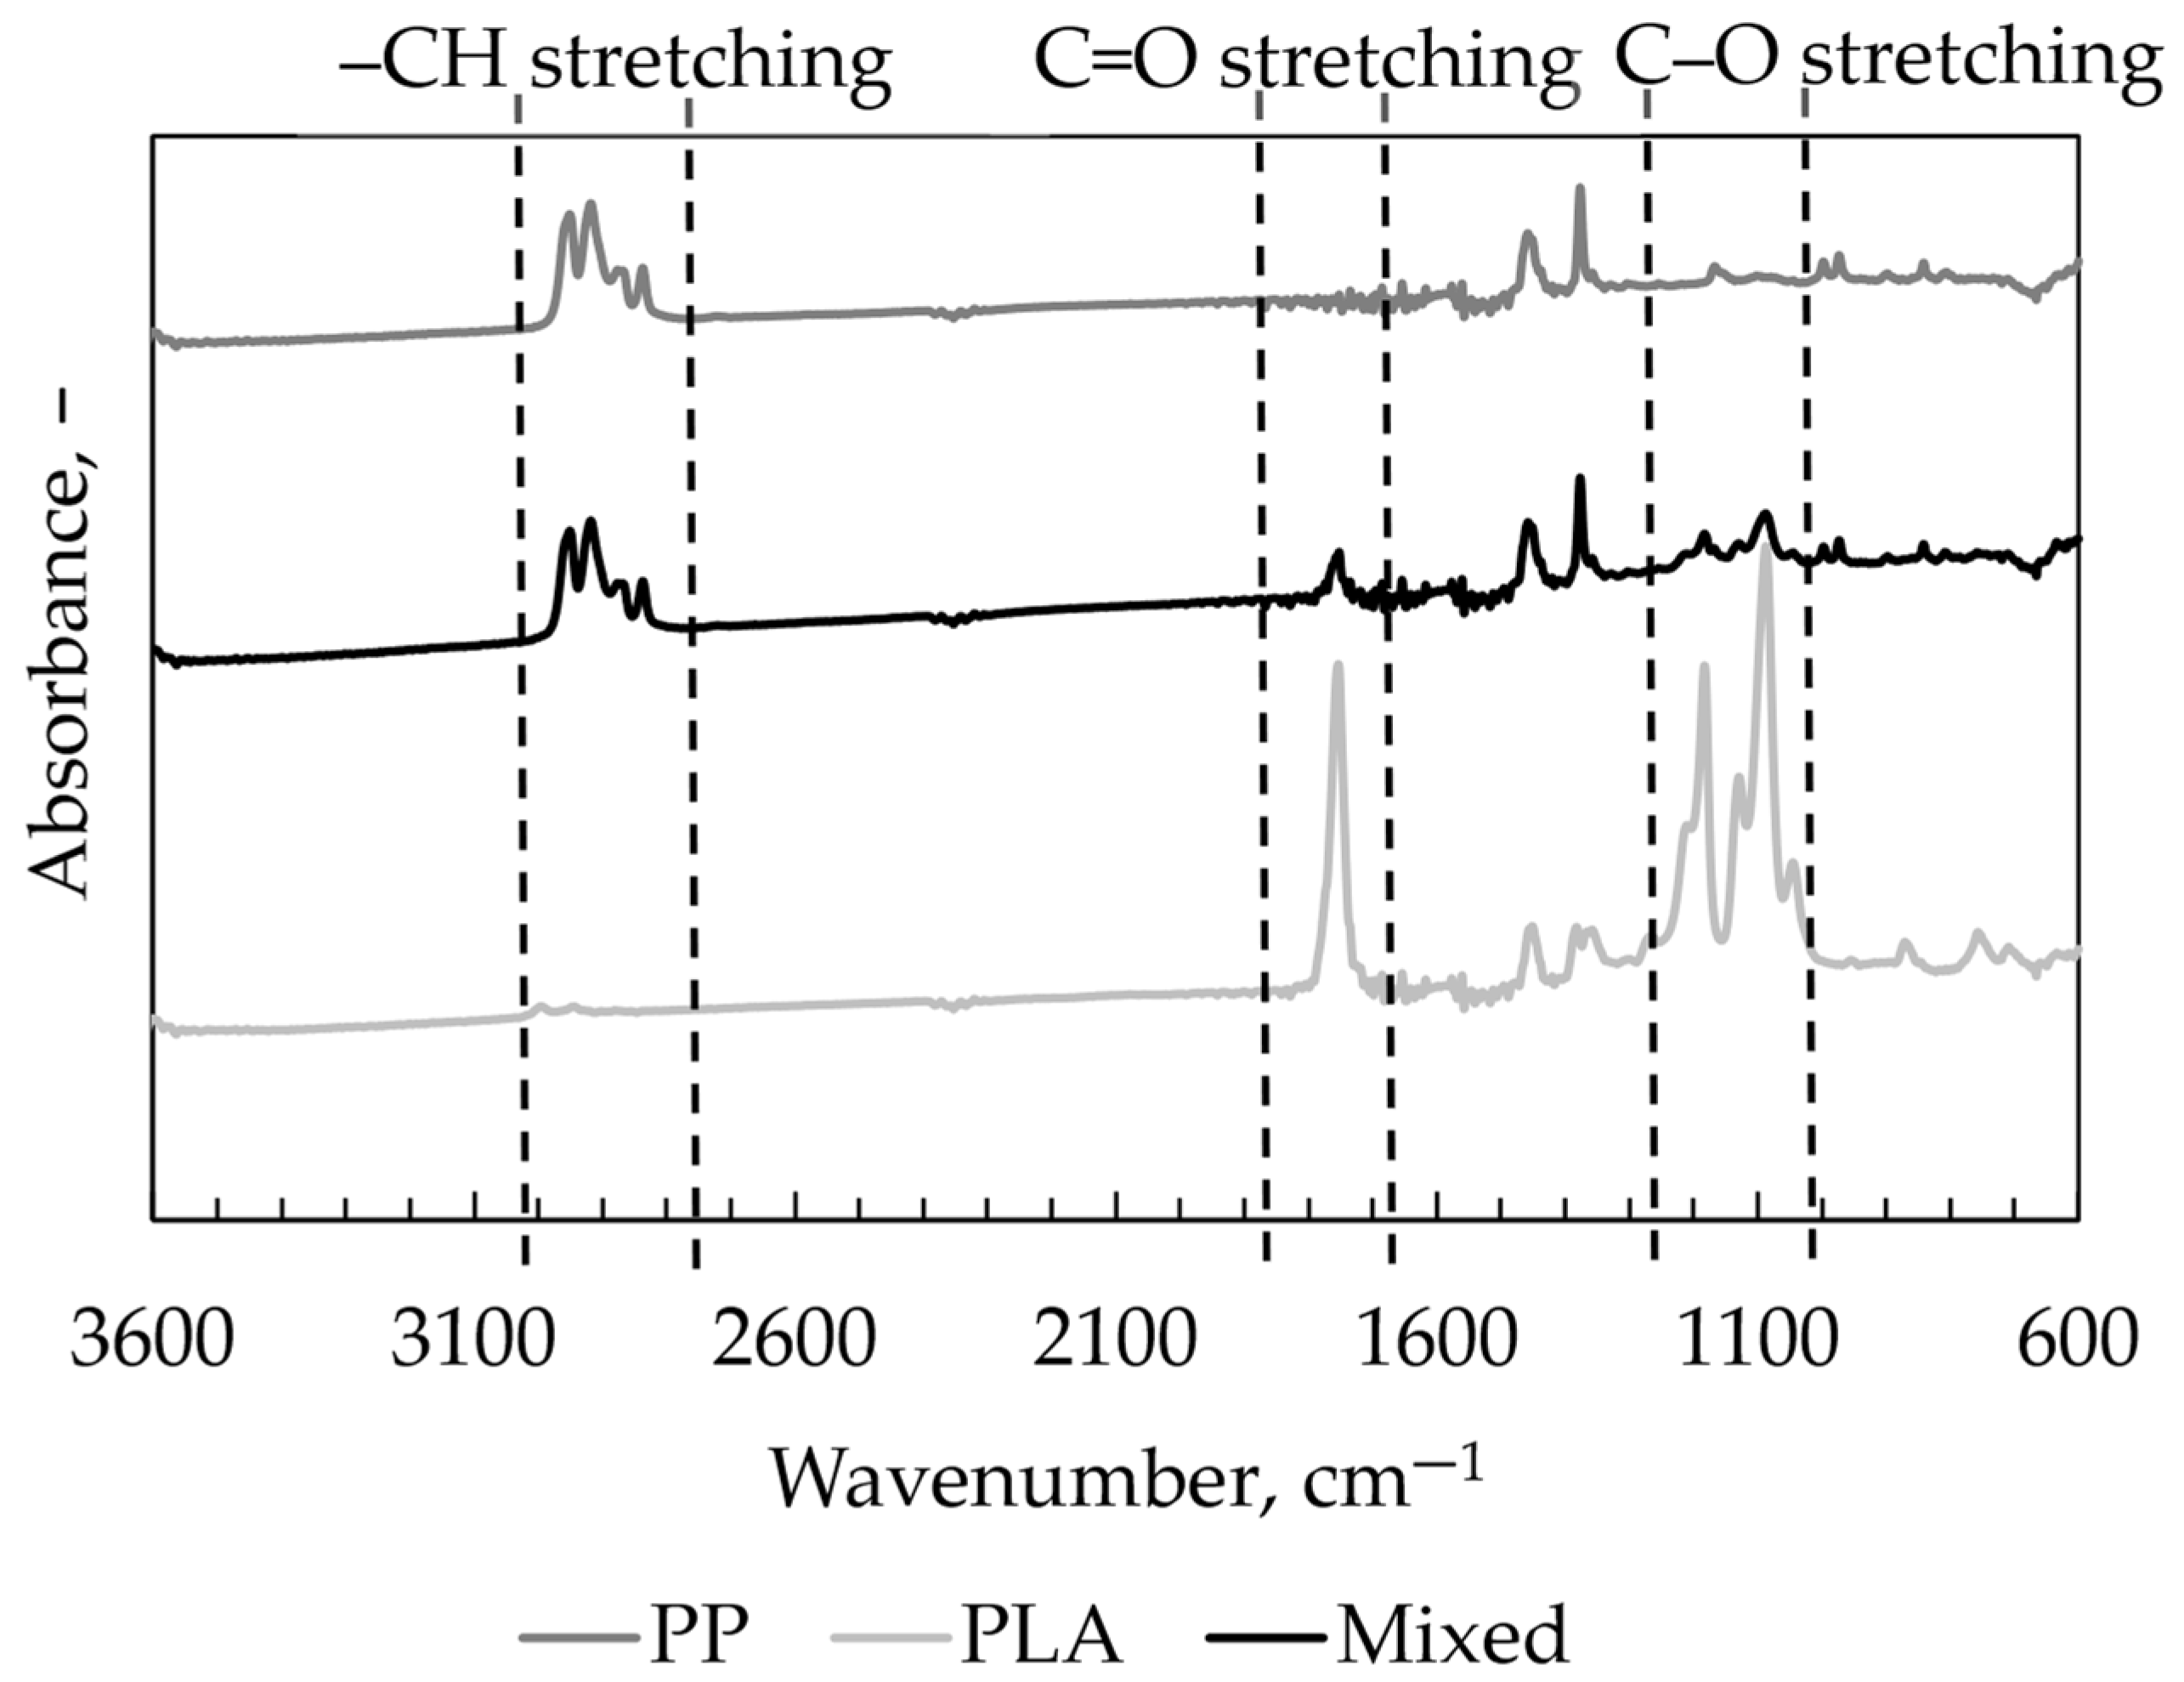
Figure 9.
Theoretical filtration efficiency and pressure drop (PP fibres left graph, PLA fibres right graph).
Figure 9.
Theoretical filtration efficiency and pressure drop (PP fibres left graph, PLA fibres right graph).

Figure 10.
The pressure drop (A) and filtration efficiency (B) during the loading study.

Figure 11.
The filtration structure after loading study tests with DEHS droplets.

Figure 12.
Quality factor during the loading study. The dashed line marks the phase boundary.

Figure 13.
Two phases of the quality factor course during the loading study.

Figure 14.
Mass of retained DEHS from 1 J of energy consumed.


Table 1.
Experimental initial filtration efficiency E (%) and pressure drop P (Pa) of fibrous structures.
Table 1.
Experimental initial filtration efficiency E (%) and pressure drop P (Pa) of fibrous structures.
| PP | PLA | Multilayer | Mixed | |||||
|---|---|---|---|---|---|---|---|---|
| E, % | P, Pa | E, % | P, Pa | E, % | P, Pa | E, % | P, Pa | |
| Mean | 7.30 | 22.35 | 30.72 | 51.42 | 46.55 | 89.06 | 24.96 | 35.81 |
| SD | 0.53 | 1.30 | 1.34 | 1.19 | 0.53 | 7.08 | 2.07 | 2.14 |
Table 2.
Fibrous structures initial quality factor Qf (1/Pa).
| PP | PLA | Multilayer | Mixed | |
|---|---|---|---|---|
| Qf, 1/Pa | 0.0034 | 0.0071 | 0.0070 | 0.0080 |
Table 3.
The values of the slope coefficients (1/(Pa·s)).
| 1st Phase | 2nd Phase | |
|---|---|---|
| PP | −0.74 × 10⁻⁶ | −0.09 × 10⁻⁶ |
| PLA | −1.96 × 10⁻⁶ | −0.77 × 10⁻⁶ |
| Multilayer | −1.49 × 10⁻⁶ | −0.73 × 10⁻⁶ |
| Mixed | −1.80 × 10⁻⁶ | −0.33 × 10⁻⁶ |
Disclaimer/Publisher’s Note: The statements, opinions and data contained in all publications are solely those of the individual author(s) and contributor(s) and not of MDPI and/or the editor(s). MDPI and/or the editor(s) disclaim responsibility for any injury to people or property resulting from any ideas, methods, instructions or products referred to in the content. |
© 2024 by the authors. Licensee MDPI, Basel, Switzerland. This article is an open access article distributed under the terms and conditions of the Creative Commons Attribution (CC BY) license (https://creativecommons.org/licenses/by/4.0/).
Share and Cite
MDPI and ACS Style
Penconek, A.; Werner, Ł.; Moskal, A. Combining Solution-Blowing and Melt-Blowing Techniques to Produce an Efficient Non-Woven Filter. Processes 2024, 12, 857. https://doi.org/10.3390/pr12050857
AMA Style
Penconek A, Werner Ł, Moskal A. Combining Solution-Blowing and Melt-Blowing Techniques to Produce an Efficient Non-Woven Filter. Processes. 2024; 12(5):857. https://doi.org/10.3390/pr12050857
Chicago/Turabian StylePenconek, Agata, Łukasz Werner, and Arkadiusz Moskal. 2024. "Combining Solution-Blowing and Melt-Blowing Techniques to Produce an Efficient Non-Woven Filter" Processes 12, no. 5: 857. https://doi.org/10.3390/pr12050857
Note that from the first issue of 2016, this journal uses article numbers instead of page numbers. See further details here.