Article

Modeling and Hemofiltration Treatment of Acute Inflammation †

1
Department of Chemical and Petroleum Engineering; Swanson School of Engineering, University of Pittsburgh, Pittsburgh, PA 15261, USA
2
Department of Critical Care Medicine, University of Pittsburgh Medical Center, 3550 Terrace St, Pittsburgh, PA 15213, USA
3
Department of Bioengineering, Swanson School of Engineering, University of Pittsburgh, Pittsburgh, PA 15261, USA
4
McGowan Institute for Regenerative Medicine, University of Pittsburgh Medical Center, 450 Technology Dr, Suite 300, Pittsburgh, PA 15219, USA
5
Carnegie Mellon–University of Pittsburgh Ph.D. Program in Computational Biology, 3501 Fifth Ave, 3064 BST3, Pittsburgh, PA 15260, USA
6
Department of Surgery, University of Pittsburgh Medical Center, W944 Biomedical Sciences Tower, Pittsburgh, PA 15213, USA
7
Department of Mathematics, University of Pittsburgh, 301 Thackeray Hall, Pittsburgh, PA 15261, USA
*
Author to whom correspondence should be addressed.
This paper is an extended version of our paper published in Hogg, J.S.; Clermont, G.; Parker, R.S. Acute Inflammation Treatment via Particle Filter State Estimation and MPC. In Proceedings of the 9th International Symposium on the Dynamics and Control of Process Systems (DYCOPS), Leuven, Belgium, 5–7 July 2010; pp. 678–683.
Current address: Medtronic, 18000 Devonshire St, Northridge, CA 91325, USA
§
Current address: Service d’Anesthésie-Réanimation; Hôpital Edouard Herriot; 5 Place d’Arsonval; 69437 LYON Cedex 03, France
Current address: Research Center Juelich and Department of Zoology; University of Cologne; Biowissenschaftliches Zentrum, Zi. 1.104; Z ulpicher-Straße 47b; 50674 Koln, Germany
Processes 2016, 4(4), 38; https://doi.org/10.3390/pr4040038
Submission received: 1 August 2016 / Revised: 21 September 2016 / Accepted: 29 September 2016 / Published: 18 October 2016
(This article belongs to the Special Issue Biomedical Systems Control)

Abstract

:
The body responds to endotoxins by triggering the acute inflammatory response system to eliminate the threat posed by gram-negative bacteria (endotoxin) and restore health. However, an uncontrolled inflammatory response can lead to tissue damage, organ failure, and ultimately death; this is clinically known as sepsis. Mathematical models of acute inflammatory disease have the potential to guide treatment decisions in critically ill patients. In this work, an 8-state (8-D) differential equation model of the acute inflammatory response system to endotoxin challenge was developed. Endotoxin challenges at 3 and 12 mg/kg were administered to rats, and dynamic cytokine data for interleukin (IL)-6, tumor necrosis factor (TNF), and IL-10 were obtained and used to calibrate the model. Evaluation of competing model structures was performed by analyzing model predictions at 3, 6, and 12 mg/kg endotoxin challenges with respect to experimental data from rats. Subsequently, a model predictive control (MPC) algorithm was synthesized to control a hemoadsorption (HA) device, a blood purification treatment for acute inflammation. A particle filter (PF) algorithm was implemented to estimate the full state vector of the endotoxemic rat based on time series cytokine measurements. Treatment simulations show that: (i) the apparent primary mechanism of HA efficacy is white blood cell (WBC) capture, with cytokine capture a secondary benefit; and (ii) differential filtering of cytokines and WBC does not provide substantial improvement in treatment outcomes vs. existing HA devices.

1. Introduction

1.1. Inflammation

Inflammation is the body’s natural response to infection and trauma [1]. Macrophage cells play a key role in the initiation and orchestration of the inflammatory response. These immune cells reside in tissues where they monitor the environment for molecules derived from pathogen or damaged cells [2]. When such molecular patterns are detected, macrophages secrete pro-inflammatory mediators (such as tumor necrosis factor (TNF) and interleukin (IL)-1) and chemoattract other WBCs, thus initiating an immune response [3]. TNF and IL-1 induce endothelial cells to express adhesion molecules for neutrophils, a circulating white blood cell. Neutrophils migrate into the tissues, following chemokine gradients, where they scavenge and digest pathogen in a process called phagocytosis [4]. Pro-inflammatory cytokines also trigger an anti-inflammatory wave that suppresses inflammation and returns the system to baseline as the infection or damage is cleared [5]. IL-10 is a powerful anti-inflammatory cytokine that suppresses the expression of pro-inflammatory cytokines and the activity of innate immune effector cells [6]. Anti-inflammation is an essential regulator of the inflammatory response that thwarts potential deleterious cytotoxic effects of vigorous pro-inflammation. Although the goal of the inflammatory response is to contain and eliminate the initial biological stressor (e.g., infection) and thus restore a healthy state, it also has the potential to push the system into a number of pathological states. Case in point, high levels of anti-inflammatory IL-10 in combination with pro-inflammatory IL-6 have been associated with risk of death in septic patients [7].

1.2. Sepsis

Sepsis, a systemic inflammatory response triggered by infection, is one such pathology [8]. An estimated 751,000 incidents of severe sepsis occur annually in the United States with 51% of cases receiving treatment in the ICU and 28.6% mortality [9]. Severe sepsis may lead to the failure of multiple organ systems [10]. The cascade of organ failures may occur even while the infection is suppressed by antibiotics, demonstrating that uncontrolled inflammation is destructive to organ tissues.
The mainstay of sepsis treatment has been source control, antibiotic treatment, fluid resuscitation and organ support. Recent recommendations added very few additional options to this therapeutic approach [11,12]. Numerous attempts at controlling the ill effects of the inflammatory response in sepsis using immunomodulation, such as anti-inflammatory treatments (e.g., anti-TNF antibodies, low dose corticosteroids, etc.), have largely failed to improve patient outcome despite great pre-clinical promise. Hence, there is ongoing controversy as to the merit of immunomodulation in severe sepsis [12,13] and reticence to pursue development of interventions based on simple rationales. An opportunity exists for model-based intervention design in sepsis and other complex diseases where standard approaches have not delivered expected advances.

1.3. Mathematical Models of Inflammation

Our previous work focused on either low-order [14] phenomenological or high-complexity [15,16,17] models of the inflammatory response cascade. Other groups have also attacked the problem of modeling inflammatory processes [18,19,20,21,22,23,24,25]. More complex models increase biologic accuracy at the expense of full structural and parameter identifiability. The mapping of such complex models to data requires either significant amounts of data at a variety of scales or resolutions (some of which may not be experimentally measurable using current methods) or assumptions about the mathematical structure and relationships between parameters and/or variables. In contrast, low-order models may over-simplify the biology (e.g., “inflammation” vs. explicit cytokine equations), but formal mathematical analysis is facilitated by such structures. Our previously-developed low-order model [14] consisted of an inflammatory stimulus (pathogen) and early-and-late pro-inflammatory mediators which captured a variety of clinically relevant scenarios, including return to health, sterile death (pathogen free), and septic death (pathogen overload). We later extended the model by incorporating anti-inflammatory mediators, based on their value in restoring health and preventing sterile death [26]. Although these models provided insight into key drivers of inflammatory response outcome, they only qualitatively described inflammation response and were not calibrated to experimental data. Hence, the existing low-order models are not quantitatively predictive, nor would they be appropriate for use in treatment design where quantitative understanding of cytokine dynamics and how to modify such a response is needed.

1.4. Endotoxemia: A Model of Sepsis

Bacterial endotoxin is a key and highly conserved component of the cell wall of a large number of bacteria responsible for sepsis. The immune system promptly recognizes and responds to bacterial endotoxin initiating a vigorous, cytokine-mediated systemic inflammatory response that is highly reproducible and similar to the response observed in sepsis, including fever, low blood pressure, and accelerated respiratory and cardiac rates. In high doses, endotoxin may lead to organ dysfunction and death. Administration of endotoxin in laboratory animals serves as a laboratory model of sepsis and acute inflammation [27,28].

1.5. Hemoadsorption: A Potential Treatment for Sepsis

Hemoadsorption (HA) is a blood purification treatment that has been shown to improve short term survival in septic rat models, presumably through nonspecific removal of inflammatory mediators [29,30]). A portion of the septic animal’s blood is circulated through an ex vivo circuit including the HA device: a column packed with small adsorptive beads. Key inflammatory cytokines responsible for the propagation of the inflammatory response, including TNF, interleukin(IL)-6, and IL-10, are captured by the device [29]. A calibrated model of cytokine capture was presented by DiLeo et al. [31,32] There is preliminary evidence that existing HA devices directly interact with circulating WBCs, the distal effectors of systemic inflammation. Research is ongoing to characterize the specific nature of the interaction between the HA device and subpopulations of WBCs [33].

1.6. Model-Based Treatment

Models of acute inflammation have potential to guide treatment decisions. The endotoxemia model in Section 2.2 predicts WBC activation, cytokine levels and tissue damage following an endotoxin challenge. System response to external perturbations of model variables, including cytokines TNF, IL-6 and IL-10, is captured through the interactions modeled in Section 2.2. When the effect of treatment on a model variable can be quantified, the system response can be predicted. HA treatment, which captures cytokines and potentially WBCs, is an ideal candidate for such exploration since its effect on model variables can be quantified.
The effect of HA will be dependent on the underlying inflammatory state. Consequently, an ideal treatment strategy might adapt in response to changes in the subject’s health. Adaptive treatment requires two components: a method for choosing an appropriate treatment regimen based on the inflammatory state; and a method of identifying the inflammatory state based on noisy and sparse measurements. Control theoretic methods provide a solution to the first problem, while state estimation techniques address the second.

1.6.1. Model Predictive Control

Model predictive control (MPC) is a popular control methodology for addressing biomedical systems control problems [34,35], based on its ability to robustly manage subject-model mismatch in a variety of disease case studies. MPC uses the predictive capacity of a model to manipulate inputs and guide a dynamic process towards a target trajectory [36]. MPC is a receding finite horizon method, where the control decision is based only on the predicted trajectory over a finite time window (i.e., horizon). As time advances, the horizon slides and new control decisions are based on the latest system observations. In the case of acute illness, MPC of HA could maintain homeostasis and guide the patient to health based on observations of biomarkers and vital signs. MPC has been applied towards the modulation of acute inflammation in the context of a four equation model of pathogen infection [37].

1.6.2. State Estimation: Mapping Diagnostics into Model Representations

In clinical application, state estimation corresponds to the process of translating patient diagnostic measurements into state information using a model-based description that is suitable for predicting outcomes and selecting treatments. It is impractical or even impossible to measure every variable represented in the endotoxemia model. Measuring serum cytokines in blood samples is straightforward, although sampling frequency and noise limit resolution. In contrast, there is no direct way to measure abstract states such as tissue damage (D) and long acting anti-inflammatory meditators ( C A ). Consequently, a method of estimating the model state based on partial and noisy observations is necessary. Rawlings and Bakshi describe a variety of methods for nonlinear state estimation in the context of MPC [38].
The Particle filter (PF) is a stochastic state estimation method described as “survival of the fittest” [39], which can also be used in parameter estimation. A number of parallel simulations (“particles”) are randomly initialized from a prior distribution of states. Following an observation, simulations are weighted by the posterior probability that the observation was generated by the particle. The particles are then resampled (with replacement) from the weighted distribution, and the resampled particle simulations are evolved dynamically to the next observation time point. The expected state values are calculated as the weighted average of the particle states. PF is appealing due to its generality and ease of implementation, though computational effort may be prohibitive in complex models. Nonlinear models with non-Gaussian noise distributions, such as the endotoxemia model, are notable candidates for PF application.

1.7. Manuscript Overview

In this work, we synthesize an intermediate-order model of acute inflammatory response to endotoxin challenge and calibrate the model parameters to data from rat studies. Major pro-inflammatory cytokines, like IL-6 and TNF, as well as anti-inflammatory cytokines, like IL-10 and C A (a biologically-motivated lumped surrogate representing slow acting anti-inflammatory mediators, such as the Transforming Growth Factor-β1 (TGF-β1) cytokine and cortisol) were incorporated in the model. Similar to [26], a non-measurable tissue damage marker was also included in the model to quantify the tissue damage caused due to the endotoxin challenge and activated phagocytic cells (N). The modeling objective of this work was to ground the intermediate inflammatory response model in experimental data, thereby providing a model that captures the dynamic blood concentrations of the major pro- and anti-inflammatory cytokines resulting from introduction of an endotoxin challenge ( P ( t ) ) in rats. Using the model explicitly, a model-based treatment design system is constructed using the MPC framework. A PF is used to estimate the current state, for use in tailoring hemofiltration treatment to inflammatory response. The closed-loop system is evaluated in silico for its ability to control cytokine levels after pro-inflammatory endotoxin challenge.

2. Materials and Methods

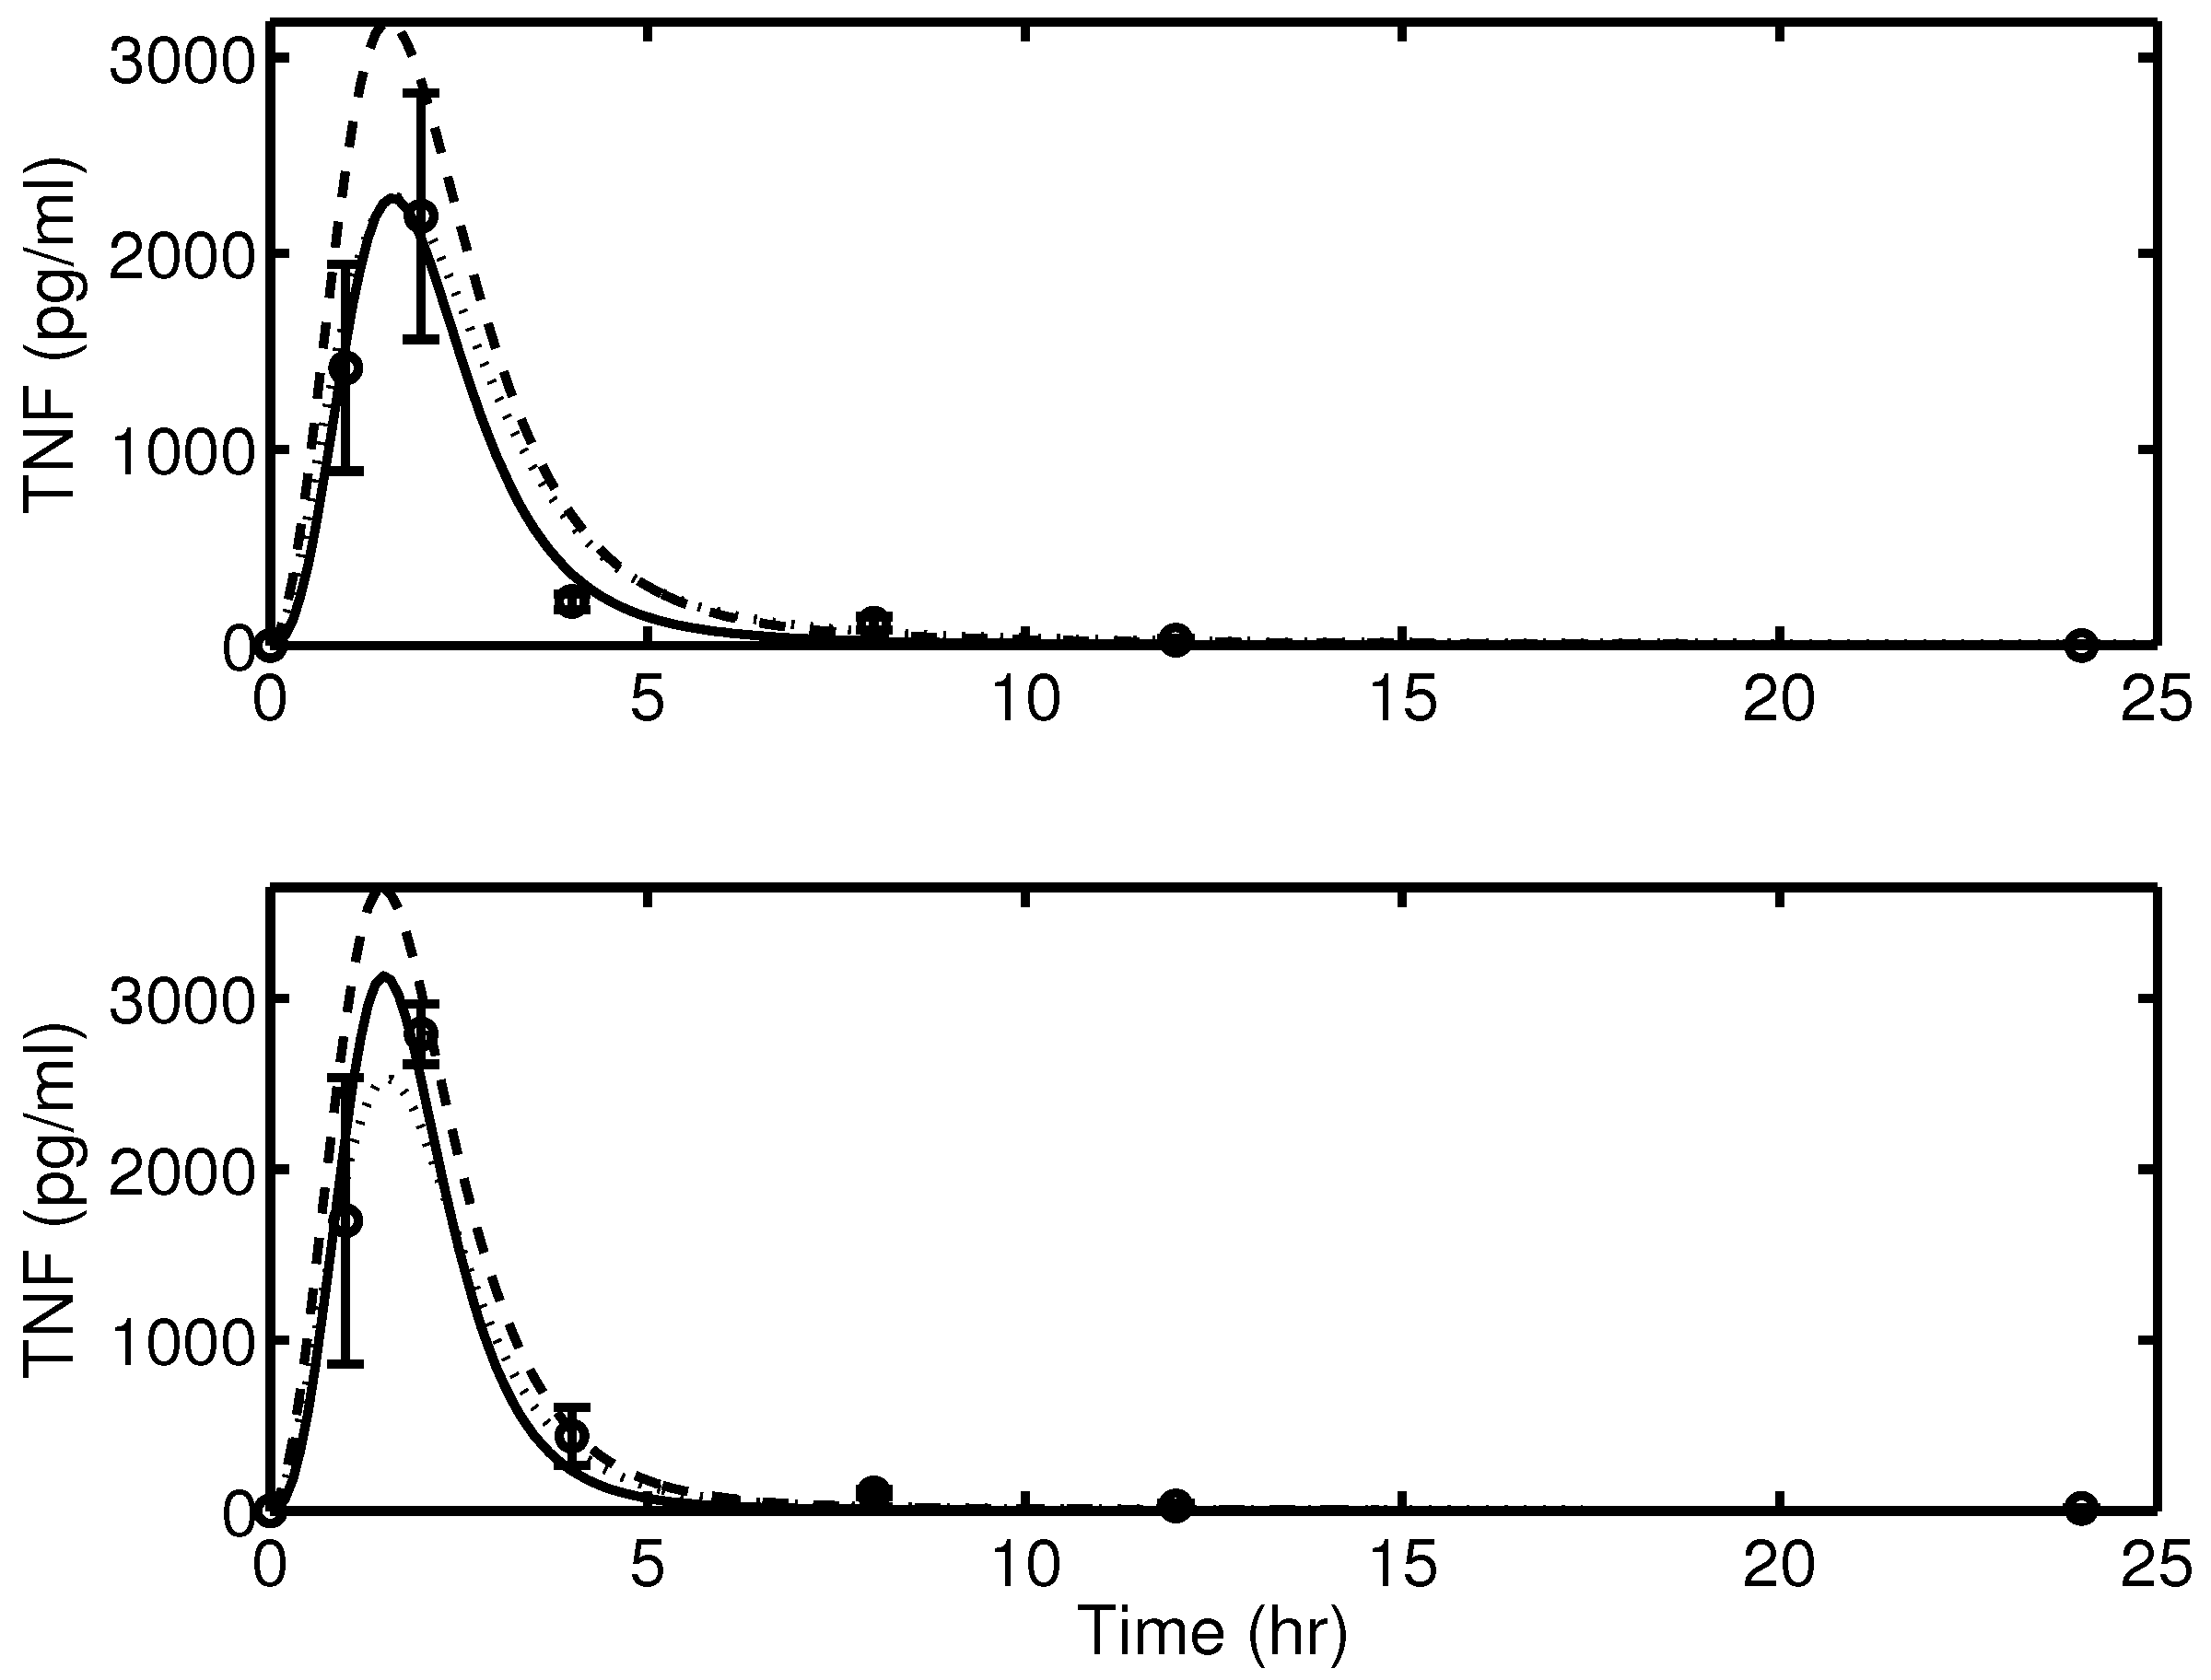
2.1. Experimental Data

Experiments on three cohorts of Sprague-Dawley rats were performed, in accordance with an IACUC-approved protocol at the University of Pittsburgh, to study the acute inflammatory response to endotoxin insults at various dose levels. Rats weighed approximately 200 g, and rats received endotoxin (Escherichia Coli) at dose levels of either 3, 6, or 12 mg/kg, intraperitoneally. Blood samples were collected when rats were sacrificed at 0, 1, 2, 4, 8, 12, and 24 h after endotoxin administration (4 rats sacrificed per time point per endotoxin dose level). Concentrations of IL-6, IL-10, and TNF were measured in triplicate using commercially available ELISA kits (R & D Systems, Minneapolis, MN, USA).

2.2. Mathematical Model of Acute Inflammation

The starting point for the present model comes from [26], a 4-state phenomenological description of the inflammatory response process.
d P ( t ) d t = k p g P ( t ) 1 - P ( t ) p - k p m s m P ( t ) μ m + k m p P ( t ) - k p n f ( N * ( t ) ) P ( t )
d N * ( t ) d t = s m R μ n r + R - μ n N * ( t )
d D ( t ) d t = k d n f s ( f ( N * ( t ) ) ) - μ d D ( t )
d C A ( t ) d t = s c + k c n f ( N * ( t ) + k c n d D ( t ) ) 1 + f ( N * ( t ) + k c n d D ( t ) ) - μ c C A ( t )
Here
R = f ( k n n N * ( t ) + k n p P ( t ) + k n d D ( t ) ) f ( V ) = V 1 + C A ( t ) c 2 f s ( V ) = V 6 x d n 6 + V 6
Pathogen, P, induces inflammatory response leading to activated phagocytic cells, N * . This cell activation leads to pathogen death and also tissue damage, D. Moderation of the inflammatory response is provided by anti-inflammatory mediators, represented by C A . This abstract model of the inflammatory response to pathogen provides multiple steady states and the ability to achieve clinically-relevant states of recovery (low P and D at long time), septic sepsis (high P and D at long time), and aseptic sepsis (high N * and D, but P = 0 , at long time).
The acute inflammation model developed herein consists of eight ordinary differential equations (ODEs). The dependent variables used in the model include: endotoxin concentration ( P ( t ) ); total number of activated phagocytic cells ( N ( t ) ), which includes all the activated immune response cells (such as neutrophils, monocytes, etc.); a non-accessible tissue damage marker ( D ( t ) ); concentrations of pro-inflammatory cytokines IL-6 ( [ I L 6 ] ) and TNF ( [ T N F ] ); concentration of the anti-inflammatory cytokine IL-10 ( [ I L 10 ] ); a tissue damage driven non-accessible IL-10 promoter ( Y I L 10 (t)); and a non-accessible state representing slow acting anti-inflammatory mediators ( C A (t)).
A schematic diagram of the model capturing all the major interactions between the eight states is shown in Figure 1. Introduction of P into the system activates N. Once activated, N up-regulates production/release of all the inflammatory mediators (TNF, IL-6, IL-10, and C A ) [40]. The pro-inflammatory cytokines have a positive feedback on the system; thereby, they further activate N, and up-regulate other cytokines [40,41]. On the other hand, the anti-inflammatory cytokine and mediators have a negative feedback on the system. Hence, IL-10 and C A inhibit the activation of N and up-regulation of other cytokines [42,43]. Mathematically, C A also serves to provide overall stability to the model (i.e., a low standing level of C A , serves to return inflammation to its baseline value after small perturbations). The model also incorporates tissue damage due to activated phagocytic cells, represented by a damage marker, D; this corresponds biologically to neutrophil-induced damage to lung tissue after a systemic inflammatory response. Tissue damage further up-regulates activation of N [44] and also contributes to up-regulation of IL-10 [45,46].
The endotoxin insult is injected intraperitoneally in the rats as a bolus administration, which initiates the inflammatory cascade. The ODE describing the dynamics of P ( t ) can be written as:
d P ( t ) d t = - d P P ( t )
P ( t ) decays exponentially with a rate equal to d P . The decay rate was fixed at 3 h - 1 , which is consistent with the values obtained from published literature [47,48,49]. The initial conditions (t = 0) for Equation (5) are either 3, 6, or 12 mg/kg depending on the endotoxin dose level.
Resting phagocytic cells are activated by the presence of endotoxin in the system. The equations representing activation of N ( t ) can be mathematically written as:
d N ( t ) d t = k N R ( t ) x N + R ( t ) - d N N ( t )
R ( t ) = k N P P ( t ) + k N D D ( t ) ( 1 + k N T N F f U P N T N F ( t ) ) ( 1 + k N I L 6 f U P N I L 6 ( t ) ) f D N N C A ( t ) f D N N I L 10 ( t )
f U P N T N F ( t ) = [ T N F ] x N T N F + [ T N F ]
f U P N I L 6 ( t ) = [ I L 6 ] x N I L 6 + [ I L 6 ]
f D N N C A ( t ) = x N C A x N C A + C A ( t )
f D N N I L 10 ( t ) = x N I L 10 x N I L 10 + [ I L 10 ]
Here, Equation (6) represents the total number of activated phagocytic cells ( N ( t ) ). Parameters k N and d N represent the rate of activation and elimination of N ( t ) , respectively. Activation of N ( t ) is driven by P ( t ) and D ( t ) , through R ( t ) , as shown in Equation (7). Throughout this work, functions with nomenclature f U P i j ( t ) and f D N i j ( t ) represent up-regulating ( U P ) and down-regulating ( D N ) effects of inflammatory mediator j on mediator i. These up- or down-regulating functions are dimensionless and bounded, having values between 0 and 1. Functions, f U P N T N F ( t ) and f U P N I L 6 ( t ) indicate the up-regulating effects of [ T N F ] and [ I L 6 ] on N ( t ) , respectively. Both these functions are Michaelis-Menten type equations, as shown in Equations (8) and (9). As the concentrations increase, the values of the up-regulating functions also increase, approaching 1 asymptotically. Gain parameters k N T N F and k N I L 6 scale the up-regulating functions f U P N T N F ( t ) and f U P N I L 6 ( t ) to capture the appropriate effects on N ( t ) , respectively. The inhibitory effects of C A ( t ) and [ I L 10 ] ( t ) are captured by the down-regulating functions f D N N C A ( t ) and f D N N I L 10 ( t ) , respectively. Here, as the variables increase, the values of the functions decrease, approaching 0 asymptotically (see Equations (10) and (11)). Parameters x N , x N T N F , x N I L 6 , x N C A , and x N I L 10 are the half-saturation constants determining the concentration level of the variables at which the corresponding up-regulating or down-regulating function will reach half of its saturation point. The initial condition (t = 0) for Equation (6) is N ( 0 ) = 0.
The tissue damage caused by the inflammatory response to endotoxin challenge is modeled as follows:
d D ( t ) d t = k D N ( t ) 6 x D 6 + N ( t ) 6 - d D D ( t )
Parameters k D and d D represent the rate of generation and the rate of elimination of the unobserved tissue damage marker, D ( t ) . Elevated D ( t ) further contributes to the activation of N ( t ) (7) [44] and production of IL-10 [45,46]. Parameter x D is the half-saturation constant. A 6th-order Hill function was utilized in order to accurately capture the data. Further explanation regarding the choice of the Hill function coefficient is provided in the Appendix A. The initial condition (t = 0) for Equation (12) is D ( 0 ) = 0.
The anti-inflammatory mediator, C A ( t ) , represents a combination of various inflammation inhibitory mediators, including the cytokine Transforming Growth Factor-β1 (TGF-β1) and cortisol. The C A ( t ) equation is written as:
d C A ( t ) d t = k C A N ( t ) - d C A C A ( t ) + s C A
Parameters k C A and d C A represent the rate of C A ( t ) production/secretion and clearance, respectively. At basal conditions, the system is assumed to be slightly anti-inflammatory. This was achieved by introducing a constant, s C A , into Equation (13). Hence, at t = 0 and N ( 0 ) = 0, C A ( 0 ) = s C A d C A .
The dynamics of IL-6, which is predominantly considered a pro-inflammatory mediator, can be mathematically written as:
d [ I L 6 ] ( t ) d t = k I L 6 ( N ( t ) ) 4 x I L 6 4 + ( N ( t ) ) 4 1 + k I L 6 T N F f U P I L 6 T N F ( t ) + k I L 6 I L 6 f U P I L 6 I L 6 ( t ) f D N I L 6 I L 10 ( t ) - d I L 6 [ I L 6 ] ( t )
f U P I L 6 T N F ( t ) = ( [ T N F ] ( t ) ) 4 x I L 6 T N F 4 + ( [ T N F ] ( t ) ) 4
f U P I L 6 I L 6 ( t ) = [ I L 6 ] ( t ) x I L 6 I L 6 + [ I L 6 ] ( t )
f D N I L 6 I L 10 ( t ) = x I L 6 I L 10 x I L 6 I L 10 + [ I L 10 ] ( t )
The up-regulation of IL-6 production is governed by activated N ( t ) . Production of IL-6 is further up-regulated by the presence of elevated [ T N F ] ( t ) and [ I L 6 ] ( t ) itself, and this is captured by the up-regulating functions f U P I L 6 T N F and f U P I L 6 I L 6 ( t ) , respectively. The inhibitory effects of the anti-inflammatory cytokines were captured by the down-regulating function f D N I L 6 I L 10 ( t ) . The clearance rate of IL-6 is represented by the parameter d I L 6 ( t ) . Once again, Section A further explains the selection of the Hill function coefficient. Parameters x I L 6 , x I L 6 T N F , x I L 6 I L 6 , and x I L 6 I L 10 are the half-saturation constants. The initial condition (t = 0) for Equation (15) is [ I L 6 ] ( 0 ) = 0.
Pro-inflammatory TNF concentration can be represented by the following equations:
d [ T N F ] ( t ) d t = k T N F ( N ( t ) ) 1 . 5 f D N T N F C A ( t ) f D N T N F I L 6 ( t ) - d T N F [ T N F ] ( t )
f D N T N F C A ( t ) = x T N F C A 6 x T N F C A 6 + ( C A ( t ) ) 6
f D N T N F I L 6 ( t ) = x T N F I L 6 x T N F I L 6 + [ I L 6 ] ( t )
The rate of production of TNF due to activation of N ( t ) is governed by the parameter k T N F , and the rate of clearance of TNF is represented by the parameter d T N F . A power of 1.5 was assigned to N ( t ) instead of a Michaelis-Menten or Hill type expression in order to capture the rapid production and elimination of TNF. Further justification for the proposed [ T N F ] -state (Equation (18)) is provided in Appendix A. The function f U P T N F T N F ( t ) represents the up-regulating effect of [ T N F ] ( t ) on its own production. The functions f D N T N F C A ( t ) and f D N T N F I L 6 ( t ) represent the inhibitory effect of anti-inflammatory cytokine C A ( t ) and pro-inflammatory cytokine IL-6 (which in some instances, such as this, acts as an anti-inflammatory mediator [50]), respectively. Parameters x T N F T N F , x T N F C A , and x T N F I L 6 are the half-saturation constants. A 6th-order Hill function for f D N T N F C A ( t ) modeled the rapid suppression of C A on the [ T N F ] ( t ) dynamics. The initial condition (t = 0) for Equation (18) is T N F ( 0 ) = 0.
The dynamics of [ I L 10 ] ( t ) , which is a strong anti-inflammatory cytokine, can be represented by the following equations:
d [ I L 10 ] d t = k I L 10 ( N ( t ) ) 3 x I L 10 3 + ( N ( t ) ) 3 1 + k I L 10 I L 6 f U P I L 10 I L 6 ( t ) - d I L 10 f D N I L 10 I L 10 ( t ) [ I L 10 ] ( t ) + Y I L 10 ( t ) + s I L 10
d Y I L 10 ( t ) d t = k I L 10 Y ( D ( t ) ) 4 x I L 10 Y 4 + ( D ( t ) ) 4 - d I L 10 Y Y I L 10 ( t )
f U P I L 10 I L 6 ( t ) = ( [ I L 6 ] ( t ) ) 4 x I L 10 I L 6 4 + ( [ I L 6 ] ( t ) ) 4
f D N I L 10 I L 10 ( t ) = x I L 10 I L 10 x I L 10 I L 10 + [ I L 10 ] ( t )
Here, Equation (22) captures the circulating [ I L 10 ] ( t ) levels. Unlike the other measured cytokines, the [ I L 10 ] ( t ) dynamics demonstrate two distinct peaks separated by approximately 4 to 6 h when perturbed by endotoxin challenge. The first surge of IL-10 production is predominantly attributed to N ( t ) , which is captured by a 3rd-order Hill equation multiplied by the parameter k I L 10 (first RHS term of Equation (22)). Production of IL-10 is further up-regulated by the presence of elevated pro-inflammatory cytokines like IL-6, which is represented by the up-regulation function f U P I L 10 I L 6 ( t ) . The production of IL-10 in the basal state is represented by the constant s I L 10 (as observed in experimental data). Hence, at t = 0 and N ( 0 ) = 0, [ I L 10 ] ( 0 ) = s I L 10 · x I L 10 I L 10 ( d I L 10 x I L 10 I L 10 - s I L 10 ) . It has been shown that the rate of elimination of IL-10 is inversely proportional to circulating [ I L 10 ] ( t ) [51]. This phenomenon is captured by a down-regulating function, f D N I L 10 I L 10 ( t ) , coupled with the parameter d I L 10 , as shown in Equation (22). Further discussion of the Equation (22) structure is presented in Appendix A.
The second surge in IL-10 production is attributed to tissue damage D ( t ) [45,46], and the dynamics of this D-induced effect are captured by the variable Y I L 10 ( t ) in Equation (22). The dynamics of Y I L 10 ( t ) are represented by the ODE (22); here the rate of production of Y I L 10 ( t ) is represented by the parameter k I L 10 Y coupled with a 4th-order Hill equation (first term in RHS of Equation (22)), which is driven by D ( t ) . Once again, this is data-motivated (see the further discussion in Appendix A). The rate of elimination of Y I L 10 ( t ) is given by parameter d I L 10 Y . Parameters x I L 10 , x I L 10 Y , x I L 10 I L 6 , and x I L 10 I L 10 are the half-saturation constants.
The model developed above is a simplification of our earlier model [27,52] that eliminates nonlinear up- and down-regulatory functions that did not display significant dynamics over the endotoxin challenge range employed here. The parameter values used here are those published in Table 1 of [27]. Alternative modeling options for the various interactions are discussed in Appendix A.

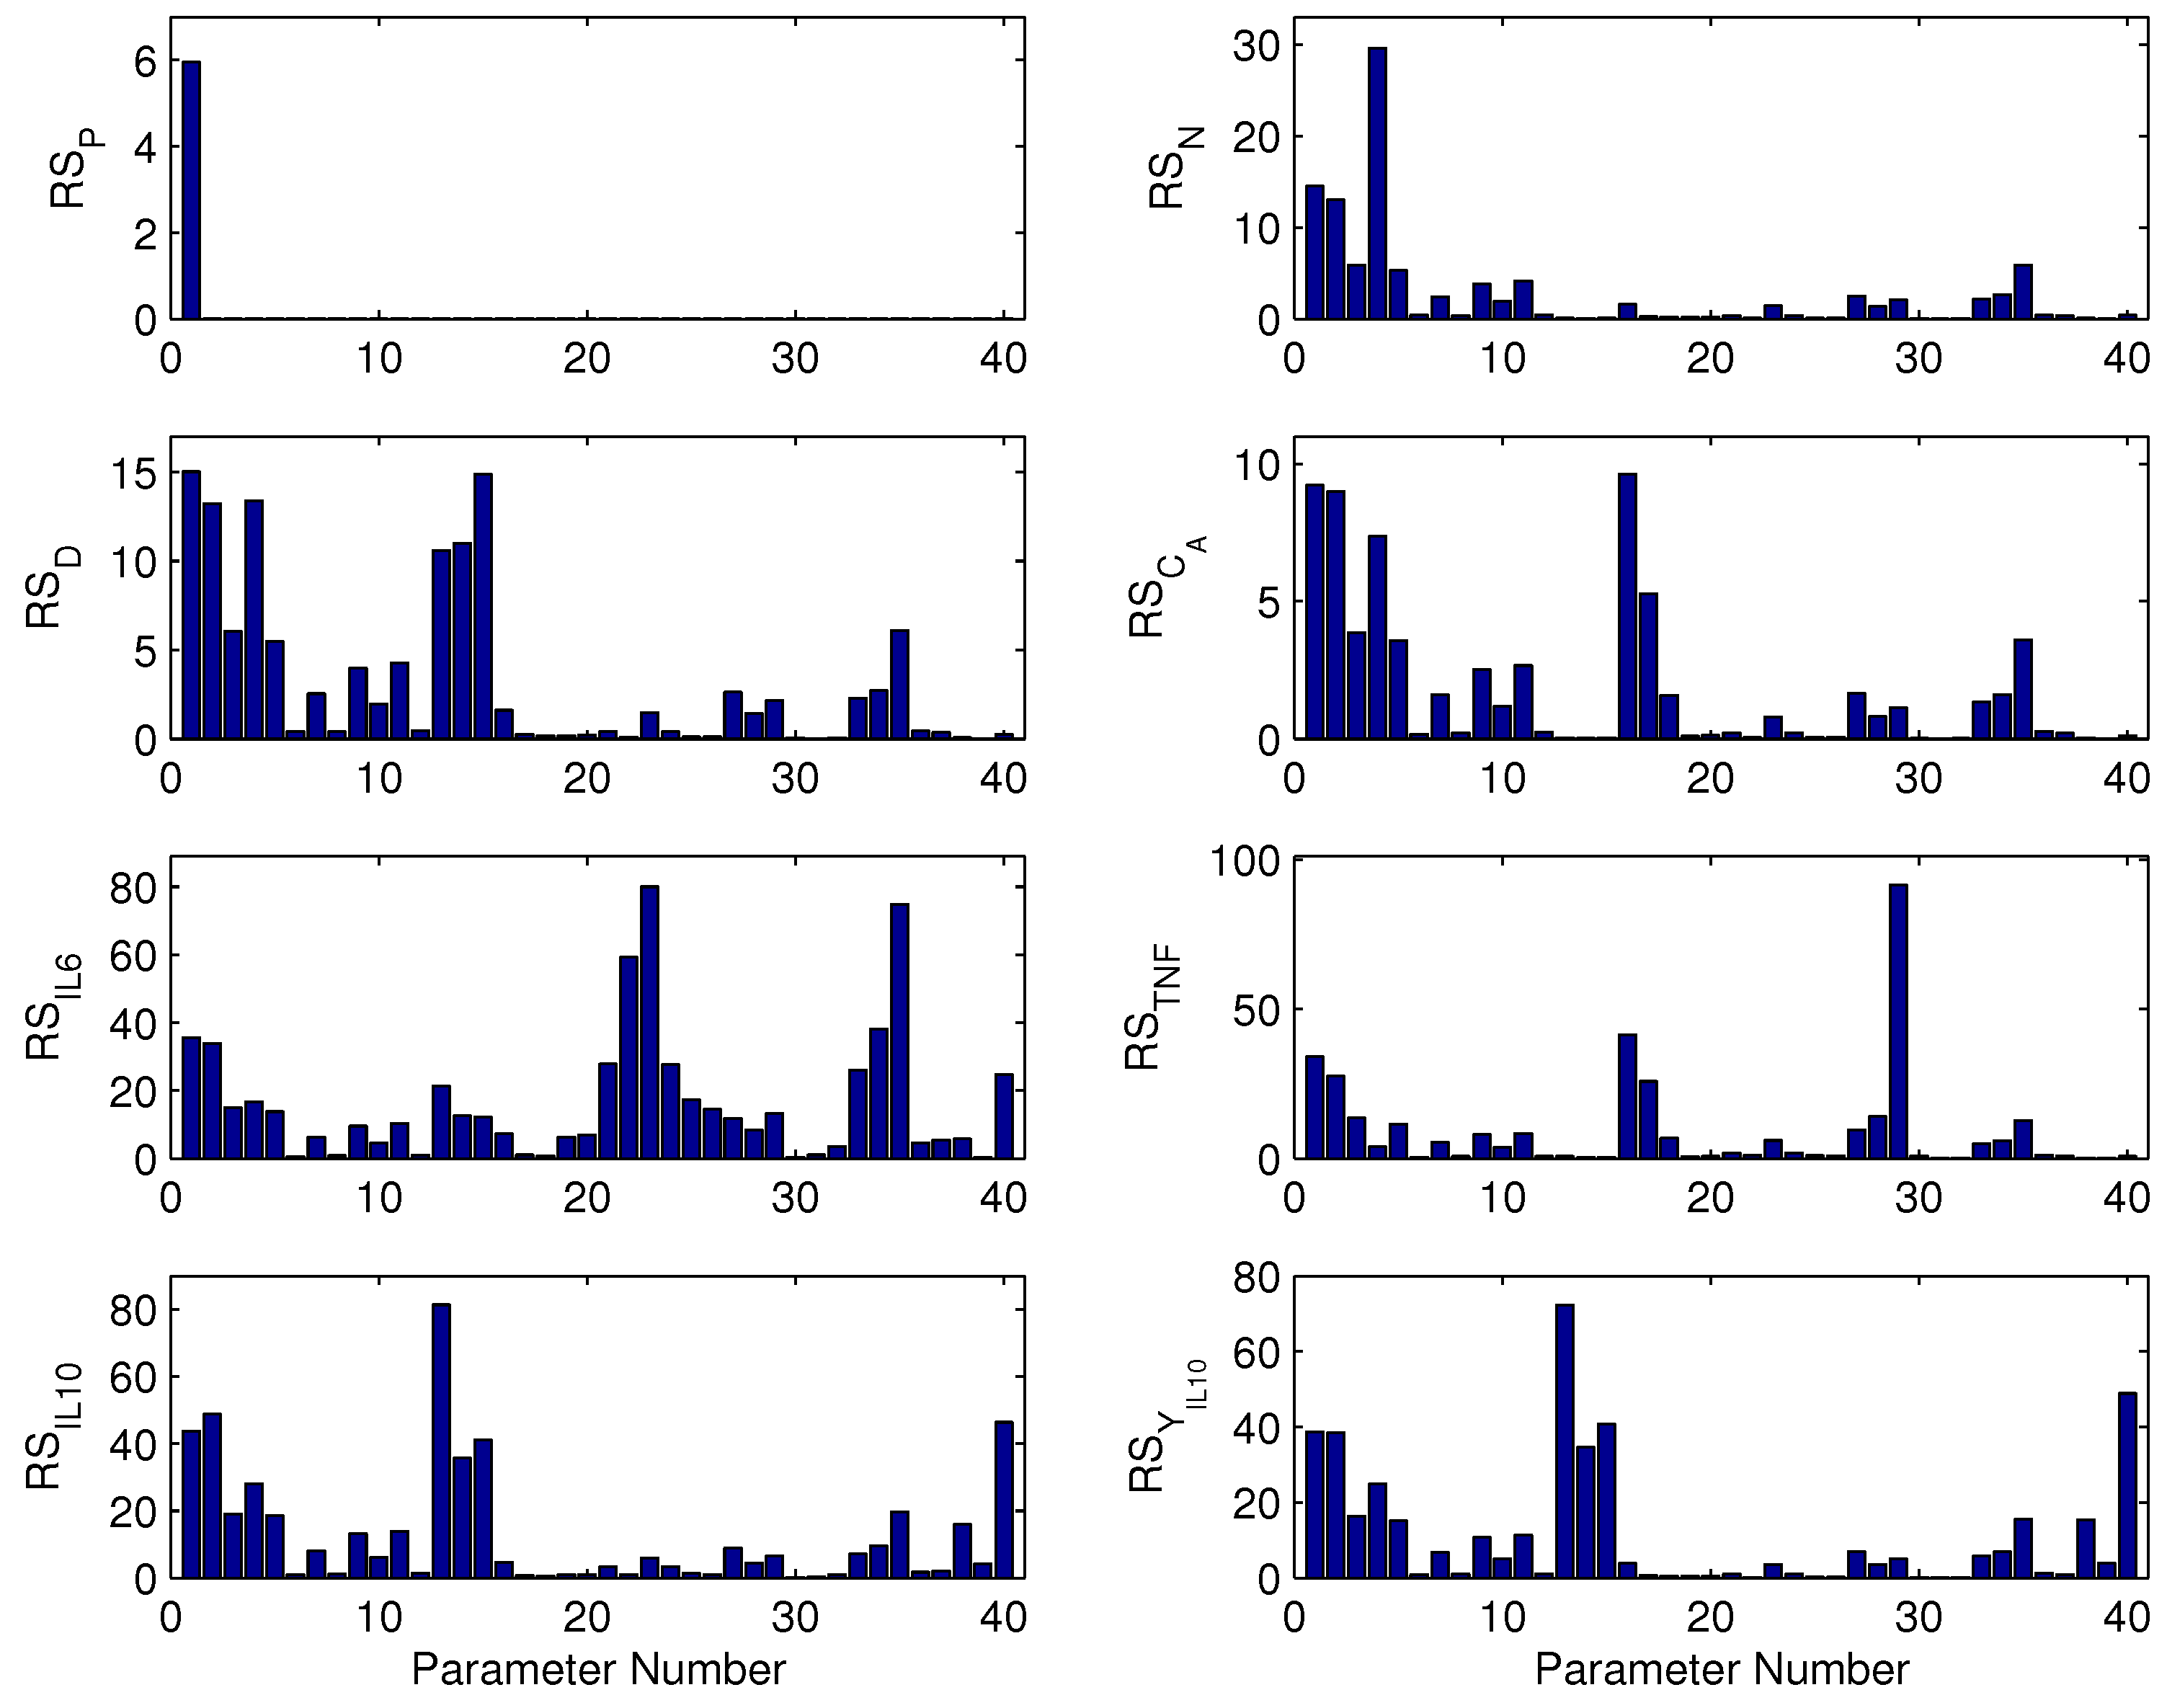
2.3. Parametric Sensitivity by Finite Difference Method

The model parameters in Equations (5)–(24) will vary in their effect on state and output dynamics as a function of operating state and time. Sensitivity analysis, as calculated by finite difference [53,54], is employed to identify the model parameters that have significant impact on model predictions. Though local, this knowledge can be used to inform the design of future experiments for elucidating model dynamics and parameter values. A drawback of finite difference-based sensitivity analysis is that the information is not global, but the constrained nature of the parameter region (e.g., parameter estimates will not change sign) makes global analysis highly conservative and beyond the scope of the present study.
The inflammation model can be expressed as a set of Q x differential equations with Q x states (x) and M parameters (θ). The Q x by M parameter sensitivity matrix can be calculated by using the finite difference approximation method, in which the sensitivity coefficients ( s i , j ) are calculated from the difference of nominal and perturbed solutions [53,54], as follows:
s i , j ( t ) = x i ( t ) θ j = x i ( θ j + Δ θ j , t ) - x i ( θ j , t ) Δ θ j
Here, i ∈ [1, Q x ], j∈ [1, M]. To facilitate direct comparison of responses across different parameters, normalized sensitivity coefficients ( s ¯ i , j ( t ) ) are calculated [53]:
s ¯ i , j ( t ) = x i ( t ) θ j θ j x i
For the evaluation of dynamic sensitivity, an L 2 -norm operation is performed to calculate the relative sensitivity ( R S ) aggregated over time. R S can be mathematically expressed as:
R S i , j = 1 Q T k = 1 Q T | s ¯ i , j ( t k ) | 2
Here, t k ( k [ 1 , Q T ] ) are the times when a sample was collected, and Q T is the number of sample points observed for a given entity (e.g., [ I L 6 ] ( t ) , [ T N F ] ( t ) , etc.).

2.4. In Silico Treatment

Rat endotoxemia was simulated using the calibrated model equilibrated with zero endotoxin, and then stimulated with P = 3–12 mg/kg endotoxin at t = 0 . A hemoadsorption device model (Section 2.7) was coupled to the endotoxemia model to simulate blood purification treatment via the capture of cytokines and cells from the blood. Figure 2A illustrates the coupling mechanism between the endotoxemia model and the HA device. The flow rate of blood through the device was the manipulated variable in subsequent control simulations.

2.5. Stochastic Endotoxemia Model

A stochastic variant of the endotoxemia model was constructed by supplementing the deterministic model with a geometric noise process. The stochastic equation for each state x i was:
d x i ( t ) = f i ( x ( t ) ) d t + σ x i ( t ) d W t
where x is the state vector, W t is a Wiener process, and f i ( x ( t ) ) is the deterministic derivative function. Process noise was applied independently to each state variable. The stochastic model was integrated using the Euler-Maruyama method:
x i ( t + Δ t ) = τ = t t + Δ t f i ( x ( τ ) ) d τ + x i ( t ) N ( 0 , σ 2 Δ t ) .
All stochastic simulations were performed with σ = 0 . 05 / h and Δ t = 0 . 1 h. The deterministic component was integrated for control simulation purposes using the SUNDIALS CVODE library [55].

2.6. Observation Model

Observations of cytokines IL-6, TNF and IL-10 were generated from the distribution Y i x i log - N μ i x i , σ i . Under the assumption that cytokine state x i = E [ Y i ( x i ) ] , we obtain:
μ i ( x i ) = log ( E [ Y i ( x i ) ] ) - σ i 2 / 2 = log ( x i ) - σ i 2 / 2 .
Due to the limited number of samples obtained from experiments, σ i is assumed to be independent of state value. For each cytokine i, σ i was computed as the time and dose averaged standard deviation of log-measurements. The resulting noise parameters were σ I L 6 = 0 . 26 , σ T N F = 0 . 20 , and σ I L 10 = 0 . 22 .

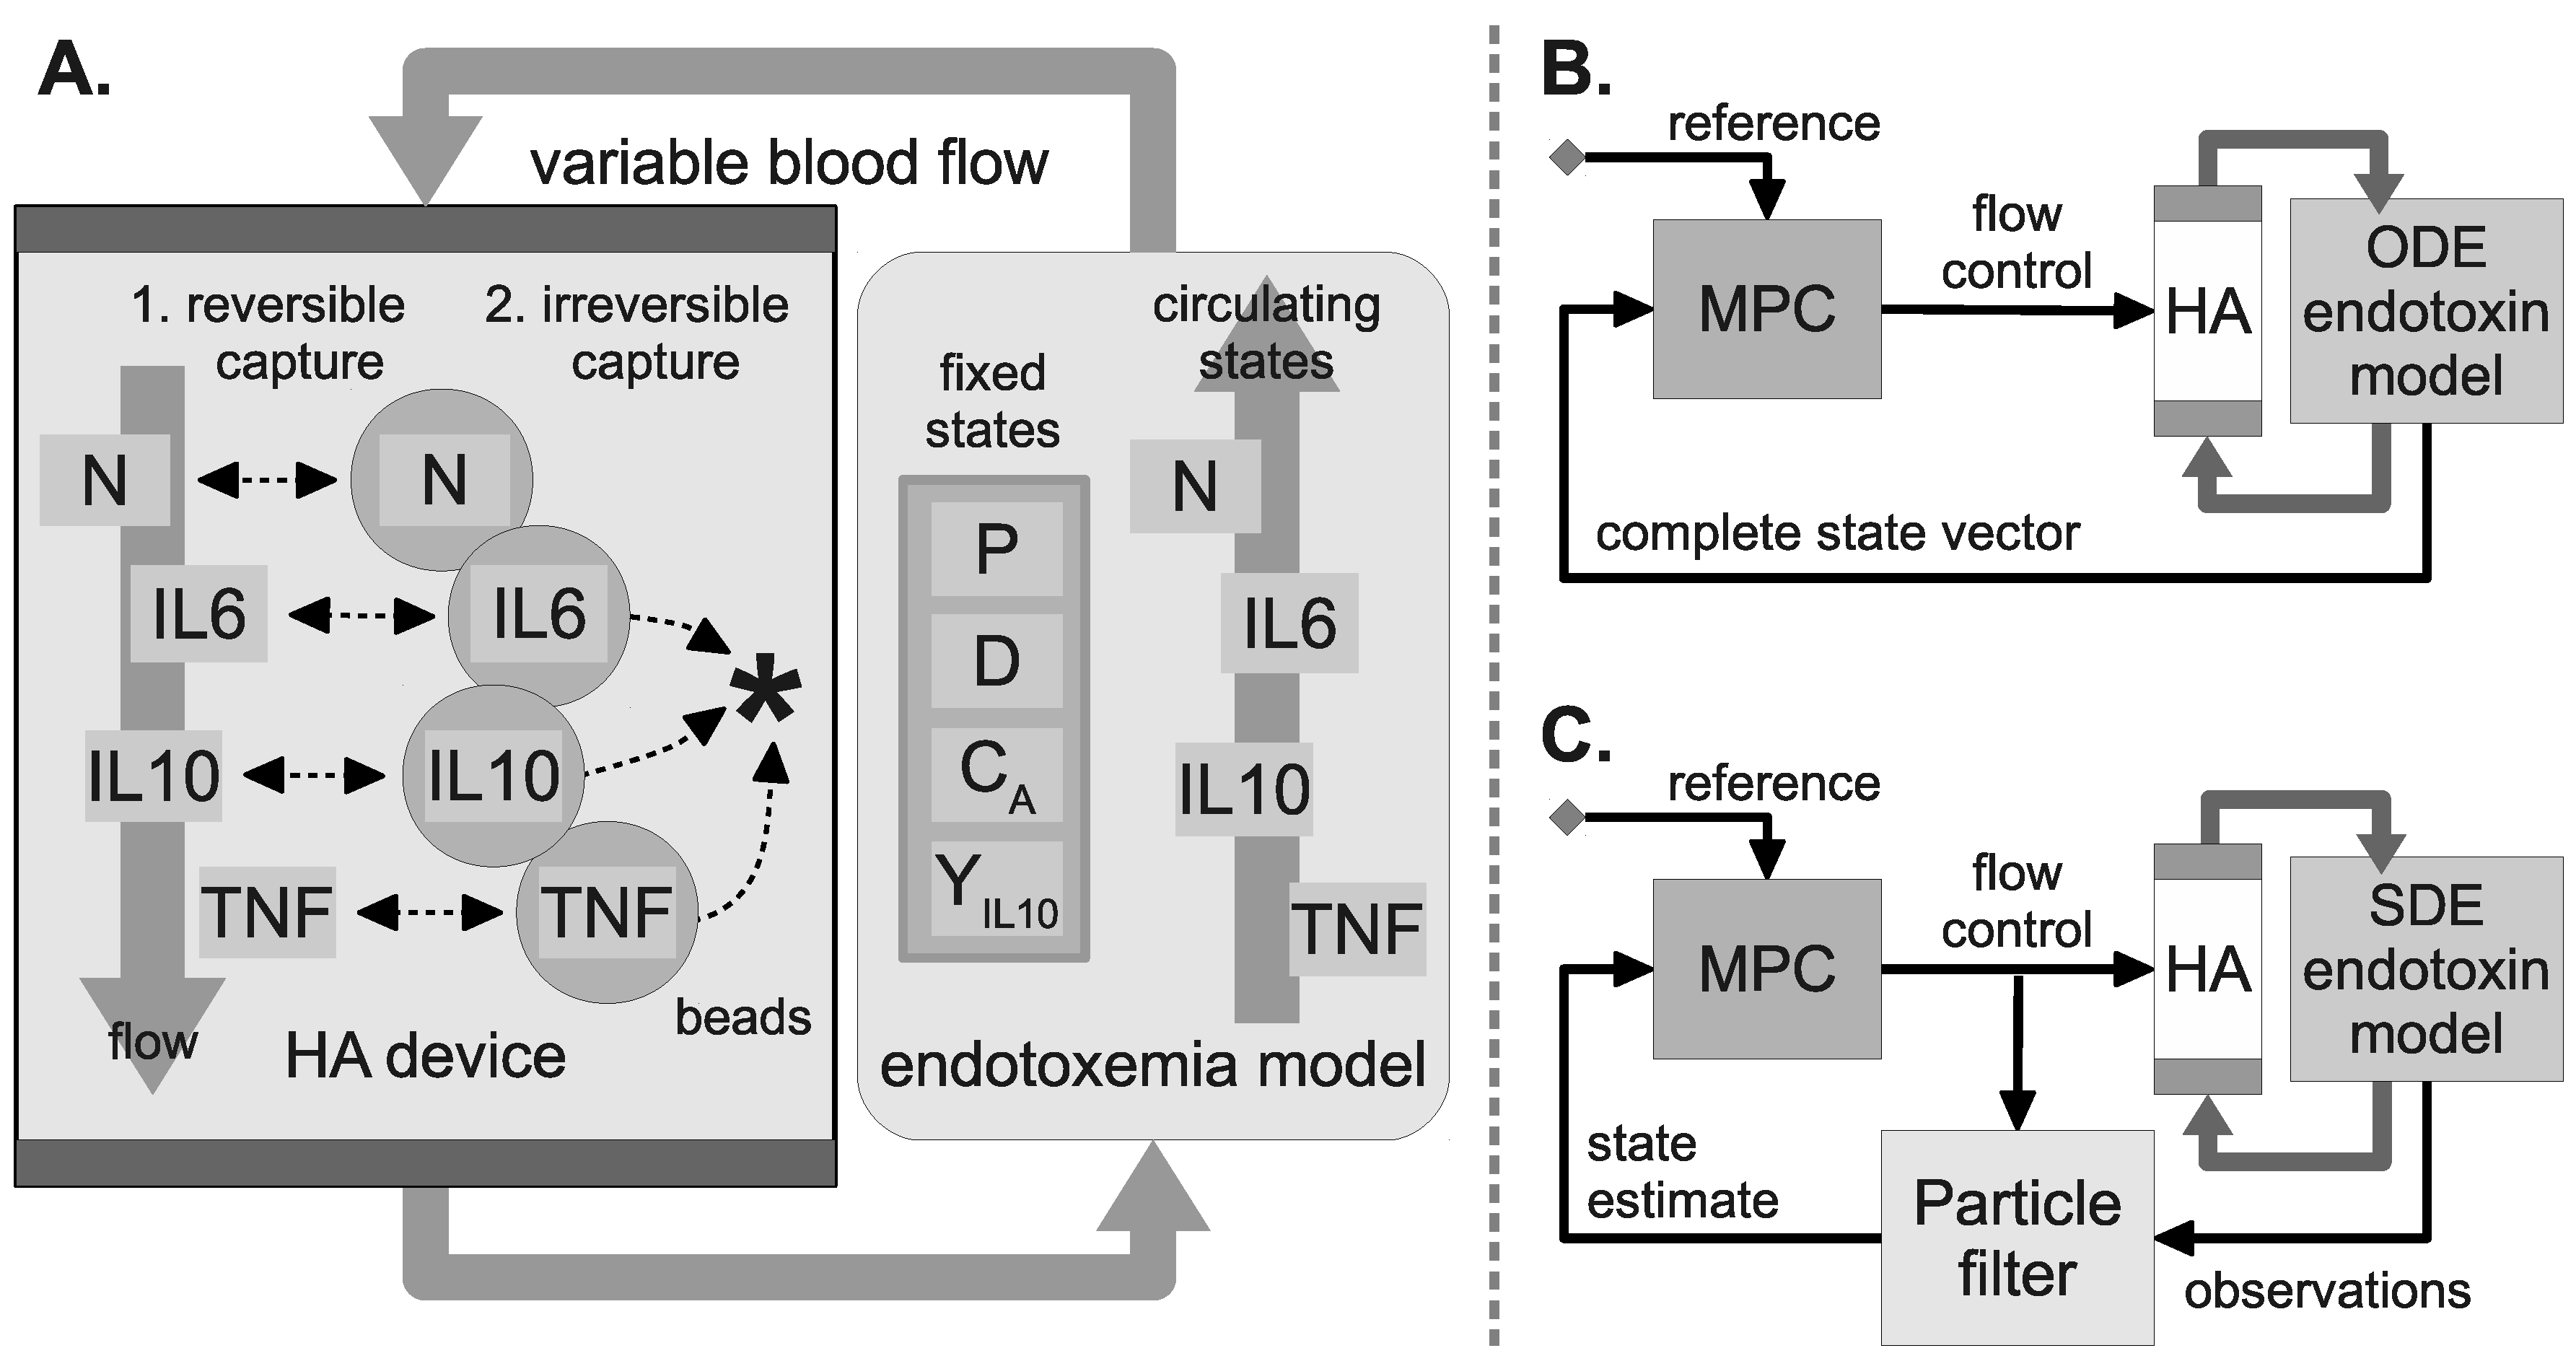
2.7. Hemoadsorption Model

The HA device, a schematic of which is shown in Figure 2, is modeled using a spatial discretization (n = 20) approximation of the partial differential equation to yield a set of ordinary differential equations. Discretization for each cytokine was modeled using the following equations:
d C i ( t ) d t = F d V d C i - 1 ( t ) - C i ( t ) - k a d C i ( t ) + V s V d k d e s S i ( t )
d S i ( t ) d t = V d V s k a d C i ( t ) - ( k d e s + k b n d ) S i ( t )
The fluid volume of a discretization is given by V d , and the fluid flow through the HA device is given by F d . The first right-hand side term of Equation (28) models convection through the device, with entering concentration C i - 1 ( t ) and exiting concentration C i ( t ) , assuming the liquid in a given discretization is well mixed. The last two terms capture cytokine adsorption to, and desorption from, the bead bed surface. Adsorption and desorption here represent reversible capture at/near the bead surface, with surface concentration S i defined by Equation (29). The last constant in Equation (29), k b n d , represents irreversible uptake of cytokine into the bead pores . In order to keep the k’s in rate units (1/min), the volume to surface area correction V s V d = 73 . 3 cm - 1 was used. The experimental data was generated using a device flow rate of F d = 0.8 cm 3 /min.
Parameter identification was performed using the system dynamic model in Equations (28) and (29). The inlet to the first liquid discretization came from the cytokine bath (a continuously-stirred tank), and the liquid outlet of the 20th discretization was returned to the bath; additional experimental details can be found in [56]. The initial concentration of cytokines in each HA device discretization was 0 pg/mL. Least-squares optimization was used to fit the parameters k a d , k d e s , and k b n d independently for each cytokine. Parameter values can be found in Table 1. For validation, a low flow rate ( F d = 0.08 cm 3 /min) simulation was executed with no change in adsorption parameters, and the output was compared to data for IL-6 [32] (figure not shown). The simulated bath concentration was within the spread of the experimental data at all time points.

2.8. WBC Capture Model

Fifteen mL of heparin treated blood, obtained from septic or healthy donors, was circulated through a 1.5 mL HA or sham device. WBC counts were obtained at the start of the experiment and following 4 h of circulation through the device at 0.75 mL/min via a closed miniaturized extracorporeal circuit. At 4 h, WBC counts in septic blood fell to 27% of baseline with the HA device versus 71% with the sham device (N = 21). Similarly, WBC counts in healthy blood fell to 34% versus 82% of baseline with HA and sham device, respectively (N = 5). Experimental details and additional results are published [57,58].
A simple model of HA cell capture was calibrated to WBC differentials measured in septic blood. We utilized the form of the cytokine capture model, but assumed that cell binding was reversible (i.e., k b n d = 0 ). WBC counts in the sham circuit were used to calibrate a first-order WBC decay constant that was applied to both sham and HA circuits. Parameters k a d and k d e s were calibrated to WBC differentials in the HA circuit under a least squares criterion. Since only one differential was measured for HA, many parameter pairs satisfied the best-fit criterion. Preferring an underestimate of the cell capture rate, we chose k a d to be slightly larger than the minimum possible value.

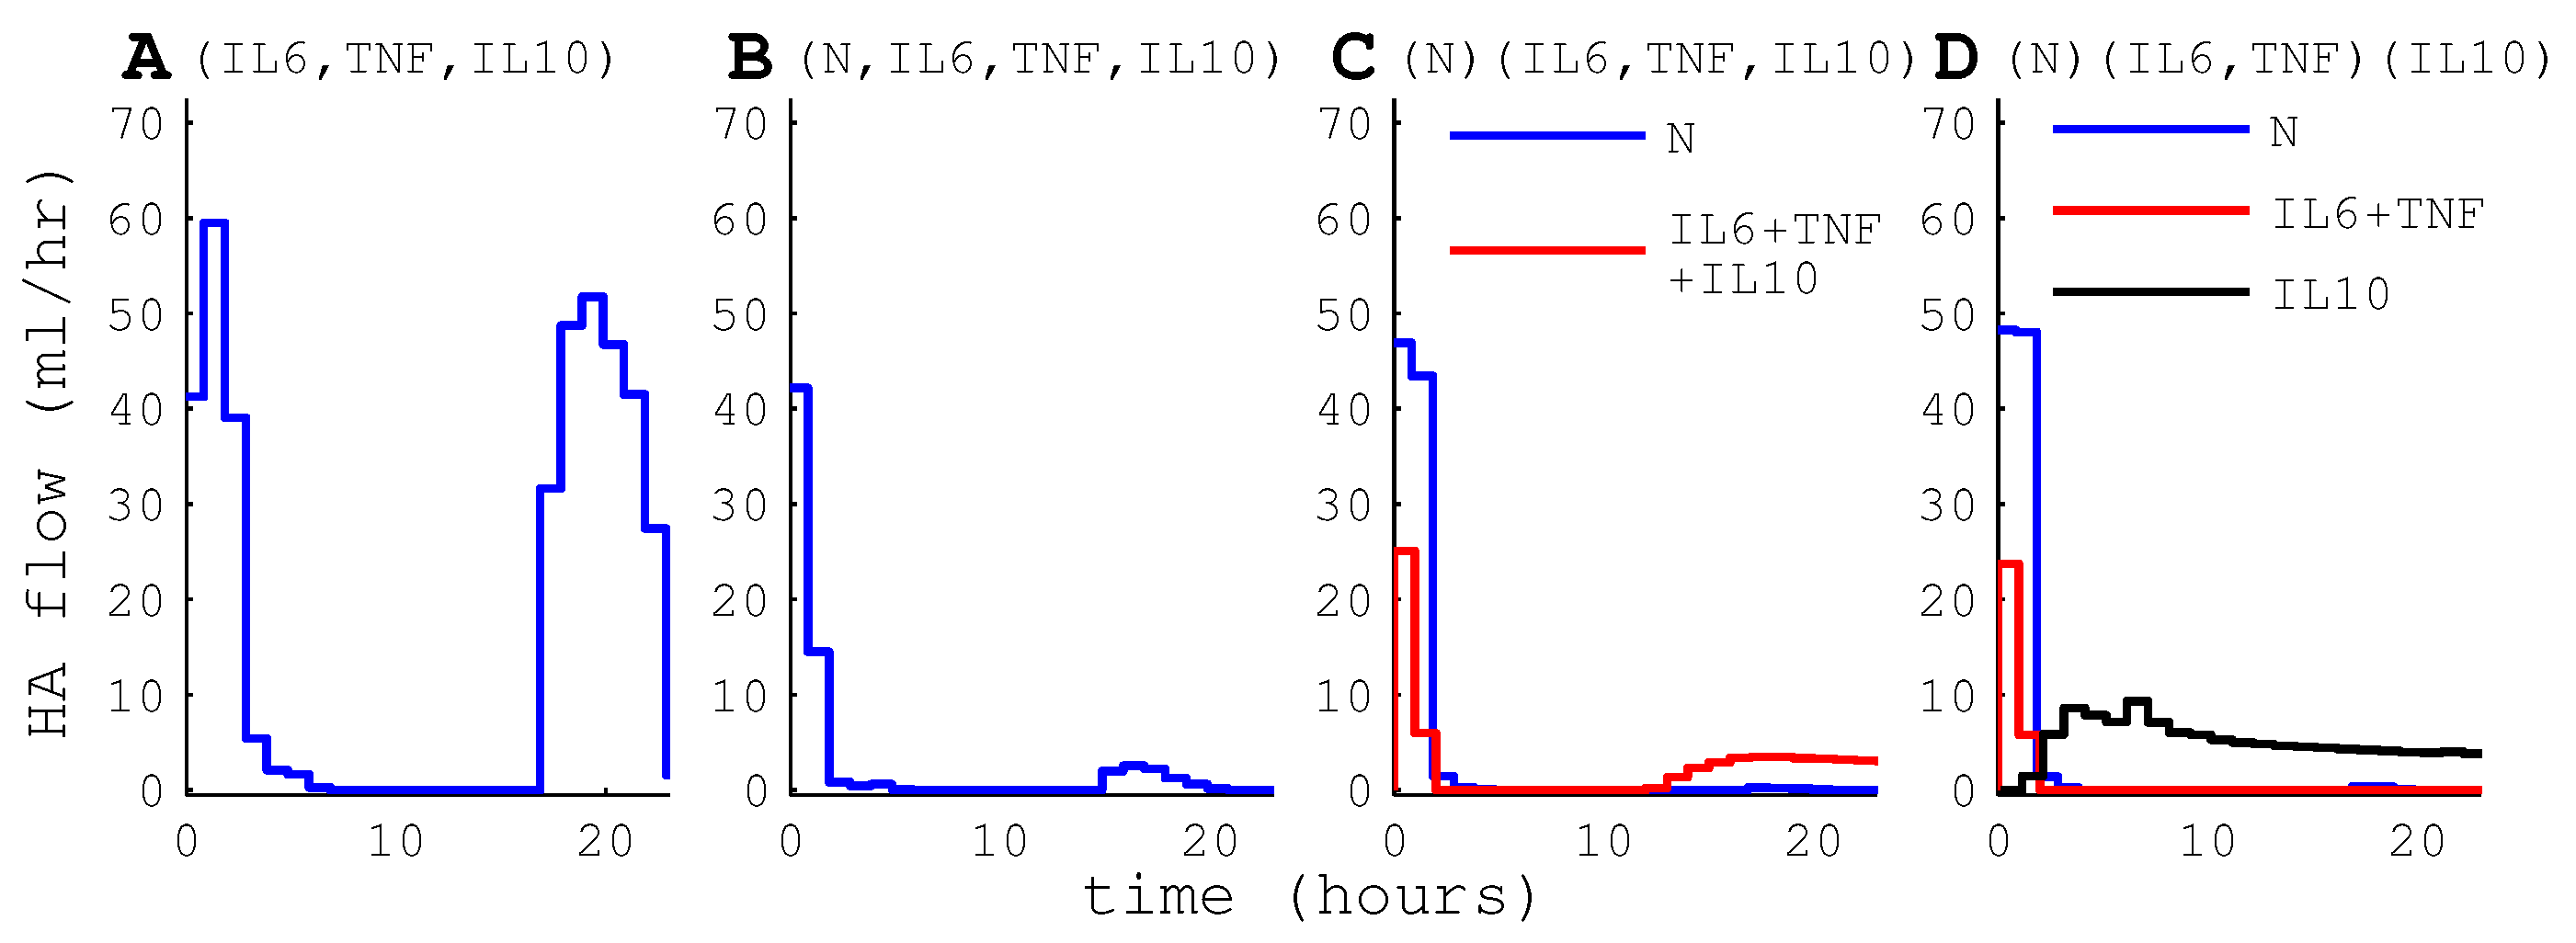
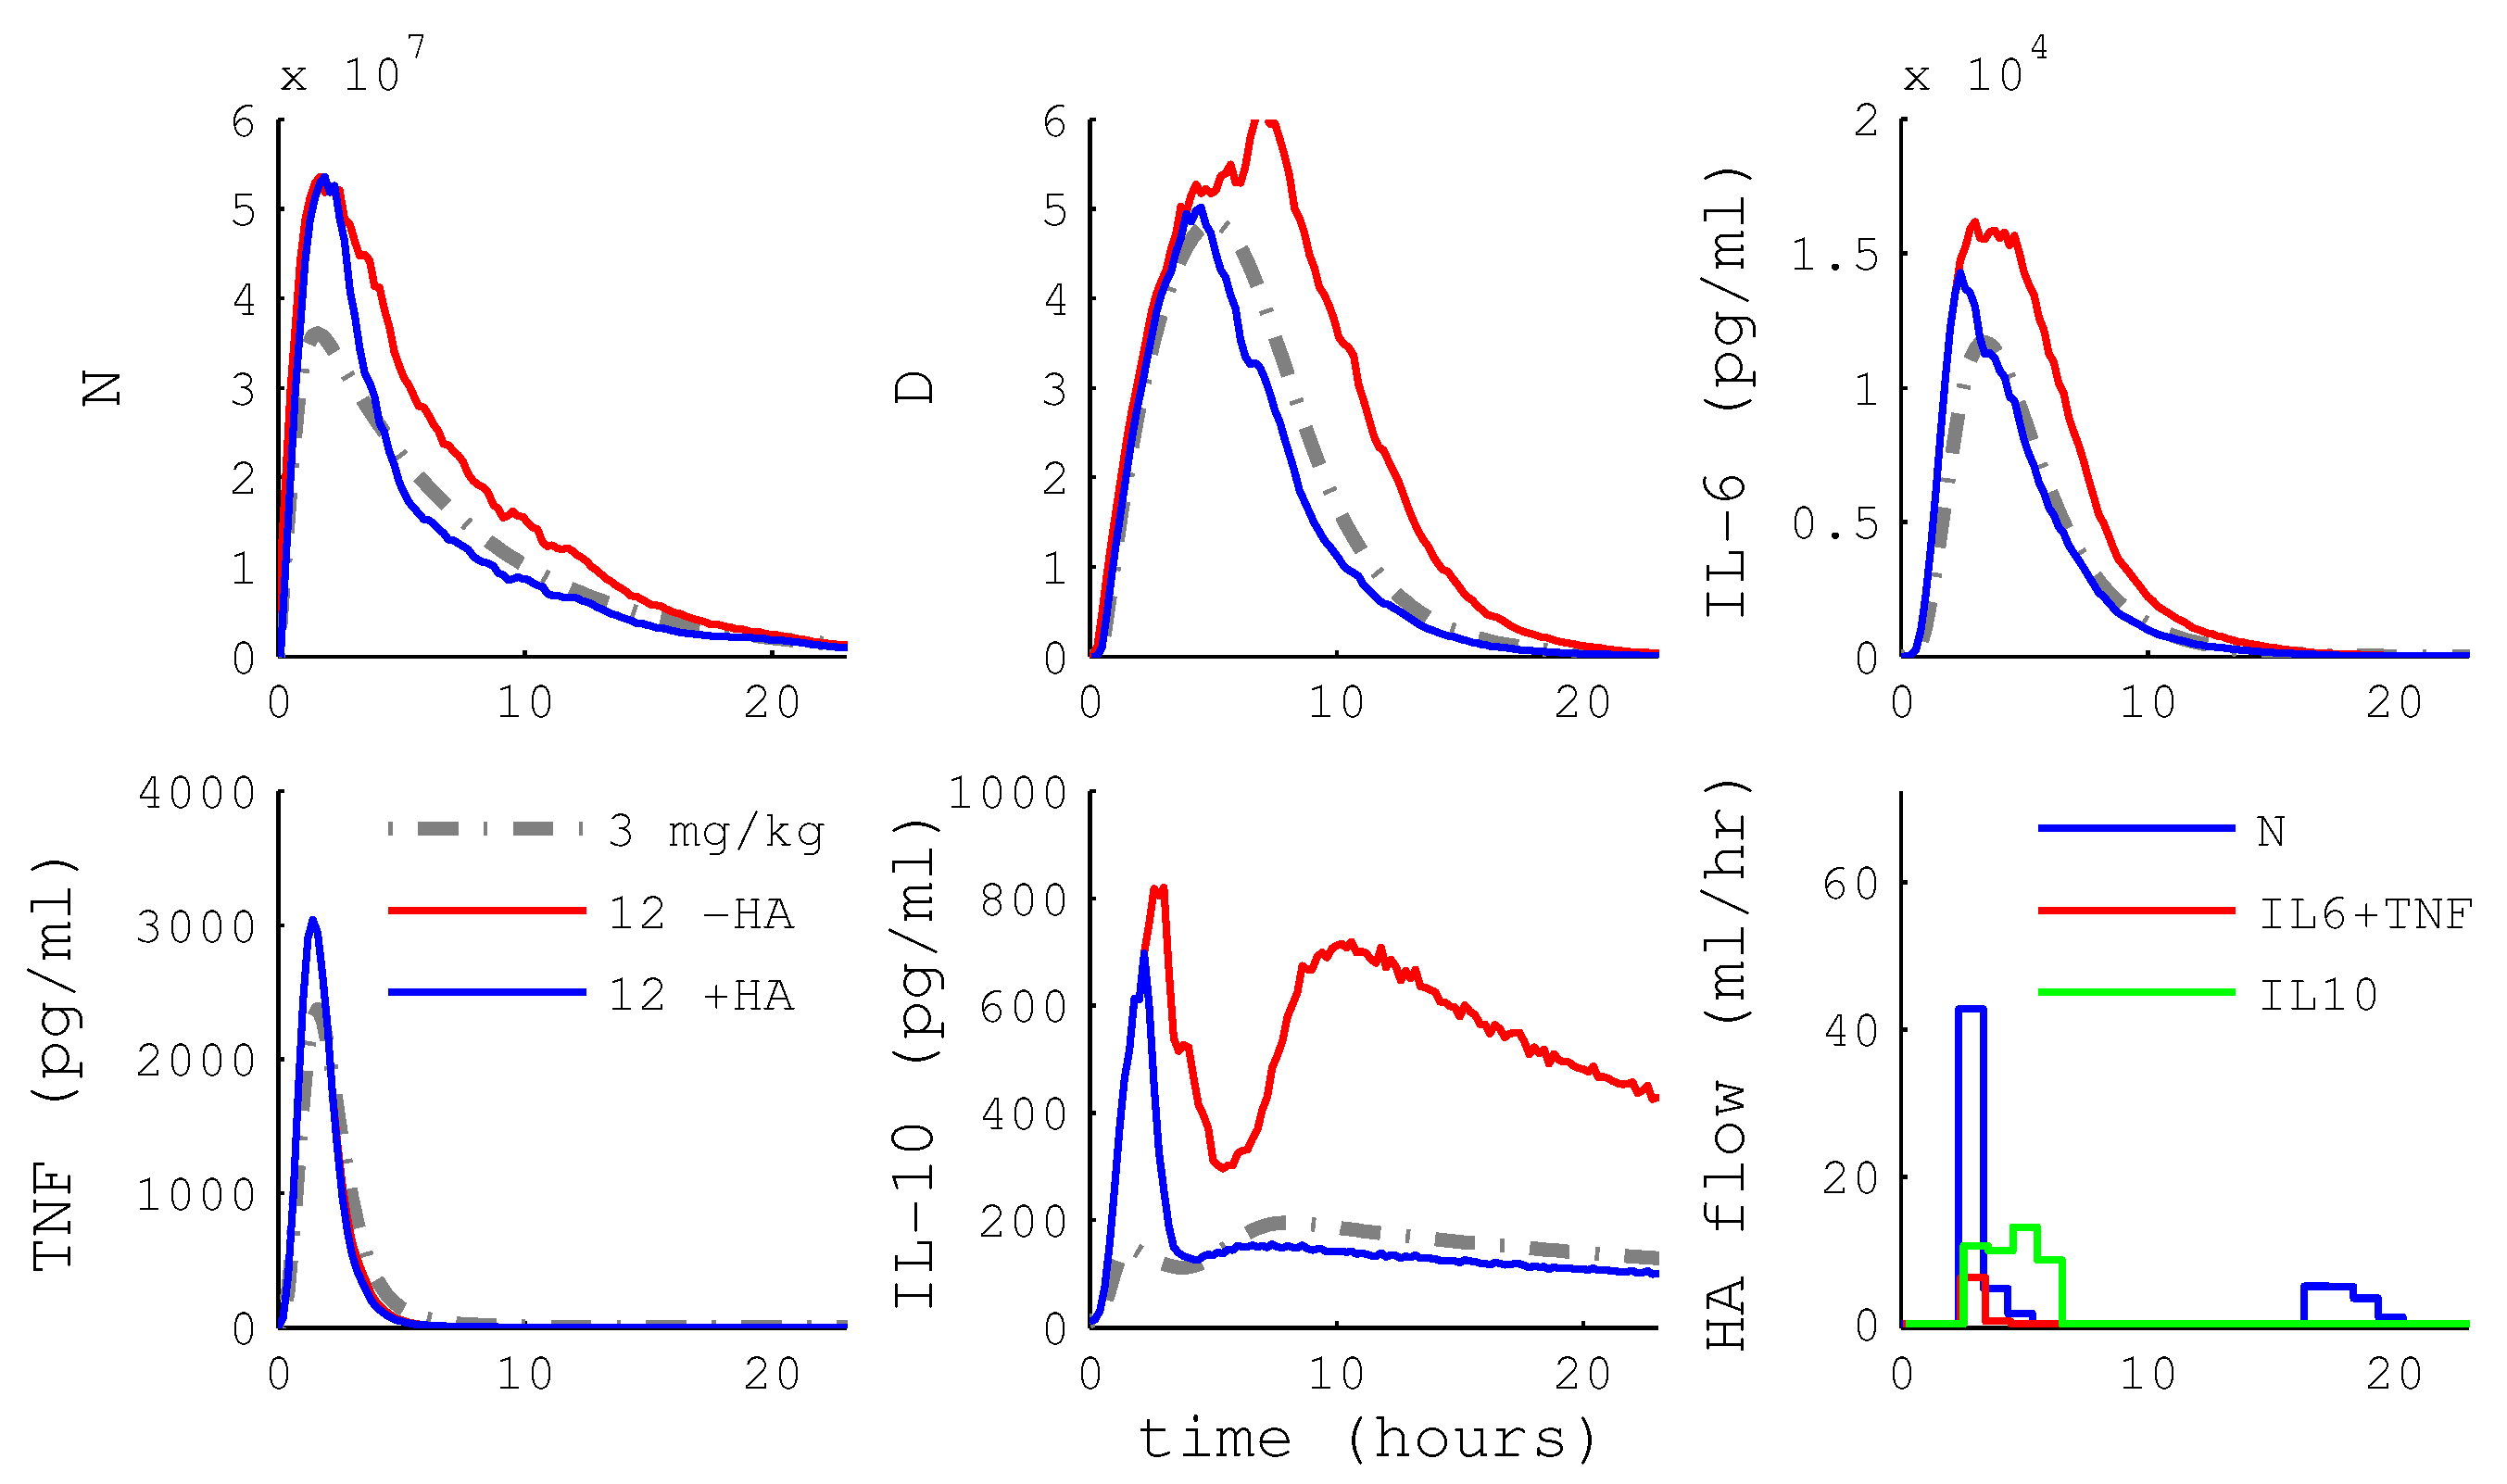
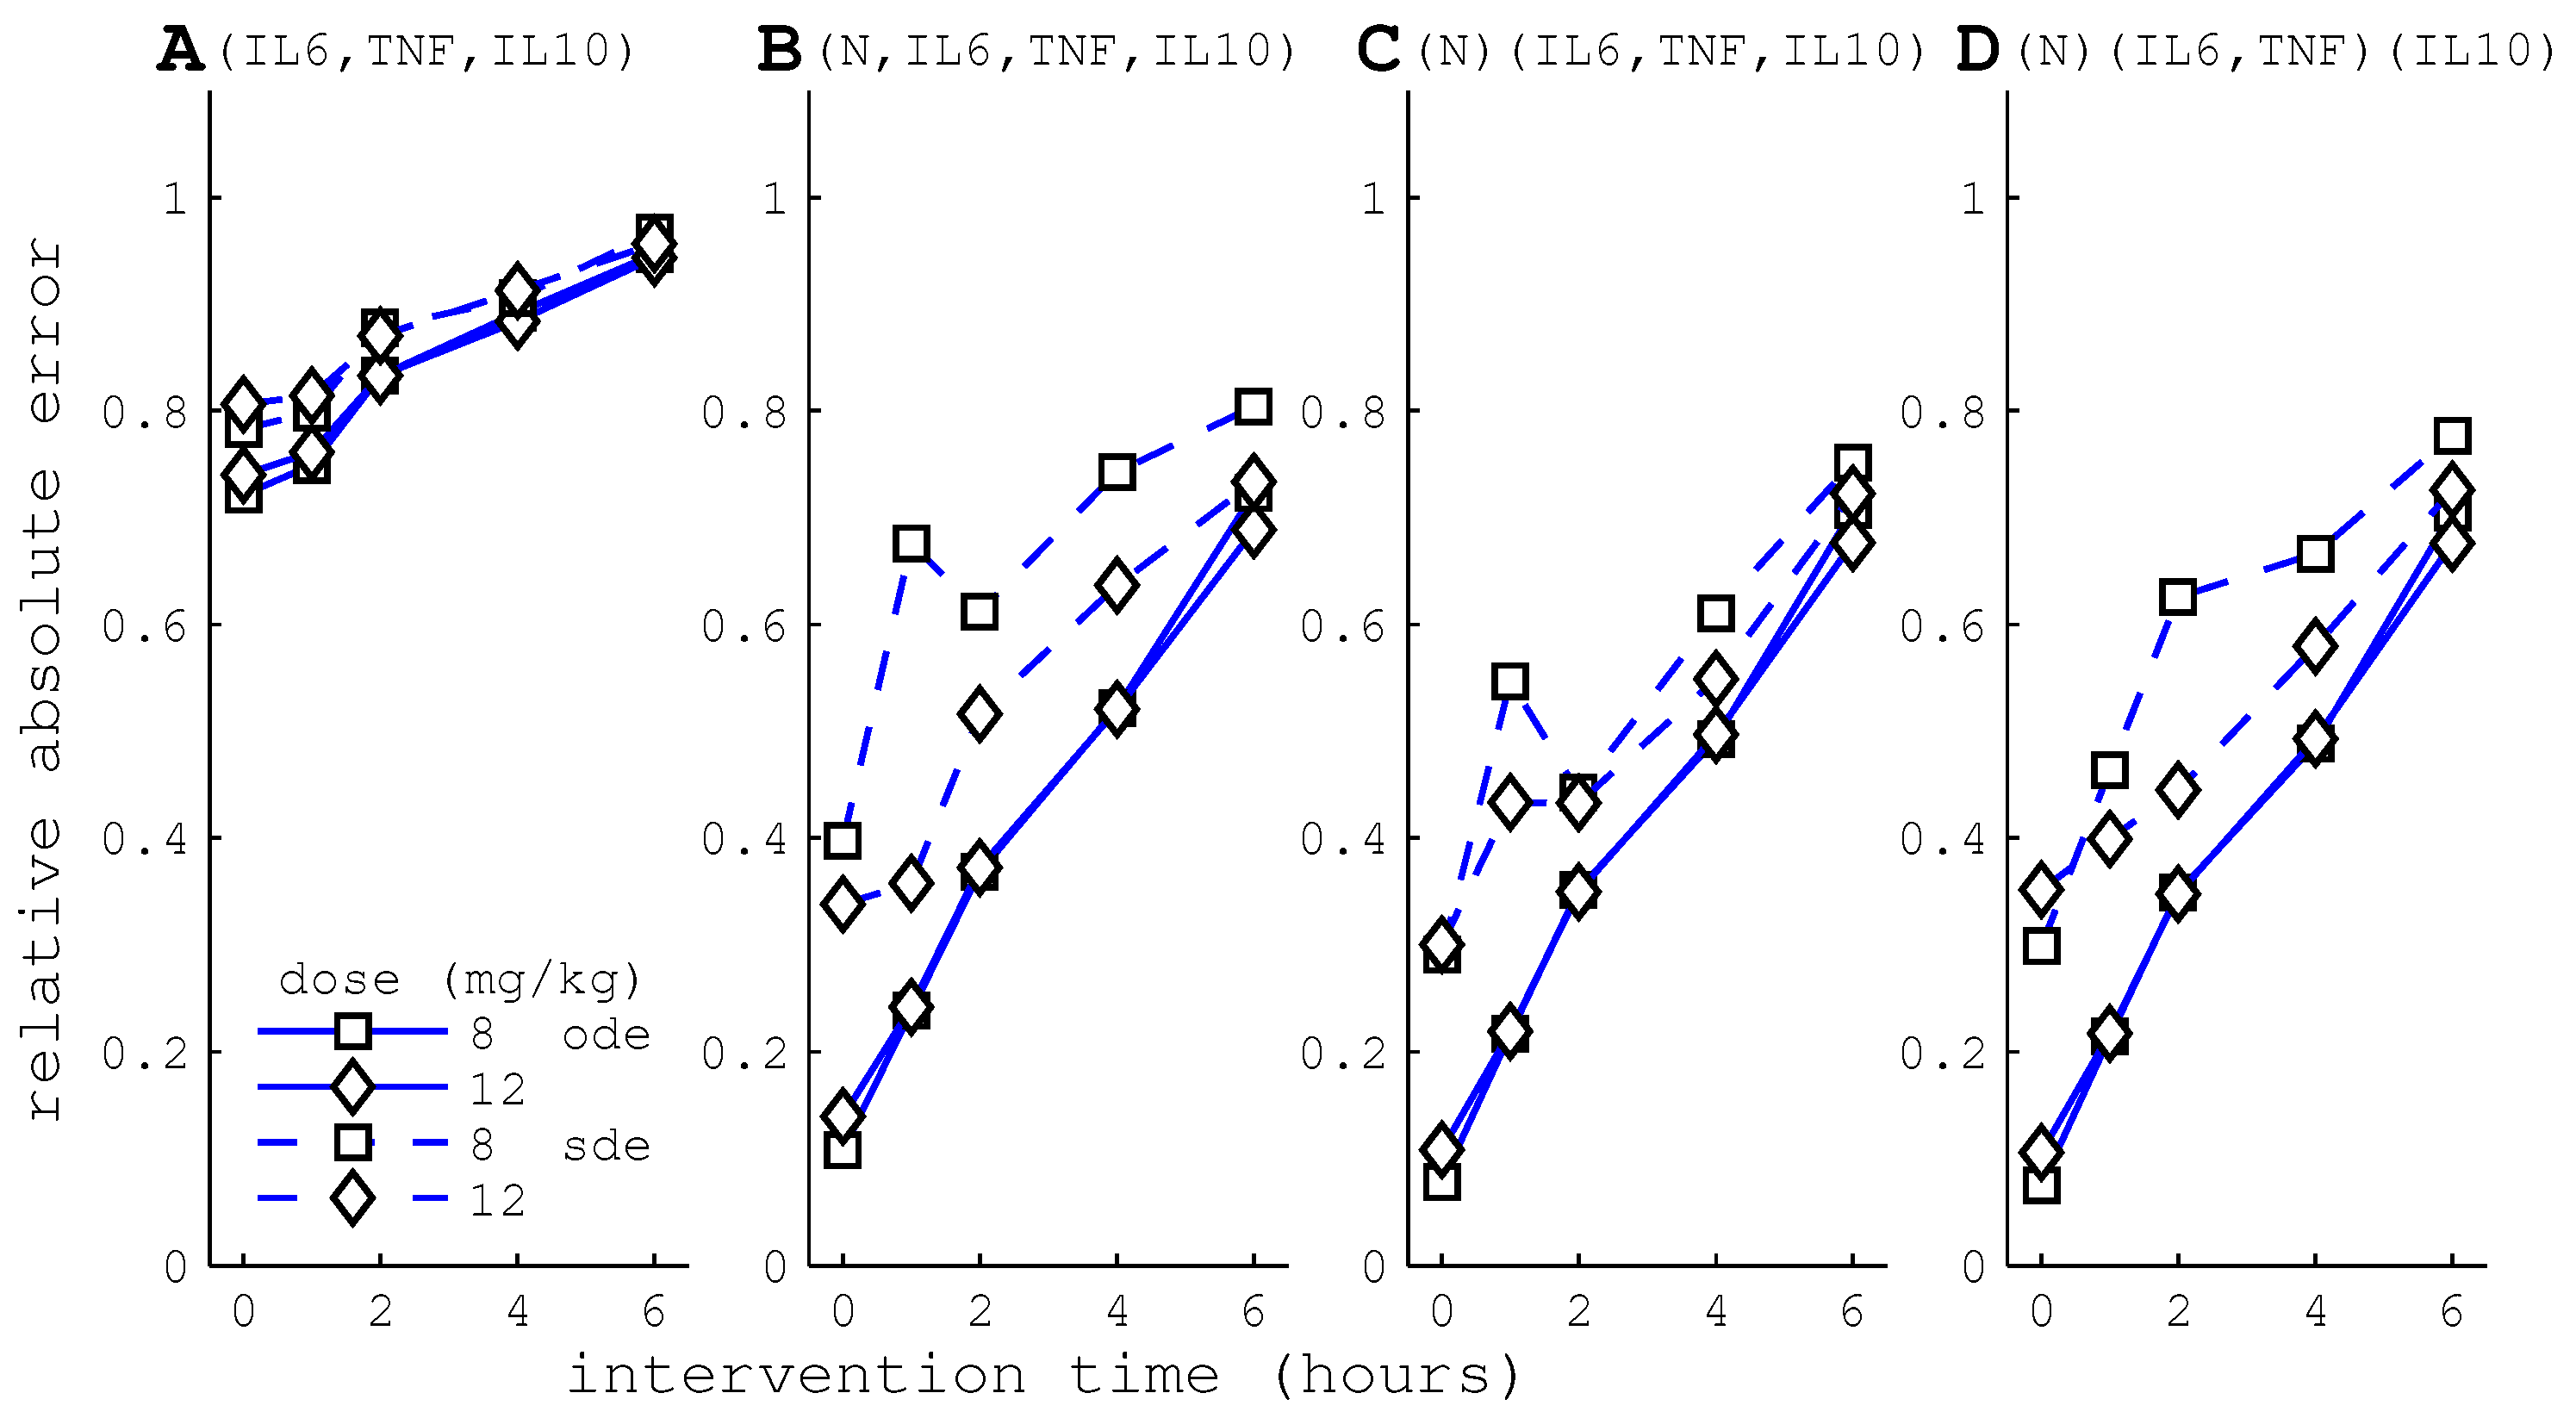
2.9. HA Device Configurations

The four HA device configurations simulated in this study are described in Table 2. Configuration A corresponds to a 1.5 mL device with experimentally calibrated capture of cytokines TNF, IL-6 and IL-10. Device B assumes that, in addition to cytokines, activated WBCs (N) are captured by the device. Configurations C and D represent hypothetical HA devices comprised of two or more columns with differing target specificities. The columns are arranged in parallel circuits with independent control of the blood flow rates.

2.10. Model Predictive Control

A nonlinear MPC (NMPC) algorithm was implemented using HA device flow rate(s) as the manipulated variable(s); the controlled variables were activated phagocytes (N); damage (D); and circulating cytokine levels IL-6, TNF and IL-10. The reference trajectory was defined by the system response to a 3 mg/kg endotoxin dose, which is uniformly survivable without treatment. More precisely, let x n u l ( p 0 , t ) be the system state at time t following an endotoxin dose of p 0 mg/kg and null treatment. The reference for the controlled variable i at step k is defined:
R i ( k ) = ( x i n u l ( 3 , t k ) , x i n u l ( 3 , t k + 1 ) , , x i n u l ( 3 , t k + p - 1 ) ) .
The NMPC objective function was:
min u ( k | k ) Γ y X ( k + 1 | k ) - R ( k + 1 ) 2 2 + Γ u U ( k | k ) 2 2 + Γ Δ u Δ U ( k | k ) 2 2
s . t . 0 U ( k | k )
j = 1 c U j ( k | k ) u m a x = 1 . 2 mL / min m
These terms penalize predicted error in the controlled variable ( X ) from the reference ( R ), changes in the flow rates ( Δ U ), and the use of large HA flow rates ( U ) when the effect is negligible. Standard statistical notation is employed throughout (prediction at time k + 1 given information up to time k). Weights for each controlled variable i are given by:
γ x , i = 200 max t = 0 24 { x i n u l ( 3 , t ) }
Weights for manipulated variables are given by: Γ Δ u = 1 / ( u m a x c ) I and Γ u = 1 / ( 4 u m a x c ) I , where c is the number of independent adsorption columns in the HA device. The size of U ( k | k ) was m * c , with the HA configuration establishing the number of adjustable flow rates. Flow rates were constrained to be non-negative, while the sum of flows was constrained to be less than u m a x = 1 . 2 mL/min.
The MPC time step was Δ t = 1 h, the prediction horizon was p = 4 steps, and the move horizon was m = 2 . Control simulations were also performed with p = 6 and m = 3 , but no substantial difference in performance was observed. Predicted trajectories were based on the deterministic endotoxemia model coupled to an HA device model with n = 20 or n = 5 discretizations (five discretizations used in conjunction with PF). Constrained minimization was performed using fmincon in MATLAB with multiple initializations at each time step.
NMPC was performed with and without state estimation. In the former case, the full system state was passed to the controller at each time step (Figure 2B). In the later, state estimates based on serial cytokine measurements were generated by a PF algorithm (Figure 2C).

2.11. HA Performance Metric

HA performance was evaluated by a relative absolute error (RAE) metric, defined with respect to the reference trajectory, and relative to a null treatment simulation:
R A E H A = 1 5 i C t | x i ( p 0 , t ) - x i n u l ( 3 , t ) | t | x i n u l ( p 0 , t ) - x i n u l ( 3 , t ) |
Here x is the model trajectory with MPC of HA, x n u l is the model trajectory without treatment, and p 0 is the initial endotoxin dose. C is the set of controlled states in the endotoxemia model: N ( t ) , D ( t ) , [ I L - 6 ] ( t ) , [ T N F ] ( t ) , and [ I L - 10 ] ( t ) . In the case of stochastic simulations, R A E H A is reported as the average of N = 8 simulations.

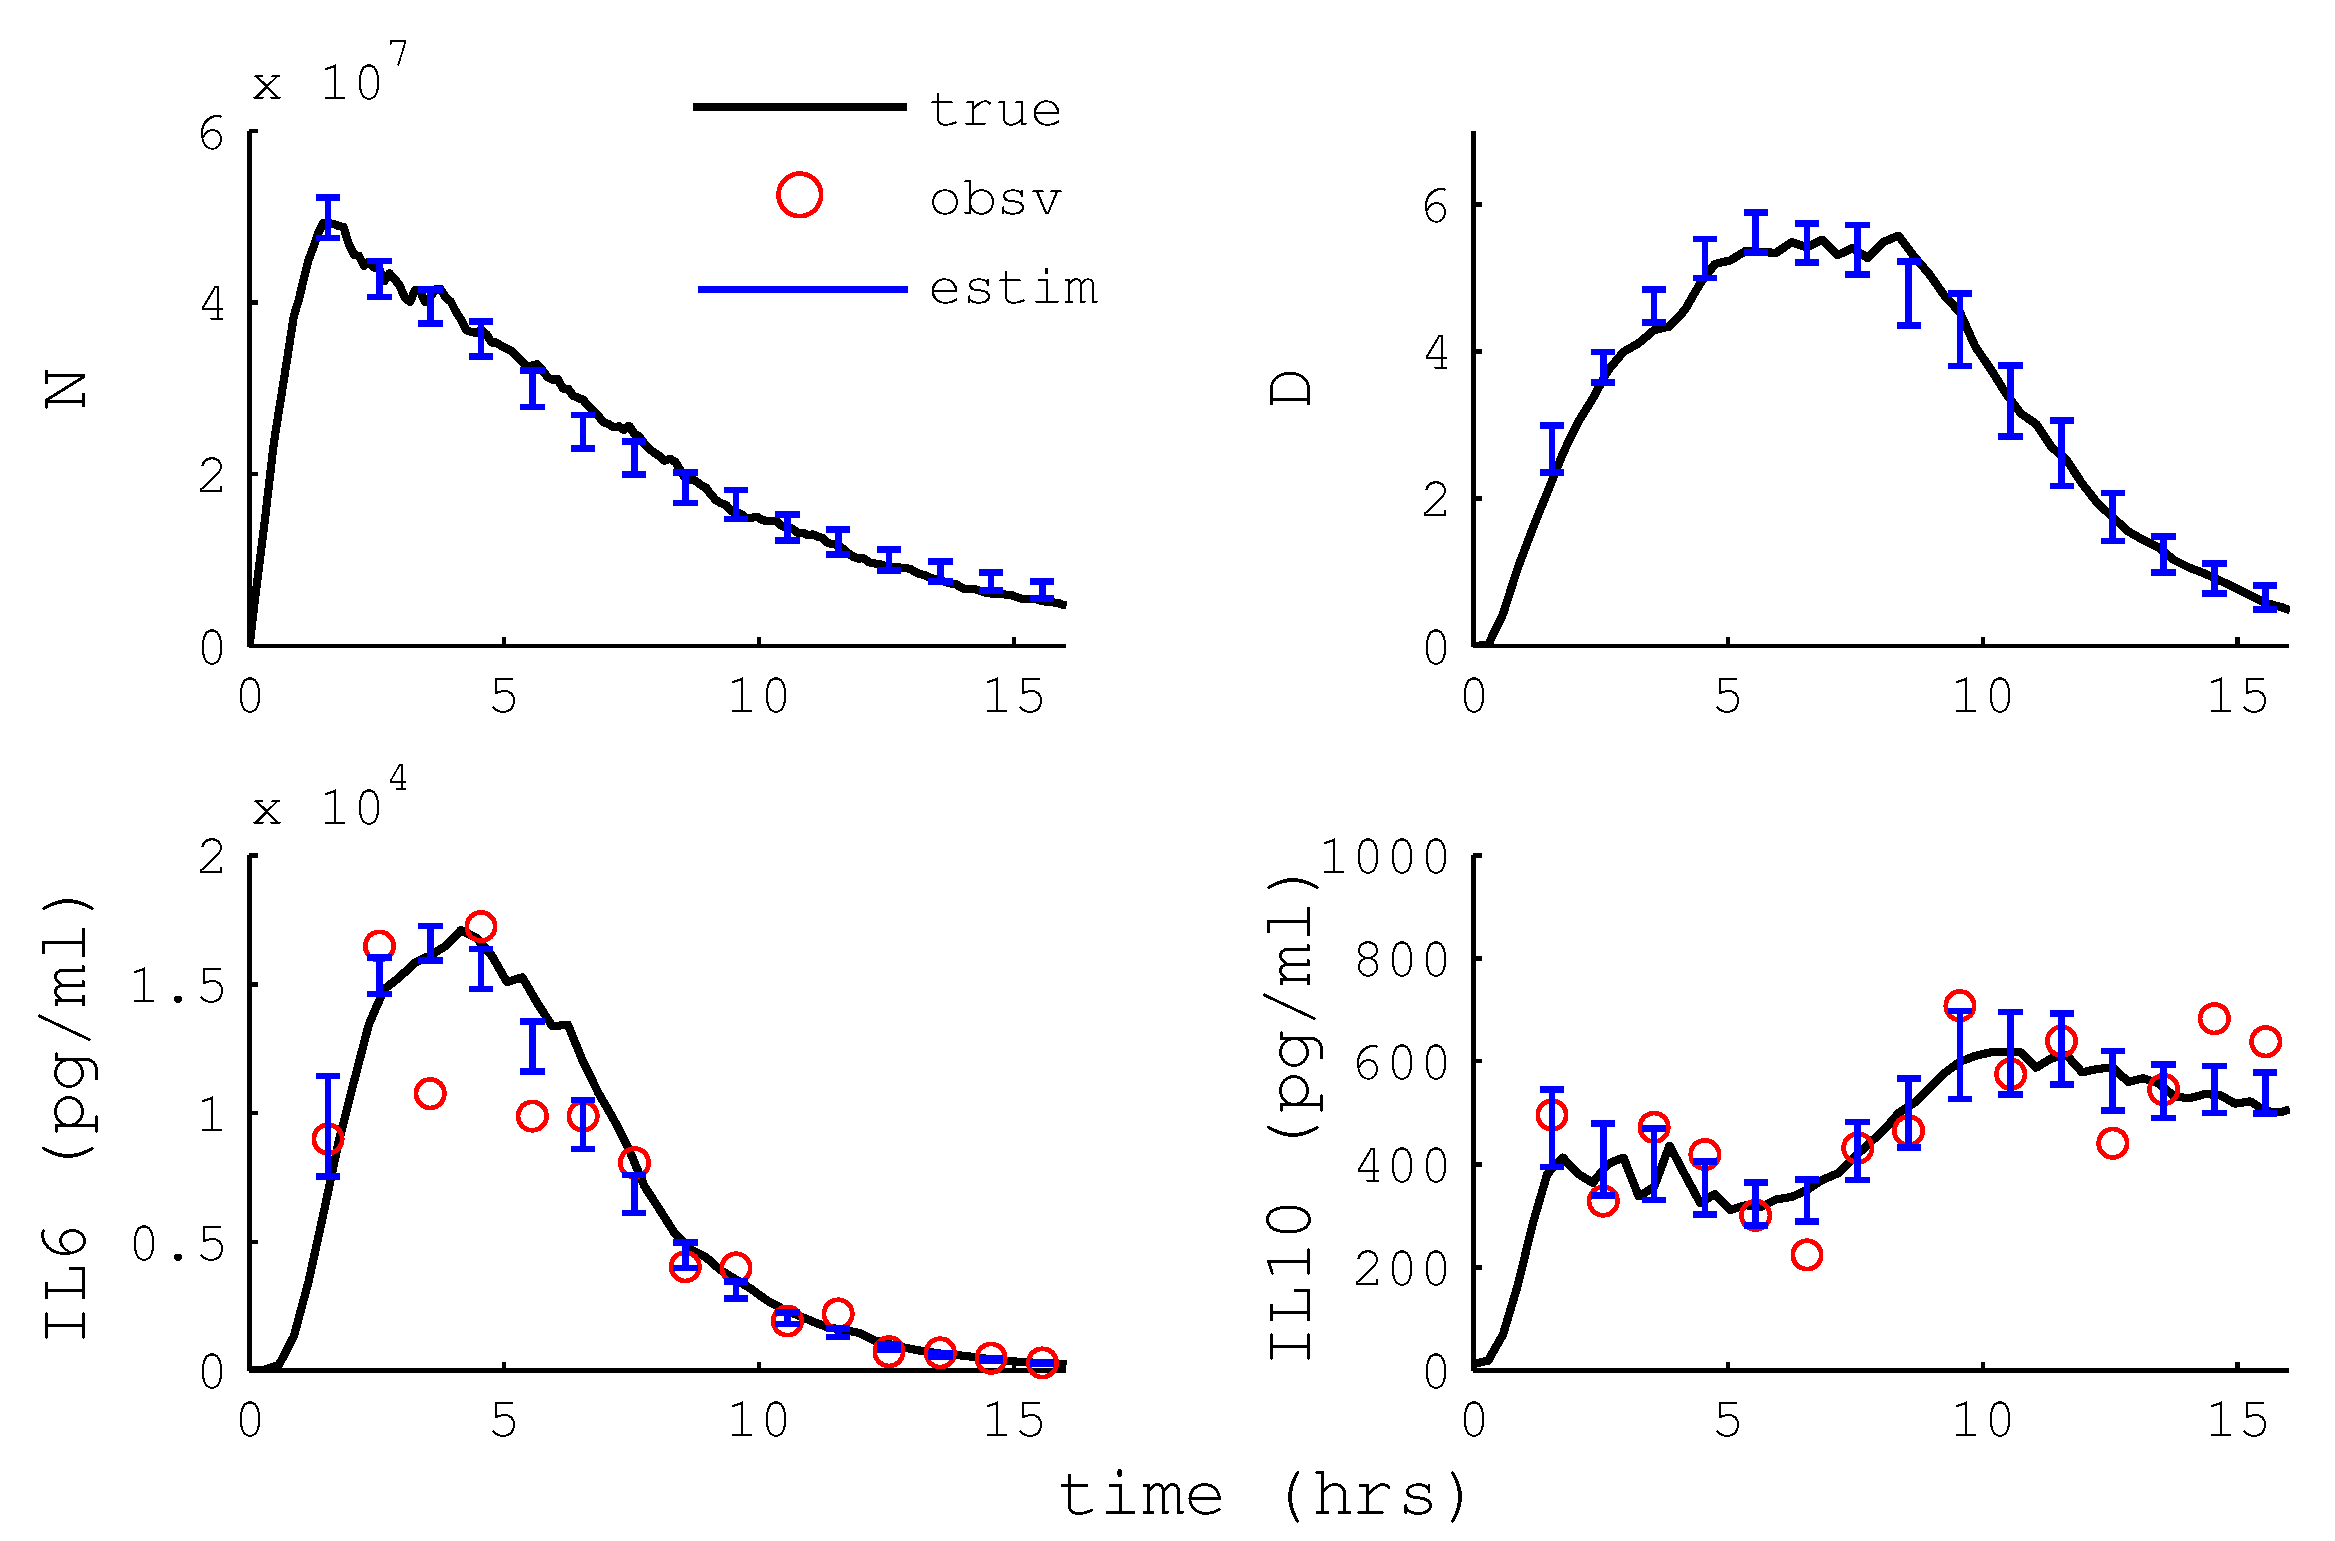
2.12. Particle Filter State Estimation

PF was implemented according to a standard algorithm [59]. Each particle was simulated by the stochastic endotoxemia model coupled to an HA device model with n = 5 discretizations. Particles were initialized with a random endotoxin dose of 3–12 mg/kg, and simulated for a random interval of 0–6 h before the first observation.
Cytokines IL-6, TNF and IL-10 were sampled hourly, with observations generated as previously described. Samples were collected 20 min prior to each control step to mimic laboratory processing time. Based on the observation, particles were weighted and resampled at the sampling timepoint. Particles were then simulated up to the control step before state estimates were computed and passed to the MPC unit.
PF was modified to generate an estimate of time elapsed since endotoxin administration. Each particle was assigned a variable to track its internal time. The elapsed time was estimated by the weighted average of internal particle times. Elapsed time estimates permits the MPC to compare predicted trajectories to the reference trajectory.

2.13. State Estimation Performance Metric

The accuracy of PF state estimation was quantified by relative absolute error (RAE) of the state estimate with respect to the true state:
R A E P F = 1 7 i S - p t = t 0 24 | x ˜ i ( p 0 , t ) - x i ( p 0 , t ) | t = t 0 24 | x i ( p 0 , t ) | ,
where t 0 is the first observed time point, x ˜ is the state estimate, x is the true state, and S - p is the set of states in the endotoxemia model excluding P.

3. Results

3.1. Parameter Sensitivity Analysis

A parametric relative sensitivity matrix ( R S i , j ) was generated using the finite difference method as described in Section 2.3. The matrix was comprised of 8 rows (i∈ [1,8]), representing the states, and 40 columns (j∈ [1,40]), representing all the parameters of the model. A graphical representation of the R S i , j values is provided in Figure 3. The x-axis lists parameters by number; this mapping is provided in Table 3. Each of the subplots in Figure 3 represent the parametric relative sensitivity values corresponding to a particular state (as shown in figure sub-titles). A higher R S i , j value indicates the state is more sensitive to the specified parameter.
In order to investigate the interactions between the various states of the proposed model, the parameters were grouped according to their association with each state, as indicated in Table 4. In Table 5, the contributions of each of these parameter groups, in terms of percentage relative sensitivity (%RS), to a particular state are listed. The %RS of a parameter group for each state is calculated by taking the sum of the relative sensitivity of each parameter in that particular group divided by the sum of relative sensitivity of the entire parameter set (M = 40) for that specific state.
It is evident from the %RS values of Table 5 that each state is sensitive to changes in its own parameters and the parameters associated with states P ( t ) (as endotoxin is the initiator) and N ( t ) (as activated phagocytic cells are the primary driving force of the inflammatory action). In addition, the individual states are variably sensitive to other states when measured directly. The dynamics of the activated phagocytic cells, N ( t ) , are more sensitive to parameter changes associated with [ I L 10 ] ( t ) ( θ I L 10 ) than to those of [ I L 6 ] ( t ) ( θ I L 6 ) and [ T N F ] ( t ) ( θ T N F ). State [ I L 6 ] ( t ) also demonstrates higher sensitivity to parameters associated with [ I L 10 ] ( t ) ( θ I L 10 ) than [ T N F ] ( t ) . For the [ T N F ] ( t ) state, sensitivities to parameters associated with C A ( t ) ( θ C A ) are dramatically higher than [ I L 6 ] ( t ) ( θ I L 6 ) and [ I L 10 ] ( t ) ( θ I L 10 ). The [ I L 10 ] ( t ) state and the unobserved filter, Y I L 10 ( t ) are primarily sensitive to parameters associated with D ( t ) ( θ D ) and the parameters of the unobserved state, Y I L 10 ( t ) . Other cytokine state parameters show lower sensitivity to [ I L 10 ] ( t ) directly, meaning systemic anti-inflammatory response is accomplished through secondary effects of [ I L 10 ] ( t ) on N ( t ) and D ( t ) .

3.2. Controlling the Inflammatory Response

3.2.1. MPC Using HA

To establish the upper performance bound of MPC using HA, endotoxemia was simulated using the deterministic model and assuming the controller observes the full state space without noise. MPC of HA was simulated using four device configurations described in Table 2. Endotoxin was administered in 8 or 12 mg/kg doses and HA intervention began immediately at t = 0 or after delays of 1–6 h. The reference trajectory was defined by the model response to a small endotoxin dose (3 mg/kg), without intervention.
Figure 4 plots MPC performance for each combination of dose, intervention time, and HA device configuration. Performance is quantified by relative absolute error ( R A E H A , Equation (33)), which measures the absolute error of the HA model trajectory (versus the reference trajectory) relative to the absolute error of the null treatment trajectory. Performance declines when intervention is delayed since error is calculated from t = 0 through 24 h.

3.2.2. HA Efficacy: Cytokine Versus WBC Capture

To evaluate the contribution of WBC capture, we simulated the HA device with and without WBC capture. Configuration A implements a device that captures cytokines only, while B is a device that captures both WBC and cytokines. Figure 5 and Figure 6 plot simulation trajectories with and without HA treatment following a 12 mg/kg endotoxin dose.
The cytokine-only device is able to drive circulating IL-6 levels to the reference, but does not substantially impact other cytokines, activated phagocytes (N), or tissue damage (D). In contrast, the cell capture device has the capacity to drive the inflammatory response to the reference trajectory. Figure 4 shows that MPC performance with WBC capture (panel B) is a substantial improvement over cytokine-only capture (panel A) across a range of doses and intervention times. Average R A E H A over dose and intervention time was 0.83 for the cytokine-only device versus 0.40 for the WBC capture device.

3.2.3. Differential Capture of Inflammatory Mediators

HA efficacy could be improved by achieving differential capture of inflammatory mediators. We designed two hypothetical devices composed of two or more HA columns arranged in a parallel circuit. Each column is designed to capture a specific subset of cytokines or WBCs. Blood flows through the columns are independently controlled, enabling selective removal of mediators by HA under MPC. Configuration C has one column designed to capture WBCs, while the second column captures all cytokines. Configuration D is composed of three columns with specificity to WBCs; TNF and IL-6; and IL-10, respectively.
Figure 7 shows sample control schemes for each HA configuration following a 12 mg/kg endotoxin dose and immediate intervention. With device C, MPC divides the blood flow between the WBC capture column and the cytokine capture column at start of intervention, then both flows are dropped to near zero within two hours. After 12 h, the flow rate to the cytokine column is increased to reduce the circulating levels of cytokines. Device D, splits the early flow rate between WBC capture and TNF/IL-6 capture. At two hours, the controller stops flow to WBC and TNF/IL-6 devices and increases flow to the IL-10 device.
Panels C and D of Figure 4 plot the performance of differential capture devices across a range of doses and intervention times. As a point of reference, panel B shows the indiscriminate device with cytokine and WBC capture. The differential capture devices performed slightly better on average than the indiscriminate device. Average R A E H A was 0.40, 0.379 and 0.386 for device B, C and D, respectively.

3.2.4. Particle Filter State Estimation

We implemented a PF state estimation algorithm and tested the performance in silico. The stochastic endotoxemia model was stimulated with a randomized dose of endotoxin ranging from 3-12 mg/kg. The time to HA intervention was randomized from 0–6 h. Dose and intervention time was hidden from the PF to replicate conditions expected in a clinical setting. Cytokine states IL-6, TNF and IL-10 were observed in one hour intervals through a log-normal noise distribution. Figure 8 shows a sample simulation with PF state estimation.
The PF was initialized with various numbers of particles, from 16 to 16,384, and 36 randomized endotoxin trials were simulated for each case. Accuracy was measured by the average relative absolute error, R A E P F , across all endotoxin model states, excluding the endotoxin variable, P. We chose to exclude P due to rapid elimination, which amplified small absolute errors into large relative errors. Median R A E P F converged to ≈0.08 around 256 particles, but outliers with larger error remained until the PF contained 2048 particles (data not shown). We chose N = 4096 particles for the following simulations, favoring accuracy over fast computations.

3.2.5. Hemoadsorption Control with State Estimation

We developed and tested a framework for realtime control of HA based on MPC and PF state estimation. A schematic of the in silico experiment is shown in Figure 2C. The rat subject was simulated using the stochastic endotoxemia model coupled to the HA device model. Cytokines were sampled once per hour, 20 min prior to the following control step. At each control step, the PF generated a state estimate for MPC computations. MPC with state estimation was simulated for each combination of 8 and 12 mg/kg endotoxin doses; 0, 1, 2, 4, or 6 h intervention delays; and the four HA device configurations. Endotoxin dose and intervention delay were not provided to the PF and MPC algorithms. A sample trajectory of MPC of HA with a 12 mg/kg endotoxin challenge and 2 h intervention delay is shown in Figure 9.
Performance of MPC with PF state estimation (stochastic subject with partial, noisy observations) was compared to MPC without state estimation (deterministic subject with complete, perfect observations). MPC with PF has reduced performance across the range of doses, intervention times and HA devices (Figure 2). However, performance is substantially better than the null treatment control. Our results demonstrate that the control framework is robust to a variety of confounding variables, including process noise, partial and noisy observations, and uncertainty in endotoxin dose and administration time.

4. Discussion

This work presents and analyzes an 8-state differential equation model of the acute inflammatory response system [27], explicitly representing the dynamics of a variety of specific cytokines that were treated as more abstract factors in previously developed 3-state model of the acute inflammatory response to pathogen or endotoxin. The present focus is analyzing the dynamics of this more detailed model to identify model structures that are consistent, in a least-squares sense, with longitudinal rat experimental data for 3 of the 8 state variables, which were measured following endotoxin dose challenges at 3, 6, and 12 mg/kg. The model also described the time course of the unobserved activation of phagocytic cells by endotoxin, as well as unaccessible variables, like tissue damage (D) caused by the activated phagocytic cells and the slow-acting anti-inflammatory mediator ( C A ). The data and the resulting model response display significant nonlinearity across the three challenge levels [27]. Hence, the accurate prediction of the intermediate dose without the need for additional parameters or parameter value changes supports the validity of the model structure, as well as its interpolative, and possibly extrapolative, utility.

4.1. Trading Off Biological Fidelity and Model Structure

Improving biological fidelity and reproducing data accurately were of prime importance in this work; care was taken that the added complexity reflected known inflammatory physiology. This came at a cost of a considerable increase in the number of equations and parameters. This exercise is representative of the ongoing challenge of balancing biological fidelity, often yielding large equation dimension and highly parameterized models, with accuracy of, and confidence in, model parameters based on fits to experimental data. Unlike chemical or physical interactions, which are generally well characterized, biological interactions are often poorly quantified and causality is often not established with certainty. Hence, the problem of synthesizing and identifying the simplest system that can be expected to provide reasonable quantitative predictions is difficult and pervasive. System simplicity can be debated on (non)linear, dimensional, and parametric grounds, even without the added complexity of dynamics. In the present case, we opted to minimize the number of state variables and to avoid explicit time delays; the price was increased nonlinearity in the model. The Hill-type nonlinearities in (15), for example, were used to approximate a time delay rather than using a hard-to-identify model parameter. The alternatives, including additional intermediate states (first-order filter equations) or explicit delays would have significantly reduced the need for Hill equation-type nonlinearities at the cost of state dimension and parameter identification complexity. It could also be argued that our use of sigmoidal activation functions is not rooted on any demonstrable cooperativity phenomena. In their favor, these functions avoid the use of pure delays, which present additional challenges to simulators and optimization algorithms, without significantly increasing the number of parameters that must be identified. Sigmoids also recapitulate, in a heuristic fashion, biological constraints imposed by limited numbers of downstream molecular effectors (such as cell surface receptors) and thus, saturation of effect, as well as competition for limited pools of energy and chemical substrates.
Beyond model structure is the evaluation of model performance; how well does the model fit or predict the data? The present model generates substantially better fits than those obtained with our previous models [14,47]. A critique of our fitting efforts could be our lack of a 12-h time point, which would allow for a better characterization of the later phase of the inflammatory dynamics. Unfortunately, it was impractical to maintain personnel overnight for that purpose. In synthesizing the model, we found that appropriate interdisciplinary input, from expert inflammation biologists and experimentalists, was of great value in determining appropriate experimental time points and in defining heuristically appropriate behavior of the model. The term “heuristically appropriate” refers to the process of defining biologically motivated or consistent accessory constraints to assist the parameter estimation process. For example, since all animals survived the insult, we imposed the constraint that damage asymptotically returned to zero. As a result, we have not characterized the transition in endotoxin dose that would shift the behaviors from clearing the challenge and returning to health (guaranteed for the selected value of d P ) to endotoxin-induced death. While this is a limitation of the proposed model, the ability to quantitatively capture the response of cytokines as a function of time after a range of endotoxin challenges provides an advance beyond existing models. Similar to the requirement that damage return to zero, parameter ranges explored by the fitting algorithm were restricted based on inferences from the literature or expert opinion. In cases where our data could not be used to support parameters/functionality, such as characterizing the damage-induced transition from survival to death through a (non)linear function of D ( t ) , we have not incorporated such functionality in the model. Those continuing to look at the endotoxin challenge problem therefore have a jumping-off point for a model that can be further extended to non-survivor cases.
A second concern in mapping a model such as the one developed here into a clinical application is the requirement that pathogen clear. The clearance rate for endotoxin, d P , was fixed, and endotoxin itself did not lead to additional P. In a bacterial infection, Equation (5) would need an additional term to represent the ability of the invading bacteria to replicate, thereby sustaining P ( t ) , potentially indefinitely even in the face of an immune system response (another element not incorporated in the present model). For these reasons, this work is limited to endotoxin challenge, which may not readily extend to more broadly defined pathogen-induced inflammatory challenges. In fact, our ongoing work has transitioned from endotoxin to cecal ligation and puncture (CLP) as a more translationally-relevant inflammatory challenge. More complex models, e.g., [33], are more representative of the sepsis challenge.

4.2. Biological Fidelity Challenges Parameter Estimation

Parameter fitting was performed using a gradient-based optimization routine. Given the nonlinear nature and ill-posedness of parameter estimation from data for dynamic models, it can be expected that other parameter sets could have yielded fits of similar quality. Lower (state) order models will typically have smoother objective function surfaces due to the monotonic nonlinearities used in the model and the smaller number of parameters requiring identification. Hence, reducing the number of non-identifiable parameters should result in a smaller number of different parameter sets yielding high-quality fits. Much like statistical models, parsimony may improve the chances of broader validity, yet it usually results in a decreased ability to fit data well. However, contrary to statistical modeling, parsimony cannot overrule biological plausibility, as broader validity of biological models is rooted in their ability to represent mechanisms active in the biological system. Accordingly, there is no preferred technique to reduce biologically-motivated dynamical models beyond taking advantage of time scale differences and algebraic dependencies.
A logical first step in reducing parameter dimension in a nonlinear model is parametric sensitivity analysis, with sensitivities calculated at all available time points. Insensitivity implies that either the parameter is varied outside of the biologically relevant range, or the biology represented by the insensitive parameter does not impact the outcome of interest in a significant way. Because of the first possibility, insensitivity should not immediately dictate model reduction. High sensitivity, on the other hand, may help guide model reduction [54], specifically when sensitivities between two parameters are correlated. Accordingly, such prediction is most appropriate if sensitivity is observed to be consistent across parameter sets of an ensemble of fits to a given dataset [27]. Model reduction techniques arguably stand on firmer ground if such a consistency is observed. The ultimate goal of our model development and fitting efforts is to create an ensemble of models that reflect, given the variability of the observed data, the range of parameter sets that could have generated this data (see also [27]).
In contrast to the biologically-motivated, but heuristic, approach to model structure analysis and parameter identification discussed above, a mathematically rigorous analysis of the experiment would have the ability to establish shortcomings in the model-data combination, leading to changes in either the model or experiment to better couple the model and data. A formal test of a model structure and data set for well-posedness of the parameter estimation problem is to evaluate the a priori identifiability of the model given the data [60,61,62]. The theory states that a model is a priori identifiable if, under the ideal conditions of noise free measurements and error free model structure, the unknown parameters of the proposed model can be uniquely recovered from the measured data collected during the experiment [60]. A variety of methods have been developed for (non)linear a priori global identifiability, including power series [63], similarity transform [61], and differential algebra [62,64]. The work of [64] employs Gröbner basis techniques to evaluate identifiability for nonlinear polynomial (or rational) systems. Given the class of saturating nonlinearities used in the present work, a detailed analysis of the proposed model via functional approximation or another transformation is beyond the scope of the present work.

4.3. Cell Capture Is Predicted Key to HA Efficacy

Experimental studies have shown that the HA device captures cytokines in both in vivo and ex vivo studies [29,31]. New experiments by our colleagues suggest that the HA device captures WBCs, especially cytokine producing activated neutrophils – immune effectors cells – from both septic and healthy blood. It remains uncertain whether the cell capture plays an important role toward improving animal survival in sepsis studies. To examine the effect of cell capture, we simulated HA devices with and without cell capture. Across a range of endotoxin doses and intervention times, the device with cell capture performed significantly better than the cytokine-only device. The cytokine-only device was able to impact IL-6 substantially, but had only a modest effect on TNF and IL-10, and very little effect on activated phagocytes or tissue damage variables. Consequently, our model predicts that inflammatory modulation is primarily due to cell capture, while cytokine capture plays a secondary role.

4.4. HA Devices with Differential Cytokine and WBC Capture May Have Little Benefit

Since the HA device captures a broad spectrum of soluble mediators as well as WBCs, we speculated that device efficacy might be improved by differential capture of cells and mediators. In sepsis, inflammation follows an early hyperreactive course followed by a late hyporeactive phase [65]. Consequently, targeted capture of pro-inflammatory cytokines in the early phase, followed by selective capture of anti-inflammatory cytokines in the late phase, may improve treatment results. To examine this hypothesis, we implemented two hypothetical HA devices: configuration C, with independent capture of WBCs and cytokines; and D, with independent capture of WBCs (N), TNF/IL-6, and IL-10. These devices were conceived as multiple HA columns arranged in parallel, with each having specificity for a particular set of mediators. Across a range of endotoxin doses and intervention times, the differential capture devices performed only slightly better than the simple broad spectrum device. Thus, we conclude that differential capture devices will not substantially improve the efficacy of HA for treatment of endotoxemia. This does not preclude the possibility that differential capture will improve treatment of sepsis, where an active infection is present.
Ideally, a healthy response to bacterial infection involves a robust local production of cytokines at the site of infection by surveillance cells, triggering the appropriate targeting of circulating neutrophils and eradication of the local infection. When this ideal scenario does not play out, because local controls are overwhelmed, or the systemic response is large, the clinical syndrome of sepsis ensues. The evolving concept of sepsis, recently reviewed [66], insists on the importance of organ dysfunction as part of an unhealthy response to infection. There is strong evidence that organ dysfunction relates to the non-local effects of both cytokines and poorly targeted neutrophils. For example, TNF-receptor deficient animals do not experience sepsis-related renal failure [67] and individuals with poorly functioning (or low baseline counts) neutrophils do not experience lung dysfunction although their prognosis is not necessarily better [68,69]. Therefore, different organs fail in different ways in severe infections and there is likely a differential contribution of cytokines and neutrophils which is organ dependent. Our model does not represent the complexity of the interaction between neutrophils, cytokines and organ damage. Any real life application will have to consider the possibility of differential capture depending on clinical context (which organs are currently jeopardized).

4.5. MPC Reference Trajectory

There is no clear, biologically-motivated, optimal MPC reference trajectory in our simulations. Forcing the system towards zero response might be counterproductive, as inflammation is necessary for clearing infection and initiating healing. On the other hand, forcing a large inflammatory response can result in excessive damage to tissues and organs. Our choice of reference trajectory was an attempt to balance the necessity of inflammation for infectious control against the risk of organ damage due to excessive inflammation. The inflammatory response to a 3 mg/kg endotoxin dose was chosen as a representative inflammatory course that strikes a reasonable balance between these conflicting goals.

4.6. State Estimation

The extended and unscented Kalman filters (EKF, UFK) are popular state estimation techniques applied to nonlinear models. These methods assume state estimates are normally distributed [39]. This is a poor assumption for models of sepsis, where distributions of cytokine measurements are highly positively skewed with variance positively correlated to their mean. PF permits state estimation in nonlinear models with arbitrary distributions. We chose PF state estimation due to its generality and ease of implementation.
The key limitation of PF is the computational burden as the dimensionality of the system increases. For our purposes, PF state estimation and MPC computation was fast enough for online implementation. On a typical PC, state estimation with 4096 particles and MPC required less than 1 min of computation time per hour of simulated time. Computational cost may become prohibitive in models with larger state spaces, where larger particle sets may be required. Future work is needed to determine scalability to higher dimensional models of inflammation.

4.7. Real-Time Control of HA

Our simulations of real-time control of HA included a variety of confounding factors to emulate the challenges of clinical application. Patient variability was represented by process noise in the subject model. Observation noise and measurement delay mimicked the current state of cytokine assays available in laboratories and clinics. Randomized endotoxin dose and intervention time accounted for the real-life variability of inflammatory challenge and time of patient admission to care. Despite less than ideal circumstances, performance declined only modestly in comparison to noise-free simulations. We are cautiously optimistic, based on these results, that our framework can translate to application in the laboratory and clinic.

4.8. Limitations

This work assumed that rapid measurements of the cytokines were available at point-of-care. In current clinical practice, IL-6 measurements are available at the bedside within 20 min of blood sample [70,71]. Similar assays are not yet available for other cytokines. Efforts to develop point-of-care inflammatory profiles are underway, but the lack of complete cytokine profiles at bedside is currently a barrier to clinical application. We did not extensively examine the impact of providing the controller with delayed information in the various cytokine measurement channels. In real life applications, additional, less granular information might be available regarding unobserved states that might be of significant help to the controller [72].
Our results are based on a rat endotoxemia model of acute inflammation. While endotoxemia models have a long history in the experimental literature, the rapid inflammatory course is a stark contrast to the slow course observed in clinical sepsis [28]. Endotoxin models lack an active infection that accompanies clinical sepsis. A balanced inflammatory response must be capable of eliminating infection, while limiting collateral organ damage due to excess response. Thus, the dynamics of sepsis may not be adequately reproduced by a model that lacks infection. The cecal ligation and puncture (CLP) model is considered to be more representative of sepsis. In CLP, the cecum of a test animal is ligated and punctured. The punctured cecum leaks gut bacteria into the peritoneal space, resulting in slow development of inflammation over the course of a day. In comparison to sublethal models, lethal CLP leads to reduced WBC recruitment to the site of infection, while migration to the lung increases [73]. Among other factors, dysregulated recruitment is associated with loss of chemokine gradients during severe inflammation [74]. A complete understanding of these phenomenon will require mathematical models that represent both infection and multiple organs. Consequently, the results presented here may have limited applicability in clinical sepsis. The control framework developed here is generally applicable to a wide range of equation-based models, and we plan to apply these methods to a calibrated CLP model currently under development. Finally, despite our best efforts, there may be biological phenomena that are not accurately represented in our endotoxemia model.

5. Conclusions

We present a biologically-inspired equation-based model of endotoxemia response including activated phagocytic cells and cytokines. The model was fit to, and validated against, preclinical data. A model-based control system, using hemofiltration to decrease circulating cytokines and phagocytic cells, can modulate inflammation, while cytokine removal alone does not provide suitable reduction in inflammatory response. The challenges in developing a data-calibrated model with biological insight were many, leading to a generalizable approach where the development of top-down models of biological processes that target quantitative validation and prediction should: (i) primarily reflect known biological interactions among model components; (ii) be developed by interdisciplinary teams where data collection is planned with modeling as a primary consideration; and (iii) apply relevant literature and appropriate heuristics, based on experimental observations, to guide model development. Thereafter, sensitivity and identifiability analysis-guided model reduction (both dimensional and parametric) can be employed to reduce model complexity. Finally, ensemble creation and validation on separate datasets are necessary steps to the formulation of biologically relevant, quantitatively accurate dynamical models of complex processes.
multiple

Acknowledgments

Funding for this work was provided by NIH grants R01-HL-080926 and R01-GM-105728; JSH also received funding through NIH T32 EB009403, part of the HHMI–NIBIB Interfaces Initiative.

Author Contributions

A.R., R.S.P., S.D.-G, and G.C. constructed the mathematical model; J.S.H., R.S.P., and G.C. synthesized the control algorithm. The modeling and experimental integration was conceived by J.A.K., G.C., and W.J.F. Endotoxin data was provided by C.L. and Y.V.; hemofiltration experiments were conducted by M.V.F., I.E.V., and W.J.F., with some reagents provided by T.R. and J.A.K. S.D.-G. and J.R. contributed to model analysis. The paper was written by R.S.P., A.R., and J.S.H.

Conflicts of Interest

The authors declare no conflict of interest.

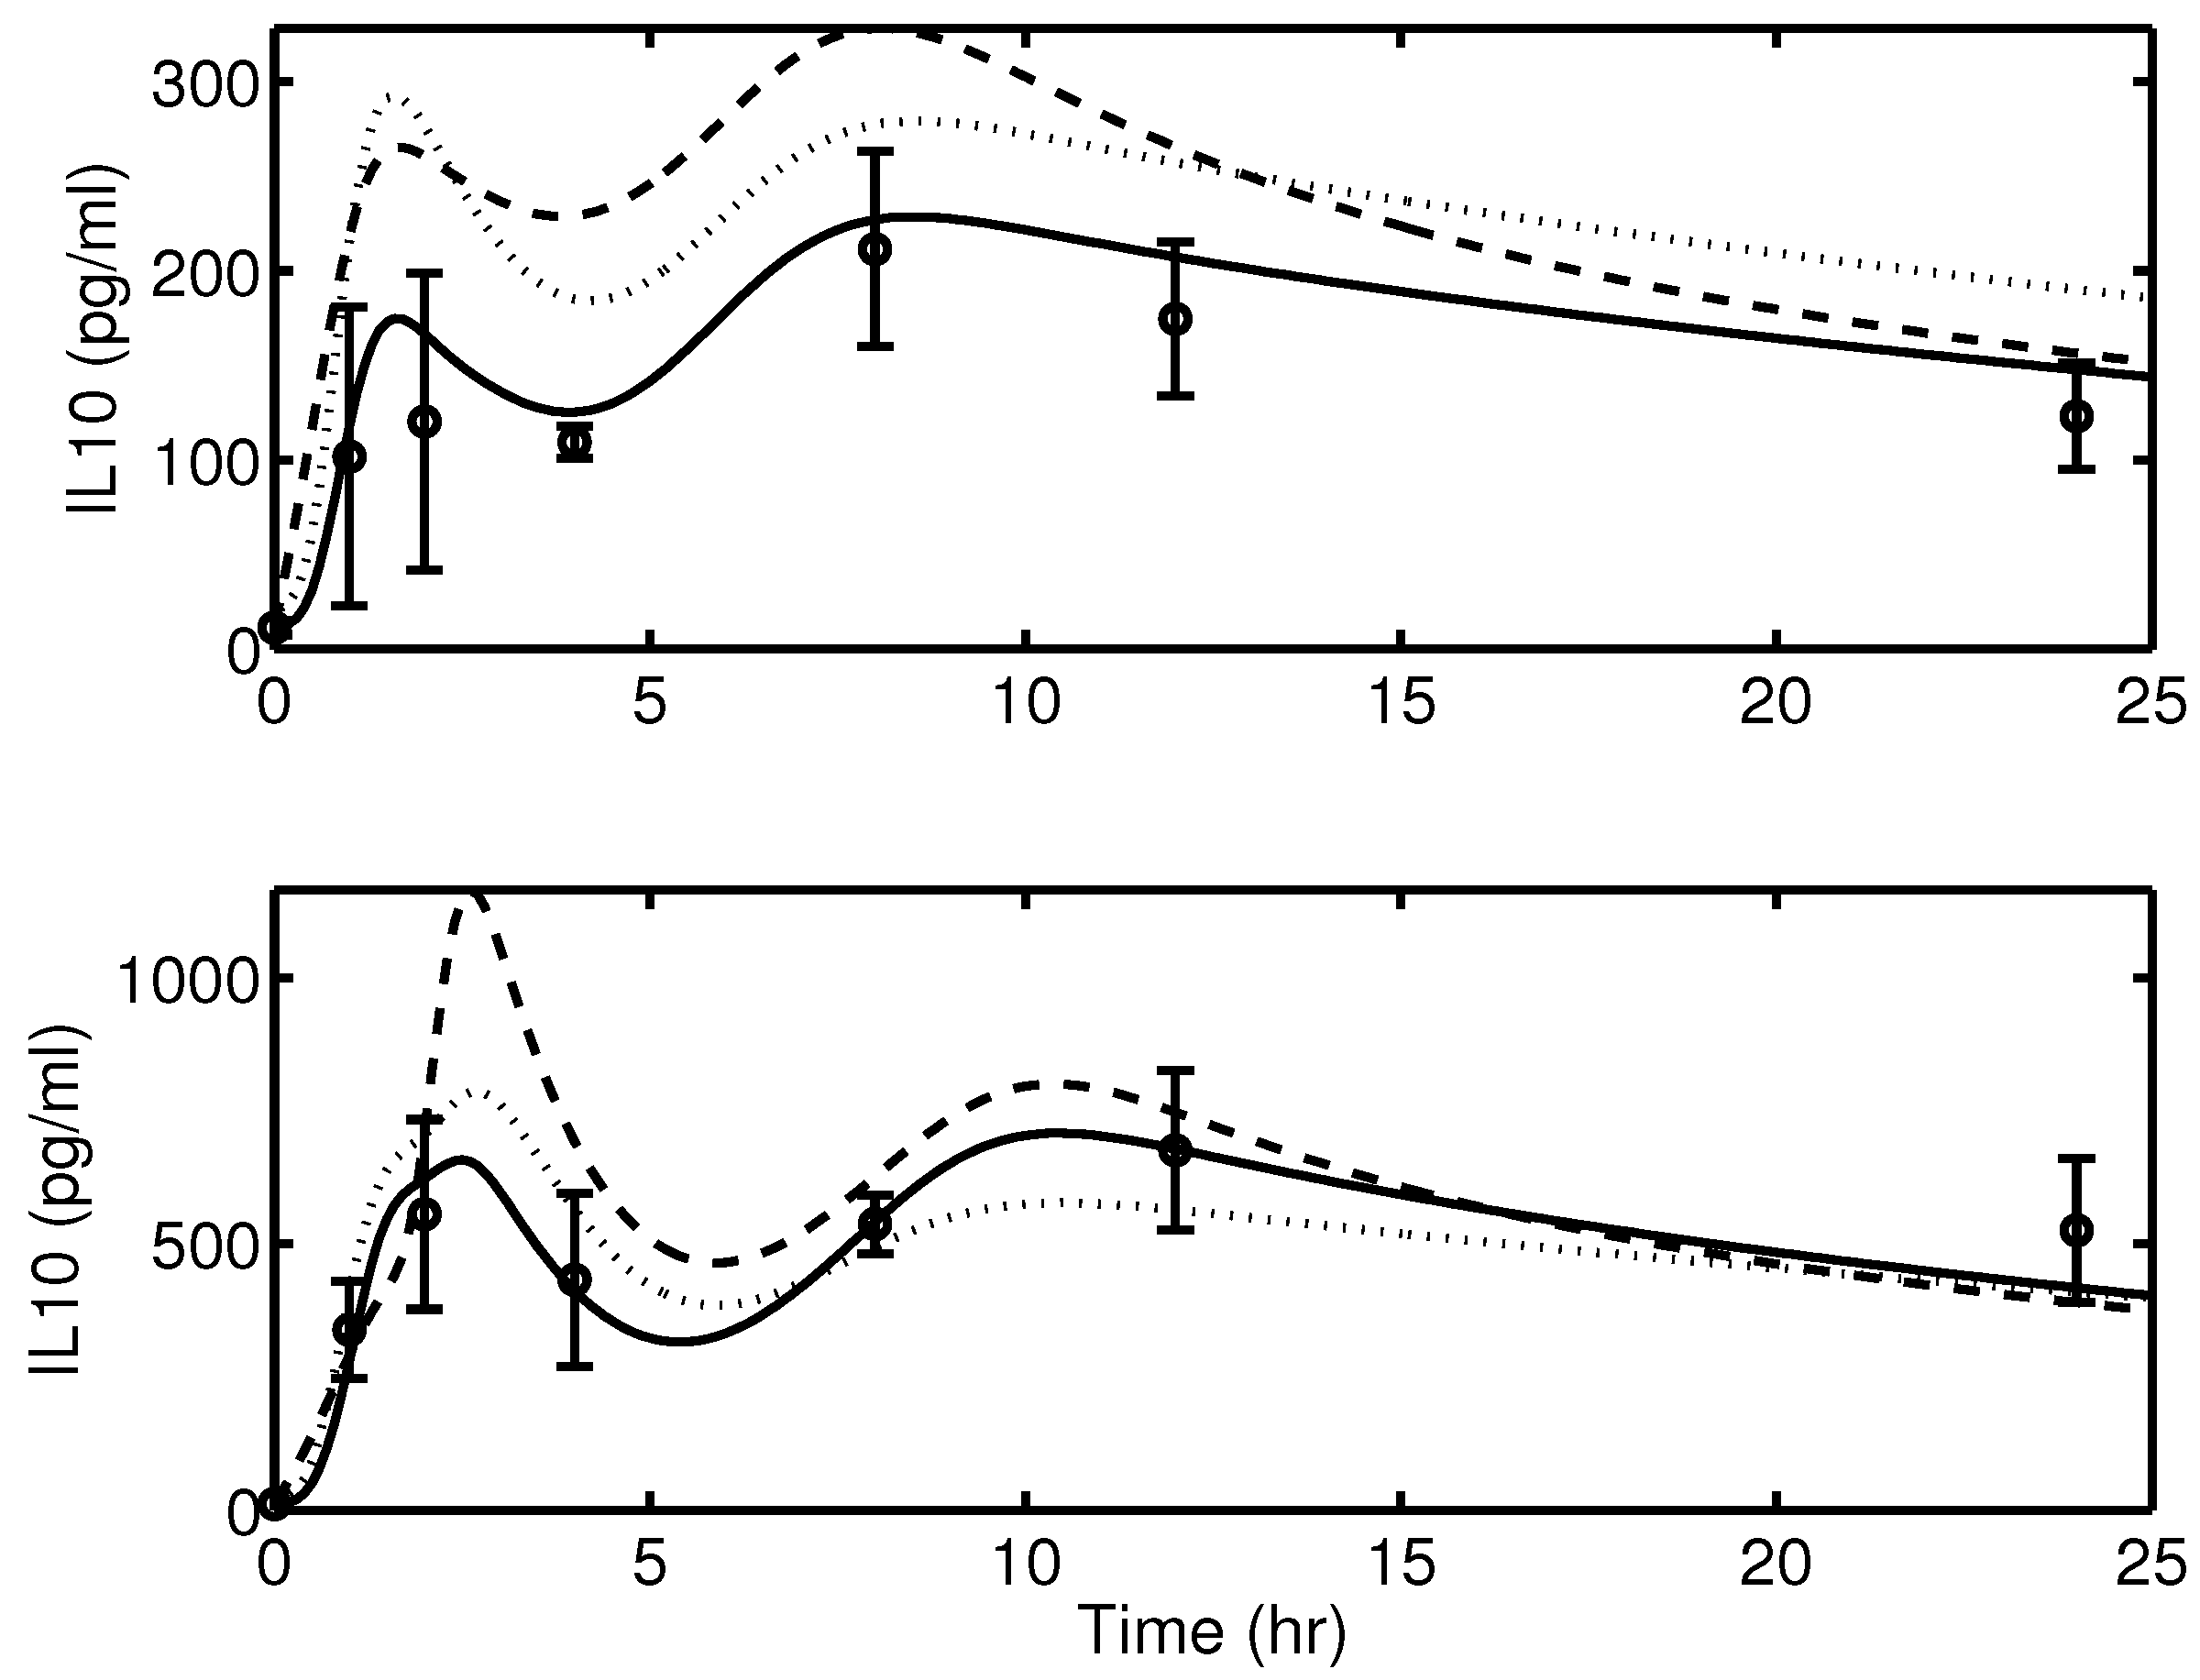
Appendix A. Model Structure Justification

Appendix A.1. Model Selection Technique

Akaike’s Information Criterion (AIC) [75] and Bayes Information Criterion (BIC) [76] were employed to establish a quantitative comparison between the proposed inflammation model structure and candidate simplifications. When comparing two models containing different values of M, the model with the lower AIC and BIC values is preferred. The value of AIC can be calculated from the following equation [75]:
A I C = Q P ln R 2 Q P + 2 M
Similarly, the value of BIC can be calculated as shown below [76]:
B I C = Q P ln R 2 Q P + M l n ( Q P )
AIC and BIC may be minimized over the choices of M (the number of model parameters) to yield a trade-off between the quality of fit of the model, which lowers the sum squared error ( R 2 , calculated as R N 2 from Equation (A3) with weights σ i = 1 ), and the model’s complexity, as measured by M. Both are statistically-motivated methods; a slight variation in the second term of Equations (A1) and (A2) is the difference in the two metrics. This term quantitates the model complexity, and the BIC penalizes free parameters more strongly than the AIC does. While there are other methods for model selection (e.g., the hierarchical likelihood ratio test, and the general likelihood ratio), these two metrics provide advantages [77] and are used herein.
Both AIC and BIC techniques are widely used statistical methods for quantifying the trade-off between model fit and model complexity, as measured by the total number of parameters. While modeling biological systems where a limited number of measured data points are available, over-fitting, over-parameterization, and the introduction of under-justified nonlinearities are significant concerns. Parameter identifiability (a priori), estimation quality, and model uniqueness must be addressed when complex models are developed from small data sets. In contrast, compact low parameter count models may be structurally identifiable a priori, but they may also yield poor predictive accuracy as measured by model fit (e.g., least-squares error). Hence, a balance should be reached in terms of model complexity and accuracy, and AIC in conjunction with BIC provide such a balancing metric. The remainder of this section presents a series of alternate versions of the proposed model. Both the AIC and BIC values were calculated for each of the alternate versions and were compared with the proposed model. In order to compute the AIC and BIC values, parameters of the alternate version models (except parameter numbers 1, 18, and 36 from Table 3) were re-estimated.

Appendix A.2. Model Selection Comparisons

In modeling [ I L 6 ] with Equation (15), a 4th-order Hill function ( N ( t ) 4 / ( x I L 6 4 + N ( t ) 4 ) ) was introduced to capture the one hour delay in [ I L 6 ] response to endotoxin challenge. The inclusion of this function was necessary to capture the data accurately, where accuracy is quantitated in a least-squares sense as follows
min θ 1 θ M R N 2 j = 1 N y i = 1 Q P z j ( t i ) - y j ( t i , θ 1 . . . θ M ) σ i j 2 s . t . ( 5 ) - ( 24 ) θ m 0 m [ 1 , M ]
Addition of this nonlinearity increased the model complexity by one parameter ( x I L 6 ) versus a linear-in- N ( t ) version of Equation (15) without a Hill function, which can be written as:
d [ I L 6 ] d t = k I L 6 · N ( t ) · [ 1 + k I L 6 T N F · f U P I L 6 T N F ( t ) + k I L 6 I L 6 · f U P I L 6 I L 6 ( t ) ] f D N I L 6 I L 10 ( t ) - d I L 6 · [ I L 6 ]
A comparison of [ I L 6 ] predictions from the proposed model (Equation (15), solid line) and an alternate version of the model, AV-1 (Equation (A4)), is provided as the dashed line in Figure A1.
Figure A1. Model simulation comparison of IL-6 between the proposed model Equation (15) (solid line) and its alternate versions, AV-1, Equation (A4) (dashed line) and, AV-2, Equation (A5) (dotted line), against experimental data (circle) (mean ± SD) in response to endotoxin challenge of 3 mg/kg (top) and 12 mg/kg (bottom).
Processes 04 00038 g010
Calculated AIC and BIC values of both models are given in Table A1. It is clear from the AIC and BIC values and the Figure that the nonlinear model is superior to the linear-in- N ( t ) version.
Furthermore, any Hill function with order <4 in the [ I L 6 ] state compromised the model accuracy. The [ I L 6 ] state with a 3rd-order Hill function can be written as:
d [ I L 6 ] d t = k I L 6 · N ( t ) 3 x I L 6 3 + N ( t ) 3 · [ 1 + k I L 6 T N F · f U P I L 6 T N F ( t ) + k I L 6 I L 6 · f U P I L 6 I L 6 ( t ) ] · f D N I L 6 I L 10 ( t ) - d I L 6 · [ I L 6 ]
The prediction for model AV-2, in Equation (A5), is provided as the dotted line in Figure A1. Once again, from Table A1 it is evident that the AIC and BIC values indicate the superiority of the proposed model over AV-2.
The rapid rise and fall of [ T N F ] necessitated the use of two nonlinear terms to capture the dynamic profile. This was primarily captured by assigning the N ( t ) forcing term a power of 1.5. A second effect included was a 6th-order Hill function for f D N T N F C A ( t ) in Equation (19) to rapidly suppress the [ T N F ] levels after a challenge. Any order lower than 6 compromised the model accuracy for TNF production, particularly after the 2 h time point. For comparison, a simplified version (eliminating the N ( t ) nonlinearity) of Equation (18) can be written as (AV-3):
d [ T N F ] d t = k T N F · N ( t ) · f D N T N F C A ( t ) · f D N T N F I L 6 - d T N F · [ T N F ]
The [ T N F ] predictions from the proposed model (solid line) and AV-3 (Equation (A6), dashed line) are provided in Figure A2. It is evident that the [ T N F ] dynamics predicted by AV-3 are not as rapid as that observed in the experimental data. For structural consistency, another version of the [ T N F ] -state with a Michaelis-Menten expression was formulated as follows (AV-4):
d [ T N F ] d t = k T N F · N ( t ) N ( t ) x T N F + N ( t ) · f D N T N F C A ( t ) · f D N T N F I L 6 - d T N F · [ T N F ]
Figure A2. Model simulation comparison of TNF between the proposed model Equation (18) (solid line), AV-3 Equation (A6) (dashed line), and AV-4 Equation (A7) (dotted line), against experimental data (circle) (mean ± SD) in response to endotoxin challenge of 3 mg/kg (top) and 12 mg/kg (bottom).
Processes 04 00038 g011
The model prediction from AV-4 (dotted line) is also presented in Figure A2. Once again, it is clear that a Michaelis-Menten formulation, which added an extra parameter ( x T N F ), is inadequate to capture accurately the fast dynamics of [ T N F ] . The calculated AIC and BIC values from Table A1 reveal that the proposed model is superior to the two alternate model structures.
The dynamic profile of IL-10 response to the endotoxin challenge justifies further nonlinear terms in the model. The 2-h data point mean value for the 12 mg/kg challenge is 3.6 times higher than that for the 3 mg/kg challenge. To capture this nonlinear scaling, a 3rd-order Hill function ( N ( t ) 3 / ( x I L 10 3 + N ( t ) 3 ) ) was used, as shown in Equation (22). While the inclusion of this nonlinearity added an extra parameter ( x I L 10 ), comparison with simpler models demonstrates its need. An alternate linear (in terms of N ( t ) ) version of the [ I L 10 ] -state can be written as follows (AV-5):
d [ I L 10 ] d t = k I L 10 · N ( t ) · [ 1 + k I L 10 I L 6 · f U P I L 10 I L 6 ( t ) ] - d I L 10 · f D N I L 10 I L 10 ( t ) · [ I L 10 ] + Y I L 10 ( t ) + s I L 10
This reduced the model complexity by one parameter ( x I L 10 ). A comparison of the model predictions from the proposed model (solid lines) and the alternate version (dashed lines) is provided in Figure A3. It is clear that AV-5 is unable to capture the nonlinearities that exist in the [ I L 10 ] dynamics between endotoxin dose levels of 3 and 12 mg/kg, especially during the first peak.
[ I L 10 ] dynamics after the initial peak, are affected by [ I L 6 ] . A 4th-order Hill function for the f U P I L 10 I L 6 ( t ) dynamics (Equation (23)) was necessary to delay the effects of [ I L 6 ] on [ I L 10 ] , as any lower-order Hill expression resulted in a faster elimination of IL-10 after reaching the first peak thus causing the model to under-predict the [ I L 10 ] dynamics at the 4 h time point.
The tissue damage-mediated second surge of IL-10 concentration required the use of a 6th-order Hill function ( N ( t ) n / ( x D n + N ( t ) n ) , where n = 6) in Equation (12). The higher-order Hill function was necessary to accurately capture the second peak in the [ I L 10 ] , which occurred after an initial decrease as observed at the 4 h time point in the experimental data. A comparison of model predictions between the proposed model and alternate versions of Equation (12) represented by 4th-order (n = 4), AV-7, and 2nd-order (n = 2), AV-8, Hill functions are presented in Figure A4. It is evident that lower-order (n< 6) Hill expressions in Equation (12) result in slower [ I L 10 ] dynamics, especially after the 4 h time point. The calculated AIC and BIC values presented in Table A1 clearly indicate that the proposed model is again superior to these alternate versions, particularly for fitting the 3 mg/kg dose results. Related to this damage-induced peak in IL-10, a data-motivated 4th order Hill function was used in Equation (22); any lower-order Hill function proved to be inadequate to capture the second [ I L 10 ] peak simultaneously for both endotoxin dose levels (3 and 12 mg/kg). However, such a bi-phasic [ I L 10 ] dynamics were not observed in the studies performed by Hadley et al. in human subjects [78]. In order to better understand the disconnect between animal and human models [79] of endotoxin response, and to improve fidelity of the proposed model, further investigation of the [ I L 10 ] dynamics may be necessary.
Figure A3. Model simulation comparison of IL-10 between the proposed model, Equation (22), (solid line), AV-5 Equation (A8) (dashed line), and AV-6 Equation (A9) (dotted line), against experimental data (circle) (mean ± SD) in response to endotoxin challenge of 3 mg/kg (top) and 12 mg/kg (bottom).
Processes 04 00038 g012
To accurately capture the [ I L 10 ] dynamics (22) at longer times for various endotoxin challenge levels, it was necessary to reduce the rate of elimination of IL-10 with increasing endotoxin dose level. This was achieved by introducing the down-regulating function, f D N I L 10 I L 10 (Equation (24)). The down-regulation in the model is physiologically motivated by studies showing that elevated levels of [ I L 10 ] reduce its own rate of elimination from the blood stream [51]. An alternate version of Equation (22) without the f D N I L 10 I L 10 function can be written as (AV-6):
d [ I L 10 ] d t = k I L 10 · N ( t ) 3 x I L 10 3 + N ( t ) 3 · [ 1 + k I L 10 I L 6 · f U P I L 10 I L 6 ( t ) ] - d I L 10 · [ I L 10 ] + Y I L 10 ( t ) + s I L 10
Due to the absence of the f D N I L 10 I L 10 term, AV-6 has one less parameter ( x I L 10 I L 10 ). Figure A3 shows the model prediction of [ I L 10 ] from AV-6 (dotted lines). Looking at the AIC and BIC values in Table A1, once again it is clear that the proposed model Equation (22) is superior to both alternate versions.
Figure A4. Model simulation comparison of damage-mediated IL-10 between the proposed model with a 6th-order Hill function in Equation (22) (solid line), AV-7 with a 4th-order Hill function in Equation (22) (dashed line), and AV-8 with a 2nd-order Hill function in Equation (22) (dotted line) against experimental data (circle) (mean ± SD) in response to endotoxin challenge of 3 mg/kg (top) and 12 mg/kg (bottom).
Processes 04 00038 g013
Table A1. Calculated AIC and BIC values (based on 3 mg/kg and 12 mg/kg data) of the proposed model and its alternate versions. Note: all base models have the same AIC and BIC values, they are reported separately for convenient comparison of related submodels.
Model (Equation)AICBIC
IL-6 (Equation (14))274.1299.7
AV-1 (Equation (A4))303.3328.2
AV-2 (Equation (A5))280.0305.6
TNF (Equation (18))274.1299.7
AV-3 (Equation (A6))282.2307.8
AV-4 (Equation (A7))277.0303.2
IL-10 (Equation (22))274.1299.7
AV-5 (Equation (A8))290.2315.1
AV-6 (Equation (A9))287.4312.4
Effect of D on IL-10 (Equation (12))274.1299.7
AV-7279.4305.0
AV-8281.1306.7

References

  1. Janeway, C.A., Jr.; Medzhitov, R. Innate immune recognition. Annu. Rev. Immunol. 2002, 20, 197–216. [Google Scholar] [CrossRef] [PubMed]
  2. Medzhitov, R.; Janeway, C.A., Jr. Innate immunity. N. Engl. J. Med. 2000, 343, 338–344. [Google Scholar] [CrossRef]
  3. Cohen, J. The immunopathogenesis of sepsis. Nature 2002, 420, 885–891. [Google Scholar] [CrossRef] [PubMed]
  4. Abraham, E. Neutrophils and acute lung injury. Crit. Care Med. 2003, 31, S195–S199. [Google Scholar] [CrossRef] [PubMed]
  5. Angus, D.C.; van der Poll, T. Severe sepsis and septic shock. N. Engl. J. Med. 2013, 369, 840–851. [Google Scholar] [CrossRef] [PubMed]
  6. Fujiwara, N.; Kobayashi, K. Macrophages in Inflammation. Curr. Drug Targets Inflamm. Allergy 2005, 4, 281–286. [Google Scholar] [CrossRef] [PubMed]
  7. Kellum, J.A.; Kong, L.; Fink, M.P.; Weissfeld, L.A.; Yealy, D.M.; Pinsky, M.R.; Fine, J.; Krichevsky, A.; Delude, R.L.; Angus, D.C. Understanding the inflammatory cytokine response in pneumonia and sepsis: Results of the Genetic and Inflammatory Markers of Sepsis (GenIMS) Study. Arch. Intern. Med. 2007, 167, 1655–1663. [Google Scholar] [CrossRef] [PubMed]
  8. Bone, R.C.; Balk, R.A.; Cerra, F.B.; Dellinger, R.P.; Fein, A.M.; Knaus, W.A.; Schein, R.M.; Sibbald, W.J. Definitions for sepsis and organ failure and guidelines for the use of innovative therapies in sepsis. Chest 1992, 101, 1644–1655. [Google Scholar] [CrossRef] [PubMed]
  9. Angus, D.C.; Linde-Zwirble, W.T.; Lidicker, J.; Clermont, G.; Carcillo, J.; Pinsky, M.R. Epidemiology of severe sepsis in the United States: analysis of incidence, outcome, and associated costs of care. Crit. Care Med. 2001, 29, 1303–1310. [Google Scholar] [CrossRef] [PubMed]
  10. Singh, S.; Evans, T. Organ dysfunction during sepsis. Intensive Care Med. 2006, 32, 349–360. [Google Scholar] [CrossRef] [PubMed]
  11. Dellinger, R.P.; Levy, M.M.; Rhodes, A.; Annane, D.; Gerlach, H.; Opal, S.M.; Sevransky, J.E.; Sprung, C.L.; Douglas, I.S.; Jaeschke, R.; et al. Surviving Sepsis Campaign. Crit. Care Med. 2013, 41, 580–637. [Google Scholar] [CrossRef] [PubMed]
  12. Dellinger, R.; Levy, M.; Carlet, J.; Bion, J.; Parker, M.; Jaeschke, R.; Reinhart, K.; Angus, D.; Brun-Buisson, C.; Beale, R.; et al. Surviving Sepsis Campaign: International guidelines for management of severe sepsis and septic shock: 2008. Intensive Care Med. 2008, 34, 17–60. [Google Scholar] [CrossRef] [PubMed]
  13. Vincent, J.; Sun, Q.; Dubois, M. Clinical trials of immunomodulatory therapies in severe sepsis and septic shock. Clin. Infect. Dis. 2002, 34, 1084–1093. [Google Scholar] [CrossRef] [PubMed]
  14. Kumar, R.; Clermont, G.; Vodovotz, Y.; Chow, C.C. The dynamics of acute inflammation. J. Theor. Biol. 2004, 230, 145–155. [Google Scholar] [CrossRef] [PubMed]
  15. Chow, C.C.; Clermont, G.; Kumar, R.; Lagoa, C.; Tawadrous, Z.; Gallo, D.; Betten, B.; Bartels, J.; Constantine, G.; Fink, M.P.; et al. The acute inflammatory response in diverse shock states. Shock 2005, 24, 74–84. [Google Scholar] [CrossRef] [PubMed]
  16. Price, P.M.; Yu, F.; Kaldis, P.; Aleem, E.; Nowak, G.; Safirstein, R.L.; Megyesi, J. Dependence of cisplatin-induced cell death in vitro and in vivo on cyclin-dependent kinase 2. J. Am. Soc. Nephrol. 2006, 17, 2434–2442. [Google Scholar] [CrossRef] [PubMed]
  17. Lagoa, C.E.; Bartels, J.; Baratt, A.; Tseng, G.; Clermont, G.; Fink, M.P.; Billiar, T.R.; Vodovotz, Y. The role of initial trauma in the host’s response to injury and hemorrhage: insights from a correlation of mathematical simulations and hepatic transcriptomic analysis. Shock 2006, 26, 592–600. [Google Scholar] [CrossRef] [PubMed]
  18. An, G. In silico experiments of existing and hypothetical cytokine-directed clinical trials using agent-based modeling. Crit. Care Med. 2004, 32, 2050–2060. [Google Scholar] [CrossRef] [PubMed]
  19. Nieman, G.; Brown, D.; Sarkar, J.; Kubiak, B.; Ziraldo, C.; Dutta-Moscato, J.; Vieau, C.; Barclay, D.; Gatto, L.; Maier, K.; et al. A two-compartment mathematical model of endotoxin-induced inflammatory and physiologic alterations in swine. Crit. Care Med. 2012, 40, 1052–1063. [Google Scholar] [CrossRef] [PubMed]
  20. Dick, T.E.; Molkov, Y.I.; Nieman, G.; Hsieh, Y.H.; Jacono, F.J.; Doyle, J.; Scheff, J.D.; Calvano, S.E.; Androulakis, I.P.; An, G.; et al. Linking inflammation, cardiorespiratory variability, and neural control in acute inflammation via computational modeling. Front. Physiol. 2012, 3, 222. [Google Scholar] [CrossRef] [PubMed]
  21. Dong, X.; Foteinou, P.T.; Calvano, S.E.; Lowry, S.F.; Androulakis, I.P. Agent-based modeling of endotoxin-induced acute inflammatory response in human blood leukocytes. PLoS ONE 2010, 5, e9249. [Google Scholar] [CrossRef] [PubMed]
  22. Lipniacki, T.; Paszek, P.; Brasier, A.R.; Luxon, B.A.; Kimmel, M. Stochastic regulation in early immune response. Biophys. J. 2006, 90, 725–742. [Google Scholar] [CrossRef] [PubMed]
  23. Cheong, R.; Hoffmann, A.; Levchenko, A. Understanding NF-kappaB signaling via mathematical modeling. Mol. Syst. Biol. 2008, 4, 192. [Google Scholar] [CrossRef] [PubMed]
  24. Marino, S.; Kirschner, D.E. The human immune response to Mycobacterium tuberculosis in lung and lymph node. J. Theor. Biol. 2004, 227, 463–486. [Google Scholar] [CrossRef] [PubMed]
  25. Marino, S.; Myers, A.; Flynn, J.L.; Kirschner, D.E. TNF and IL-10 are major factors in modulation of the phagocytic cell environment in lung and lymph node in tuberculosis: A next-generation two-compartmental model. J. Theor. Biol. 2010, 265, 586–598. [Google Scholar] [CrossRef] [PubMed]
  26. Reynolds, A.; Rubin, J.; Clermont, G.; Day, J.; Vodovotz, Y.; Ermentrout, B.G. A reduced mathematical model of the acute inflammatory response: I. Derivation of model and analysis of anti-inflammation. J. Theor. Biol. 2006, 242, 220–236. [Google Scholar] [CrossRef] [PubMed]
  27. Daun, S.; Rubin, J.; Vodovotz, Y.; Roy, A.; Parker, R.; Clermont, G. An ensemble of models of the acute inflammatory response to bacterial lipopolysaccharide in rats: Results from parameter space reduction. J. Theor. Biol. 2008, 253, 843–853. [Google Scholar] [CrossRef] [PubMed]
  28. Fink, M. Animal models of sepsis and its complications. Kidney Int. 2008, 74, 991–993. [Google Scholar] [CrossRef] [PubMed]
  29. Kellum, J.A.; Song, M.; Venkataraman, R. Hemoadsorption removes tumor necrosis factor, interleukin-6, and interleukin-10, reduces nuclear factor-kappaB DNA binding, and improves short-term survival in lethal endotoxemia. Crit. Care Med. 2004, 32, 801–805. [Google Scholar] [CrossRef] [PubMed]
  30. Peng, Z.; Carter, M.J.; Kellum, J.A. Effects of hemoadsorption on cytokine removal and short-term survival in septic rats. Crit. Care Med. 2008, 36, 1573–1577. [Google Scholar] [CrossRef] [PubMed]
  31. DiLeo, M.; Kellum, J.; Federspiel, W. A Simple Mathematical Model of Cytokine Capture Using a Hemoadsorption Device. Ann. Biomed. Eng. 2009, 37, 222–229. [Google Scholar] [CrossRef] [PubMed]
  32. DiLeo, M.V.; Fisher, J.D.; Federspiel, W.J. Experimental Validation of a Theoretical Model of Cytokine Capture Using a Hemoadsorption Device. Ann. Biomed. Eng. 2009, 37, 2310–2316. [Google Scholar] [CrossRef] [PubMed]
  33. Song, S.O.; Song, S.O.K.; Hogg, J.; Peng, Z.Y.; Parker, R.; Kellum, J.a.; Clermont, G. Ensemble models of neutrophil trafficking in severe sepsis. PLoS Comput. Biol. 2012, 8, e1002422. [Google Scholar] [CrossRef] [PubMed]
  34. Parker, R.S.; Doyle III, F.J. Control–Relevant Modeling in Drug Delivery. Adv. Drug Deliv. Rev. 2001, 48, 211–228. [Google Scholar] [CrossRef]
  35. Doyle, F.J., III; Seborg, D.; Parker, R.S.; Bequette, B.W.; Jeffrey, A.; Xia, X.; Craig, I.; McAvoy, T.J. A Tutorial on Biomedical Process Control. J. Process Control 2007, 17, 571–594. [Google Scholar] [CrossRef]
  36. Muske, K.R.; Rawlings, J.B. Model predictive control with linear models. AIChE J. 1993, 39, 262–287. [Google Scholar] [CrossRef]
  37. Day, J.; Rubin, J.; Clermont, G. Using nonlinear model predictive control to find optimal therapeutic strategies to modulate inflammation. Math. Biosci. Eng. 2010, 7, 739–763. [Google Scholar] [CrossRef] [PubMed]
  38. Rawlings, J.B.; Bakshi, B.R. Particle filtering and moving horizon estimation. Comput. Chem. Eng. 2006, 30, 1529–1541. [Google Scholar] [CrossRef]
  39. Arulampalam, M.; Maskell, S.; Gordon, N.; Clapp, T. A tutorial on particle filters for online nonlinear/non-Gaussian Bayesian tracking. IEEE Trans. Signal Process. 2002, 50, 174–188. [Google Scholar] [CrossRef]
  40. Freeman, B.D.; Natanson, C. Anti-inflammatory therapies in sepsis and septic shock. Expert Opin. Investig. Drugs 2000, 9, 1651–1663. [Google Scholar] [CrossRef] [PubMed]
  41. Bellingan, G. Inflammatory cell activation in sepsis. Br. Med. Bull. 1999, 55, 12–29. [Google Scholar] [CrossRef] [PubMed]
  42. Pretolani, M. Interleukin-10: An Anti-inflammatory Cytokine with Therapeutic Potential. Clin. Exp. Allergy 1999, 29, 1164–1171. [Google Scholar] [CrossRef] [PubMed]
  43. Pinsky, M.R. Sepsis: A pro- and anti-inflammatory disequilibrium syndrome. Contrib. Nephrol. 2001, 132, 354–366. [Google Scholar] [PubMed]
  44. Matzinger, P. The danger model: A renewed sense of self. Science 2002, 296, 301–305. [Google Scholar] [CrossRef] [PubMed]
  45. Giannoudis, P.V.; Smith, R.M.; Perry, S.L.; Windsor, A.J.; Dickson, R.A.; Bellamy, M.C. Immediate IL-10 expression following major orthopaedic trauma: Relationship to anti-inflammatory response and subsequent development of sepsis. Intensive Care Med. 2000, 26, 1076–1081. [Google Scholar] [CrossRef] [PubMed]
  46. Kamm, K.; Vanderkolk, W.; Lawrence, C.; Jonker, M.; Davis, A.T. The effect of traumatic brain injury upon the concentration and expression of interleukin-1beta and interleukin-10 in the rat. J. Trauma 2006, 60, 152–157. [Google Scholar] [CrossRef] [PubMed]
  47. Day, J.; Rubin, J.; Vodovotz, Y.; Chow, C.C.; Reynolds, A.; Clermont, G. A reduced mathematical model of the acute inflammatory response II. Capturing scenarios of repeated endotoxin administration. J. Theor. Biol. 2006, 242, 237–256. [Google Scholar] [CrossRef] [PubMed]
  48. Iversen, M.H.; Hahn, R.G. Acute effects of vitamin A on the kinetics of endotoxin in conscious rabbits. Intensive Care Med. 1999, 25, 1160–1164. [Google Scholar] [CrossRef] [PubMed]
  49. Warner, A.E.; DeCamp, M.M.; Molina, R.M.; Brain, J.D. Pulmonary removal of circulating endotoxin results in acute lung injury in sheep. Lab. Investig. 1988, 59, 219–230. [Google Scholar] [PubMed]
  50. Xing, Z.; Gauldie, J.; Cox, G.; Baumann, H.; Jordana, M.; Lei, X.F.; Achong, M.K. IL-6 is an antiinflammatory cytokine required for controlling local or systemic acute inflammatory responses. J. Clin. Investig. 1998, 101, 311–320. [Google Scholar] [CrossRef] [PubMed]
  51. Rosenblum, I.Y.; Johnson, R.C.; Schmahai, T.J. Preclinical Safety Evaluation of Recombinant Human Interleukin-10. Regul. Toxicol. Pharmacol. 2002, 35, 56–71. [Google Scholar] [CrossRef] [PubMed]
  52. Roy, A.; Parker, R.S. Dynamic Modeling of Exercise Effects on Plasma Glucose and Insulin Levels. J. Diabetes Sci. Technol. 2007, 1, 338–347. [Google Scholar] [CrossRef] [PubMed]
  53. Yue, H.; Brown, M.; Knowles, J.; Wang, H.; Broomhead, D.S.; Kell, D.B. Insights into the Behavior of Systems Biology Models from Dynamics Sensitivity and Identifiability Analysis: A Case Study of an NF-κB Signalling Pathway. Mol. Biosyst. 2006, 2, 640–649. [Google Scholar] [CrossRef] [PubMed]
  54. Zak, D.E.; Goyne, G.E.; Schwaber, J.S.; Doyle, F.J., III. Importance of Input Perturbations and Stochastic Gene Expression in the Reverse Engineering of Genetic Regulatory networks: Insights from an Identifiability Analysis of an in silico Network. Genome Res. 2003, 13, 2396–2405. [Google Scholar] [CrossRef] [PubMed]
  55. Hindmarsh, A.C.; Brown, P.N.; Grant, K.E.; Lee, S.L.; Serban, R.; Shumaker, D.E.; Woodward, C.S. SUNDIALS: Suite of nonlinear and differential/algebraic equation solvers. ACM Trans. Math. Softw. 2005, 31, 363–396. [Google Scholar] [CrossRef]
  56. Valenti, I.E. Characterization of a Novel Sorbent Polymer for the Treatment of Sepsis. Master’s Thesis, University of Pittsburgh, Pittsburgh, PA, USA, 2010. [Google Scholar]
  57. Rimmelé, T.; Kellum, J.A. Clinical review: Blood purification for sepsis. Crit. Care 2011, 15, 205. [Google Scholar] [CrossRef] [PubMed]
  58. Peng, Z.; Wang, H.; Carter, M.; Dileo, M.; Bishop, J.; Zhou, F.; Wen, X.; Rimmelé, T.; Singbartl, K.; Federspiel, W.; et al. Acute Removal of Common Sepsis Mediators does not Explain the Effects of Extracorporeal Blood Purification in Experimental Sepsis. Kidney Int. 2012, 81, 363–369. [Google Scholar] [CrossRef] [PubMed]
  59. Bishop, C.M. Pattern Recognition and Machine Learning; Springer: New York, NY, USA, 2006; Chapter 13; pp. 363–369. [Google Scholar]
  60. Audoly, S.; D’Angio, L.; Saccomani, M.P.; Cobelli, C. Global Identifiability of Linear Compartmental Models—A Computer Algebra Algorithm. IEEE Trans. Biomed. Eng. 1998, 45, 36–47. [Google Scholar] [CrossRef] [PubMed]
  61. Chappell, M.J.; Godfrey, K.R. Structural identifiability of the parameters of a nonlinear batch reactor model. Math. Biosci. 1992, 108, 241–251. [Google Scholar] [CrossRef]
  62. Ljung, L.; Glad, T. On global identifiability for arbitrary model parametrizations. Automatica 1994, 30, 265–276. [Google Scholar] [CrossRef]
  63. Pohjanpalo, H. System identifiability based on the power series expansion of the solution. Math. Biosci. 1978, 41, 21–33. [Google Scholar] [CrossRef]
  64. Audoly, S.; Belu, G.; D’Angio, L.; Saccomani, M.P.; Cobelli, C. Global Identifiability of Nonlinear Models of Biological Systems. IEEE Trans. Biomed. Eng. 2001, 48, 55–65. [Google Scholar] [CrossRef] [PubMed]
  65. Riedemann, N.C.; Guo, R.; Ward, P.A. Novel strategies for the treatment of sepsis. Nat. Med. 2003, 9, 517–524. [Google Scholar] [CrossRef] [PubMed]
  66. Singer, M.; Deutschman, C.S.; Seymour, C.W.; Shankar-Hari, M.; Annane, D.; Bauer, M.; Bellomo, R.; Bernard, G.R.; Chiche, J.D.; Coopersmith, C.M.; et al. The Third International Consensus Definitions for Sepsis and Septic Shock (Sepsis-3). JAMA 2016, 315, 801–810. [Google Scholar] [CrossRef] [PubMed]
  67. Cunningham, P.N.; Dyanov, H.M.; Park, P.; Wang, J.; Newell, K.A.; Quigg, R.J. Acute renal failure in endotoxemia is caused by TNF acting directly on TNF receptor-1 in kidney. J. Immunol. 2002, 168, 5817–5823. [Google Scholar] [CrossRef] [PubMed]
  68. Singbartl, K.; Bockhorn, S.G.; Zarbock, A.; Schmolke, M.; Van Aken, H. T cells modulate neutrophil-dependent acute renal failure during endotoxemia: critical role for CD28. J. Am. Soc. Nephrol. 2005, 16, 720–728. [Google Scholar] [CrossRef] [PubMed]
  69. Zarbock, A.; Schmolke, M.; Spieker, T.; Jurk, K.; Van Aken, H.; Singbartl, K. Acute uremia but not renal inflammation attenuates aseptic acute lung injury: A critical role for uremic neutrophils. J. Am. Soc. Nephrol. 2006, 17, 3124–3131. [Google Scholar] [CrossRef] [PubMed]
  70. Schefold, J.C.; Hasper, D.; von Haehling, S.; Meisel, C.; Reinke, P.; Schlosser, H. Interleukin-6 serum level assessment using a new qualitative point-of-care test in sepsis: A comparison with ELISA measurements. Clin. Biochem. 2008, 41, 893–898. [Google Scholar] [CrossRef] [PubMed]
  71. Dengler, J.; Schefold, J.C.; Graetz, D.; Meisel, C.; Splettstösser, G.; Volk, H.; Schlosser, H. Point-of-care testing for interleukin-6 in cerebro spinal fluid (CSF) after subarachnoid haemorrhage. Med. Sci. Monit. 2008, 14, BR265–BR268. [Google Scholar] [PubMed]
  72. Day, J.; Rubin, J.; Clermont, G. Using nonlinear model predictive control to find optimal therapeutic strategies to modulate inflammation. Math. Biosci. Eng. 2010, 7, 739–763. [Google Scholar] [CrossRef] [PubMed]
  73. Alves-Filho, J.C.; de Freitas, A.; Russo, M.; Cunha, F.Q. Toll-like receptor 4 signaling leads to neutrophil migration impairment in polymicrobial sepsis. Crit. Care Med. 2006, 34, 461–470. [Google Scholar] [CrossRef] [PubMed]
  74. Call, D.R.; Nemzek, J.A.; Ebong, S.J.; Bolgos, G.L.; Newcomb, D.E.; Remick, D.G. Ratio of Local to Systemic Chemokine Concentrations Regulates Neutrophil Recruitment. Am. J. Pathol. 2001, 158, 715–721. [Google Scholar] [CrossRef]
  75. Akaike, H. A Bayesian Extension of the Minimal AIC Procedures of Autoregressive Model Fitting. Biometrika 1979, 66, 237–242. [Google Scholar] [CrossRef]
  76. Schwarz, G. Estimating the dimension of a model. Ann. Stat. 1978, 6, 461–464. [Google Scholar] [CrossRef]
  77. Posada, D.; Buckley, T.R. Model Selection and Model Averaging in Phylogenetics: Advantages of Akaike Information Criterion and Bayesian Approaches over Likelihood Ratio Tests. Syst. Biol. 2004, 53, 793–808. [Google Scholar] [CrossRef] [PubMed]
  78. Hadley, J.S.; Wang, J.E.; Foster, S.J.; Thiemermann, C.; Hinds, C.J. Peptidoglycan of Staphylococcus aureus upregulates monocyte expression of CD14, Toll-like receptor 2 (TLR2), and TLR4 in human blood: Possible implications for priming of lipopolysaccharide signaling. Infect. Immun. 2005, 73, 7613–7619. [Google Scholar] [CrossRef] [PubMed]
  79. Rittirsch, D.; Hoesel, L.M.; Ward, P.A. The disconnect between animal models of sepsis and human sepsis. J. Leukoc. Biol. 2007, 81, 137–143. [Google Scholar] [CrossRef] [PubMed]
Figure 1. Schematic diagram of inflammatory response system challenged by endotoxin.
Processes 04 00038 g001
Figure 2. (A) Diagram of endotoxemia model coupled to a hemoadorption (HA) device model. N, interleukin (IL)-6, tumor necrosis factor (TNF) and IL-10 are assumed to circulate through the ex vivo HA circuit. Cytokine capture is modeled in a two step process: reversible diffusive entry into bead pores, followed by irreversible binding to the internal bead surface. White blood cell (WBC) capture is treated as reversible binding at the bead surface. (B) Schematic of in silico HA control experiments without state estimation. Subject is modeled by the deterministic endotoxin model. Complete state information is passed to the controller once per hour. (C) Schematic of in silico HA control experiments with PF state estimation. Subject is modeled by the stochastic endotoxin model. State estimates are based on noisy cytokine measurements obtained once per hour.
Processes 04 00038 g002
Figure 3. Parametric relative sensitivity analysis of the inflammation model for the eight model states.
Processes 04 00038 g003
Figure 4. HA performance is measured by relative absolute error, R A E H A , calculated from time of intervention through 24 h. R A E H A = 0 implies perfect control, while R A E H A = 1 indicates the controller performed no better than null treatment. The x-axis corresponds to the time of HA intervention, where t = 0 is the time of endotoxin administration. Control simulations were based on the deterministic endotoxemia model (solid lines) or stochastic model with PF state estimation (dashed lines). Panels correspond to HA device configurations in Table 2. (A) Configuration A, which captures cytokines only, performs poorly. Configurations that capture white blood cells, (BD), perform well. Hypothetical multi-channel HA devices with differential specificity (C,D) do not substantially improve performance over (B). In all cases, HA performance declines when treatment is delayed.
Processes 04 00038 g004
Figure 5. Simulated endotoxemia with model predictive control (MPC) of HA device A (blue) or null treatment (red). Device A captures cytokines but not WBC. MPC guides IL-6 levels close to the target trajectory, but other cytokines, activated phagocytes (N) and tissue damage (D) are not substantially impacted. Endotoxin dose was 12 mg/kg and HA intervention began immediately at t = 0 .
Processes 04 00038 g005
Figure 6. Simulated endotoxemia with MPC of HA device B (blue) or null treatment (red). MPC with device B, which captures both cytokines and WBC, is able to guide the inflammatory state to the reference trajectory. Endotoxin dose was 12 mg/kg and HA intervention began immediately at t = 0 .
Processes 04 00038 g006
Figure 7. Trajectories of manipulated variables for the device configurations in Table 2; panel labels correspond to device configurations. Response is to a 12 mg/kg endotoxin simulation with immediate HA intervention. Higher HA flow rates are required to achieve control without A vs. with B WBC capture. Differential column configurations C and D demonstrate time-dependent HA column flow for separate columns.
Processes 04 00038 g007
Figure 8. An example of particle filter state estimation on simulated data. circles mark observed cytokine measurements, error bars indicate the standard deviation of the state estimate, lines show the true model state.
Processes 04 00038 g008
Figure 9. Sample simulation of the stochastic endotoxemia model with MPC of HA (blue) or null treatment (red). State estimates based on noisy cytokine measurements were generated by PF. Endotoxin dose was 12 mg/kg with intervention at 2 h. HA was applied using configuration D.
Processes 04 00038 g009
Table 1. Best-fit parameter values (units of min - 1 ) for the HA device.
IL-6TNFIL-10N
k a d 0.620.1880.6820.177
k d e s 0.0130.0150.0720.010
k b n d 0.0060.0070.0220
Table 2. Hemoadsorption device configurations.
HA Specificity
ConfigurationColumn 1Column 2Column 3
ATNF, IL-6, IL-10--
BN, TNF, IL-6, IL-10--
CNTNF, IL-6, IL-10-
DNTNF, IL-6IL-10
Table 3. Parameter mapping in the inflammation model.
No.ParameterNo.ParameterNo.ParameterNo.Parameter
1 d p 11 k N T N F 21 k I L 6 31 k I L 10 I L 6
2 k N 12 k N I L 6 22 d I L 6 32 x I L 10 I L 6
3 x N 13 k D 23 x I L 6 33 k I L 10
4 d N 14 d D 24 x I L 6 I L 10 34 d I L 10
5 k N P 15 x D 25 k I L 6 I L 6 35 x I L 10
6 k N D 16 k C A 26 x I L 6 I L 6 36 s I L 10
7 x N T N F 17 d C A 27 k T N F 37 x I L 10 I L 10
8 x N I L 6 18 s C A 28 d T N F 38 k I L 10 Y
9 x N C A 19 k I L 6 T N F 29 x T N F C A 39 d I L 10 Y
10 x N I L 10 20 x I L 6 T N F 30 x T N F I L 6 40 x I L 10 Y
Table 4. Parameters grouped according to their state association.
Parameter GroupsParameters
θ P d p
θ N k N , x N , d N , k N P , k N D , x N T N F , x N I L 6 , x N C A , x N I L 10 , k N T N F , k N I L 6
θ D k D , d D , x D
θ C A k C A , d C A , s C A
θ I L 6 k I L 6 T N F , x I L 6 T N F , k I L 6 , d I L 6 , x I L 6 , x I L 6 I L 10 , k I L 6 I L 6 , x I L 6 I L 6
θ T N F k T N F , d T N F , x T N F C A , x T N F I L 6
θ I L 10 k I L 10 I L 6 , x I L 10 I L 6 , k I L 10 , d I L 10 , x I L 10 , s I L 10 , x I L 10 I L 10
θ Y I L 10 k I L 10 Y , d I L 10 Y , x I L 10 Y
Table 5. Percentage relative sensitivity (%RS) of grouped parameters for each state.
StatesRelative Sensitivity (%)
θ P θ N θ D θ C A θ I L 6 θ T N F θ I L 10 θ Y I L 10
P ( t ) 1000000000
N ( t ) 13.8640.21.92.85.7110.5
D ( t ) 11.841.028.71.62.44.99.40.3
C A ( t ) 13.045.80.123.32.35.110.00.2
[ I L 6 ] ( t ) 5.417.07.01.436.35.123.34.6
[ T N F ] ( t ) 9.823.90.321.23.933.37.30.2
[ I L 10 ] ( t ) 8.531.030.81.13.53.98.012.9
Y I L 10 ( t ) 8.729.633.21.11.63.66.915.3

