Changes in Particle Size Composition under Seepage Conditions of Reclaimed Soil in Xinjiang, China


1
School of Resources and Geosciences, China University of Mining and Technology, Xuzhou 221116, China
2
School of Geological and Mining Engineering, Xinjiang University, Urumqi 830046, China
*
Author to whom correspondence should be addressed.
Processes 2018, 6(10), 201; https://doi.org/10.3390/pr6100201
Submission received: 15 September 2018
/
Revised: 17 October 2018
/
Accepted: 17 October 2018
/
Published: 20 October 2018
(This article belongs to the Special Issue Fluid Flow in Fractured Porous Media)
Abstract
:The distribution of reclaimed soil particle size under seepage conditions after the management period will directly determine the success or failure of reclamation work. The geotechnical experimental method was used in this paper to study the changes in the granulometric composition of soil. The results show that the granulometric composition of the reclaimed soil varied obviously at different depths. The granulometric composition of the soil at a depth of 10 cm was not much different from undisturbed reclaimed soil (URS). At a depth of 30 cm, as the sharp decrease of the content of fine particles resulted in coarser reclaimed soil, the soil became more uniform, with an increase in porosity and water content. At a depth of 50 cm, the fine particle content was generally slightly lower than that of URS. At a depth of 70 cm, the fine particle content of the soil greatly exceeded that of the URS, with the finest soil particles and lowest porosity. The main reason for the above-mentioned changes of granulometric composition in the reclaimed soil was the seepage in soil caused by irrigation during the management period. The research results can provide a reference for management after land reclamation at non-metallic mines in Xinjiang, China.
1. Introduction
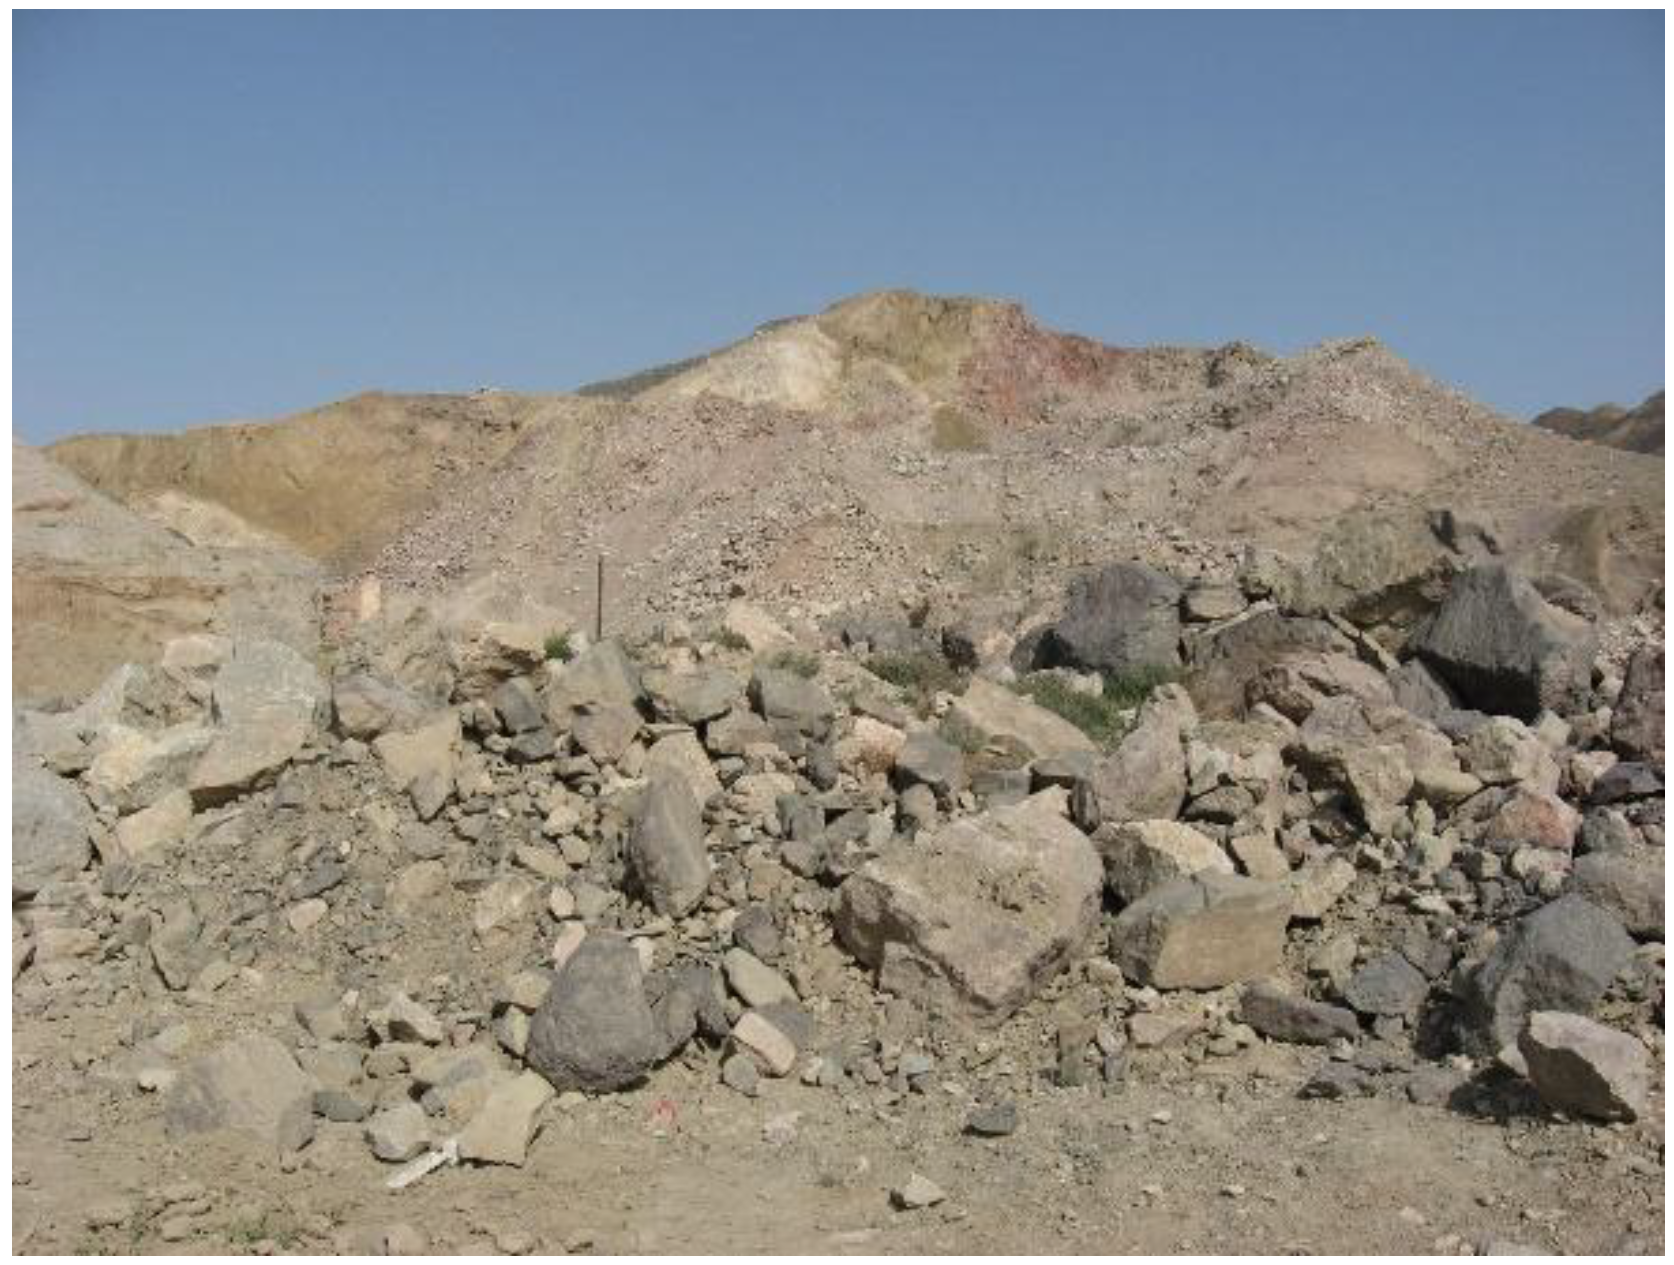
There are vast non-metallic mineral resources in the northern foothills of the Tianshan Mountains in Xinjiang, and the large-scale exploitation of mineral resources is bound to cause irreversible damage to the fragile geological environment and ecological environment in this region. Non-metallic mines in this region include limestone, dolomite, and granite mines. The open-pit mining method is mainly adopted. Large and deep open pits, and a large number of massive hard waste rocks (Figure 1 and Figure 2), will be formed after mining. For mines whose damaged lands are grassland and woodland, the land will be reclaimed after the pits are closed. To reclaim the land, the waste rock is backfilled into the open pits first, and then the surface of the land is covered with soil and vegetation is planted. In order to ensure the survival rate of the vegetation, a one-year management period is set. The quality of the reclaimed soil after the management period will directly determine the success or failure of the reclamation work [1], and the distribution of soil particle size will directly affect the soil fertility, texture, and water holding capacity [2].
In recent years, research [3,4,5,6,7,8,9,10,11,12,13,14,15,16,17] on the physical properties of reclaimed soils has achieved great success. Research on the granulometric composition of reclaimed soil mainly included the following aspects: Using multifractal theory to analyze the granulometric composition of reclaimed soil [18,19,20], granulometric composition analysis of reclaimed soils under different reclamation methods [21,22,23,24], granulometric composition of reclaimed soil before and after reclamation in different years [25,26,27], and using spectrum analytical methods to analyze the granulometric composition of reclaimed soil [28]. The previous research mainly focused on the granulometric composition of reclaimed soil in coal mining areas, with clay soil or loam soil as the main type of reclaimed soil. Different test methods were used to study the granulometric composition of reclaimed soil under different reclamation modes or in different years. There has been less research directed at sandy loam, taking into account the effect of the irrigation water during the management period, to study the changes in the particle size of the soil at different depths or with different overlaying soil thickness under different compaction circumstance.
In view of the limitations of the past studies and the importance of soil particle size to reclamation work, this study takes the typical sandy loam at the non-metallic mines in the northern foothills of the Tianshan Mountains in Xinjiang as a research object. An in-situ test method was used for the first time to simulate the compaction effect of reclamation machinery on reclaimed soils. Furthermore, field sampling, indoor geotechnical experiments, and mathematical statistical analysis were applied to study the changes in the granulometric composition of the reclaimed soil under seepage conditions after a one-year management period.
2. Materials and Methods
The reclaimed soil in-situ test was conducted at the Changji Groundwater Balance Experiment Site in Xinjiang. The reclaimed soil was taken from a limestone ore mine in Dabancheng, which belongs to the northern foothills of the Tianshan Mountains in Xinjiang. The soil was calcic brown soil and belonged to sandy loam, with a bulk unit weight of 12.646 kN/m3, a porosity of 57.71%, and a water content of 11.76%. The lower part of the reclaimed soil was backfilled with the waste rock produced by the limestone mining.
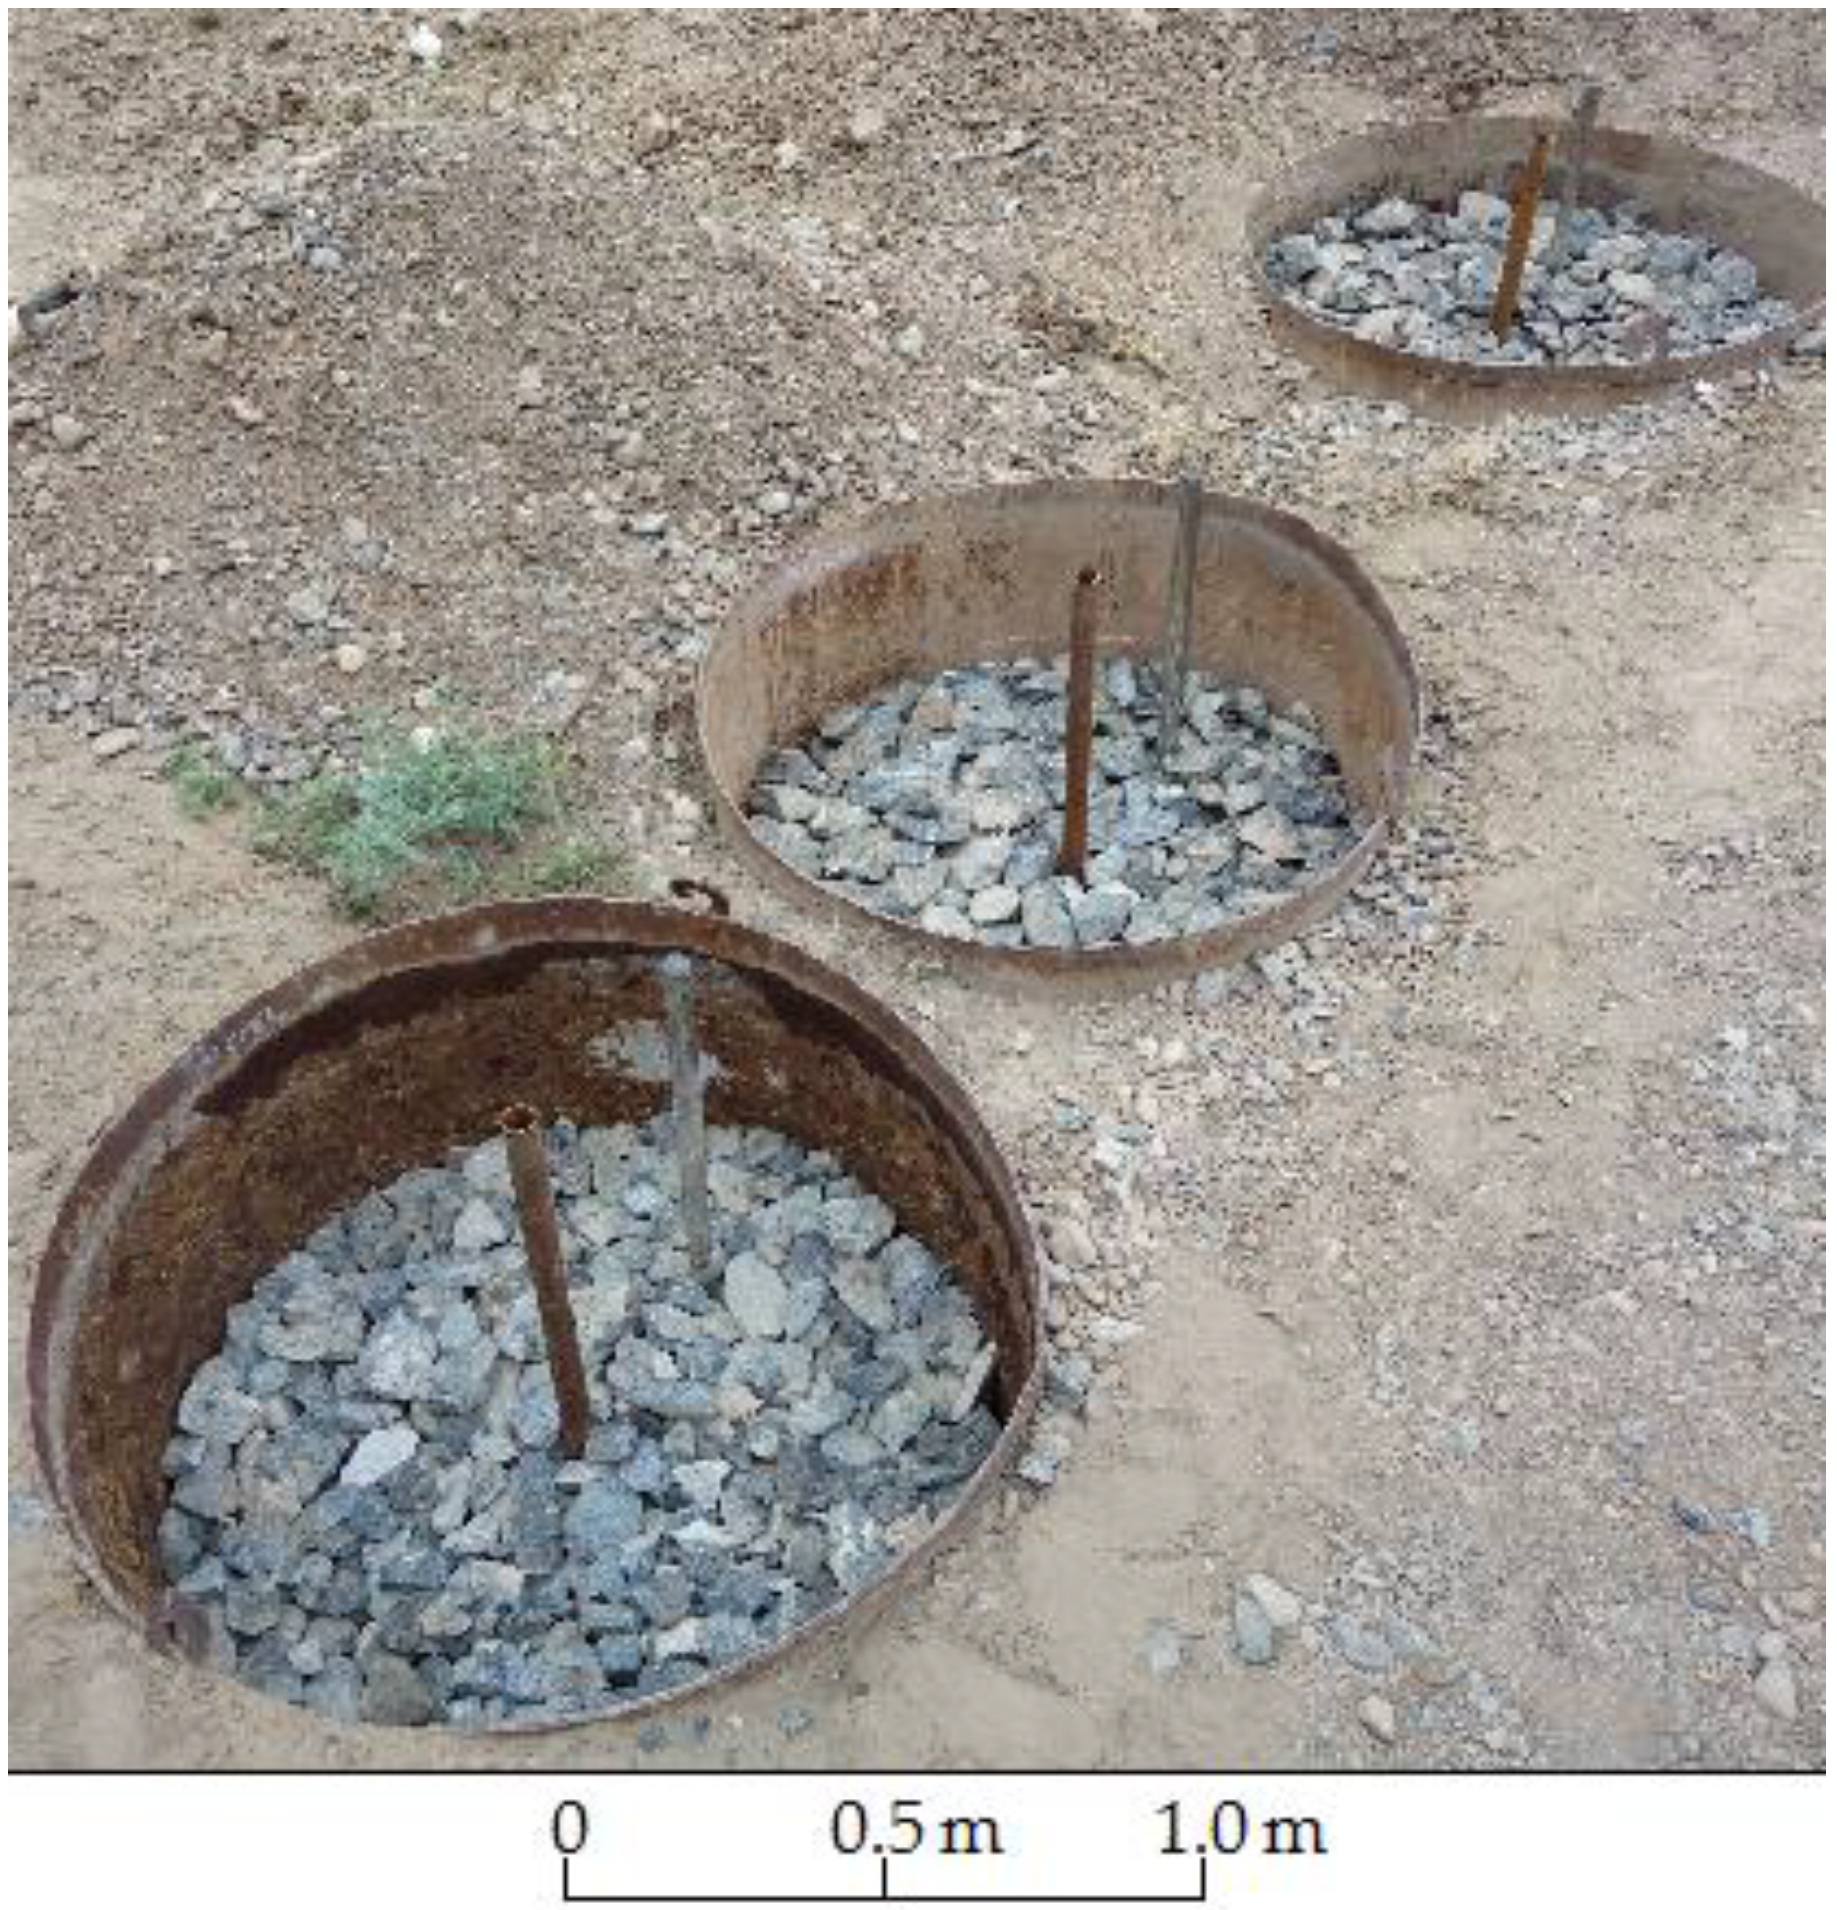
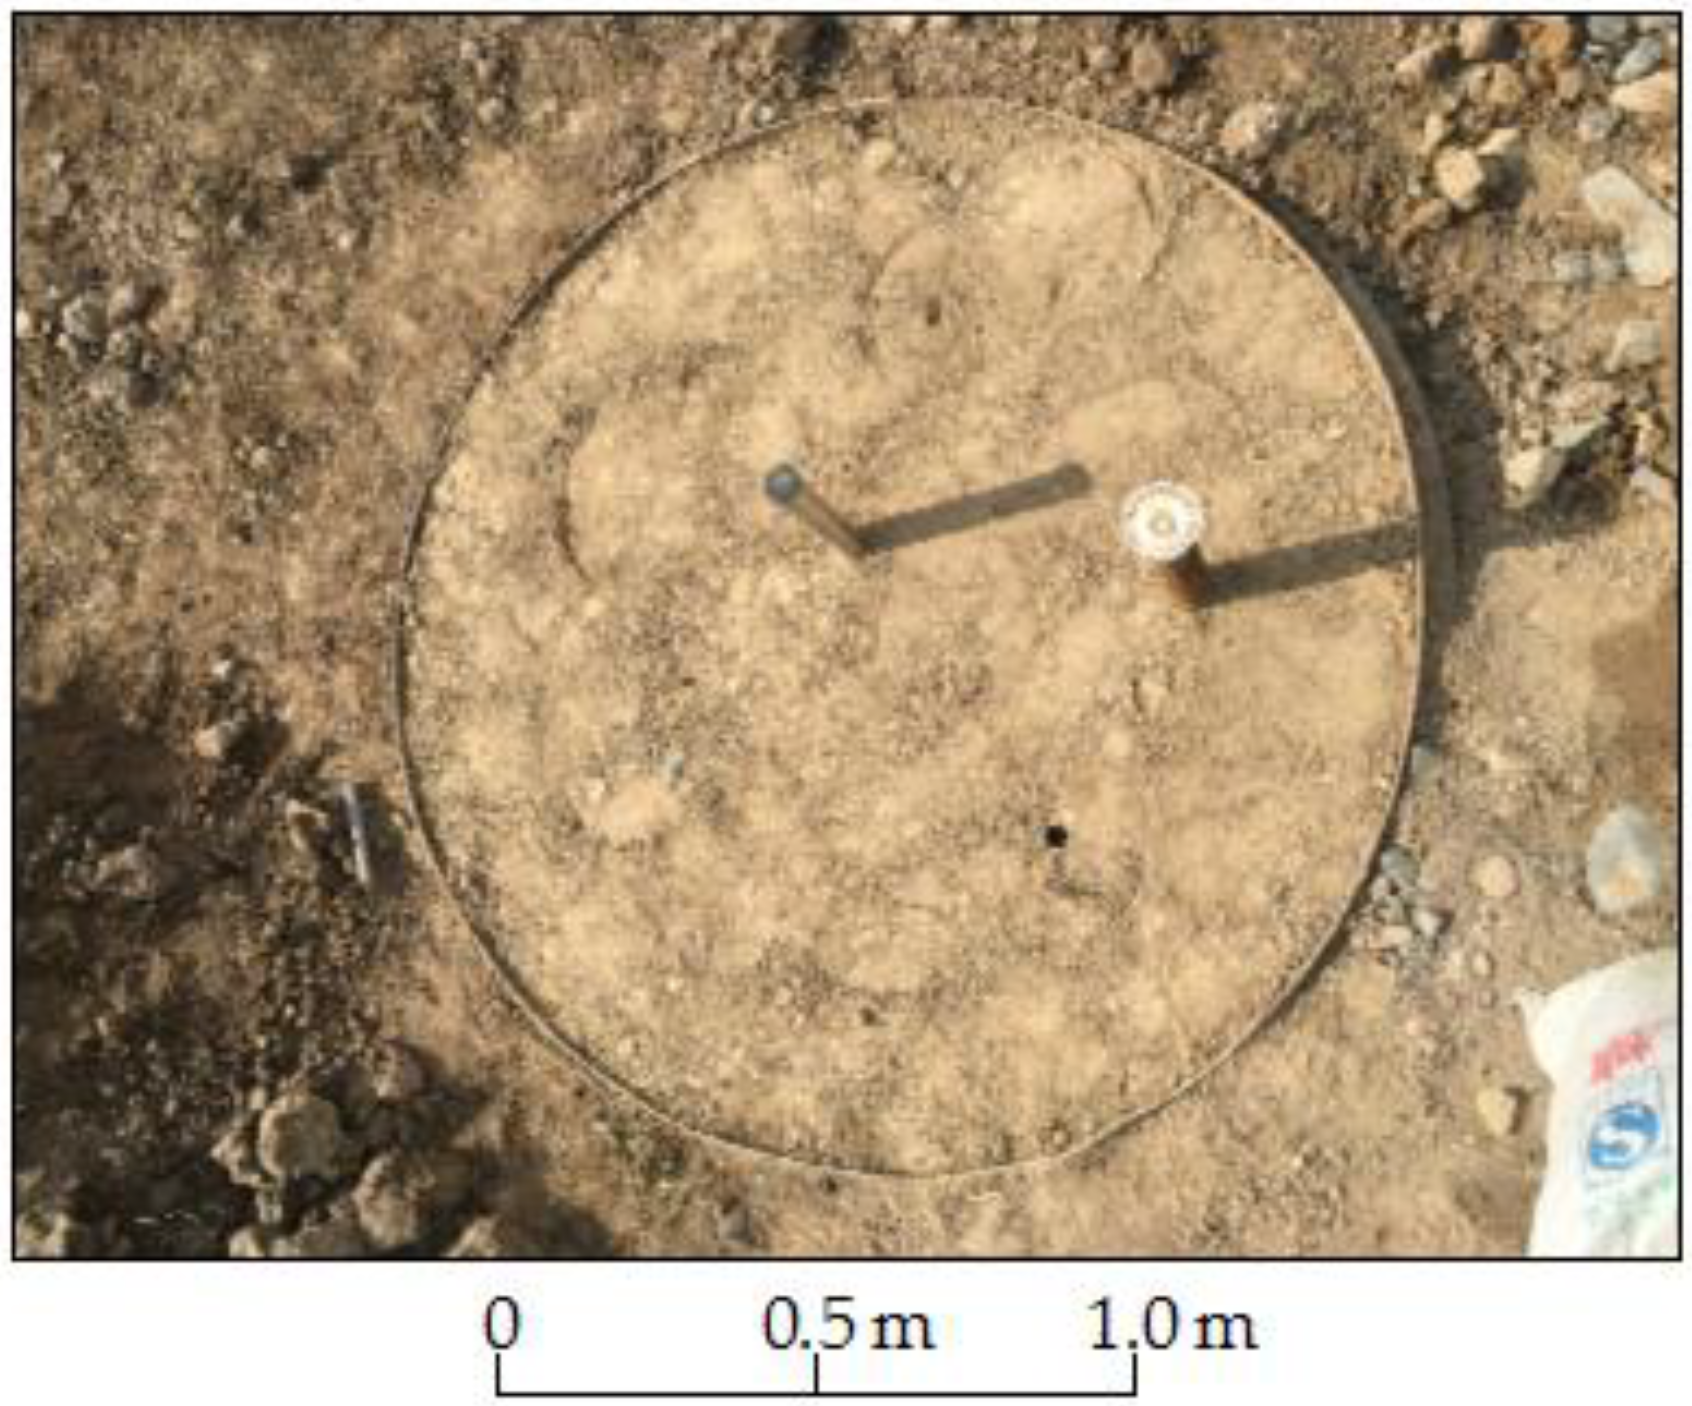
A total of 6 test barrels were used in this test (Figure 3, Figure 4, Figure 5 and Figure 6). The depth of the test barrels was 2 m. The test was divided into 2 groups. In one group, the barrel was backfilled by overlaying soil with a thickness of 30 cm, 50 cm, and 70 cm without compaction, while in the other group, the overlying soil was compacted once by a track-type bulldozer. The lower part of the reclaimed soil was backfilled with limestone waste rocks. The plate load test (Figure 7) was used to simulate the compaction of the bulldozer based on the intensity of pressure of the bulldozer on the ground, which was different from previous conventional drop weight tests. In the management period, watering was conducted in accordance with the empirical value of the irrigation volume and the number of times of irrigation in the land reclamation and management period of the mine area in the foothills of Xinjiang Tianshan Mountains (Figure 8 and Figure 9). The irrigation volume was related to the thickness of the soil layer. The thicker the soil layer was, the greater the irrigation volume would be. Irrigation was carried out a total of three times in the period of management. After one year of management, samples were taken at depths of 10 cm, 30 cm, 50 cm, and 70 cm depending on the thickness of the overlaying soil, and the weight of each sample was 400 g. The samples were then taken into the laboratory for particle size analysis. Sieving analysis was adopted as the soil has a high content of sand and low content of clay (Figure 10). At the same time, the undisturbed soil samples were taken at the corresponding depth for laboratory tests of its density and water content.
3. Results and Discussions
3.1. Experimental Data Processing
A total of 18 soil samples were obtained after a one-year management period for particle size analysis. This sampling can be conducted at the depth of the interface between the reclaimed soil and waste rock, mainly because varying degrees of subsidence (Figure 8) occurred in the overlaying soil of the reclaimed soil due to surface irrigation during the one-year period of management, and some of the soil particles could enter the lower part of the waste rock. In order to ensure the accuracy of the physical properties of soil (density, porosity, water content), another three samples were taken from each depth. Table 1 lists the experimental results.
3.2. Granulometric Composition Analysis of Reclaimed Soil after the Management Period
3.2.1. Analysis of the Factors Affecting the Changes in Granulometric Composition of Reclaimed Soil after the Management Period
According to the Kalkiski soil classification system for soil particle sizes [29], 0.25 mm was used as the classification standard to distinguish between fine sand and medium sand; in the international standard for soil particle size classification, 0.2 mm is used as the classification standard to distinguish between coarse sand and fine sand, while in soil science and soil mechanics, 0.1 mm is taken as the classification standard to distinguish between fine and coarse particles. In order to reflect the change in the granulometric composition of reclaimed soil after the one-year management period, 0.25 mm, 0.1 mm, and d50 were studied as the focus of analysis. For the data on the granulometric composition of the reclaimed soil after the one-year management period (Table 1), variance analysis was done with the use of the multivariate in the general linear model in IBM SPSS Statistics (IBM, Chicago, IL, US); the percentage of particles with a size of ≤0.25 mm, ≤0.1 mm, and d50 were used as the dependent variables, and soil thickness and sampling depth as fixed factors. Table 2 lists the results of variance analysis. The results show that soil thickness has an insignificant effect on particle distribution (p > 0.05), and sampling depth has a significant effect on particle distribution (p < 0.05). The overlying soil of non-metallic mines in the northern foothills of the Tianshan Mountains in Xinjiang is mainly composed of sandy soil with a large amount of sand. In order to reflect the changes in the grain size of reclaimed soils at different depths, especially the changes of the fine particles, the percentage of soil particles with a size of ≤0.25 mm was used in the comparison of particle sizes at different depths. Table 3 lists the comparative analysis results. The results show that the fine particle content at the depth of 70 cm is significantly different from those at other depths (p < 0.05), and there is also a significant difference between the fine particle content at the depth of 10 cm and that at the depth of 30 cm (p = 0.039). The difference between the fine particle content at the depth of 70 cm and the depth at 30 cm is the most significant (p = 0.002).
3.2.2. Analysis of the Granulometric Composition of Reclaimed Soil after the Management Period under Different Overlaying Soil Thickness
The data of Table 1 is plotted into the gradation cumulative curve of the soil particles, where the abscissa is the particle size (mm), and the ordinate is the mass (cumulative percentage) content of the soil which is smaller than a certain particle size. The figure shows the relative content of each particle group in the soil, and it is the basis for calculating d10, d30, and other characteristic values. The uniformity or the gradation of the soil can be roughly judged according to the slope of the curve. A steep curve indicates that the soil particles are relatively uniform, and the quality of corresponding granular group is relatively centralized. The situation is the opposite when the curve is gentle.
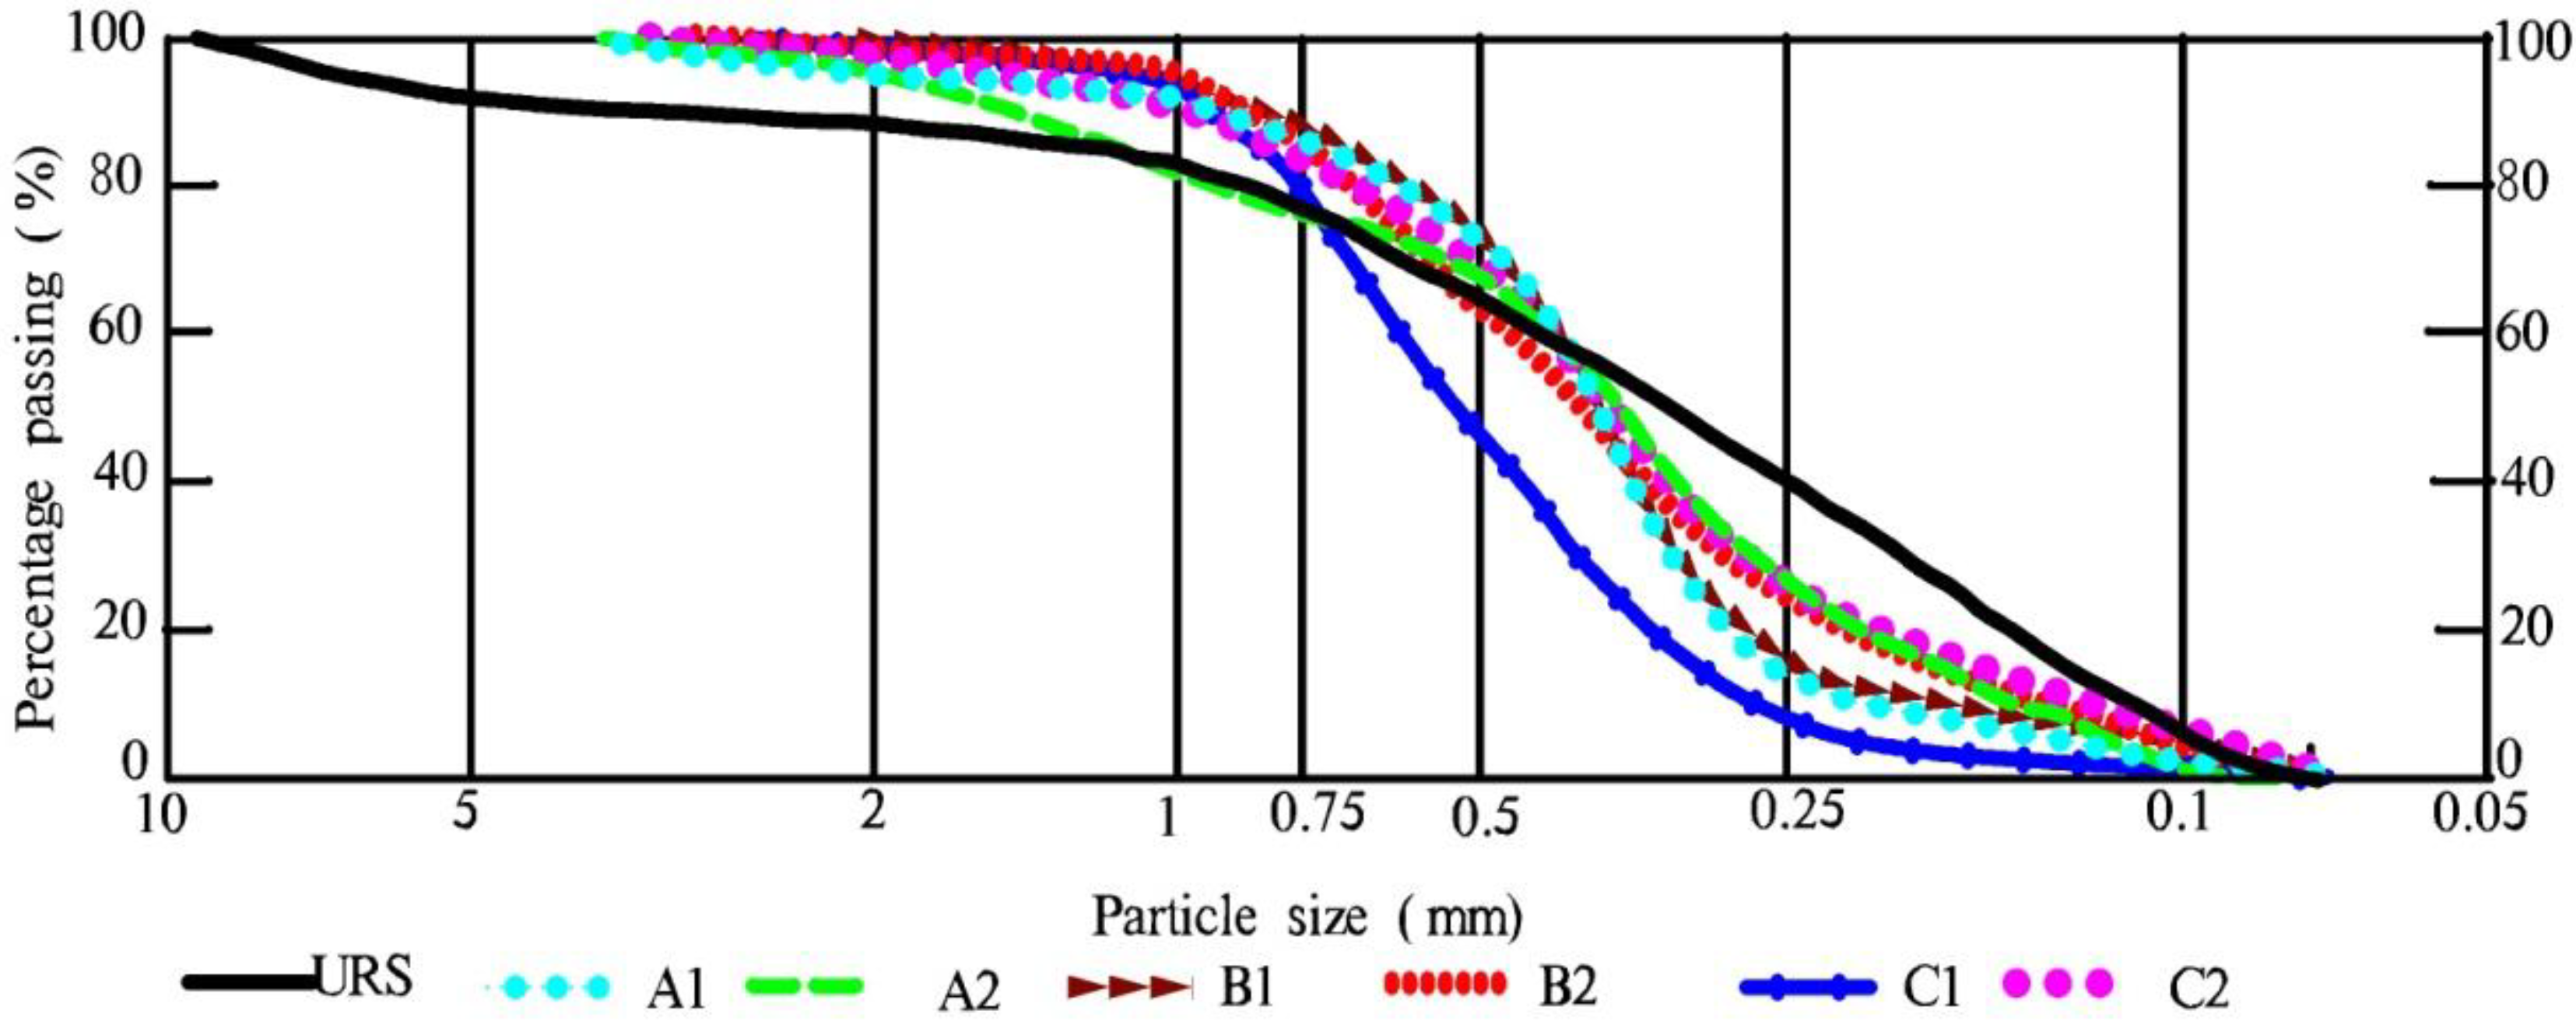
The accumulative curve of the soil particle gradation with an overlaying soil thickness of 30 cm is shown in Figure 11. It shows that when the overlaying soil thickness is 30 cm, regardless of if it is compacted or not, the fine-grained soil content at the sampling depth of 30 cm is significantly smaller than that of the undisturbed reclaimed soil (URS). This is because this depth is the interface between soil and waste rock. The 30 cm overlaying soil is thin and the water would seep into the soil during irrigation, and the seepage process can easily carry the fine particles of the soil down to the pores in the large waste rocks. Fine particle content of the uncompacted reclaimed soil is even smaller than the compacted reclaimed soil at the depth of 30 cm. This is because the surface soil is compacted, the water seepage is slow, and less fine particles would be carried down to the waste rock layer compared with the uncompacted reclaimed soil. In the actual irrigation process, it can also be found that the uncompacted reclaimed soil would display a higher settlement in the process of irrigation compared with the compacted one (Figure 8 and Figure 9). At the depth of 10 cm, the content of fine particles of compacted soil are slightly higher than that of the URS and uncompacted soil, which is mainly because the compaction results in an increase in the content of fine particles [20,23].
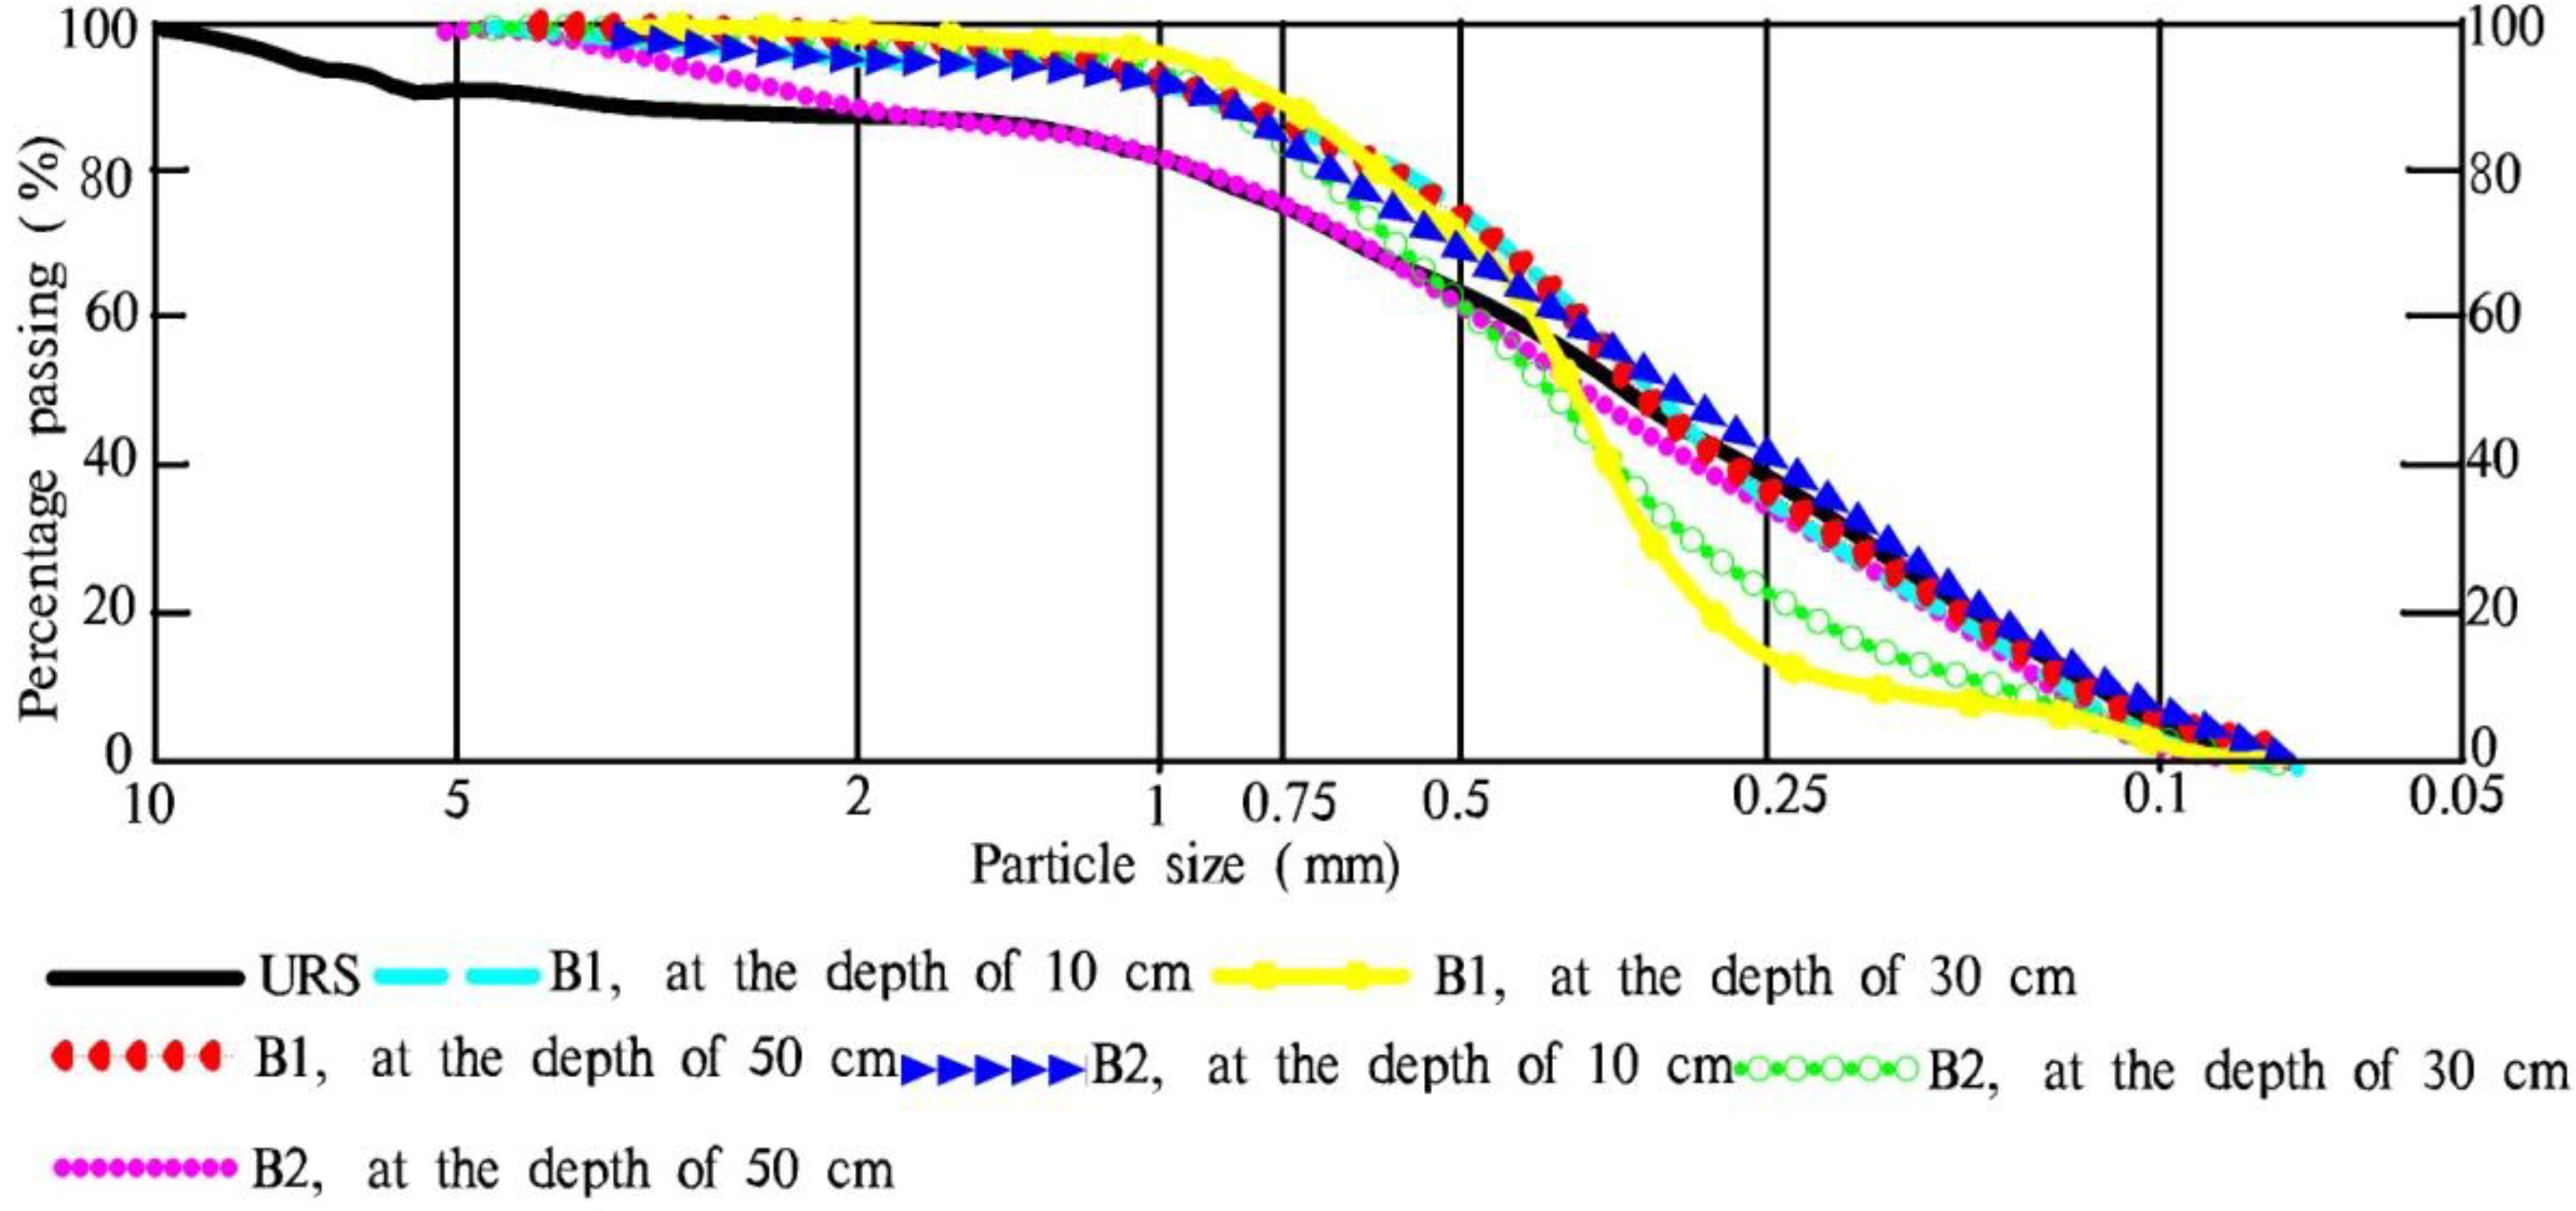
The accumulative curve of the soil particle gradation with an overlaying soil thickness of 50 cm is shown in Figure 12. When the overlaying soil is 50 cm thick, the irrigation volume is larger than that of the 30 cm overlaying soil, and when the thickness of the soil overlayer increases, the seepage time in the soil would be longer. The results show that the fine particle content is significantly less than that of the URS at the depth of 30 cm. Furthermore, the fine particle content in the uncompacted reclaimed soil is much less. This is also the result of the seepage in the soil; that is, the water seeps downward after irrigation, and the seepage is fast in uncompacted soil with a large downward seepage force, resulting in a large loss of fine particles at the depth of 30 cm. At the depth of 50 cm, which is the junction of soil and waste rock, the fine particle content is close to that of the URS. This is mainly because the soil layer is thick and the seepage is slow at this depth, with a smaller seepage force, and thus the loss of fine particles is insignificant.
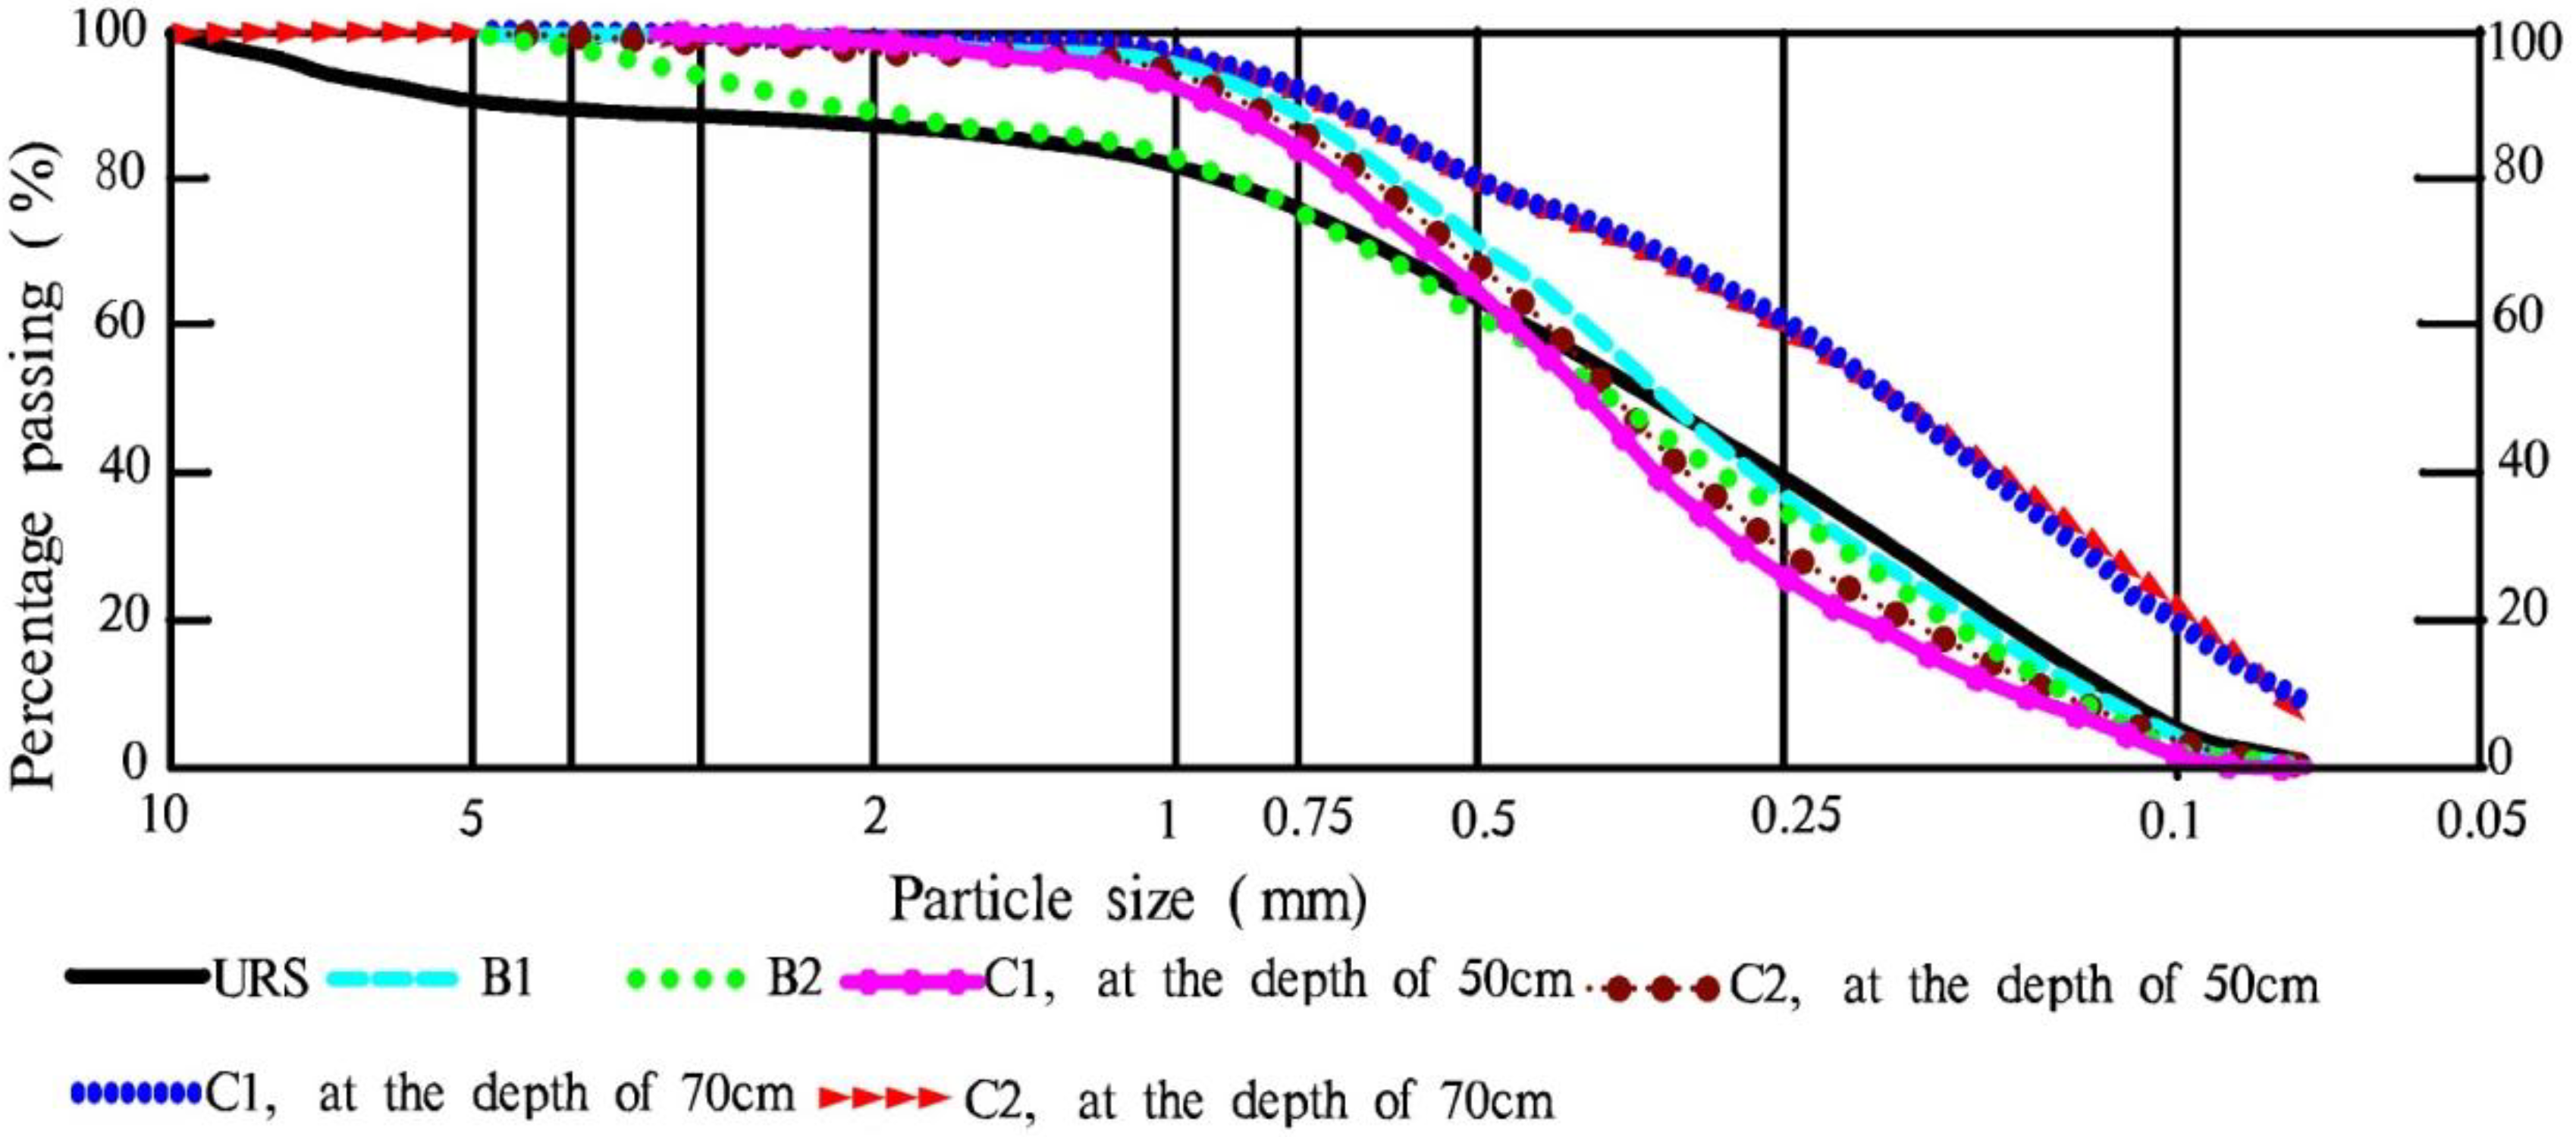
The accumulative curve of the soil particle gradation with an overlaying soil thickness of 70 cm is shown in Figure 13. The thickness of the overlaying soil and the irrigation volume are further increased. The greatest change compared with overlaying soil thicknesses of 30 cm and 50 cm is that the fine particles sharply increase at the depth of 70 cm (the junction of soil and waste rock). This is because, as the soil layer becomes thicker, the fine particle content of the soil would increase, and the downward seepage of the soil would get slower. The finer particles are formed into sedimentation at the depth of 70 cm, resulting in a sharp increase in the fine particles.
3.2.3. Analysis of Change in Granulometric Composition of Reclaimed Soil at Different Depths after the Management Period
Figure 14, Figure 15 and Figure 16 show that after the one-year management period the content of fine particles at the depth of 10 cm is not significantly different from that of the URS, and the content of fine particles of compacted reclaimed soil is slightly higher than that of the URS. This is because the surface compaction results in an increase in the content of fine particles. At the depth of 30 cm, the content of fine particles is lower than that of the URS, and the lowest value arises in the test barrel of uncompacted overlaying soil with a thickness of 70 cm, followed by the test barrels of the uncompacted overlaying soil with thicknesses of 50 cm and 30 cm. At the depth of 50 cm, the fine particle content is slightly lower than that of the URS, while at the depth of 70 cm, the fine particle content is much higher than that of the URS. The main reason for the above-mentioned phenomenon is the irrigation during the management period. The irrigation volume varies with different overlaying soil thicknesses. The thicker the overlaying soil is, the greater the irrigation volume would be. After irrigation, the water starts to flow downward along the pores of the reclaimed soil from the surface. The seepage speed is fast in uncompacted soil and slow in compacted soil. Therefore, from the surface to the deeper part of the reclaimed soil, the seepage speed gradually slows down, and the seepage volume becomes smaller. The seepage speed on the surface of the reclaimed soil is large, with great seepage volume and large downward seepage force, and it could carry the coarse and fine particles in the soil downward, causing the subsidence of the entire surface of the soil and making it dense. Therefore, the content of the fine-grained soil at the depth of 10 cm does not change much compared with the fine particle content of the URS. At the depth of 30 cm, the seepage speed becomes slower and could only carry fine-grained soil into the pores of deep soil; the uncompacted reclaimed soil was loose and the porosity is large, causing the fine-grained soil to move downward, and resulting in a great loss of fine-grained soil. At the overlaying soil thickness of 70 cm, the fine-grained soil content deceases the most greatly because the irrigation volume reaches the maximum. At a depth of 50 cm, the seepage speed further slows down, thus the fine particle content is only slightly reduced. At the depth of 70 cm, the seepage velocity is the slowest, and most of the fine particles are gathered here.
3.2.4. Effects of Changes in Granulometric Composition of Reclaimed Soil to Physical Properties after the Management Period
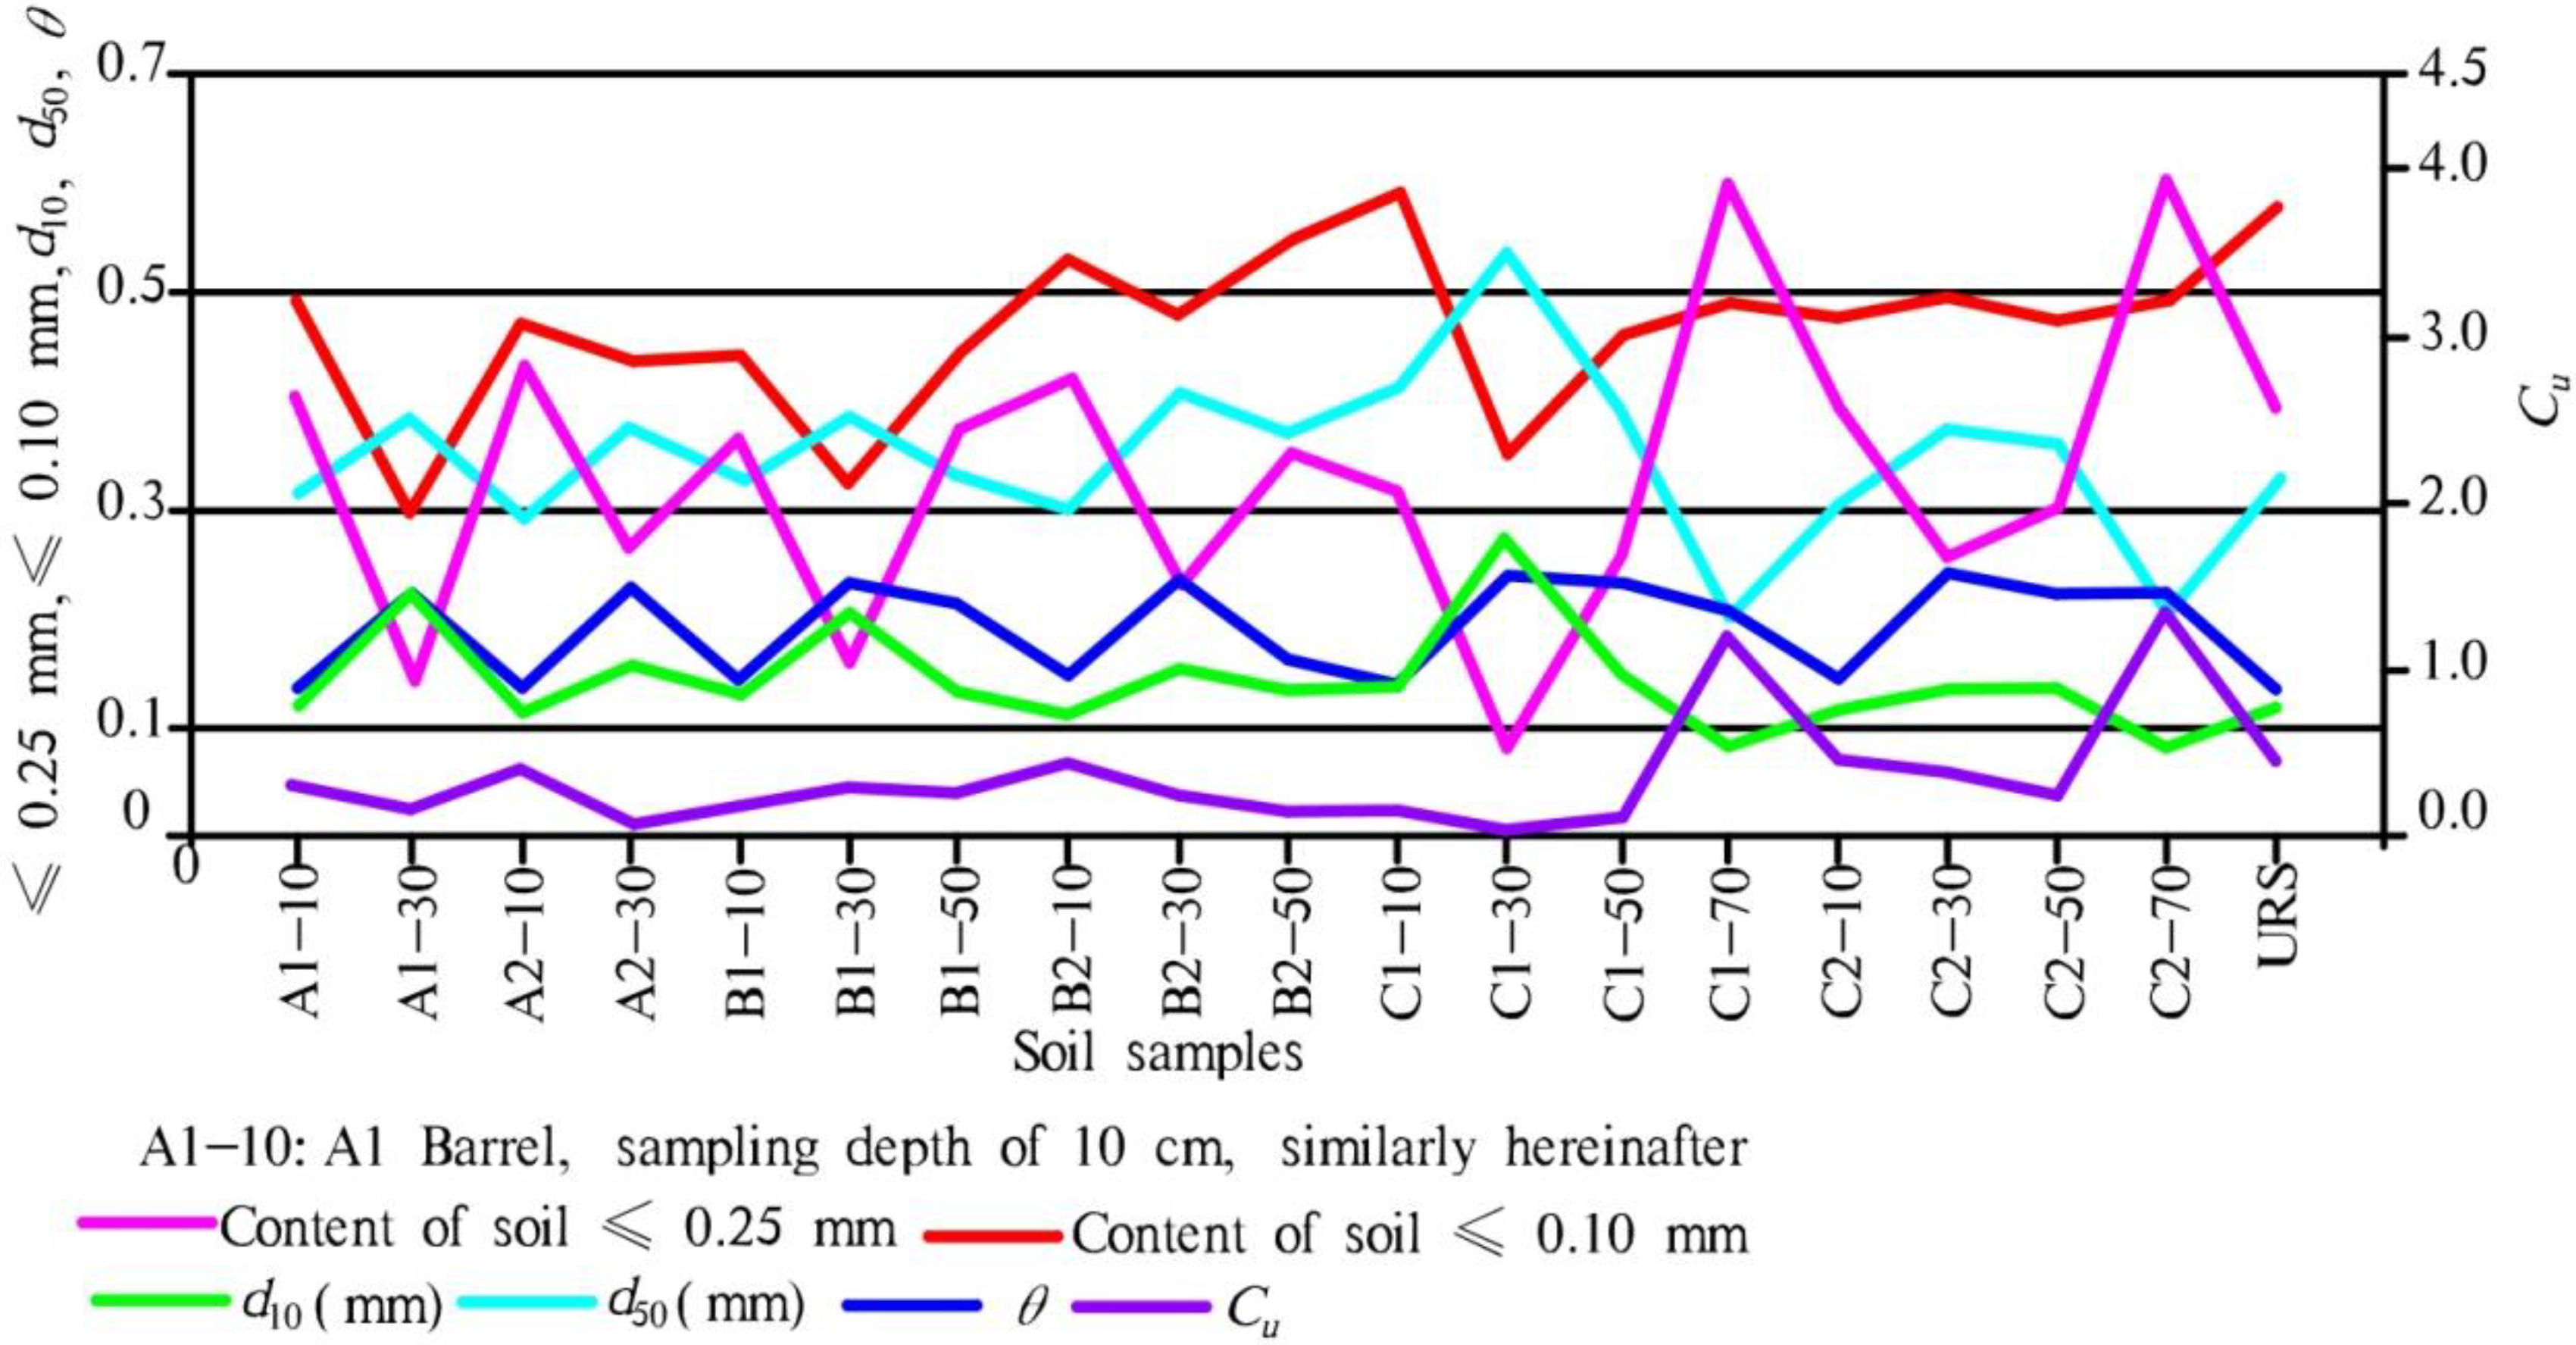
The bivariate correlation analysis method in SPSS was used to analyze the correlation between the variation of soil particle size (especially the change of fine particles) and the physical properties, such as porosity, water content, and soil homogeneity of reclaimed soil. Table 4 lists the degree of correlation between the percentage coposition of soil with a particle size less than or equal to 0.25 mm or 0.1 mm, d10, d50, the coefficient of inhomogeneity Cu, the porosity, and the water content of the soil after the management period; the correlation coefficient grading used Spearman. The results show that there is a significant correlation between the percentage coposition of soil with a particle size less than or equal to 0.25 mm or 0.1 mm, d10, d50, Cu, and the water content of the soil after the management period, and they are unrelated only to the porosity of the soil after the management period. The porosity of the soil is related only to d50. The water content of the soil after the one-year management period is only related to the percentage coposition of soil whose particle size is less than or equal to 0.25 mm, d10, and d50.
The data of correlations was formed into a scatter plot with straight lines (Figure 17 and Figure 18). Figure 17 shows that the percentage content of soil with particle size less than or equal to 0.25 mm is basically consistent with the change trend of the Cu values and the percentage content of the soil whose particle size is less than or equal to 0.1 mm; d10 and d50 are basically consistent with the change trend of the soil water after the management period, and are basically contrary to the change trend of the percentage content of soil with particle size less than or equal to 0.25 and 0.1 mm. Soils with particle size less than or euqal to 0.25 mm and 0.1 mm are all fine-grained soils, and the changes in their contents are mainly affected by the seepage of irrigation water in the reclaimed soil during the period of management, and therefore their changes are positively correlated; the value of the non-uniform coefficient Cu is less than 5, indicating that the reclaimed soil all belongs to homogeneous soil. The non-uniform coefficient of the reclaimed soil after the management period is basically smaller than that of the URS, indicating that the soil becomes homogeneous under the seepage of water; and the reduction of the precentage content of soil whose particle size is less than or equal to 0.25 mm indicates that fine particles have decreased, and the soil is basically composed of coarse particles with a good uniformity. When the fine particle content decreases, the value of the characteristic particle size d10 and d50 would be greater, reflecting a coarser particle size of the soil on the whole. Table 4 shows that the water content of the reclaimed soil after the one-year management period is corelated to the precentage content of the soil with particle size less than or equivalent to 0.25 mm, as well as to d10 and d50. Figure 17 shows that after the one-year management period, the water content of the reclaimed soil is positively corelated to d10 and d50, and negatively corelated to precentage content of the soil whose particle size is less than or equivalent to 0.25 mm. This indicates that the coarser the soil is, the higher the soil water content will be. This is because the water content of the reclaimed soil is generally higher at the depth of 30 cm. This position also happens to be the location with the lowest content of fine particles. At the depth of 10 cm, the water content is low due to the impact of evaporation of the ground, while at this position the particles are relatively finer.
Figure 18 shows that the overall porosity is positively correlated to d50, indicating that the coarser the particles of the reclaimed soil are, the greater the porosity will be. This is quite opposite to the general distribution of porosity in the soil. This is because, if the particle sizes are completely uniform, the porosity of coarse-grained and fine-grained soils will be the same. However, the porosity of coarse-grained soils is usually smaller than that of fine-grained soils, and the pores of coarse-grained soils will be filled with smaller fine particles, while the pores of fine-grained soils will have none or less smaller fine particles to fill in. The porosity of the reclaimed coarse-grained soil is larger than that of the fine-grained soil, because the fine particles in the coarse-grained soil are carried into the deeper part of the reclaimed soil, resulting in a bigger pore volume and porosity.
This paper only includes the uncompacted and one-compaction circumstances, and there were no tests for the situation of multiple compactions. In the future period of this study, the effect of the number of times of compaction on the change in granulometric composition of the reclaimed soil after the management period will be carried out. According to the results of the granulometric composition of the soil after the one-year management period, the most important factor affecting the change in granulometric composition is the transport of the water in the unsaturated zone of the reclaimed soil. The future research could be conducted with a focus on the transport mechanism of the water in reclaimed soil under different overlaying thickness and compaction circumstances.
4. Conclusions
Studying the distribution of fine particles in reclaimed soil is very important for mined land reclamation. This paper uses geotechnical experimental methods to analyze the granulometric composition and the index of physical properties of the reclaimed soil in seepage conditions after a one-year management period. Through experimental results and data analysis, we can conclude that the content of fine particles in reclaimed soil at the depth of the interface between the soil and waste rock varies greatly under seepage after the management period; the thicker the overlaying soil is, the higher the fine particle content at this depth. The sampling depth of reclaimed soil has a significant effect on the granulometric composition of reclaimed soil. The most significant difference is between the depth of 70 cm and 30 cm. The fine particle content varies at different depths of reclaimed soil. The fine particle content at the depth of 10 cm is not much different from that of the URS. The fine particle content of reclaimed soil which has been compacted once at the depth of 10 cm is slightly higher than that of the URS. The fine particle content at the depth of 30 cm is generally lower than that of the URS, and reclaimed soil generally becomes coarser, and the fine particle content of the uncompacted reclaimed soil decreases more significantly. The fine particle content at the depth of 50 cm is slightly lower than that of the URS. Finally, the fine particle content increases sharply at the depth of 70 cm, and is greater than that of the URS.
By comparing the fine grain content of reclaimed soil with the physical properties of soil, we can see that the fine particle content affects the physical properties such as the homogeneity, porosity, and water content; the overall change is that the coarser the particles are, the more uniform the soil particles, the higher the water content, and the larger the porosity will be.
The results of this paper can provide a basis for guaranteeing the survival rate of vegetation in the reclaimed area of Xinjiang during the management period.
Author Contributions
Z.Z. and W.S. conceived the main idea of the paper and designed the test scheme; K.W., G.T., and X.L. performed the test scheme; K.W. and G.T. analyzed the data; Z.Z. wrote the paper; W.S. worked to modify figures and proofread the revised version.
Funding
This research was funded by the Natural Science Foundation of Xinjiang (Grant No. 2018D01C061) and the National Natural Science Foundation of China (Grant No. 41472268).
Conflicts of Interest
The authors declare no conflict of interest.
References
- Hu, Z.; Wei, Z.; Qin, P. Concept and method of soil reengineering in mine reclamation. Soils 2005, 37, 8–12. [Google Scholar] [CrossRef]
- Lv, S.; Gao, P.; Di, G. Fractal characteristics of soil particles and their relationship with soil organic matter in the the Yellow River Delta. J. Soil Water Conserv. 2011, 25, 134–138. (In Chinese) [Google Scholar]
- Séré, G.; Schwartz, C.; Ouvrard, S.; Sauvage, C.; Renat, J.C.; Morel, J.L. Soil construction: A step for ecological reclamation of derelict lands. J. Soils Sediments 2008, 8, 130–136. [Google Scholar] [CrossRef]
- Tang, Q.; Li, L.; Zhang, S.; Zheng, L.; Miao, C. Characterization of heavy metals in coal gangue-reclaimed soils from a coal mining area. J. Geochem. Explor. 2018, 186, 1–11. [Google Scholar] [CrossRef]
- Yuan, Y.; Zhao, Z.; Li, X.; Wang, Y.; Bai, Z. Characteristics of labile organic carbon fractions in reclaimed mine soils: Evidence from three reclaimed forests in the Pingshuo opencast coal mine, China. Sci. Total Environ. 2017, 613–614, 1196–1206. [Google Scholar] [CrossRef]
- Bao, N.; Wu, L.; Ye, B.; Yang, K.; Zhou, W. Assessing soil organic matter of reclaimed soil from a large surface coal mine using a field spectroradiometer in laboratory. Geoderma 2017, 288, 47–55. [Google Scholar] [CrossRef]
- Kim, K.; Chun, S. Finite element analysis to simulate the effect of impact rollers for estimating the influence depth of soil compaction. KSCE J. Civ. Eng. 2016, 20, 2692–2701. [Google Scholar] [CrossRef]
- Götze, P.; Rücknagel, J.; Jacobs, A.; Märländer, B.; Koch, H.; Christen, O. Environmental impacts of different crop rotations in terms of soil compaction. J. Environ. Manag. 2016, 181, 54–63. [Google Scholar] [CrossRef]
- DeLong, C.; Skousen, J.; Pena-Yewtukhiw, E. Bulk Density of Rocky Mine Soils in Forestry Reclamation. Soil Sci. Soc. Am. J. 2012, 76, 1810–1815. [Google Scholar] [CrossRef]
- Wang, J.; Yang, R.; Feng, Y. Spatial variability of reconstructed soil properties and the optimization of sampling number for reclaimed land monitoring in an opencast coal mine. ARAB J. Geosci. 2017, 10, 46. [Google Scholar] [CrossRef]
- Ciarkowska, K. Organic matter transformation and porosity development in non-reclaimed mining soils of different ages and vegetation covers: A field study of soils of the zinc and lead ore area in SE Poland. J. Soils Sediments 2017, 17, 2066–2079. [Google Scholar] [CrossRef]
- Koſodziej, B.; Bryk, M.; Sſowiſska-Jurkiewicz, A.; Otremba, K.; Gilewska, M. Soil physical properties of agriculturally reclaimed area after lignite mine: A case study from central Poland. Soil Till Res. 2016, 163, 54–63. [Google Scholar] [CrossRef]
- Papadopoulos, C.; Gekaa, C.; Pavloudakis, F.; Roumpos, C.; Andreadou, S. Evaluation of the Soil Quality on the Reclaimed Lignite Mine Land in West Macedonia, Greece. Procedia Earth Planet Sci. 2015, 15, 928–932. [Google Scholar] [CrossRef]
- Tanushree, D.; Stehouwer, R.C.; Curtis, J.D. Linking Organic Carbon, Moisture content, and Nitrous Oxide Emission in a Reclaimed Coal Mine Soil. Land Degrad. Dev. 2015, 26, 620–628. [Google Scholar] [CrossRef]
- Cheng, W.; Bian, Z.; Dong, J.; Lei, S. Soil properties in reclaimed farmland by filling subsidence basin due to underground coal mining with mineral wastes in China. Trans. Nonferr. Metal Soc. 2014, 24, 2627–2635. [Google Scholar] [CrossRef]
- Cejpek, J.; Kuráž, V.; Frouz, J. Hydrological properties of soils in reclaimed and unreclaimed sites after Brown-Coal mining. Pol. J. Environ. Stud. 2013, 22, 645–652. [Google Scholar]
- Zhao, Z.; Shahrour, I.; Bai, Z.; Fan, W.; Feng, L.; Li, H. Soils development in opencast coal mine spoils reclaimed for 1–13 years in the West-Northern Loess Plateau of China. Eur. J. Soil Biol. 2013, 55, 40–46. [Google Scholar] [CrossRef]
- Min, X.; Li, X.; Li, Q. Influence of mechanical compaction on reclaimed soil particle size distribution multifractal characteristics. Trans. CSAE 2017, 33, 274–283. [Google Scholar] [CrossRef]
- Wang, J.; Zhang, M.; Bai, Z.; Guo, L. Multi-fractal characteristics of the particle distribution of reconstructed soils and the relationship between soil properties and multi-fractal parameters in an opencast coal-mine dump in a loess area. Environ. Earth Sci. 2015, 73, 4749–4762. [Google Scholar] [CrossRef]
- Wang, J.; Zhang, M.; Bai, Z.; Yang, R.; Guo, L. Multifractal characteristics of soil particle composition in reclaimed coal mine dump in Loess Area. Trans. CSAE 2014, 30, 230–238. [Google Scholar] [CrossRef]
- Huang, X.; Li, X.; Liu, N. Effects of different construction machinery on particle composition of reclaimed soil in coal mining area. J. Soil Water Conserv. 2014, 28, 136–140. [Google Scholar] [CrossRef]
- Li, H.; Yu, J.; Fang, F. Effects of reclamation on soil particle composition, fractal dimension and aggregate. Environ. Sci. Technol. 2015; 38, 11–16, (In Chinese). [Google Scholar] [CrossRef]
- Yu, J.; Fang, L.; Li, H. Particle distribution and fractal characteristics of coal mining subsidence land and its reclaimed soil. J. China Univ. Min. Technol. 2014, 43, 1095–1101. [Google Scholar] [CrossRef]
- Sun, J.; Li, X.; Li, H.; Huang, X. Soil composition mechanism research of different reclamation material in coal mining subsidence area. J. China Coal Soc. 2013, 38, 2215–2220. [Google Scholar]
- Huang, X.; Li, X.; Liu, N. Fractal characteristics of soil particle composition during Different Reclamation Years in coal mining subsidence area. J. China Coal Soc. 2014, 39, 1140–1146. (In Chinese) [Google Scholar]
- Shrestha, R.; Lal, R. Land use impacts on physical properties of 28 years old reclaimed mine soils in Ohio. Plant Soil 2008, 306, 249–260. [Google Scholar] [CrossRef]
- Bartuška, M.; Pawlett, M.; Frouz, J. Particulate organic carbon at reclaimed and unreclaimed post-mining soils and its microbial community composition. CATENA 2015, 131, 92–98. [Google Scholar] [CrossRef]
- Alekseenko, V.L.; Bech, J.; Alekseenko, A.; Shvydkaya, N.; Roca, N. Environmental impact of disposal of coal mining wastes on soils and plants in Rostov Oblast, Russia. J. Geochem. Explor. 2018, 184, 261–270. [Google Scholar] [CrossRef]
- Rousseva, S.S. Data transformations between soil texture schemes. Eur. J. Soil Sci. 1987, 48, 749–758. [Google Scholar] [CrossRef]
Figure 1.
Open-pit mining area.

Figure 2.
Waste rock piles.

Figure 3.
Empty cylindrical test barrels.

Figure 4.
Backfilled waste rock in lower part of test barrels.

Figure 5.
Uncompacted reclaimed soil test barrel.

Figure 6.
Reclaimed soil after one-compaction test barrel.

Figure 7.
Illustration of the setup for plate load test.

Figure 8.
Uncompacted reclaimed soil test barrel after irrigation.

Figure 9.
One-compaction reclaimed soil test barrel after irrigation.

Figure 10.
Sieving method.

Figure 11.
Accumulative curve of particle gradation of soil with overlaying soil thickness of 30 cm (A1 and A2).
Figure 11.
Accumulative curve of particle gradation of soil with overlaying soil thickness of 30 cm (A1 and A2).

Figure 12.
Accumulative curve of particle gradation of soil with overlaying soil thickness of 50 cm (B1 and B2).
Figure 12.
Accumulative curve of particle gradation of soil with overlaying soil thickness of 50 cm (B1 and B2).

Figure 13.
Accumulative curve of particle gradation of soil with overlaying soil thickness of 70 cm (C1 and C2).
Figure 13.
Accumulative curve of particle gradation of soil with overlaying soil thickness of 70 cm (C1 and C2).

Figure 14.
Accumulative curve of particle gradation of soil at the sampling depth of 10 cm.

Figure 15.
Accumulative curve of particle gradation of soil at the sampling depth of 30 cm.

Figure 16.
Accumulative curve of particle gradation of soil at the sampling depths of 50 cm and 70 cm.
Figure 16.
Accumulative curve of particle gradation of soil at the sampling depths of 50 cm and 70 cm.

Figure 17.
Scatter plot with straight lines of percentage content of soils ≤0.25 mm and ≤0.1 mm, d10, d50, Cu, and θ.
Figure 17.
Scatter plot with straight lines of percentage content of soils ≤0.25 mm and ≤0.1 mm, d10, d50, Cu, and θ.

Figure 18.
Scatter plot with straight lines of d50 and n.


Table 1.
Results of the reclaimed soil particle size analysis after a one-year management period.
| Test Barrel No. | Sampling Depth (cm) | Percentage (%) of Soil with Particle Size Less than dx (mm) by Mass | Characteristic Particle Size (mm) | Cu | n | θ (%) | ||||||||||
|---|---|---|---|---|---|---|---|---|---|---|---|---|---|---|---|---|
| ≤10.0 | ≤5.0 | ≤2.0 | ≤1.0 | ≤0.5 | ≤0.25 | ≤0.1 | ≤0.075 | d10 | d30 | d50 | d60 | |||||
| A1 | 10 | 100 | 100 | 93.54 | 91.11 | 70.53 | 40.08 | 4.43 | 0.8 | 0.12 | 0.20 | 0.32 | 0.39 | 3.20 | 0.542 | 13.70 |
| A1 | 30 | 100 | 100 | 94.19 | 90.44 | 71.38 | 13.96 | 2.42 | 0.28 | 0.23 | 0.32 | 0.39 | 0.43 | 1.92 | 0.520 | 23.28 |
| A2 | 10 | 100 | 100 | 91.41 | 83.26 | 74.58 | 43.68 | 6.33 | 1.03 | 0.11 | 0.18 | 0.29 | 0.36 | 3.13 | 0.489 | 13.60 |
| A2 | 30 | 100 | 100 | 94.35 | 81.15 | 66.22 | 26.32 | 0.85 | 0.32 | 0.16 | 0.28 | 0.38 | 0.45 | 2.85 | 0.503 | 23.23 |
| B1 | 10 | 100 | 100 | 95.76 | 92.33 | 73.95 | 36.60 | 2.65 | 0.30 | 0.13 | 0.22 | 0.33 | 0.39 | 2.90 | 0.536 | 13.93 |
| B1 | 30 | 100 | 100 | 98.96 | 93.16 | 71.91 | 15.41 | 4.61 | 1.13 | 0.21 | 0.31 | 0.39 | 0.43 | 2.09 | 0.523 | 23.73 |
| B1 | 50 | 100 | 100 | 98.56 | 96.11 | 71.68 | 37.58 | 3.83 | 0.53 | 0.13 | 0.22 | 0.33 | 0.38 | 2.88 | 0.510 | 21.52 |
| B2 | 10 | 100 | 100 | 97.01 | 91.06 | 69.66 | 42.71 | 7.41 | 0.98 | 0.11 | 0.19 | 0.30 | 0.39 | 3.48 | 0.504 | 14.00 |
| B2 | 30 | 100 | 100 | 97.35 | 93.50 | 61.90 | 23.40 | 3.45 | 0.87 | 0.15 | 0.29 | 0.41 | 0.49 | 3.15 | 0.520 | 23.81 |
| B2 | 50 | 100 | 100 | 89.35 | 82.90 | 61.75 | 35.10 | 2.15 | 0.35 | 0.13 | 0.22 | 0.37 | 0.48 | 3.58 | 0.513 | 16.07 |
| C1 | 10 | 100 | 100 | 96.10 | 88.75 | 57.90 | 31.95 | 2.47 | 0.45 | 0.14 | 0.24 | 0.41 | 0.53 | 3.88 | 0.530 | 14.09 |
| C1 | 30 | 100 | 100 | 97.83 | 92.30 | 45.20 | 7.67 | 0.67 | 0.32 | 0.27 | 0.40 | 0.54 | 0.62 | 2.25 | 0.525 | 24.01 |
| C1 | 50 | 100 | 100 | 98.83 | 92.98 | 64.63 | 26.43 | 1.68 | 0.28 | 0.15 | 0.28 | 0.39 | 0.46 | 3.04 | 0.511 | 23.51 |
| C1 | 70 | 100 | 100 | 98.70 | 96.73 | 80.08 | 60.18 | 18.7 | 8.50 | 0.08 | 0.14 | 0.20 | 0.26 | 3.23 | 0.472 | 20.93 |
| C2 | 10 | 100 | 100 | 97.02 | 95.19 | 79.14 | 39.46 | 6.33 | 0.95 | 0.12 | 0.20 | 0.31 | 0.36 | 3.11 | 0.515 | 13.85 |
| C2 | 30 | 100 | 100 | 96.29 | 89.74 | 67.84 | 25.66 | 5.73 | 0.50 | 0.14 | 0.28 | 0.38 | 0.44 | 3.24 | 0.520 | 24.19 |
| C2 | 50 | 100 | 100 | 97.90 | 94.52 | 68.34 | 30.24 | 3.71 | 0.88 | 0.14 | 0.25 | 0.37 | 0.43 | 3.13 | 0.504 | 22.28 |
| C2 | 70 | 100 | 100 | 98.49 | 96.84 | 80.16 | 60.23 | 21.8 | 6.67 | 0.08 | 0.09 | 0.19 | 0.26 | 3.20 | 0.492 | 22.44 |
| URS | - | 100 | 90.97 | 87.56 | 81.83 | 63.70 | 39.58 | 5.45 | 0.70 | 0.12 | 0.19 | 0.34 | 0.45 | 3.77 | 0.577 | 13.58 |
Note: Test barrel A represents overlaying soil thickness of 30 cm, B represents overlaying soil thickness of 50 cm, and C represents overlaying soil thickness of 70 cm; 1 represents uncompacted, and 2 represents compacted; A1 represents that the overlaying soil thickness is 10 cm and is uncompacted. d10 is the effective particle. d50 is the average particle size. Cu = d60/d10 is the non-uniform coefficient of the soil; Cu ≥ 5 indicates non-homogeneous soils, and Cu < 5 indicates homogeneous soils. URS represents a sample of undisturbed reclaimed soil. n represents porosity. θ represents volumetric water content.
Table 2.
Test results of the inter-subject effect after variance analysis.
| Source | Dependent Variables | III-Type Sum of Square | df | Mean Square | F | Sig. |
|---|---|---|---|---|---|---|
| Correction Model | ≤0.25 mm | 2179.926 a | 5 | 435.985 | 3.987 | 0.023 |
| ≤0.1 mm | 506.317 b | 5 | 101.263 | 25.118 | 0.000 | |
| d50 | 0.066 c | 5 | 0.013 | 3.352 | 0.040 | |
| Intercept | ≤0.25 mm | 17,383.524 | 1 | 17,383.524 | 158.963 | 0.000 |
| ≤0.1 mm | 713.252 | 1 | 713.252 | 176.922 | 0.000 | |
| d50 | 1.161 | 1 | 1.161 | 293.865 | 0.000 | |
| Soil Thickness | ≤0.25 mm | 12.190 | 2 | 6.095 | 0.056 | 0.946 |
| ≤0.1 mm | 2.179 | 2 | 1.090 | 0.270 | 0.768 | |
| d50 | 0.005 | 2 | 0.003 | 0.677 | 0.527 | |
| Sampling Depth | ≤0.25 mm | 2017.396 | 3 | 672.465 | 6.149 | 0.009 |
| ≤0.1 mm | 440.730 | 3 | 146.910 | 36.441 | 0.000 | |
| d50 | 0.065 | 3 | 0.022 | 5.492 | 0.013 |
Note: a R square = 0.624 (adjusted R square = 0.468); b R square = 0.913 (adjusted R square = 0.876); c R square = 0.583 (adjusted R square = 0.409). Sig. = significance, the values are the statistical p value, if p < 0.05, the difference is significant.
Table 3.
Results of multiple comparative analyses.
| Dependent Variables | (I) Sampling Depth (cm) | (J) Sampling Depth (cm) | Difference in the Means (I−J) | Standard Deviation | Sig. | 95% Confidence Interval | |
|---|---|---|---|---|---|---|---|
| Lower Limit | Upper Limit | ||||||
| ≤0.25 mm | 10 | 30 | 14.0100 a | 6.03754 | 0.039 | 0.8553 | 27.1647 |
| 50 | 12.0758 | 6.75017 | 0.099 | −2.6315 | 26.7832 | ||
| 70 | −20.7917 a | 8.53837 | 0.031 | −39.3952 | −2.1882 | ||
| 30 | 10 | −14.0100 a | 6.03754 | 0.039 | −27.1647 | −0.8553 | |
| 50 | −1.9342 | 6.75017 | 0.779 | −16.6415 | 12.7732 | ||
| 70 | −34.8017 a | 8.53837 | 0.002 | −53.4052 | −16.1982 | ||
| 50 | 10 | −12.0758 | 6.75017 | 0.099 | −26.7832 | 2.6315 | |
| 30 | 1.9342 | 6.75017 | 0.779 | −12.7732 | 16.6415 | ||
| 70 | −32.8675 a | 9.05631 | 0.003 | −52.5995 | −13.1355 | ||
| 70 | 10 | 20.7917 a | 8.53837 | 0.031 | 2.1882 | 39.3952 | |
| 30 | 34.8017 a | 8.53837 | 0.002 | 16.1982 | 53.4052 | ||
| 50 | 32.8675 a | 9.05631 | 0.003 | 13.1355 | 52.5995 | ||
Note: a The difference of means is significant at 0.05 level; Sig. = significance.
Table 4.
Spearman grading correlation coefficient results.
| ≤0.25 mm | ≤0.1 mm | d10 | d50 | Cu | n | θ | |||
|---|---|---|---|---|---|---|---|---|---|
| Rho of Spearman | ≤0.25 mm | Correlation coefficient | 1.000 | 0.727 a | −0.967 a | −0.904 a | 0.532 b | −0.393 | −0.742 a |
| Sig. (bilateral) | - | 0.000 | 0.000 | 0.000 | 0.019 | 0.096 | 0.000 | ||
| N | 19 | 19 | 19 | 19 | 19 | 19 | 19 | ||
| ≤0.1 mm | Correlation coefficient | 0.727 a | 1.000 | −0.812 a | −0.806 a | 0.404 | −0.353 | −0.365 | |
| Sig. (bilateral) | 0.000 | - | 0.000 | 0.000 | 0.087 | 0.138 | 0.124 | ||
| N | 19 | 19 | 19 | 19 | 19 | 19 | 19 | ||
| d10 | Correlation coefficient | −0.967 a | −0.812 a | 1.000 | 0.914 a | −0.581 a | 0.368 | 0.686 a | |
| Sig. (bilateral) | 0.000 | 0.000 | - | 0.000 | 0.009 | 0.121 | 0.001 | ||
| N | 19 | 19 | 19 | 19 | 19 | 19 | 19 | ||
| d50 | Correlation coefficient | −0.904 a | −0.806 a | 0.914 a | 1.000 | −0.279 | 0.484 b | 0.611 a | |
| Sig. (bilateral) | 0.000 | 0.000 | 0.000 | - | 0.247 | 0.036 | 0.005 | ||
| N | 19 | 19 | 19 | 19 | 19 | 19 | 19 | ||
| Cu | Correlation coefficient | 0.532 b | 0.404 | −0.581 a | −0.279 | 1.000 | 0.007 | −0.419 | |
| Sig. (bilateral) | 0.019 | 0.087 | 0.009 | 0.247 | - | 0.977 | 0.074 | ||
| N | 19 | 19 | 19 | 19 | 19 | 19 | 19 | ||
| n | Correlation coefficient | −0.393 | −0.353 | 0.368 | 0.484 b | 0.007 | 1.000 | −0.068 | |
| Sig. (bilateral) | 0.096 | 0.138 | 0.121 | 0.036 | 0.977 | - | 0.781 | ||
| N | 19 | 19 | 19 | 19 | 19 | 19 | 19 | ||
| θ | Correlation coefficient | −0.742 a | −0.365 | 0.686 a | 0.611 a | −0.419 | −0.068 | 1.000 | |
| Sig. (bilateral) | 0.000 | 0.124 | 0.001 | 0.005 | 0.074 | 0.781 | - | ||
| N | 19 | 19 | 19 | 19 | 19 | 19 | 19 | ||
Note: a represents that when the confidence level (double test) is 0.01, the correlation is significant. b represents that the correlation is significant when the confidence level (double test) is 0.05.
© 2018 by the authors. Licensee MDPI, Basel, Switzerland. This article is an open access article distributed under the terms and conditions of the Creative Commons Attribution (CC BY) license (http://creativecommons.org/licenses/by/4.0/).
Share and Cite
MDPI and ACS Style
Zhang, Z.; Sui, W.; Wang, K.; Tang, G.; Li, X. Changes in Particle Size Composition under Seepage Conditions of Reclaimed Soil in Xinjiang, China. Processes 2018, 6, 201. https://doi.org/10.3390/pr6100201
AMA Style
Zhang Z, Sui W, Wang K, Tang G, Li X. Changes in Particle Size Composition under Seepage Conditions of Reclaimed Soil in Xinjiang, China. Processes. 2018; 6(10):201. https://doi.org/10.3390/pr6100201
Chicago/Turabian StyleZhang, Zizhao, Wanghua Sui, Kaikai Wang, Guobin Tang, and Xiaoping Li. 2018. "Changes in Particle Size Composition under Seepage Conditions of Reclaimed Soil in Xinjiang, China" Processes 6, no. 10: 201. https://doi.org/10.3390/pr6100201
Note that from the first issue of 2016, this journal uses article numbers instead of page numbers. See further details here.