1. Introduction
Coal combusted in power plants is the main source of energy in Poland. As a by-product, considerable quantities of solid waste, ash, and flue gases are generated. Flue gas purification consists of the removal of solid particles, nitrogen oxides, and sulfur oxides. As a result of desulphurization, where the most commonly used method is wet lime [
1,
2,
3,
4,
5,
6,
7,
8], a significant amount of wastewater is generated.
Wastewater from the wet flue gas desulphurization (FGD) system is characterized by a high content of inorganic compounds in the form of salts, primarily gypsum [
9,
10]. Salinity can be above 20,000 mg/L chlorides and 2000 mg/L sulfates(VI). In addition, heavy metals and organic compounds are also present in wastewater. The main factors influencing the quality and quantity of wastewater generated are the parameters of the coal, combustion, and the FGD system hydraulic load.
For the treatment of FGD wastewater, various methods have been used, including coagulation [
3,
9,
10,
11,
12,
13], filtration [
3,
10], alkalization for hydroxide precipitation [
3,
10], sedimentation [
3,
10], adsorption on gypsum [
14] or ferrate(VI) [
15], Fe
0 usage [
6], Fe
0/H
2O
2 process [
16], and pollutants’ complexation [
17]. However, these methods do not effectively reduce the high salinity of wastewater. Effective FGD wastewater desalination can be carried out using membrane or evaporative technologies, but the complex composition of the matrix makes such technologies difficult to apply and not economically viable.
Furthermore, FGD wastewater must be treated in a manner consistent with the best available technique (BAT) in large combustion plants [
18], Polish legal regulations, and integrated water permits obtained by the system power plant.
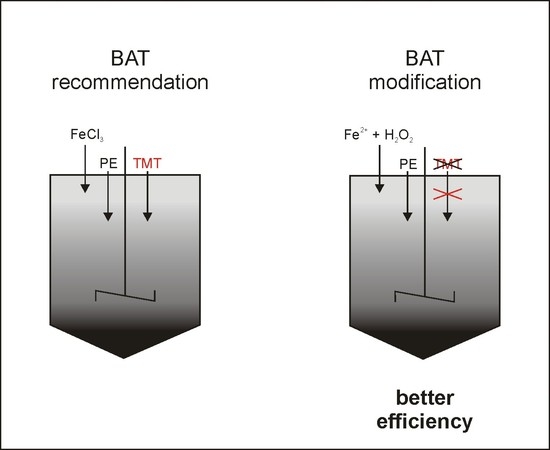
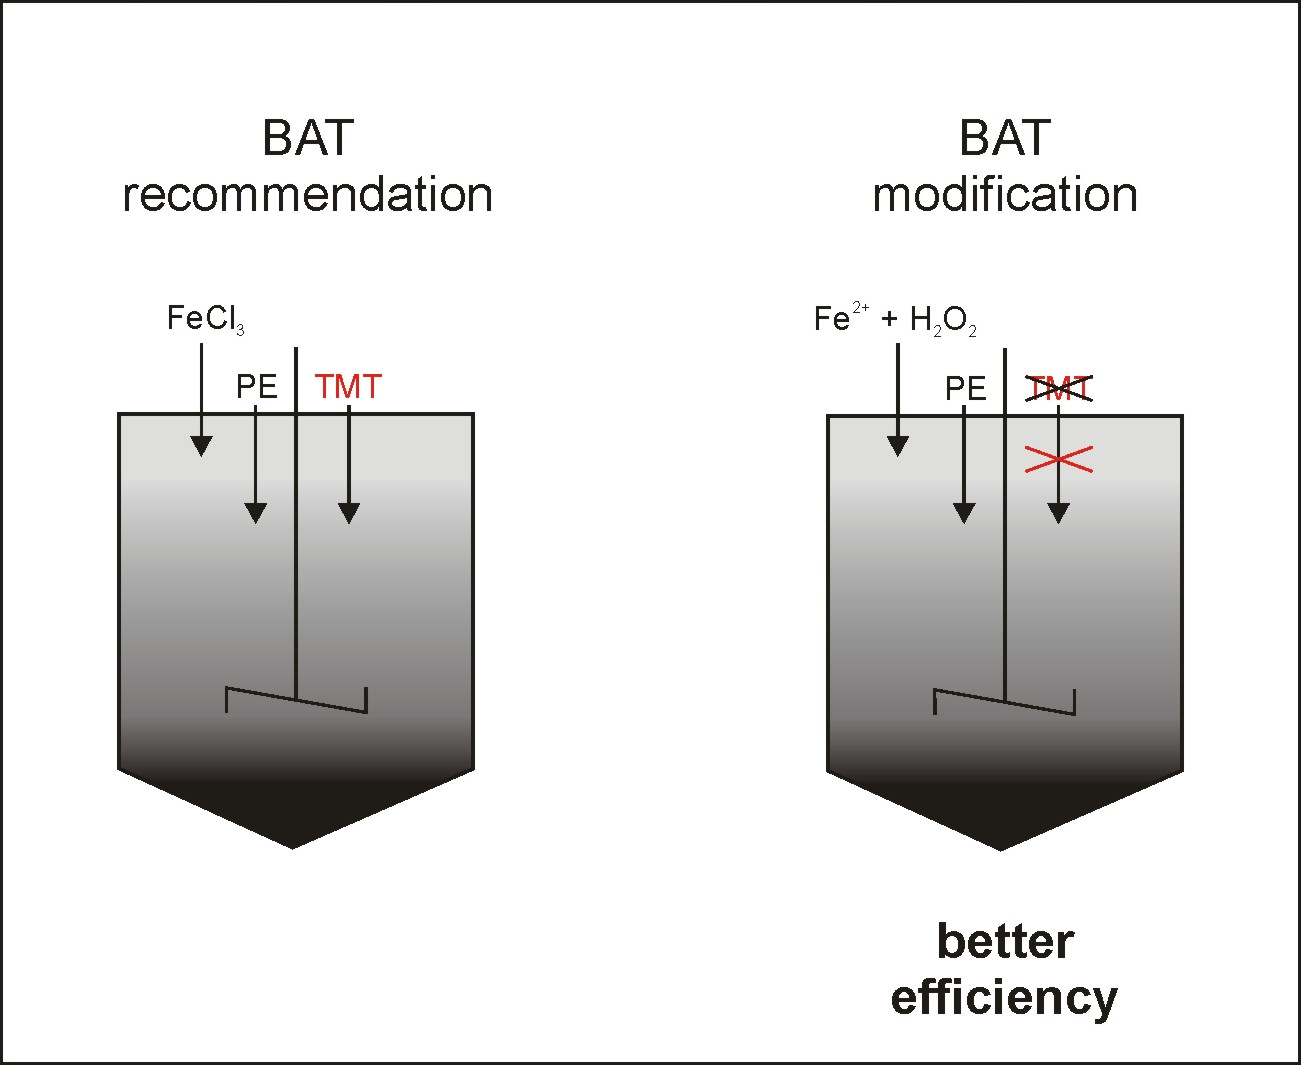
Based on the BAT, the most common wastewater treatment technology uses dual iron salt coagulation, initially at pH 6.0 and then at 8.5, performed simultaneouslywith the complexation of heavy metals with the use of TMT-15 (15% aqueous solution of an organic sulfide, trisodium 1,3,5-triazine-2,4,6-trithiolate). The use of such treatment technology may be insufficient to meet legal requirements. As such, there is a need to search for more efficient FGD wastewater treatment methods.
Advanced oxidation processes (AOP), such as the Fenton process, are promising unconventional treatment methods for wastewater containing concentrated and potentially toxic compounds. AOP methods consist of the efficient production of free radicals (primarily HO•) that effectively oxidize pollutants contained in the wastewater.
In the heterogenic Fenton process (Fe
0/H
2O
2 process), metallic iron (Fe
0, zero-valent iron, ZVI) in acidic conditions is an Fe
2+ ion source. Fe
2+ ions in the presence of H
2O
2 undergo oxidation to Fe
3+, while H
2O
2 undergoes conversion to HO
• and OH
−, as in the classical homogeneous Fenton process. Adding Fe
0 into the aqueous phase starts two catalytic mechanisms. The first one is heterogenic catalysis, related tothe presence of dispersed Fe
0 phase. On the solids’ surface, numerous processes take place, including oxidation and reduction of pollutants and catalysts, precipitation and co-precipitation of metal oxides and hydroxides, adsorption, and coagulation. Reactions (1)–(5) allow for divalent iron ion reactions, while reactions (6)–(10) describes Fenton process chemistry.
AOPs, such as the Fenton process and its modifications, proved to be very effective in various wastewater treatments [
19]. Metallic iron and other iron-based catalysts were used, interalia, for the treatment of pharmaceuticals [
20,
21], trinitrotoluene (TNT) wastewater [
22], phenols and chlorophenols [
23,
24], pesticides [
25], bisphenol A (BPA) [
26], landfill leachate [
27] or coking wastewater [
28], palm oil mill effluent [
29], nitrite reduction [
30], oil sands reclamation [
31], surfactant removal [
32], and hydraulic fracturing flow back fluid treatment [
33].
Of additional importance, homogenous and heterogeneous Fenton processes meet the technical FGD wastewater treatment requirements of the BAT for large combustion sources in terms of treatment unit processes applied [
18]. As a result of wastewater treatment, significant total organic carbon (TOC), chemical oxygen demand (COD), total suspended solids (TSS), and heavy metals removal should be obtained.
The research was carried out in cooperation with a Polish system power plant operator, with the intention of the BAT conclusions being implemented on an industrial scale. Therefore, the aim of this study was to assess the possibility of using homogenous and heterogeneous Fenton processes for the wet lime method of FGD wastewater treatment as an alternative for the BAT recommended iron-based double coagulation.
2. Materials and Methods
2.1. Sample Collection
Wastewater was collected from an FGD equalization tank in a power plant. After wastewater collection, samples were refrigerated at 4 °C until analysis. The determined parameters and determination methods are shown in
Table 1. All experiments concerning the FGD wastewater treatment were conducted within 72 h of sample collection. The wastewater was subjected to the following processes: heterogeneous Fenton (Fe
0/H
2O
2), homogeneous Fenton (Fe
2+/H
2O
2), and coagulation with iron-based coagulants. All experiments were carried out in duplicate.
2.2. Treatment Processes
The Fe0 used in the experiments was supplied by Hepure (Hepure, Hillsborough, NJ, USA) as Ferox Target (325 mesh). All reagents used were analytical grade.
The Fe0/H2O2 process was carried out in a 1.5 L reactor filled with a 1 L sample. Solid Fe0 (Hepure, Hillsborough, NJ, USA) and 30% H2O2 (Stanlab, Lublin, Poland) solution were used. Wastewater samples were stirred at 500 rpm on a magnetic stirrer (Heidolph MR3000, Schwabach, Germany). The pH during the Fe0/H2O2 process was 3.0. After specified times (15, 30, and 60 min), the Fe0/H2O2 process was stopped by increasing the pH to 8.5 using 3 M NaOH (Stanlab, Lublin, Poland). Samples were left overnight to allow hydrogen peroxide decomposition and iron-based sludge sedimentation.
The Fe2+/H2O2 process was carried out in a 1.5 L reactor filled with a 1 L sample. Fe2+ in a form of acidic FeSO4 (Stanlab, Lublin, Poland) 50 mg Fe2+/mL solution (POCh, Gliwice, Poland) and 30% H2O2 solution (Stanlab, Lublin, Poland) were used. Wastewater samples were stirred at 500 rpm on a magnetic stirrer (Heidolph MR3000, Schwabach, Germany). The pH during the Fenton process was adjusted to 3.0 with 1 M H2SO4 (Stanlab, Lublin, Poland). After the specified times (5, 15, 30, and 60 min), processes were stopped by increasing the pH to 8.5 using 3 M NaOH. Samples were left overnight to allow hydrogen peroxide decomposition and iron-based sludge sedimentation.
Hydrogen peroxide process doses were selected according to sedimented wastewater COD in 0.5:1, 1:1, 2:1, 4:1, and 8:1 COD/H2O2 mass ratios, while divalent iron doses were selected according to 1:2, 1:4, and 1:4 Fe2+/H2O2 mass ratios.
Coagulation was carried out in a 1.5 L reactor filled with 1 L of sample. Commercially available coagulant and TMT-15 solutions (Brenntag, Essen, Germany) were used. Anionic flocculent Flopam AN913SH (SNF, Andrézieux, France) in a concentration of 0.5 mg/mL was used as a flocculent aid. The pH during coagulation was 8.5, the same as after the Fe0/H2O2 and Fe2+/H2O2 processes. The samples were stirred on a magnetic stirrer (Heidolph MR3000, Schwabach, Germany) for 5 min on fast (500 rpm), followed by 10 min on slow (50 rpm) stirring.
2.3. Analytical Methods
The heavy metals were determined according to the PN-EN ISO 11885:2009 standard with ICP-OES Optima 8300 with an ESI–SC (Quartz C2 Dual CyclonicSpray chamber and nebulizer Meinhard type K1 with an ESI–SC Model SC-2DXS autosampler (Perkin Elmer, Waltham, MA, USA)), after microwave mineralization with TITAN MPS (Perkin Elmer, Waltham, MA, USA). The samples were acidified with HNO3 (Merck, Darmstadt, Germany) to a pH of <1.0.
Ions and boron concentrations were determined according to the PN-EN ISO 10304-1:2009 standard with IC (Dionex ICS-5000+, Sunnyvale, CA, USA). Chromatographic column C18 andisocratic elution 36 mmol KOH (Merck, Darmstadt, Germany) were used as the mobile phase. The samples were filtered through the filter sized 0.45 µm and 100× diluted.
TOC was determined according to the EN 1484:1999 standard with a TOC-L analyzer with an ASI-L autosampler (Shimadzu, Kioto, Japan). The combustion temperature was set to 680 °C.
Because of high chloride content, COD could not be determined with an ISO 6060 standard. An alternative DIN 38409-41:1980-12 standard, designed for matrixes with high chloride content, was selected.
Conductivity was determined with WTW (WTW, Weilheim, Germany) Cond 340i with an electrode TeraCon 325 according to the PN-EN 27888:1999 standard, while pH was determined with pH meter WTW 3310 (WTW, Weilheim, Germany) (an electrodeSenTix 41) according to the PN-EN ISO 10523:2012 standard.
2.4. Statystical Analysis
Statistical analyses including a two-way factorial analysis of variance (ANOVA) was performed using R 3.5.1. Statistical Software [
34]. In particular, appropriate two-dimensional contour plots were produced to understand and visualize the main effects and two-way interactions occurring during the series of laboratory analysis.
3. Results and Discussion
3.1. Raw Wastewater and Sedimentation
The parameters of wastewater are shown in
Table 1. The effluent was turbid, with a high content of suspended solids (TSS) which were mainly easily settleable solids (ESS). The wastewater was characterized by significant salinity, a high content of sulfate and chlorides, an intensive milky orange color, and turbidity. This was comparable to values and parameters described in the literature [
3,
9,
10].
Due to the large amount of ESS, sedimentation was effective in the FGD wastewater treatment. This process allowed the complete removal of suspensions (gypsum) and color.
Sedimentation accounted for at least part of the heavy metal removal. In case of Cr, Cu, V, and Pb, the removal was almost complete to 0.026, 0.059, 0.042, and 0.016 mg/L, respectively. However, for the other heavy metals, such as Zn, Ag, and Ni, the removal rate was low. For Cd, no removal was observed. Unfortunately, sedimentation does not allow for any removal of boron. The concentration of boron in wastewater after sedimentation was 336 mg/L, in comparison to 340 mg/L for raw wastewater.
As a result of sedimentation, COD and TOC decreased to 301 and 43.57 mg/L (23.8 and 8.7% removal), respectively. In the case of FGD, wastewater COD is a parameter that is difficult to determine. It is related to a significant amount of chlorides dissolved in wastewater. Because of the chlorides’ high concentration in FGD, which is far higher than 1000 mg/L and exceeds the maximum level for the typical COD ISO 6060 determination method, an alternative DIN 38409-41:1980-12 standard was used. Based on the TOC/COD ratio of 0.12 and knowledge of wastewater origin, it is clear that most of the COD is related to inorganic compounds. Because of this, COD should not be recommended as a parameter to assess the quality of FGD wastewater in terms of organic compound content and should be withdrawn from all legal regulations related to FGD wastewater.
3.2. Heavy Metals Removal
The BAT recommended coagulation did not improve the effect of sedimentation, and the concentrations of selected heavy metals were similar. The only benefit is the increased sedimentation rate. A similar effect was obtained for flocculent aid, whether it was AN913SH or the one used in the power plant. No additional heavy metals removal was obtained, only the sedimentation rate was increased. A combined usage of coagulant and polyelectrolyte allows for sedimentation in less than 1min, which is very important from a technological perspective. TMT-15 was used in order to remove heavy metals. However, the efficiency of the chelating agent in respect to most of heavy metals was negligible. Only in the case of cadmium was the concentration significantly decreased (about 90%). Similarly, but with a much smaller effect, about 50% removal was obtained for copper, but the concentration was ten times lower than that of cadmium.
In contrast to the coagulation process, oxidation allowed for very effective heavy metal removal. This was even more effective than the simultaneous use of the coagulant, polyelectrolyte, and TMT-15 (
Table S1 versus
Tables S2 and S3). It is clear for Cu that, after both the homogenousand heterogeneous Fenton process, the concentration was usually below the detection limit. This was the same case for Pb. Important removals are also obtained for Ni and Zn. In these cases, the metal efficiency of TMT-15 was low. The opposite effect was obtained in the case of Cr. As a result of oxidation, Cr(III) forms undergo oxidation to Cr(VI). Cr(VI) specifically possesses a higher solubility than Cr(III) and, as a result, the total Cr concentration after oxidation processes is slightly higher than in the case of coagulation. Iron, used both in the oxidation processes and in coagulation, is better removed inoxidation. In comparing oxidation processes, greater heavy metal removal was obtained with the Fe
2+/H
2O
2 process. It can be concluded that total heavy metal removal is greater during oxidation processes.
3.3. Boron Removal
Maximum boron removal was obtained from the Fe
2+/H
2O
2 process on sedimented wastewater and 150/300 mg/L Fe
2+/H
2O
2 reagent doses. B concentration was decreased to 212 mg/L (37.6% total removal, from an initial value of 340 mg/L). A similar effect was obtained for the same iron dose and a higher 600 mg/L H
2O
2 dose. For all other doses and process times, lesser effects were obtained. The results obtained for the Fe
0/H
2O
2 process were worse than the Fe
2+/H
2O
2 process. Interestingly, the results obtained for raw wastewater were better than those for the sedimented wastewater. The usage of coagulation with flocculent was a less effective process for boron removal. Even flocculent and TMT-15 usage did not allow for high boron removal. It is also important to note that boron removal efficiency is very sensitive in relation to the coagulant dose. A small change in the dose results in a significant deterioration in the boron removal rate. The results obtained in this study can be compared with the results obtained by Marcinowski et al. [
35]. FGD wastewater was subjected to Al-based coagulation treatment, and obtained boron removal was up to 75.3%. As it is usually accepted for Al coagulation, the important removal mechanism is sorption. For Fe-based coagulants, the intensity of sorption is lower. This corresponds with the lower B removal rate for both coagulation and oxidation processes. However, this hypothesis requires confirmation through further research.
3.4. TOC and COD Removal
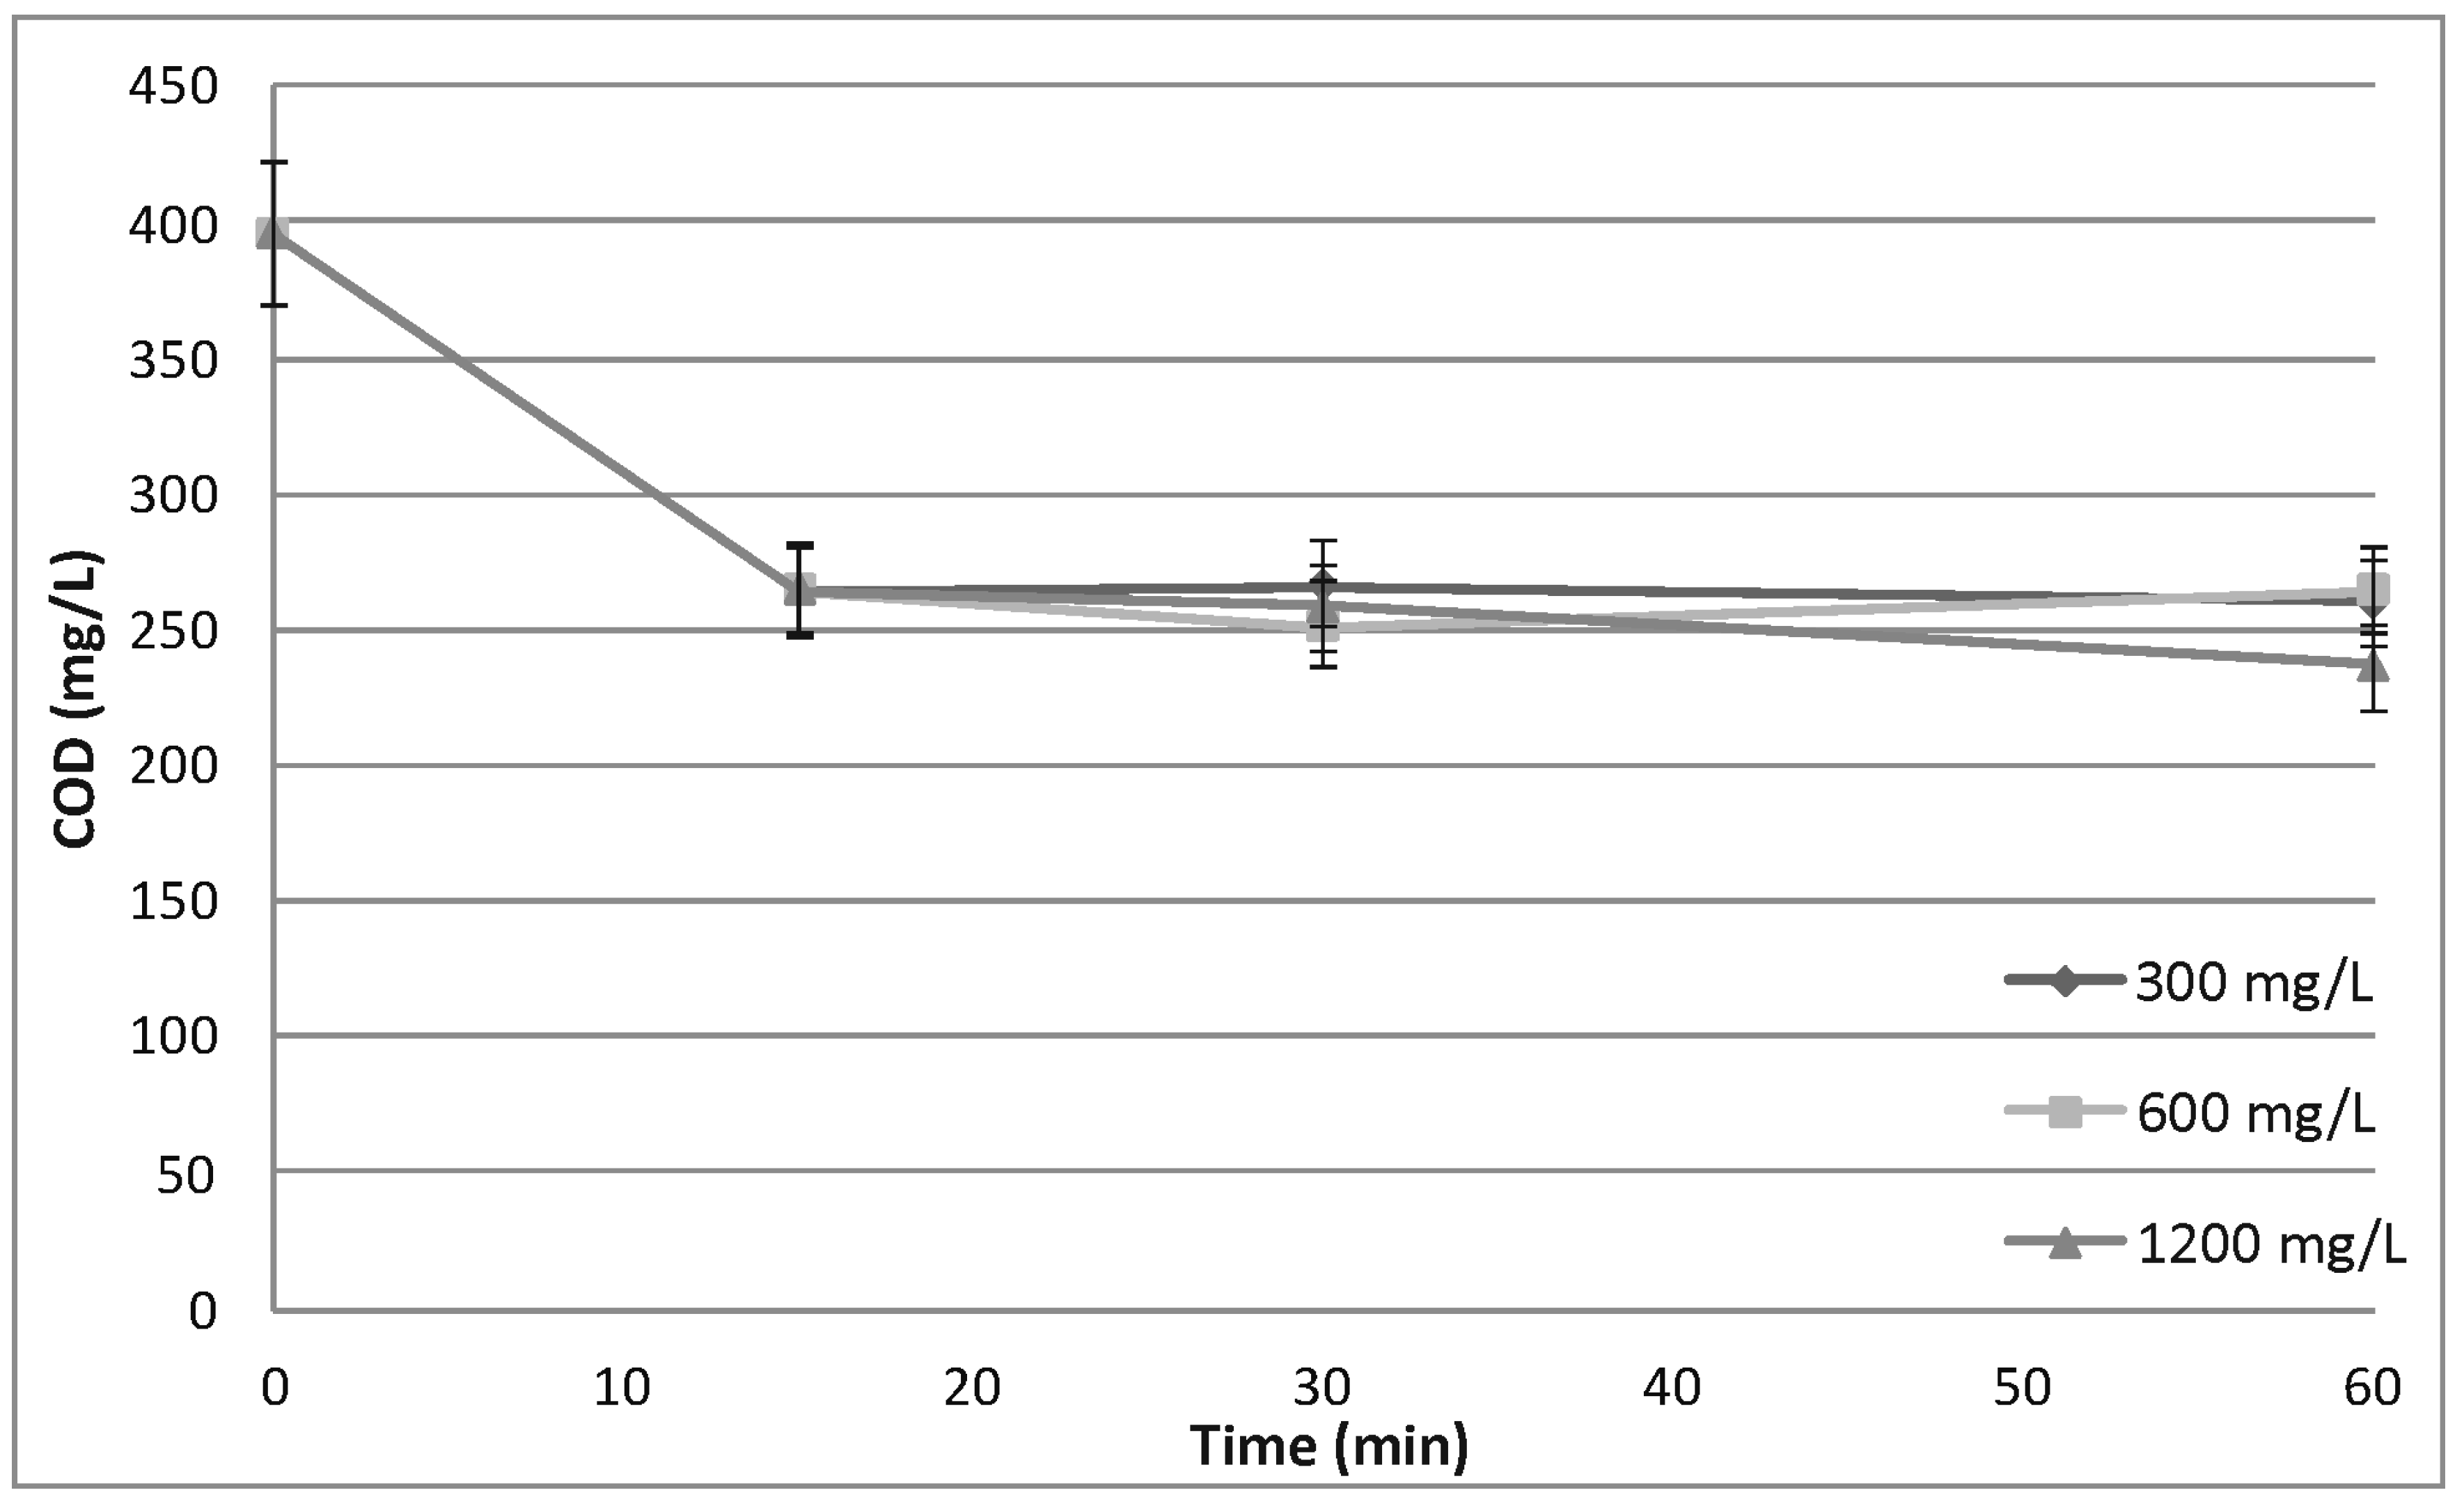
As expected, both Fe
0/H
2O
2 and Fe
2+/H
2O
2 processes conducted on both raw and sedimented wastewater allowed for COD and TOC removal. Whether initial sedimentation was used or not, as well as Fe
2+, Fe
0 and H
2O
2 doses, a rapid decrease in TOC and COD was observed after the shortest process time. COD decreased to 240–270 mg/L and TOC to 38–40 mg/L from an initial 395 and 47.81 mg/L, respectively. For longer process times, almost no additional removal was observed. From the technological point of view, it is then not recommended to extend the process time to more than 5–15 min for COD and TOC removal. Treatment effect is related to chemical oxidation, coagulation, and precipitation/sedimentation. Coagulation (
Table 2 and
Table S1) provides similar COD removal to 250–270 mg/L but a slightly worse TOC removal to 41–44 mg/L. A poor (0.51) COD/TOC removal correlation in coagulation proves that COD is related to inorganic compounds. It could be compared with the COD/TOC removal correlation for the Fe
2+/H
2O
2 and Fe
0/H
2O
2 processes (0.90). It confirms the effectiveness of radical oxidation of inorganic, sulfur-based, reduced compounds. After both oxidation processes, regardless of using initial sedimentation, the concentration of sulfates(IV) is much higher (data not shown) than in raw wastewater.
3.5. Statistical Analysis
The numerical results of the two-way factorial analysis of variance (ANOVA) explain how the iron type (Fe
0 and Fe
2+) influenced COD and TOC. The results of the analysis are presented in
Table 6 and
Table 7. Graphic results showing the main effects and two-way interactions for TOC (i.e., TOC versus Fe
0 and H
2O
2 and TOC versus Fe
2+ and H
2O
2) are presented in
Figures S1–S4.
It was found that the influence of iron (Fe
0 or Fe
2+) was statistically significant at the confidence level of 0.05, except in one case where COD, Fe
2+, and time = 60 (min). However, this significance was not observed systematically when using H
2O
2. The effects of the H
2O
2–Fe interaction were observed only in the case of TOC and Fe
2+ for a time of 60 min. An analysis of the figures for COD, TOC, and the two-factor ANOVA plots (
Figures S1–S4) also confirms that the Fe
0/Fe
2+ application on COD and TOC had a higher impact than the H
2O
2 application.
4. Conclusions
FGD wastewater can be effectively treated with all three investigated processes: coagulation with Fe-based coagulants, the Fe0/H2O2 process, and the Fe2+/H2O2 process. These processes can be ranked in terms of the efficiency of pollutants (heavy metals, TOC, and COD) removal: Fe2+/H2O2 > Fe0/H2O2 >> coagulation. Oxidation processes allowed for almost complete heavy metal removal. It could then be possible not to use toxic chelating agent TMT-15 during FGD wastewater treatment. The most likely effect is related to sorption on the created hydroxide surface and co-precipitation. Future research will include the investigation of the efficiency of sorption using various sorbents as the final FGD treatment step.
ANOVA was applied to determine the significance of the two independent variables and their interactions. Statistical analysis confirms the high efficiency and applicability of the treatment process.
Both oxidation processes used, homogenous and heterogeneous Fenton, meet the technical FGD wastewater treatment requirements of the BAT for large combustion sources. Therefore, the homogenous and heterogeneous Fenton processes can be viable alternatives for the wet lime method FGD wastewater treatment in contrast to the BAT recommended iron-based coagulation.
In the course of future research, it is planned to assess the effectiveness of the investigated oxidation processes on an industrial scale.


