Article

Estimation of Pore Size Distribution of Amorphous Silica-Based Membrane by the Activation Energies of Gas Permeation

1
FIM2Lab-Functional Interfacial Materials and Membranes Laboratory, School of Chemical Engineering, the University of Queensland, Brisbane, QLD 4072, Australia
2
School of Environmental Science and Technology, Dalian University of Technology, Dalian 116024, China
3
State Key Laboratory of Materials-Oriented Chemical Engineering, College of Chemical Engineering, Nanjing Tech University, 5 Xinmofan Road, Nanjing 210009, China
4
School of Chemical Engineering, the University of Queensland, Brisbane, QLD 4072, Australia
5
School of Mechanical and Mining Engineering, the University of Queensland, Brisbane, QLD 4072, Australia
*
Author to whom correspondence should be addressed.
Processes 2018, 6(12), 239; https://doi.org/10.3390/pr6120239
Submission received: 31 October 2018 / Revised: 16 November 2018 / Accepted: 21 November 2018 / Published: 23 November 2018
(This article belongs to the Special Issue Transport of Fluids in Nanoporous Materials)

Abstract

:
Cobalt oxide silica membranes were prepared and tested to separate small molecular gases, such as He (dk = 2.6 Å) and H2 (dk = 2.89 Å), from other gases with larger kinetic diameters, such as CO2 (dk = 3.47 Å) and Ar (dk = 3.41 Å). In view of the amorphous nature of silica membranes, pore sizes are generally distributed in the ultra-microporous range. However, it is difficult to determine the pore size of silica derived membranes by conventional characterization methods, such as N2 physisorption-desorption or high-resolution electron microscopy. Therefore, this work endeavors to determine the pore size of the membranes based on transport phenomena and computer modelling. This was carried out by using the oscillator model and correlating with experimental results, such as gas permeance (i.e., normalized pressure flux), apparent activation energy for gas permeation. Based on the oscillator model, He and H2 can diffuse through constrictions narrower than their gas kinetic diameters at high temperatures, and this was possibly due to the high kinetic energy promoted by the increase in external temperature. It was interesting to observe changes in transport phenomena for the cobalt oxide doped membranes exposed to H2 at high temperatures up to 500 °C. This was attributed to the reduction of cobalt oxide, and this redox effect gave different apparent activation energy. The reduced membrane showed lower apparent activation energy and higher gas permeance than the oxidized membrane, due to the enlargement of pores. These results together with effective medium theory (EMT) suggest that the pore size distribution is changed and the peak of the distribution is slightly shifted to a larger value. Hence, this work showed for the first time that the oscillator model with EMT is a potential tool to determine the pore size of silica derived membranes from experimental gas permeation data.

1. Introduction

Microporous silica (SiO2) membrane has attracted significant research attention for gas separation, including H2 separation which is an energy carrier of great interest whilst also being a precursor for the production of chemical products [1,2,3,4]. The development of silica membranes was born out of a desire to control pore sizes at a molecular level. By tuning the pore size of silica membranes, the permeation of gas molecules is affected. As a result, gases with smaller kinetic diameters tend to permeate fast through the silica membranes whilst the permeation of the larger kinetic diameter gases are very slow or hindered. The initial development of silica membranes in the late 1980s and early 1990s was based on a sol-gel method using the conventional silica precursor tetraethyl orthosilicate (TEOS) [5,6,7]. A major development in silica membranes occurred with embedding metal oxides in the silica matrix. Since then, there have been a significant number of reports on metal oxide silica membranes, including those containing oxides of nickel [8,9], cobalt [10,11,12,13,14], niobium [15], palladium [16], zirconium [17], titanium [18] and aluminum [19]. A special feature of these membranes were high gas selectivities at high temperatures, which is of interest in several chemical engineering process applications. Subsequently, research groups reported on the use of binary mixed metal oxide in silica membranes, including those containing cobalt iron oxides [20,21], palladium cobalt oxide [22] and lanthanum cobalt oxide [23]. This allowed interesting pore size tailoring by reducing only a single metal oxide in the silica matrix, whilst the other one was left in the oxidized state. Nevertheless, based on the number of publications, cobalt oxide silica membranes remained the most popular metal oxide silica membranes, due to very high gas selectivity close to values of 1000 [24].
According to the molecular sieve mechanism, the most important parameter of a silica based membrane is the pore size. The determination of pore sizes in silica derived matrices is generally carried out by conventional characterization techniques, such as N2 adsorption. This technique uses xerogels (i.e., dry gel) which is generally gelled in bulk. As bulk evaporation and gelation is very slow compared to thin film (30 nm thickness) deposition on substrates, it is known that the structures of xerogel and thin film are not equivalent. For instance, the properties of a deposited thin film may be quite different, due to non-equivalent gelation and drying conditions [25]. Hence, N2 adsorption on bulk silica xerogel is generally used as a qualitative measure of thin film structures. Other more complex techniques have been applied to characterize xerogels and thin films. For instance, using Positron Annihilation Spectroscopy Duke and co-workers demonstrated that amorphous silica matrices have narrow tri-modal pore size distribution (PSD) at 2.5–4 Å, 6.7–7.8 Å and 12–14 Å [26]. Another technique to characterize the pore sizes of thin films deposited on substrate is molecular probing which uses gas molecules of different kinetic diameters to determine the average pore size, by plotting permeance versus the kinetic diameter of the gas tested.
A number of mass transfer studies suggested the gas permeation value was a result of membrane pore size and gas molecular size. In other words, if the pore size distribution (PSD) is known, the gas permeation data could be calculated from a proper model. The question in this work is whether it is possible to use a permeation model to derive the PSD, instead of the conventional approach of using permeation data of particular gases to determine the PSD. In a membrane gas permeation test, the measurable parameters are generally the gas permeance (mol·m−2·s−1) and the apparent activation (kJ·mol−1) energy. Even though permeability (mol·m−1·s−1) is reported in some studies, it is not very reliable, due to the technical difficulty in accurately measuring the membrane thickness. Permeance may not be an ideal data for evaluating pore size, because it also depends on the membrane thickness. Fortunately, the apparent activation energy is not a function membrane thickness, and in principle it only depends on the pore size (pore diameter) and the size of gas molecule (molecular size).
If the gas permeation across a membrane follows an activated transport model, activation energy is a measure of the energy required by a gas molecule to permeate through a pore as follows:
E a   =   d ln ( P / l ) d ( R T ) 1
where P is permeability and l the membrane thickness. A number of studies reported apparent activation energies for different gases through the silica based membrane (Table 1). An interesting phenomenon is that H2 and He generally exhibit positive apparent activation energy, but other gases present negative apparent activation energy. This current study will employ the correlation between pore size and apparent activation energy to evaluate the pore size distribution of silica based membrane by the measured apparent activation energy, and use this pore size distribution to explain the observed transport phenomena.

2. Theory of Mass Transfer Through Membrane

A general model of mass transfer is always expressed as a coefficient multiplied by a driving force as
J   =   k   ×   f
where J is the mass transfer flux, k is the mass transfer coefficient and f is the driving force. The driving force of the gas permeation is usually the chemical potential, which can be reduced to gradient of pressure, concentration, depending on the system. The mass transfer coefficient can be permeability, diffusivity or other term depending on the term used for driving force. For membrane processing of gases, the pressure difference and permeate flux are the quantities generally determined from experimental measurements, so the most common form in membrane mass transfer is
J   =   ( P l ) Δ p
where membrane thickness l is lumped together with permeability P into a term called permeance (P/l) which is a convenient form avoiding the difficulty in accurately measuring the thickness of silica thin films. Sometimes, silica thin films interpenetrate into the pores of porous of substrates, depending on the property of the sol and substrate. Hence, the membrane thickness is not always easy to determine.

2.1. Activated Transport

For ultra-microporous (dp < 5 Å) material, the pore size of the silica thin-films is close to the Lennard Jones (L-J) diameter which results in overlap of the L-J potentials from the pore wall. In such cases, the L-J potential inside a pore could be several magnitudes higher than that of a flat surface. Therefore, the motion of gas molecules in a pore is not as free as in the bulky gas phase, instead it must be significantly affected by the potential fields. Pores of size close to the diameter of a gas molecule generally present a positive potential for the gas molecule. The potential becomes even higher with narrower pore size. To overcome the potential barrier inside a pore, the gas molecule needs activation energy to complete a successful penetration. Therefore, this type of mass transfer is called activated transport. Gas transport through silica based membranes generally follows activated transport [10,35,36]. The original expression of mass transfer across the membrane is given as [37,38,39]
J   =   q D 1 R T d μ d z
where J is the permeate flux, q the molar concentration of gas in the pore, D the diffusivity, R the gas constant, T the temperature, μ the chemical potential and z the space coordinate in the permeation direction.
Assuming equilibrium between the membrane adsorbate and the bulk gas phase, the following relationship for the chemical potential [40,41] is applicable
μ   =   μ 0   +   R T ln p
where p is the absolute pressure.
Substituting Equation (5) in Equation (4) gives
J   =   D d ln p d ln q d q d z   =   q D d ln p d q d q d z   =   D Γ d q d z   =   D 1 1 θ ocp d q d z
where Γ = q(dlnp/dq) is a thermodynamic factor, obtained as Γ = 1/(1−θocp) for a Langmuir isotherm. θocp is the fractional occupancy of the adsorbate (the ratio of adsorbate concentration to the maximum adsorbate concentration). As the silica membrane is designed for separating hot gas (200–500 °C), the high temperature adsorption is very weak (θocp ≈ 0), so that the thermodynamic factor is Γ = 1/(1−θocp) ≈ 1, and the permeate flux is finally approximated as
J   =   D d q d z
The diffusivity D is a function of temperature, and is activated. The temperature dependence generally obeys the Arrhenius relation
D   =   D 0 exp ( E d R T )
where D0 is a pre-exponential coefficient, and Ed is an activation energy. At high temperatures, the adsorption is weak and the Langmuir isotherm approaches Henry’s law [42]
q   =   K p
K is the Henry’s constant and a function of temperature, following the van’t Hoff relation:
K   =   K 0 exp ( Q R T )
where K0 is a pre-exponential coefficient, and Q is the heat of adsorption.
Equations (7)–(10) can be combined as
J   =   D 0 K 0 exp ( E d     Q R T ) d p d z   =   D 0 K 0 exp ( E a R T ) d p d z
Ea is the apparent activation energy for activated transport, which has a relation to Ed and Q in Equation (12)
E a   =   E d     Q
Assuming a uniform pressure gradient, Equation (11) is simplified to
J   =   D 0 K 0 exp ( E a R T ) Δ p l
The permeance (P/l) is the coefficient between flux and pressure drop according to Equation (3), and is obtained as
( P l )   =   D 0 K 0 l exp ( E a R T )
the apparent activation energy is experimentally derived from the permeance measured at different temperatures. If Equation (14) is logarithmically transformed
ln ( P l )   =   ln ( D 0 K 0 l )     E a R T
The slope of ln(P/l) to −1/(RT) gives the apparent activation energy as indicated by Equation (1).

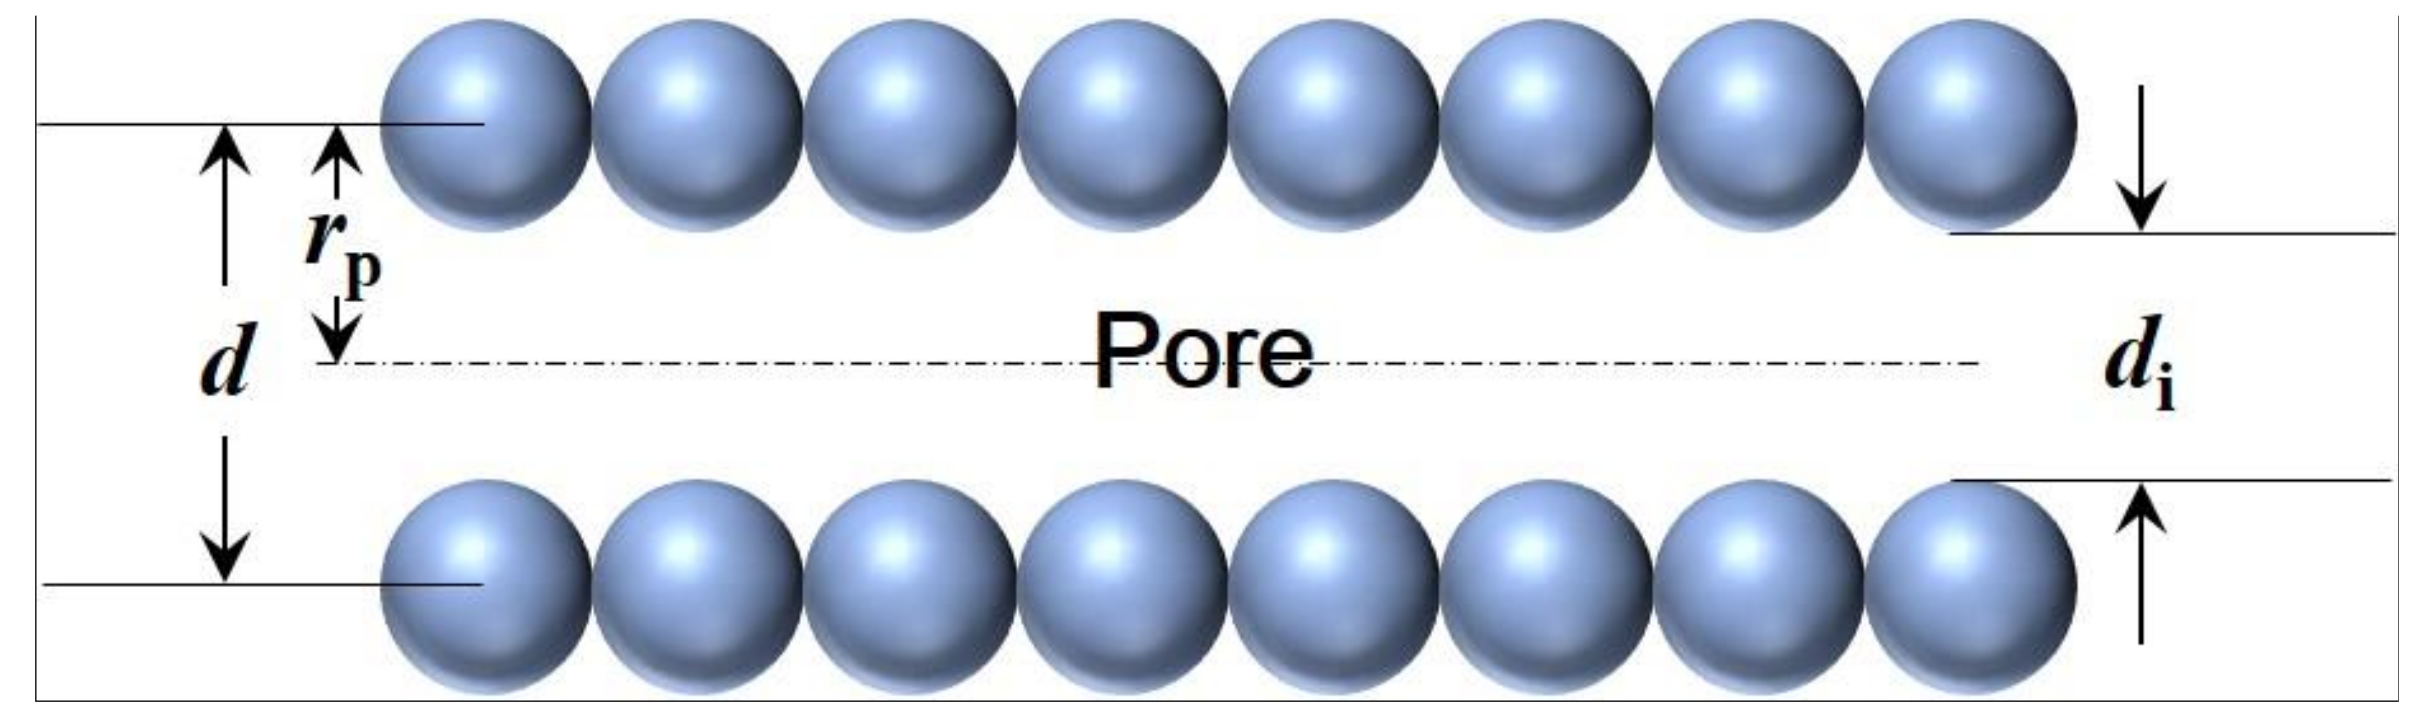
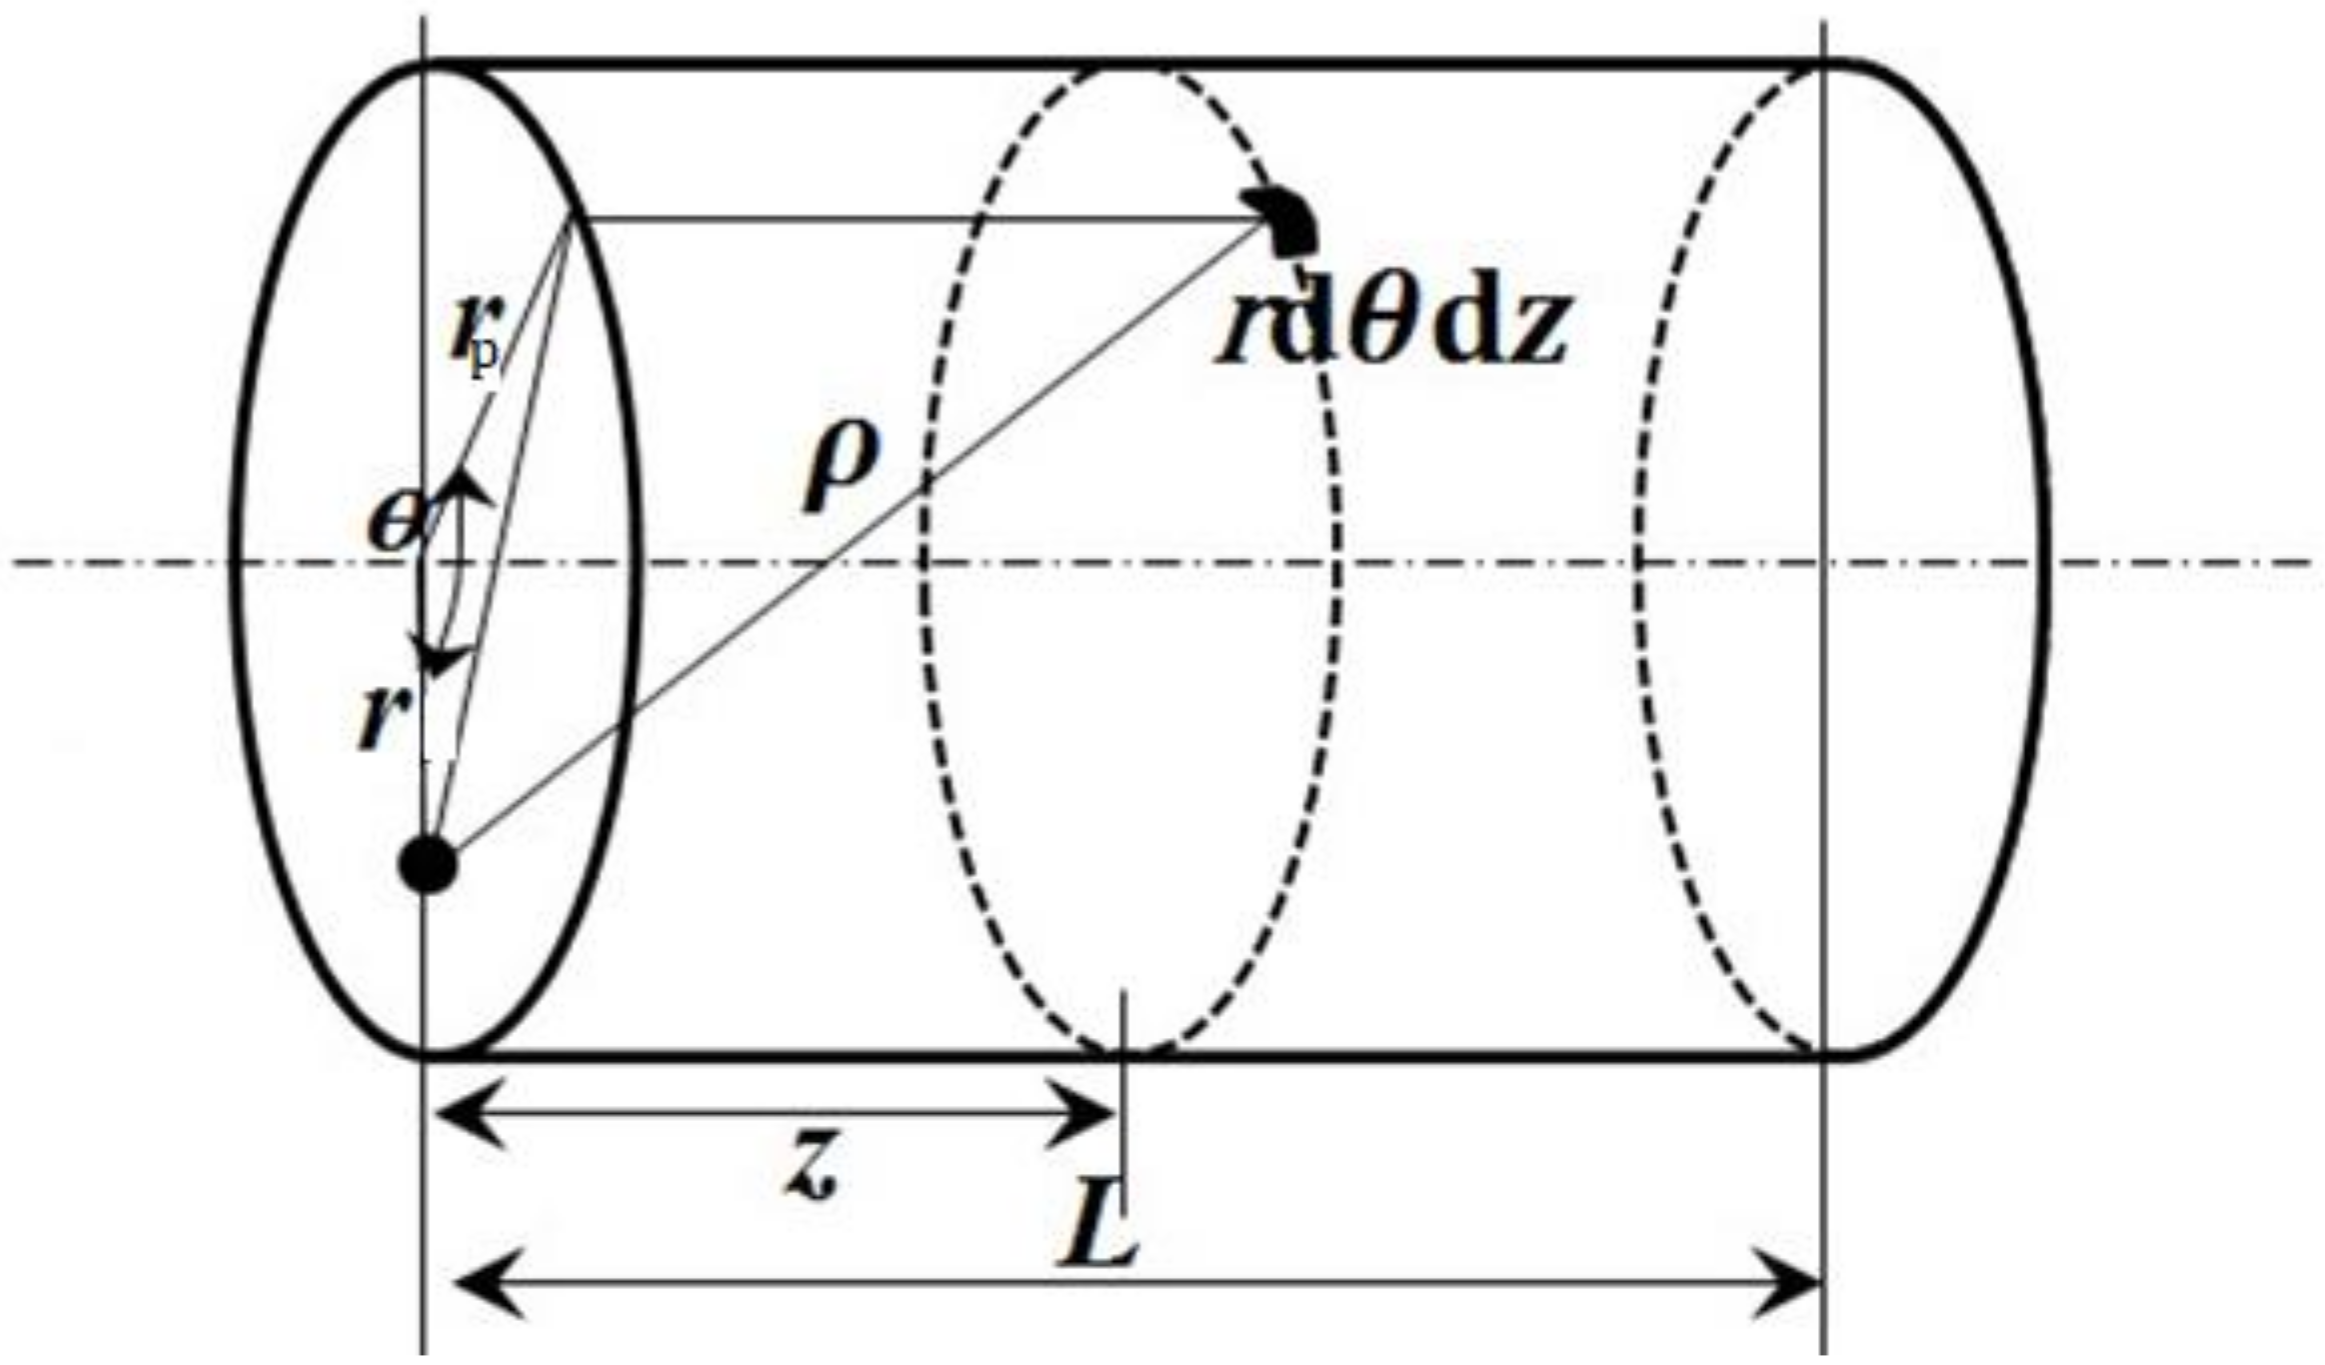
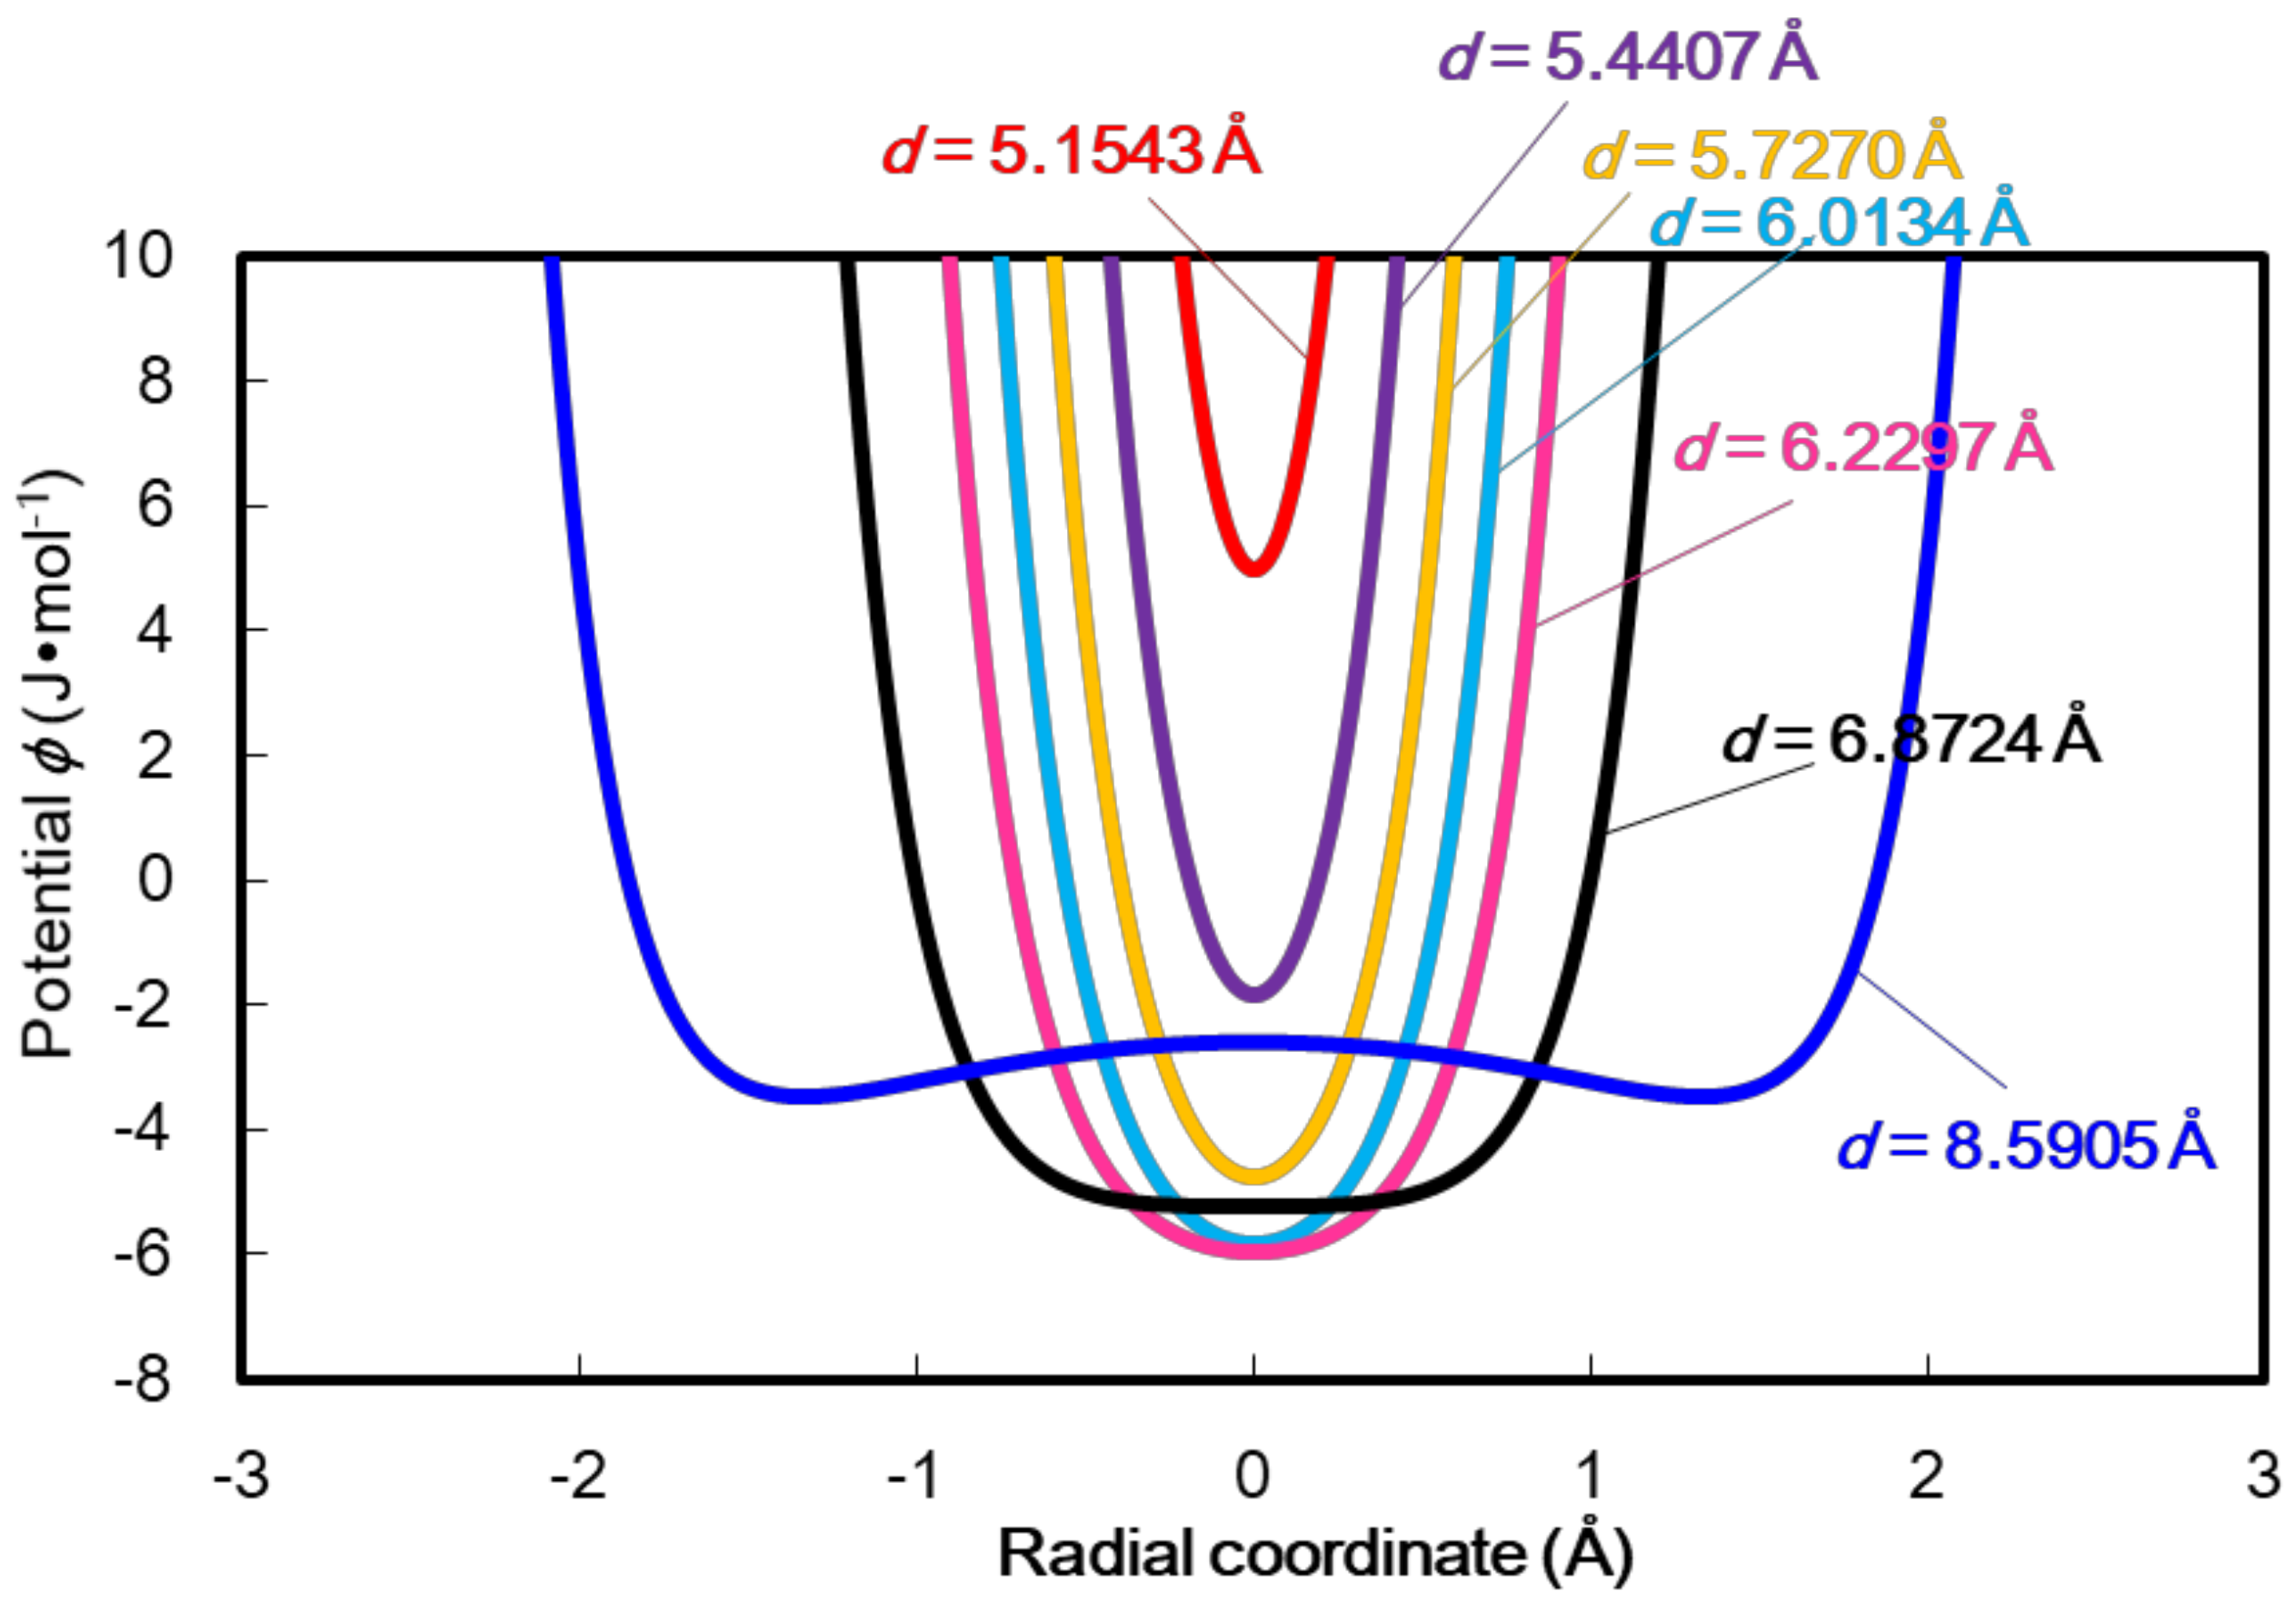
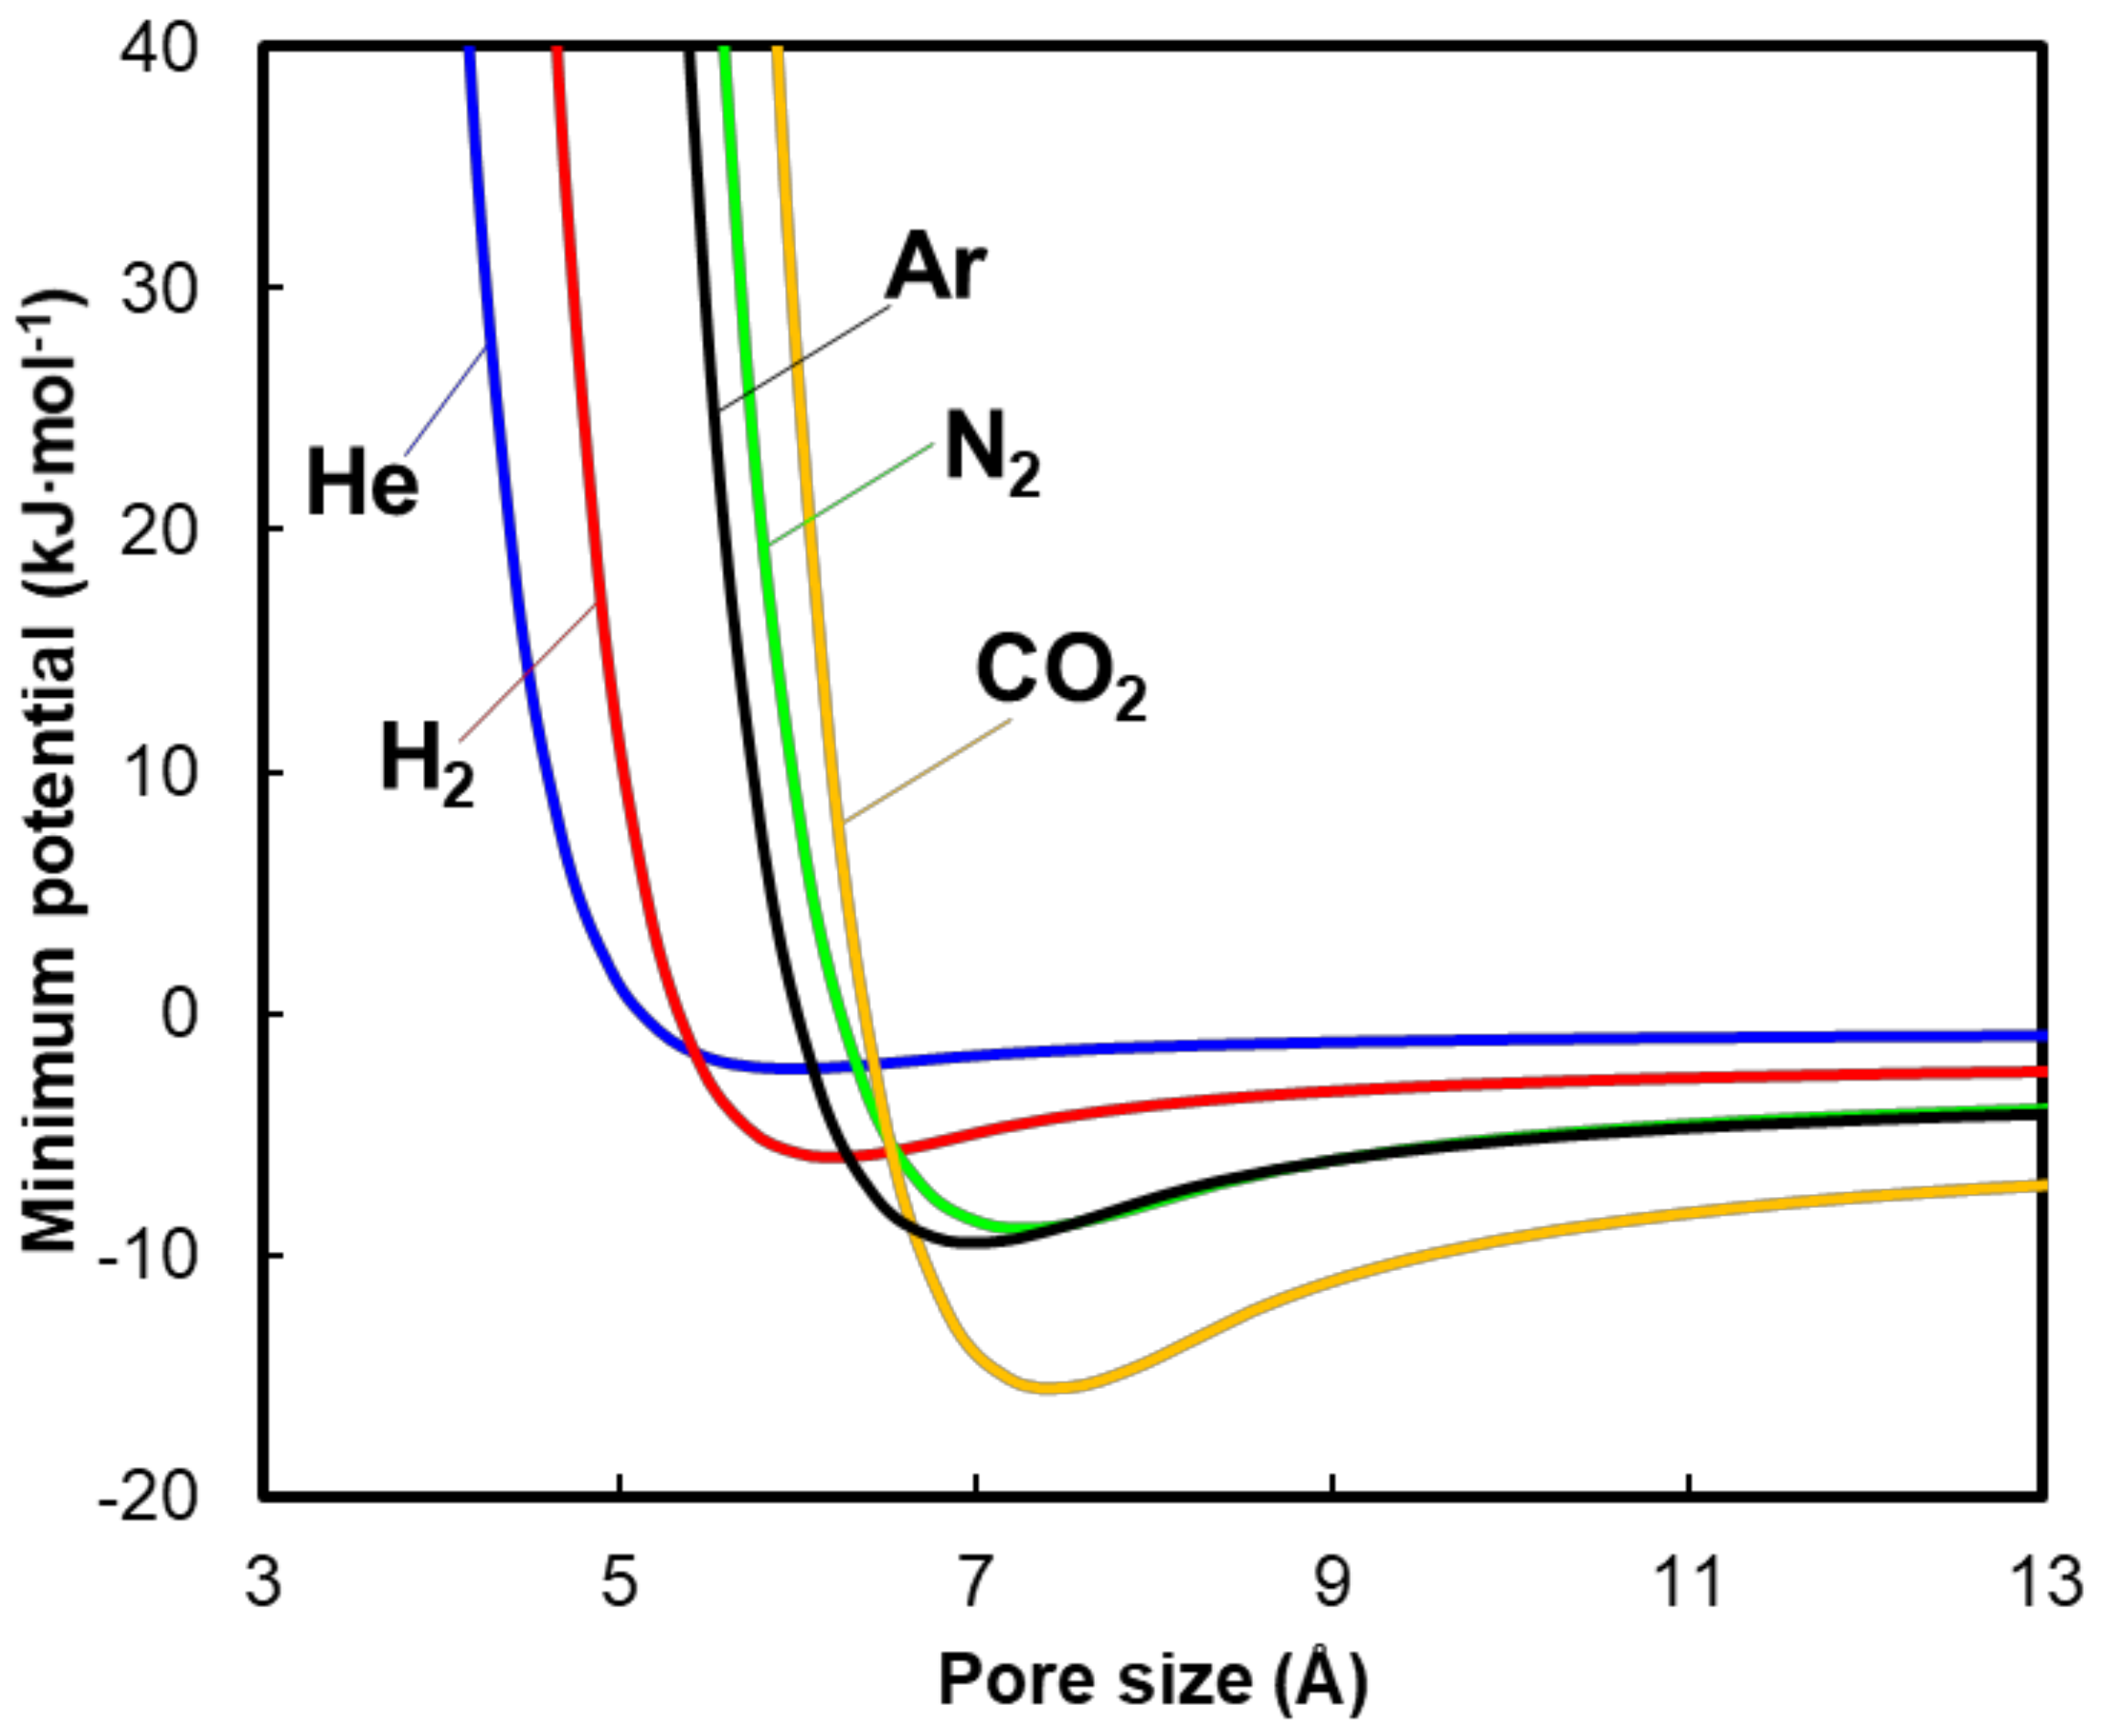
2.2. Potential in Cylindrical Pores

The motion of gas molecules in micro-pores is strongly affected by the potential inside the pore. The potential between two atoms based on the Lennard-Jones (L-J) potential is [43]
ϕ ( ρ )   =   4 ε [ ( σ ρ ) 12     ( σ ρ ) 6 ]
where ϕ is the potential between two atoms, σ the L-J collision diameter, ε the L-J well depth, and ρ the distance between the centers of two atoms. For two different atoms, the L-J collision diameter and L-J well depth are estimated by the Lorentz-Berthelot mixing rules [44,45]
σ AB   =   1 2 ( σ A   +   σ B )
ε AB   =   ε A ε B
In this work the pore is simplified as a cylinder consisting of L-J particles. It is important to clarify the definition of pore size beforehand (Figure 1). The diameter (d) of the pore is defined as the distance from an oxygen particle center to the opposite oxygen particle center. The inner diameter di (surface to surface) is more relevant in size sieving, but is not unambiguously defined for soft-sphere L-J particles. Therefore, d is used instead of di throughout this work and pore radius is rp = d/2.
Equation (16) has provided the potential between two atoms. The potential in a pore is actually the summation from all the atoms which formed the pore. Calculating the potential inside a pore could be conducted by integrating all the atom-atom potentials geometrically. By assuming the pore is cylindrical, with radius r (Figure 2), the potential distribution inside a pore is given by
ϕ ( r , r p ) =   8 ε η d r p 0 L 2 0 2 π [ ( σ ρ ) 12     ( σ ρ ) 6 ] d θ d z =   8 ε η d r p 0 L 2 0 2 π [ σ 12 ( r p 2   +   r 2     2 r p r cos θ   +   z 2 ) 6     σ 6 ( r p 2   +   r 2     2 r p r cos θ   +   z 2 ) 3 ] d θ d z
where rp is the pore radius, L the pore length, ηd the surface atomic density on the pore wall and r the radial coordinate with a range of r ∈ [0, rp). The meaning of all the variables in Equation (19) are visually explained in Figure 2.
An example of the H2 potential distribution based on Equation (19) inside a silica pore with varied pore sizes is displayed in Figure 3. It is the nature of gases to follow thermodynamic laws and seek the lowest potential as displayed in Figure 4.

2.3. Pore Size Distribution (PSD) Estimation of A Membrane

Since a silica membrane is generally amorphous, there is a distribution of pore sizes and the pore size distribution of membrane differs from that in the sample powder for N2 adsorption test. The first reason is attributed to the effect from the substrate, which may consequently affect the pore structure of the membrane. The second reason is that the membrane has several layers and each layer has a different thermal history which results in variation in pore structure [46].
The pore size distribution of sample powder is usually characterized by gas adsorption which is operated at a low temperature. Pores smaller than adsorbate kinetic diameter are hardly detected by adsorption, as the L-J potential in a small pore is too repulsive for adsorbate molecules to enter. However, gas permeation is operated at high temperatures, for which gas molecules travel with high kinetic energy and have the possibility to access pores smaller than their diameter. Since such pores also contribute to the total permeation, the pore size distribution can be extracted from permeation data.
To this end, we consider a Rayleigh distribution of pore sizes for the silica matrix [47,48,49,50,51,52,53]
f ( r p )   =   ( r p     r o ) ( r m     r o ) 2 exp [ ( r p     r o ) 2 2 ( r m     r o ) 2 ]
where f(rp) is the distribution function, rp is the possible pore radius, ro is the minimum pore radius and rm is the modal pore radius. When there is a pair of (r0, rm), f(rp) is the probability density of finding pores of which the size is rp. The oscillator model computes the permeate flow (mol·s−1) of a pore with size rp, such that
i   =   π r p 2 K ( r p ) D ( r p ) p
and the conductance for permeation through a pore with size rp is defined as
λ ( r p )   =   π r p 2 K ( r p ) D ( r p )
The details of computing D(rp) and K(rp) are provided by Bhatia et al. [2,53,54]. The contribution of any pore size to the total bulk permeate flow depends on the pore size distribution. The total permeate bulk flow is the summation of the flow from all the pores. To calculate the total permeate flow, the effective medium theory (EMT) is generally applied [55,56,57,58]
r min r max f ( r p ) λ ( r p )     λ e λ ( r p )   +   ( N 2     1 ) λ e d r p   =   0
where f(rp) is the pore size number distribution, N is the connectivity of pores, rmin and rmax are the minimum and maximum pore size. The solution λe of Equation (23) is the effective conductance of the entire membrane, which can be used to calculate the bulk permeate flux
J   =   ε λ e τ T π r p 2 p
where ε is the porosity, τT is the tortuosity and π < rp2 > is the mean pore cross section area. For a disordered network, the tortuosity is normally given by [59,60]
τ T   =   3 ( N   +   1 ) N     1
Equation (24) provides the bulk permeate flux. For a specific Rayleigh pore size distribution f(ro,rm,rp), the bulk permeate flux at different temperatures can be obtained from the model above. When permeate fluxes at different temperatures are available, the bulk apparent activation energy is then calculated by Equations (1) and (15). This bulk apparent activation energy shows one-to-one correspondence to the pore size distribution f(ro,rm,rp). By varying ro and rm of Equation (20), the calculated bulk apparent activation energy will change. The deviation of calculated apparent activation energy to the experimental apparent activation energy is defined as
| E a , osc     E a , exp | E a , exp   =   | E a , osc He     E a , exp He | E a , exp He   +   | E a , osc H 2     E a , exp H 2 | E a , exp H 2
It is assumed that the value (ro,rm) which gives the activation energy closest to the experimental activation energy provides the best representation of the membrane pore size distribution.

3. Experiment

3.1. Sol-Gel Preparation and Membrane Coating

The cobalt oxide silica sol-gel method involved mixing several chemical precursors is reported elsewhere [11]. Briefly, cobalt nitrate hexahydrate (Co(NO3)2·6H2O, 98%, Sigma-Aldrich) was dissolved in 30 vol.% aqueous hydrogen peroxide (H2O2, 30 wt%) and ethanol (EtOH, 99%, AR grade). Then tetraethoxysilane (TEOS, 99%, Fluka) was added drop wise to form a final molar ratio of 255 ethanol:4 TEOS:1 Co(NO3)2·6H2O:9 H2O2:40 H2O. The sol-gel was dip-coated on an alumina support purchased from the Energy Centre of the Netherlands (ECN). Each cobalt oxide silica layer was calcined up to 630 °C in air at a ramping rate of 1 °C·min−1 and with a dwell time of 4 h. A total of five layers were sequentially dip-coated on the outside surface of the alumina support and calcined to ensure defect-free membranes. The alumina support was composed of asymmetric layers. The top layer was derived from γ-alumina with an intrinsic pore size distribution around 4 nm, and was coated on a mechanically robust porous α-alumina substrate with the following dimensions: Length ~70 mm, external and internal diameters of 14 and 10 mm, respectively.

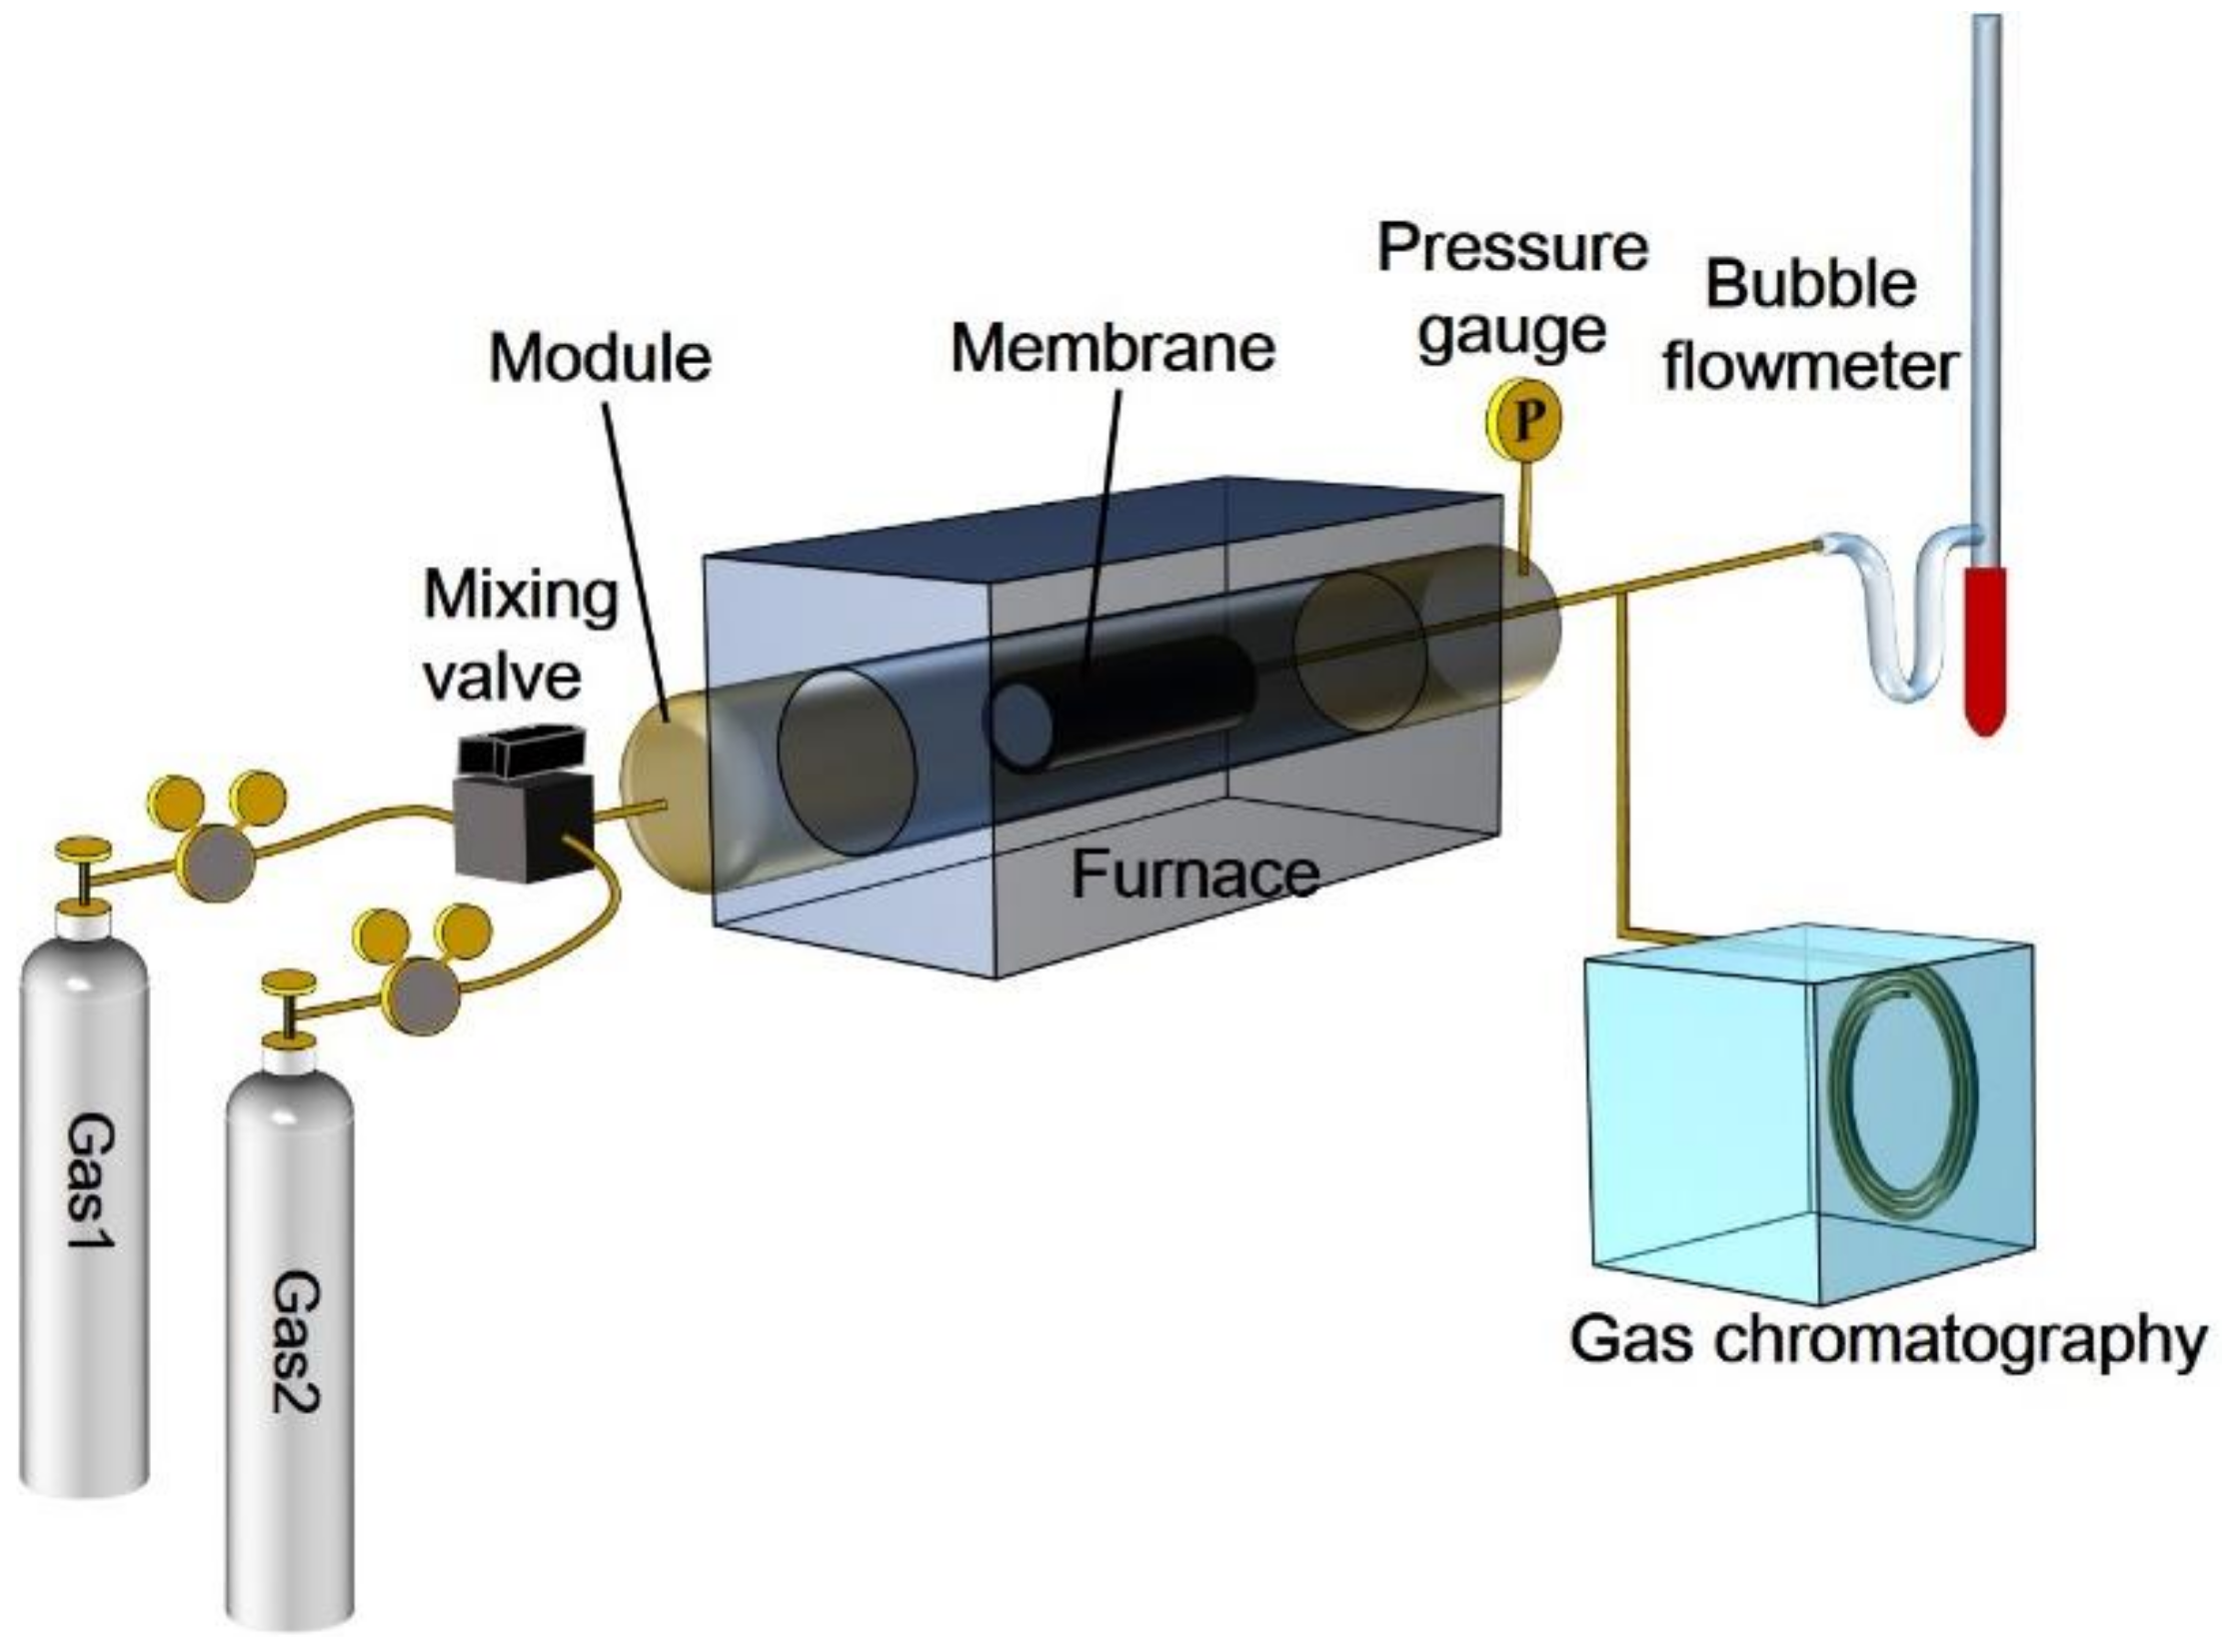
3.2. Gas Separation Measurement

The membrane module testing configuration is shown in Figure 5. A membrane tube was initially sealed by a set of Swagelok fittings, nut and graphite ferrule. After sealing, the membrane effective length was 48 mm. The membrane was finally assembled into a cylindrical module, tested and adjusted until a leak free membrane/seal interface was achieved. Once the membrane was leak free, it was tested for He and H2 permeation from 100% of the pure feed gas. Then the mixed gases He/CO2 and H2/Ar were tested down to 30% He and 20% H2 mixtures, respectively. The gas mixture testing included strong adsorbing gas (such as CO2) and non-adsorbing gas (He) for the permeation for He/CO2. The flow rate was measured by a bubble flow meter and the composition of the mixed gas was determined by Shimadzu gas chromatograph (GC).

4. Results and Discussion

In view of the asymmetric nature of the cobalt oxide silica membranes, gas permeation was also carried out on the substrate prior to dip coating with cobalt oxide silica sol-gel. This test was conducted to investigate the resistance level of the support alone. Figure 6 shows that the permeance of He and H2 across the uncoated support was ~1 × 10⁻⁵ mol·m−2·s−1·Pa−1, whilst for coated cobalt oxide silica support as a full membrane was ~2 × 10⁻⁸ mol·m−2·s−1·Pa−1. If the resistance is defined as the reciprocal of permeance, the resistance in the substrate only accounts for ~0.2% of the total resistance which is much lower than the permeation experimental error of ±~8%. Therefore, the resistance of the substrate is ignored in the modelling in this work, and the transport of gases is assumed to be limited by cobalt oxide silica layers only.
Figure 7 shows the permeation test for 200 to 500 °C for He/CO2 binary mixtures from 90% He (10% CO2) down to 10% He (90% CO2). The feed pressure was kept constant at 6 atm, and controlled by a back pressure valve. The permeate side was open to the atmosphere, to maintain pressure at 1 atm. More details about the mixed gas permeation could be found in Ji et al. [61]. The CO2 single gas permeation proved to be too slow to be measured, and was considered below the measurable region of the bubble flow meter. It is interesting to observe in Figure 7 that the strong adsorbing gas of CO2 did not greatly affect the permeation of He, which is a non-adsorbing gas under the tested conditions. The competitive adsorption effect is generally more prevalent in low temperature gas separation conditions, where the stronger adsorbing gas covers more surface and pores of the membrane, hindering the transport of the other gas in the membrane pores [62,63]. However, gas permeation was carried out at high temperatures, and the competitive adsorption effect barely affects the He permeation. It was observed that He permeate flow rate increased linearly as a function of the He feed fraction (or partial pressure), yielding a constant He permeance.
Further work was carried out for H2 and Ar mixtures. Due to the catalytic effect of the cobalt oxide, mixtures of H2 and CO2 were not considered to avoid the reverse reaction of the water gas shift reaction, which would result in the production of CO and water vapor [64]. This would generate a quaternary mixture of H2, CO2, CO and H2O. Hence, Ar was used as a subrogated molecule to maintain a binary gas mixture of H2/Ar instead of a multiple transient gas mixture. In addition, Ar (dk = 3.41 Å) and CO2 (dk = 3.47 Å) [65,66] have similar kinetic diameters showing similar permeation performance through a silica membrane [67,68]. Single gas permeation was also carried for H2 and Ar prior to the binary mixture testing. Again, single Ar permeation did not produce permeate flows, thus below the minimum detectable level similar to the case of CO2 as mentioned above. After the H2 single gas permeation test, H2 and Ar mixture separation was measured for feed compositions from 90%, 70%, 50%, and 30% down to 20% H2. The H2 feed fraction was reduced step-wise after each day of testing [61].
The H2 permeance rate is shown in Figure 8. Unlike the test for He, it is interesting to observe that the H2 permeance is not constant. These unusual results suggest that H2 is possibly reducing the cobalt oxide embedded in the silica matrix, thus leading to a different micropore structure. Based on Ballinger et al.’s study, the exposure to H2 could reduce the metal oxide and widen the neck of pores [22]. To ensure a systematic study, each feed fraction was tested in a full single day, and this experiment was carried out in order from 100% H2 down to 20% H2. The results in Figure 8 implied that the reaction between membrane material and H2 is a function of H2 exposure time and H2 concentration in the feed gas. This will be discussed in detail in the following section.
The separation of He/CO2 shows that the presence of CO2 did not significantly hinder the He permeance, though the flow rates increased with He feed partial pressure, which in turn caused a higher driving force or pressure difference. The apparent activation energy for He permeation has an average value of 6.3 kJ·mol−1 with 4.8% fluctuation for all the feed fractions.
However, it is interesting to observe that the H2 permeance was higher for gas mixtures than for the pure gas. Miller et al. [69] and Ji et al. [61] reported that cobalt oxide embedded in silica undergoes reduction after exposure to H2, resulting in pore size enlargement. As the single H2 gas permeation was tested at the beginning in this series of experiments, the permeance was the lowest as the membrane was just exposed to H2 for a short time and possibly in an oxidized state. After one day (24 h) of exposure to H2, mixed gas separation was carried out from 90% H2 and was observed that the membrane permeance increased by about two times in the reduced state than in the oxidized state, thus confirming the redox effect of H2 on the membrane.
From Equation (15), the apparent activation energies before and after reduction can be obtained from the permeance at different temperatures. The apparent activation energy was reduced from 7.3 kJ·mol−1 (first day testing using pure H2) to 5.2 kJ·mol−1 (5th day testing using 30% H2). Activation energy is an energy barrier to overcome during permeation. Figure 3 and Figure 4 have demonstrated that in the range of <5 Å the L-J potential which acts as a barrier increased when the pore size is reduced. As there is a correlation between the apparent activation energy and pore size [70,71,72], this implies that the change of pore size is responsible for the reduction of cobalt oxide.
Figure 9 shows that when ro = 0.1402 nm and rm = 0.2657 nm, the Rayleigh distribution gives the closest apparent activation energy to the experimental value for the oxidized membrane. For reduced membrane, the best fitting value is ro = 0.1400 nm and rm = 0.2673 nm. The pore size distribution was derived from the fitting to He and H2 activation energies. If other gases could also permeate across this membrane, the pore size distribution estimated by fitting with permeation activation energies of more gases would be more reliable. But unfortunately other gases were impermeable through this membrane. The pore size distributions of these two states were displayed in Figure 10. The peak of inner diameter distribution for the oxidized membrane is di = 0.2514 nm, and the peak for the reduced membrane is di = 0.2546 nm. There are significant portion of pores below di < 0.3 nm that are below the detectable limit of a traditional method by adsorption of N2, Ar or CO2.
With a pore size distribution, effective medium theory (EMT) could compute the effective transport conductance λe. Therefore, the bulk permeability from EMT is
P   =   λ e r p 2
Based on the PSD estimated for the oxidized membrane and reduced membrane in Figure 10, the bulk permeability is calculated for He, H2. The calculated permeability for He and H2 was also compared with available experimental permeability as shown in Figure 11. The modelled permeability based on the pore size distribution above fits well with actual pore size distribution. This suggests that the estimated pore size distribution in Figure 10 could be a reasonable representation of the real pore size distribution.
The bulk permeabilities of Ar and CO2 from these two pore size distribution are at least five orders of magnitude lower than for He and H2. The distribution in Figure 10 shows that there is also a significant portion of pores larger than Ar and CO2 kinetic diameter. However, it should be noted that a pathway for permeation consists of a serious of connected pores and only the narrowest part restricts the permeation, thus the permeability for Ar and CO2 are much lower. This low permeability is why the permeation of Ar and CO2 could not be measured by the bubble flow meter.

5. Conclusion

The findings in this work supports the use of membrane permeation results to determine the apparent activation energy, and on coupling with the oscillator model permeation data can be used to estimate the pore size distribution. Therefore, better accuracy of pore sizes and pore size distribution can be achieved, which is otherwise not readily possible for xerogels and conventional characterization techniques. This study demonstrated that a Rayleigh distribution with ro = 0.1402 nm and rm = 0.2657 nm was a reasonable representation of the pore size distribution in a silica based membrane. Based on this estimated pore size distribution, the calculated permeability fitted well the experimental permeability. This method proved to be robust for calculating the pore size for cylindrical pore geometry and known material properties.

Author Contributions

G.J. designed and conducted the experiment, wrote the codes, analyzed the data, and wrote the manuscript; X.G. contributed in the modelling work; S.S. contributed in the membrane fabrication; S.K.B. provided the oscillator model and revised the manuscript; G.W. and K.H. contributed in supervision; J.C.D.d.C. contributed in supervision, membrane test and manuscript revision.

Funding

This research was funded by Australian Research Council via the Future Fellowship Program grant number FT130100405, National Natural Science Foundation of China grant number: 21878147, and Fundamental Research Funds for the Central Universities grant number: DUT18RC(3)036.

Acknowledgments

J.C.D.d.C. thanks the support from Australian Research Council via the Future Fellowship Program (FT130100405). X.G. thanks the financial support from National Natural Science Foundation of China (Grant number: 21878147). G.J. would appreciate the financial support from the Fundamental Research Funds for the Central Universities (Grant number: DUT18RC(3)036), and the technical support from Ling Yun HPC in Dalian University of Technology.

Conflicts of Interest

The authors declare no conflict of interest.

References

  1. Ji, G.; Wang, G.; Hooman, K.; Bhatia, S.; Diniz da Costa, J.C. Scale-Up Design Analysis and Modelling of Cobalt Oxide Silica Membrane Module for Hydrogen Processing. Processes 2013, 1, 49–66. [Google Scholar] [CrossRef]
  2. Ji, G.; George, A.; Skoulou, V.; Reed, G.; Millan, M.; Hooman, K.; Bhatia, S.K.; Diniz da Costa, J.C. Investigation and simulation of the transport of gas containing mercury in microporous silica membranes. Chem. Eng. Sci. 2018, 190, 286–296. [Google Scholar] [CrossRef]
  3. Smart, S.; Lin, C.X.C.; Ding, L.; Thambimuthu, K.; Diniz da Costa, J.C. Ceramic membranes for gas processing in coal gasification. Energy Environ. Sci. 2010, 3, 268–278. [Google Scholar] [CrossRef]
  4. Ji, G.; Yao, J.G.; Clough, P.T.; Diniz da Costa, J.C.; Anthony, E.J.; Fennell, P.S.; Wang, W.; Zhao, M. Enhanced hydrogen production from thermochemical processes. Energy Environ. Sci. 2018, 11, 2647–2672. [Google Scholar] [CrossRef]
  5. De Vos, R.M.; Verweij, H. High-Selectivity, High-Flux Silica Membranes for Gas Separation. Science 1998, 279, 1710–1711. [Google Scholar] [CrossRef] [PubMed]
  6. Raman, N.K.; Brinker, C.J. Organic “template” approach to molecular sieving silica membranes. J. Membr. Sci. 1995, 105, 273–279. [Google Scholar] [CrossRef]
  7. Kusakabe, K.; Sakamoto, S.; Saie, T.; Morooka, S. Pore structure of silica membranes formed by a sol–gel technique using tetraethoxysilane and alkyltriethoxysilanes. Sep. Purif. Technol. 1999, 16, 139–146. [Google Scholar] [CrossRef]
  8. Kanezashi, M.; Fujita, T.; Asaeda, M. Nickel-Doped Silica Membranes for Separation of Helium from Organic Gas Mixtures. Sep. Sci. Technol. 2005, 40, 225–238. [Google Scholar] [CrossRef]
  9. Kanezashi, M.; Asaeda, M. Hydrogen permeation characteristics and stability of Ni-doped silica membranes in steam at high temperature. J. Membr. Sci. 2006, 271, 86–93. [Google Scholar] [CrossRef]
  10. Battersby, S.; Duke, M.C.; Liu, S.; Rudolph, V.; Diniz da Costa, J.C. Metal doped silica membrane reactor: Operational effects of reaction and permeation for the water gas shift reaction. J. Membr. Sci. 2008, 316, 46–52. [Google Scholar] [CrossRef]
  11. Uhlmann, D.; Liu, S.; Ladewig, B.P.; Diniz da Costa, J.C. Cobalt-doped silica membranes for gas separation. J. Membr. Sci. 2009, 326, 316–321. [Google Scholar] [CrossRef]
  12. Uhlmann, D.; Smart, S.; Diniz da Costa, J.C. High temperature steam investigation of cobalt oxide silica membranes for gas separation. Sep. Purif. Technol. 2010, 76, 171–178. [Google Scholar] [CrossRef]
  13. Uhlmann, D.; Smart, S.; Diniz da Costa, J.C. H2S stability and separation performance of cobalt oxide silica membranes. J. Membr. Sci. 2011, 380, 48–54. [Google Scholar] [CrossRef]
  14. Liu, L.; Wang, D.K.; Martens, D.L.; Smart, S.; Diniz da Costa, J.C. Influence of sol–gel conditioning on the cobalt phase and the hydrothermal stability of cobalt oxide silica membranes. J. Membr. Sci. 2015, 475, 425–432. [Google Scholar] [CrossRef]
  15. Boffa, V.; Blank, D.H.A.; Ten Elshof, J.E. Hydrothermal stability of microporous silica and niobia–silica membranes. J. Membr. Sci. 2008, 319, 256–263. [Google Scholar] [CrossRef]
  16. Kanezashi, M.; Fuchigami, D.; Yoshioka, T.; Tsuru, T. Control of Pd dispersion in sol–gel-derived amorphous silica membranes for hydrogen separation at high temperatures. J. Membr. Sci. 2013, 439, 78–86. [Google Scholar] [CrossRef]
  17. Yoshida, K.; Hirano, Y.; Fujii, H.; Tsuru, T.; Asaeda, M. Hydrothermal Stability and Performance of Silica-Zirconia Membranes for Hydrogen Separation in Hydrothermal Conditions. J. Chem. Eng. Jpn. 2001, 34, 523–530. [Google Scholar] [CrossRef]
  18. Gu, Y.; Oyama, S.T. Permeation properties and hydrothermal stability of silica–titania membranes supported on porous alumina substrates. J. Membr. Sci. 2009, 345, 267–275. [Google Scholar] [CrossRef]
  19. Fotou, G.P.; Lin, Y.S.; Pratsinis, S.E. Hydrothermal stability of pure and modified microporous silica membranes. J. Mater. Sci. 1995, 30, 2803–2808. [Google Scholar] [CrossRef]
  20. Darmawan, A.; Motuzas, J.; Smart, S.; Julbe, A.; Diniz da Costa, J.C. Binary iron cobalt oxide silica membrane for gas separation. J. Membr. Sci. 2015, 474, 32–38. [Google Scholar] [CrossRef] [Green Version]
  21. Darmawan, A.; Motuzas, J.; Smart, S.; Julbe, A.; Diniz da Costa, J.C. Temperature dependent transition point of purity versus flux for gas separation in Fe/Co-silica membranes. Sep. Purif. Technol. 2015, 151, 284–291. [Google Scholar] [CrossRef]
  22. Ballinger, B.; Motuzas, J.; Smart, S.; Diniz da Costa, J.C. Palladium cobalt binary doping of molecular sieving silica membranes. J. Membr. Sci. 2014, 451, 185–191. [Google Scholar] [CrossRef]
  23. Ballinger, B.; Motuzas, J.; Miller, C.R.; Smart, S.; Diniz da Costa, J.C. Nanoscale assembly of lanthanum silica with dense and porous interfacial structures. Sci. Rep. 2015, 5, 8210. [Google Scholar] [CrossRef] [PubMed] [Green Version]
  24. Battersby, S.; Tasaki, T.; Smart, S.; Ladewig, B.; Liu, S.; Duke, M.C.; Rudolph, V.; Diniz da Costa, J.C. Performance of cobalt silica membranes in gas mixture separation. J. Membr. Sci. 2009, 329, 91–98. [Google Scholar] [CrossRef]
  25. Meixner, D.L.; Dyer, P.N. Characterization of the transport properties of microporous inorganic membranes. J. Membr. Sci. 1998, 140, 81–95. [Google Scholar] [CrossRef]
  26. Duke, M.C.; Pas, S.J.; Hill, A.J.; Lin, Y.S.; Diniz da Costa, J.C. Exposing the Molecular Sieving Architecture of Amorphous Silica Using Positron Annihilation Spectroscopy. Adv. Funct. Mater. 2008, 18, 3818–3826. [Google Scholar] [CrossRef]
  27. Diniz da Costa, J.C.; Lu, G.Q.; Rudolph, V.; Lin, Y.S. Novel molecular sieve silica (MSS) membranes: Characterisation and permeation of single-step and two-step sol–gel membranes. J. Membr. Sci. 2002, 198, 9–21. [Google Scholar] [CrossRef]
  28. Gopalakrishnan, S.; Diniz da Costa, J.C. Hydrogen gas mixture separation by CVD silica membrane. J. Membr. Sci. 2008, 323, 144–147. [Google Scholar] [CrossRef]
  29. Gopalakrishnan, S.; Yoshino, Y.; Nomura, M.; Nair, B.N.; Nakao, S.-I. A hybrid processing method for high performance hydrogen-selective silica membranes. J. Membr. Sci. 2007, 297, 5–9. [Google Scholar] [CrossRef]
  30. Zivkovic, T. Thin Supported Silica Membranes; The University Twente: Enschede, The Netherlands, 2007. [Google Scholar]
  31. Ha, H.Y.; Nam, S.W.; Lee, W.K. Chemical vapor deposition of hydrogen-permselective silica films on porous glass supports from tetraethylorthosilicate. J. Membr. Sci. 1993, 85, 279–290. [Google Scholar]
  32. Ghasemzadeh, K.; Aghaeinejad-Meybodi, A.; Vaezi, M.J.; Gholizadeh, A.; Abdi, M.A.; Babaluo, A.A.; Haghighi, M.; Basile, A. Hydrogen production via silica membrane reactor during the methanol steam reforming process: Experimental study. RSC Adv. 2015, 5, 95823–95832. [Google Scholar] [CrossRef]
  33. Kanezashi, M.; Sasaki, T.; Tawarayama, H.; Nagasawa, H.; Yoshioka, T.; Ito, K.; Tsuru, T. Experimental and Theoretical Study on Small Gas Permeation Properties through Amorphous Silica Membranes Fabricated at Different Temperatures. J. Phys. Chem. C 2014, 118, 20323–20331. [Google Scholar] [CrossRef]
  34. Kanezashi, M.; Sasaki, T.; Tawarayama, H.; Yoshioka, T.; Tsuru, T. Hydrogen Permeation Properties and Hydrothermal Stability of Sol–Gel-Derived Amorphous Silica Membranes Fabricated at High Temperatures. J. Am. Ceram. Soc. 2013, 96, 2950–2957. [Google Scholar] [CrossRef]
  35. Yoshioka, T.; Nakanishi, E.; Tsuru, T.; Asaeda, M. Experimental studies of gas permeation through microporous silica membranes. AlChE J. 2001, 47, 2052–2063. [Google Scholar] [CrossRef]
  36. De Vos, R.M.; Maier, W.F.; Verweij, H. Hydrophobic silica membranes for gas separation. J. Membr. Sci. 1999, 158, 277–288. [Google Scholar] [CrossRef]
  37. Krishna, R.; Baur, R. Modelling issues in zeolite based separation processes. Sep. Purif. Technol. 2003, 33, 213–254. [Google Scholar] [CrossRef]
  38. Van den Bergh, J.; Ban, S.; Vlugt, T.J.H.; Kapteijn, F. Modeling the Loading Dependency of Diffusion in Zeolites: The Relevant Site Model Extended to Mixtures in DDR-Type Zeolite. J. Phys. Chem. C 2009, 113, 21856–21865. [Google Scholar] [CrossRef]
  39. Ji, G.; Wang, G.; Hooman, K.; Bhatia, S.; Diniz da Costa, J.C. Simulation of binary gas separation through multi-tube molecular sieving membranes at high temperatures. Chem. Eng. J. 2013, 218, 394–404. [Google Scholar] [CrossRef]
  40. Burggraaf, A.J. Single gas permeation of thin zeolite (MFI) membranes: Theory and analysis of experimental observations. J. Membr. Sci. 1999, 155, 45–65. [Google Scholar] [CrossRef]
  41. Krishna, R. A unified approach to the modelling of intraparticle diffusion in adsorption processes. Gas Sep. Purif. 1993, 7, 91–104. [Google Scholar] [CrossRef]
  42. Krishna, R.; Van Baten, J.M. A simplified procedure for estimation of mixture permeances from unary permeation data. J. Membr. Sci. 2011, 367, 204–210. [Google Scholar] [CrossRef]
  43. Thornton, A.W.; Hilder, T.; Hill, A.J.; Hill, J.M. Predicting gas diffusion regime within pores of different size, shape and composition. J. Membr. Sci. 2009, 336, 101–108. [Google Scholar] [CrossRef]
  44. Bonilla, M.R.; Bhatia, S.K. The low-density diffusion coefficient of soft-sphere fluids in nanopores: Accurate correlations from exact theory and criteria for applicability of the Knudsen model. J. Membr. Sci. 2011, 382, 339–349. [Google Scholar] [CrossRef]
  45. Bhatia, S.K. Tractable molecular theory of transport of Lennard-Jones fluids in nanopores. J. Chem. Phys. 2004, 120, 4472–4485. [Google Scholar] [CrossRef] [PubMed]
  46. Tomozawa, M. Chapter 3—Amorphous silica. In Silicon-Based Material and Devices; Nalwa, H.S., Ed.; Academic Press: Burlington, NJ, USA, 2001; pp. 127–154. [Google Scholar]
  47. Lang, N.R.; Münster, S.; Metzner, C.; Krauss, P.; Schürmann, S.; Lange, J.; Aifantis, K.E.; Friedrich, O.; Fabry, B. Estimating the 3D Pore Size Distribution of Biopolymer Networks from Directionally Biased Data. Biophys. J. 2013, 105, 1967–1975. [Google Scholar] [CrossRef] [PubMed]
  48. Metzner, C.; Krauss, P.; Fabry, B. Poresizes in random line networks. arXiv 2011, arXiv:1110.1803v1. [Google Scholar]
  49. Phirani, J.; Pitchumani, R.; Mohanty, K.K. Transport Properties of Hydrate Bearing Formations from Pore-Scale Modeling. In Proceedings of the SPE Annual Technical Conference and Exhibition, New Orleans, LA, USA, 4–7 October 2009. [Google Scholar]
  50. Panfilov, M.; Panfilova, I.; Stepanyants, Y. Mechanisms of Particle Transport Acceleration in Porous Media. Transp. Porous Media 2008, 74, 49–71. [Google Scholar] [CrossRef] [Green Version]
  51. Park, C.-Y.; Ihm, S.-K. New hypotheses for Mercury porosimetry with percolation approach. AlChE J. 1990, 36, 1641–1648. [Google Scholar] [CrossRef]
  52. Mishra, B.K.; Sharma, M.M. Measurement of pore size distributions from capillary pressure curves. AlChE J. 1988, 34, 684–687. [Google Scholar] [CrossRef]
  53. Bhatia, S.K. Modeling Pure Gas Permeation in Nanoporous Materials and Membranes. Langmuir 2010, 26, 8373–8385. [Google Scholar] [CrossRef] [PubMed]
  54. Jepps, O.G.; Bhatia, S.K.; Searles, D.J. Wall Mediated Transport in Confined Spaces: Exact Theory for Low Density. Phys. Rev. Lett. 2003, 91, 126102. [Google Scholar] [CrossRef] [PubMed]
  55. Zhang, L.; Seaton, N.A. Prediction of the effective diffusivity in pore networks close to a percolation threshold. AlChE J. 1992, 38, 1816–1824. [Google Scholar] [CrossRef]
  56. Burganos, V.N.; Sotirchos, S.V. Diffusion in pore networks: Effective medium theory and smooth field approximation. AlChE J. 1987, 33, 1678–1689. [Google Scholar] [CrossRef]
  57. Kirkpatrick, S. Percolation and Conduction. Rev. Mod. Phys. 1973, 45, 574–588. [Google Scholar] [CrossRef]
  58. Landauer, R. The Electrical Resistance of Binary Metallic Mixtures. J. Appl. Phys. 1952, 23, 779–784. [Google Scholar] [CrossRef]
  59. Bhatia, S.K. Directional autocorrelation and the diffusional tortuosity of capillary porous media. J. Catal. 1985, 93, 192–196. [Google Scholar] [CrossRef]
  60. Bhatia, S.K. Stochastic theory of transport in inhomogeneous media. Chem. Eng. Sci. 1986, 41, 1311–1324. [Google Scholar] [CrossRef]
  61. Ji, G.; Smart, S.; Bhatia, S.K.; Diniz da Costa, J.C. Improved pore connectivity by the reduction of cobalt oxide silica membranes. Sep. Purif. Technol. 2015, 154, 338–344. [Google Scholar] [CrossRef] [Green Version]
  62. Bakker, W.J.W.; Kapteijn, F.; Poppe, J.; Moulijn, J.A. Permeation characteristics of a metal-supported silicalite-1 zeolite membrane. J. Membr. Sci. 1996, 117, 57–78. [Google Scholar] [CrossRef]
  63. Kapteijn, F.; Bakker, W.J.W.; Van de Graaf, J.; Zheng, G.; Poppe, J.; Moulijn, J.A. Permeation and separation behaviour of a silicalite-1 membrane. Catal. Today 1995, 25, 213–218. [Google Scholar] [CrossRef]
  64. Smart, S.; Vente, J.F.; Diniz da Costa, J.C. High temperature H2/CO2 separation using cobalt oxide silica membranes. Int. J. Hydrog. Energy 2012, 37, 12700–12707. [Google Scholar] [CrossRef]
  65. Bhatia, S.K.; Nicholson, D. Some pitfalls in the use of the Knudsen equation in modelling diffusion in nanoporous materials. Chem. Eng. Sci. 2011, 66, 284–293. [Google Scholar] [CrossRef]
  66. Gao, X.; Diniz da Costa, J.C.; Bhatia, S.K. Adsorption and transport of gases in a supported microporous silica membrane. J. Membr. Sci. 2014, 460, 46–61. [Google Scholar] [CrossRef]
  67. Yacou, C.; Smart, S.; Diniz da Costa, J.C. Long term performance cobalt oxide silica membrane module for high temperature H2 separation. Energy. Environ. Sci. 2012, 5, 5820–5832. [Google Scholar] [CrossRef]
  68. Ji, G.; Wang, G.; Hooman, K.; Bhatia, S.; Diniz da Costa, J.C. The fluid dynamic effect on the driving force for a cobalt oxide silica membrane module at high temperatures. Chem. Eng. Sci. 2014, 111, 142–152. [Google Scholar] [CrossRef]
  69. Miller, C.R.; Wang, D.K.; Smart, S.; Diniz da Costa, J.C. Reversible Redox Effect on Gas Permeation of Cobalt Doped Ethoxy Polysiloxane (ES40) Membranes. Sci. Rep. 2013, 3, 1–6. [Google Scholar] [CrossRef] [PubMed]
  70. Xiao, J.; Wei, J. Diffusion mechanism of hydrocarbons in zeolites—I. Theory. Chem. Eng. Sci. 1992, 47, 1123–1141. [Google Scholar] [CrossRef]
  71. Xiao, J.; Wei, J. Diffusion mechanism of hydrocarbons in zeolites—II. Analysis of experimental observations. Chem. Eng. Sci. 1992, 47, 1143–1159. [Google Scholar] [CrossRef]
  72. Hacarlioglu, P.; Lee, D.; Gibbs, G.V.; Oyama, S.T. Activation energies for permeation of He and H2 through silica membranes: An ab initio calculation study. J. Membr. Sci. 2008, 313, 277–283. [Google Scholar] [CrossRef]
Figure 1. The pore of the silica membrane.
Processes 06 00239 g001
Figure 2. Geometrical simplification of a hydrogen molecule in a cylindrical pore.
Processes 06 00239 g002
Figure 3. Hydrogen potential distribution inside cylindrical silica pores with different pore sizes.
Processes 06 00239 g003
Figure 4. The minimum potential with respect to pore size, for different gases.
Processes 06 00239 g004
Figure 5. Diagram of the permeation/separation experimental set up.
Processes 06 00239 g005
Figure 6. He and H2 permeances through cobalt oxide silica coated substrate and uncoated substrate as a function of temperature.
Processes 06 00239 g006
Figure 7. He permeation performance of cobalt oxide silica membrane.
Processes 06 00239 g007
Figure 8. The permeation performance of H2.
Processes 06 00239 g008
Figure 9. Screening of (ro,rm) to detect minimum deviation to the experimental activation energy.
Processes 06 00239 g009
Figure 10. Calculated pore size distribution of silica membrane in oxidized state and reduced state.
Processes 06 00239 g010
Figure 11. Comparison of permeability obtained from calculation and experiment.
Processes 06 00239 g011
Table 1. Apparent activation energies of gas permeation across silica based membranes.
Apparent Activation Energy (kJ·mol−1)Reference
H2HeCO2N2Ar
16.4~17.116.2~17.1---[27]
2.22.8−9.8−5.4-[28]
15.4~19.4--8.5~11.9-[29]
12.820.7−20--[24]
-9.5-−5.0-[11]
-13.6---[30]
6----[31]
4.914.70−2.91−1.41-[14]
10.1-−3.1-−1.9[32]
14.17.7-12.3-[33]
~97.2---[34]

